(metastatic tumor cohort)
This pipeline uses various statistical tests to identify mRNAs whose expression levels correlated to selected clinical features.
Testing the association between 18092 genes and 6 clinical features across 151 samples, statistically thresholded by Q value < 0.05, 4 clinical features related to at least one genes.
-
3 genes correlated to 'AGE'.
-
ACOX2|8309 , GOLM1|51280 , MCHR1|2847
-
18 genes correlated to 'GENDER'.
-
ZFY|7544 , PRKY|5616 , XIST|7503 , RPS4Y1|6192 , DDX3Y|8653 , ...
-
5 genes correlated to 'DISTANT.METASTASIS'.
-
USP9X|8239 , CLDN6|9074 , CXADRP3|440224 , PAX3|5077 , PRPS1|5631
-
6 genes correlated to 'LYMPH.NODE.METASTASIS'.
-
IHH|3549 , AMY1A|276 , NXNL2|158046 , GPR22|2845 , MUC6|4588 , ...
-
No genes correlated to 'Time to Death', and 'NEOPLASM.DISEASESTAGE'.
Complete statistical result table is provided in Supplement Table 1
Table 1. Get Full Table This table shows the clinical features, statistical methods used, and the number of genes that are significantly associated with each clinical feature at Q value < 0.05.
| Clinical feature | Statistical test | Significant genes | Associated with | Associated with | ||
|---|---|---|---|---|---|---|
| Time to Death | Cox regression test | N=0 | ||||
| AGE | Spearman correlation test | N=3 | older | N=0 | younger | N=3 |
| GENDER | t test | N=18 | male | N=14 | female | N=4 |
| DISTANT METASTASIS | ANOVA test | N=5 | ||||
| LYMPH NODE METASTASIS | ANOVA test | N=6 | ||||
| NEOPLASM DISEASESTAGE | ANOVA test | N=0 |
Table S1. Basic characteristics of clinical feature: 'Time to Death'
| Time to Death | Duration (Months) | 0.2-346 (median=47.5) |
| censored | N = 75 | |
| death | N = 72 | |
| Significant markers | N = 0 |
Table S2. Basic characteristics of clinical feature: 'AGE'
| AGE | Mean (SD) | 55.95 (16) |
| Significant markers | N = 3 | |
| pos. correlated | 0 | |
| neg. correlated | 3 |
Table S3. Get Full Table List of 3 genes significantly correlated to 'AGE' by Spearman correlation test
| SpearmanCorr | corrP | Q | |
|---|---|---|---|
| ACOX2|8309 | -0.4511 | 7.74e-09 | 0.00014 |
| GOLM1|51280 | -0.3908 | 8.351e-07 | 0.0151 |
| MCHR1|2847 | -0.3836 | 1.489e-06 | 0.0269 |
Figure S1. Get High-res Image As an example, this figure shows the association of ACOX2|8309 to 'AGE'. P value = 7.74e-09 with Spearman correlation analysis. The straight line presents the best linear regression.
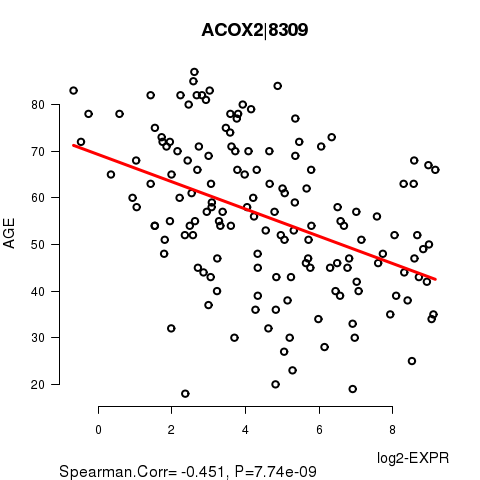
Table S4. Basic characteristics of clinical feature: 'GENDER'
| GENDER | Labels | N |
| FEMALE | 58 | |
| MALE | 93 | |
| Significant markers | N = 18 | |
| Higher in MALE | 14 | |
| Higher in FEMALE | 4 |
Table S5. Get Full Table List of top 10 genes differentially expressed by 'GENDER'
| T(pos if higher in 'MALE') | ttestP | Q | AUC | |
|---|---|---|---|---|
| ZFY|7544 | 30.36 | 2.108e-61 | 3.81e-57 | 0.9978 |
| PRKY|5616 | 26.18 | 4.331e-50 | 7.83e-46 | 0.9989 |
| XIST|7503 | -20.75 | 2.17e-43 | 3.92e-39 | 0.978 |
| RPS4Y1|6192 | 27.79 | 1.205e-40 | 2.18e-36 | 1 |
| DDX3Y|8653 | 29.48 | 1.31e-34 | 2.37e-30 | 1 |
| CYORF15B|84663 | 30.98 | 4.062e-34 | 7.34e-30 | 1 |
| KDM5D|8284 | 30.13 | 2.492e-33 | 4.51e-29 | 1 |
| TSIX|9383 | -14.75 | 1.093e-27 | 1.98e-23 | 0.9737 |
| EIF1AY|9086 | 28.46 | 4.305e-27 | 7.78e-23 | 1 |
| TTTY15|64595 | 22.13 | 7.233e-24 | 1.31e-19 | 0.9973 |
Figure S2. Get High-res Image As an example, this figure shows the association of ZFY|7544 to 'GENDER'. P value = 2.11e-61 with T-test analysis.
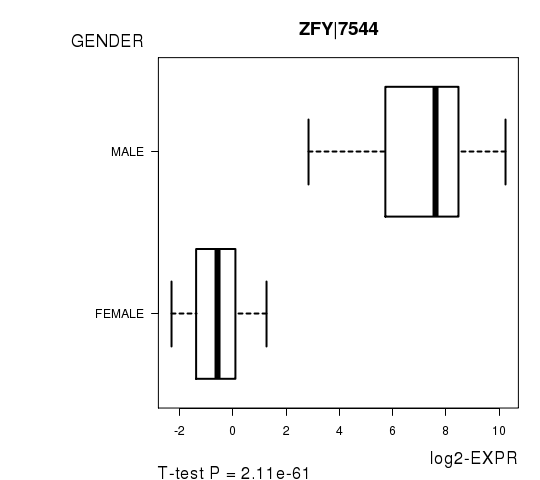
Table S6. Basic characteristics of clinical feature: 'DISTANT.METASTASIS'
| DISTANT.METASTASIS | Labels | N |
| M0 | 127 | |
| M1 | 2 | |
| M1A | 2 | |
| M1B | 1 | |
| M1C | 2 | |
| Significant markers | N = 5 |
Table S7. Get Full Table List of 5 genes differentially expressed by 'DISTANT.METASTASIS'
| ANOVA_P | Q | |
|---|---|---|
| USP9X|8239 | 5.464e-10 | 9.87e-06 |
| CLDN6|9074 | 1.345e-09 | 2.43e-05 |
| CXADRP3|440224 | 7.225e-08 | 0.00131 |
| PAX3|5077 | 1.062e-07 | 0.00192 |
| PRPS1|5631 | 2.129e-06 | 0.0385 |
Figure S3. Get High-res Image As an example, this figure shows the association of USP9X|8239 to 'DISTANT.METASTASIS'. P value = 5.46e-10 with ANOVA analysis.

Table S8. Basic characteristics of clinical feature: 'LYMPH.NODE.METASTASIS'
| LYMPH.NODE.METASTASIS | Labels | N |
| N0 | 84 | |
| N1 | 2 | |
| N1A | 6 | |
| N1B | 12 | |
| N2 | 1 | |
| N2A | 3 | |
| N2B | 9 | |
| N2C | 5 | |
| N3 | 11 | |
| NX | 2 | |
| Significant markers | N = 6 |
Table S9. Get Full Table List of 6 genes differentially expressed by 'LYMPH.NODE.METASTASIS'
| ANOVA_P | Q | |
|---|---|---|
| IHH|3549 | 1.032e-10 | 1.87e-06 |
| AMY1A|276 | 4.678e-07 | 0.00846 |
| NXNL2|158046 | 5.855e-07 | 0.0106 |
| GPR22|2845 | 1.03e-06 | 0.0186 |
| MUC6|4588 | 1.709e-06 | 0.0309 |
| NPAS4|266743 | 1.778e-06 | 0.0321 |
Figure S4. Get High-res Image As an example, this figure shows the association of IHH|3549 to 'LYMPH.NODE.METASTASIS'. P value = 1.03e-10 with ANOVA analysis.
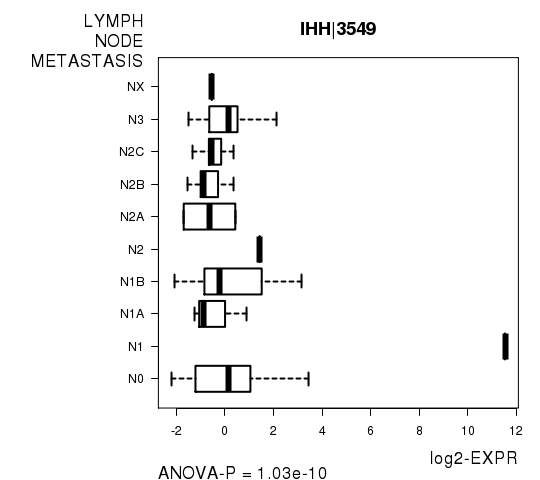
Table S10. Basic characteristics of clinical feature: 'NEOPLASM.DISEASESTAGE'
| NEOPLASM.DISEASESTAGE | Labels | N |
| STAGE I | 17 | |
| STAGE IA | 9 | |
| STAGE IB | 13 | |
| STAGE II | 18 | |
| STAGE IIA | 7 | |
| STAGE IIB | 8 | |
| STAGE IIC | 7 | |
| STAGE III | 7 | |
| STAGE IIIA | 5 | |
| STAGE IIIB | 15 | |
| STAGE IIIC | 17 | |
| STAGE IV | 5 | |
| Significant markers | N = 0 |
-
Expresson data file = SKCM-TM.uncv2.mRNAseq_RSEM_normalized_log2.txt
-
Clinical data file = SKCM-TM.clin.merged.picked.txt
-
Number of patients = 151
-
Number of genes = 18092
-
Number of clinical features = 6
For survival clinical features, Wald's test in univariate Cox regression analysis with proportional hazards model (Andersen and Gill 1982) was used to estimate the P values using the 'coxph' function in R. Kaplan-Meier survival curves were plot using the four quartile subgroups of patients based on expression levels
For continuous numerical clinical features, Spearman's rank correlation coefficients (Spearman 1904) and two-tailed P values were estimated using 'cor.test' function in R
For two-class clinical features, two-tailed Student's t test with unequal variance (Lehmann and Romano 2005) was applied to compare the log2-expression levels between the two clinical classes using 't.test' function in R
For multi-class clinical features (ordinal or nominal), one-way analysis of variance (Howell 2002) was applied to compare the log2-expression levels between different clinical classes using 'anova' function in R
For multiple hypothesis correction, Q value is the False Discovery Rate (FDR) analogue of the P value (Benjamini and Hochberg 1995), defined as the minimum FDR at which the test may be called significant. We used the 'Benjamini and Hochberg' method of 'p.adjust' function in R to convert P values into Q values.
This is an experimental feature. The full results of the analysis summarized in this report can be downloaded from the TCGA Data Coordination Center.