This pipeline uses various statistical tests to identify mRNAs whose expression levels correlated to selected clinical features.
Testing the association between 17814 genes and 5 clinical features across 54 samples, statistically thresholded by Q value < 0.05, 2 clinical features related to at least one genes.
-
144 genes correlated to 'HISTOLOGICAL.TYPE'.
-
KLHL34 , OR4S2 , C19ORF12 , TSP50 , KIAA1324 , ...
-
29 genes correlated to 'COMPLETENESS.OF.RESECTION'.
-
RHOXF1 , GALNTL5 , AGTR1 , LBP , ANKS1A , ...
-
No genes correlated to 'Time to Death', 'AGE', and 'RADIATIONS.RADIATION.REGIMENINDICATION'.
Complete statistical result table is provided in Supplement Table 1
Table 1. Get Full Table This table shows the clinical features, statistical methods used, and the number of genes that are significantly associated with each clinical feature at Q value < 0.05.
| Clinical feature | Statistical test | Significant genes | Associated with | Associated with | ||
|---|---|---|---|---|---|---|
| Time to Death | Cox regression test | N=0 | ||||
| AGE | Spearman correlation test | N=0 | ||||
| HISTOLOGICAL TYPE | ANOVA test | N=144 | ||||
| RADIATIONS RADIATION REGIMENINDICATION | t test | N=0 | ||||
| COMPLETENESS OF RESECTION | ANOVA test | N=29 |
Table S1. Basic characteristics of clinical feature: 'Time to Death'
| Time to Death | Duration (Months) | 6-133.2 (median=35.4) |
| censored | N = 47 | |
| death | N = 7 | |
| Significant markers | N = 0 |
Table S2. Basic characteristics of clinical feature: 'AGE'
| AGE | Mean (SD) | 62.94 (12) |
| Significant markers | N = 0 |
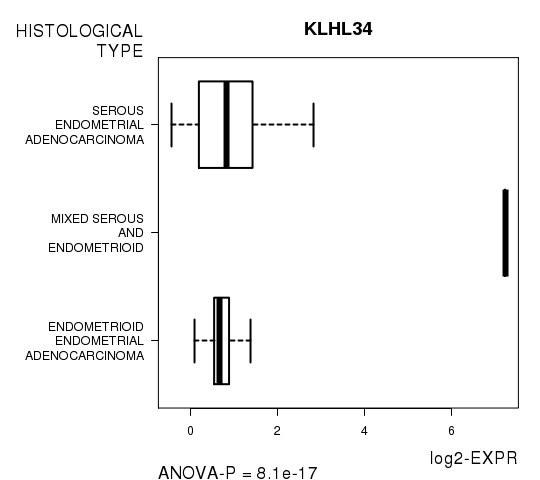
Table S3. Basic characteristics of clinical feature: 'HISTOLOGICAL.TYPE'
| HISTOLOGICAL.TYPE | Labels | N |
| ENDOMETRIOID ENDOMETRIAL ADENOCARCINOMA | 41 | |
| MIXED SEROUS AND ENDOMETRIOID | 1 | |
| SEROUS ENDOMETRIAL ADENOCARCINOMA | 12 | |
| Significant markers | N = 144 |
Table S4. Get Full Table List of top 10 genes differentially expressed by 'HISTOLOGICAL.TYPE'
| ANOVA_P | Q | |
|---|---|---|
| KLHL34 | 8.095e-17 | 1.44e-12 |
| OR4S2 | 1.38e-14 | 2.46e-10 |
| C19ORF12 | 3.022e-14 | 5.38e-10 |
| TSP50 | 2.904e-13 | 5.17e-09 |
| KIAA1324 | 2.954e-13 | 5.26e-09 |
| PNOC | 9.543e-13 | 1.7e-08 |
| FOXA2 | 1.393e-12 | 2.48e-08 |
| CDH6 | 2.506e-12 | 4.46e-08 |
| CLDN6 | 2.018e-11 | 3.59e-07 |
| ANXA10 | 8.888e-11 | 1.58e-06 |
Figure S1. Get High-res Image As an example, this figure shows the association of KLHL34 to 'HISTOLOGICAL.TYPE'. P value = 8.1e-17 with ANOVA analysis.
No gene related to 'RADIATIONS.RADIATION.REGIMENINDICATION'.
Table S5. Basic characteristics of clinical feature: 'RADIATIONS.RADIATION.REGIMENINDICATION'
| RADIATIONS.RADIATION.REGIMENINDICATION | Labels | N |
| NO | 25 | |
| YES | 29 | |
| Significant markers | N = 0 |
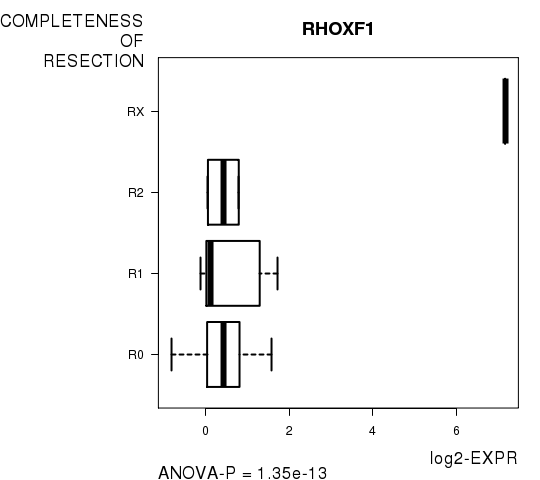
Table S6. Basic characteristics of clinical feature: 'COMPLETENESS.OF.RESECTION'
| COMPLETENESS.OF.RESECTION | Labels | N |
| R0 | 39 | |
| R1 | 6 | |
| R2 | 2 | |
| RX | 1 | |
| Significant markers | N = 29 |
Table S7. Get Full Table List of top 10 genes differentially expressed by 'COMPLETENESS.OF.RESECTION'
| ANOVA_P | Q | |
|---|---|---|
| RHOXF1 | 1.352e-13 | 2.41e-09 |
| GALNTL5 | 3.481e-10 | 6.2e-06 |
| AGTR1 | 9.628e-10 | 1.71e-05 |
| LBP | 1.947e-09 | 3.47e-05 |
| ANKS1A | 6.188e-09 | 0.00011 |
| C12ORF59 | 8.975e-09 | 0.00016 |
| ABHD9 | 2.991e-08 | 0.000533 |
| LANCL2 | 3.861e-08 | 0.000688 |
| SSX7 | 4.419e-08 | 0.000787 |
| KCNV1 | 4.506e-08 | 0.000802 |
Figure S2. Get High-res Image As an example, this figure shows the association of RHOXF1 to 'COMPLETENESS.OF.RESECTION'. P value = 1.35e-13 with ANOVA analysis.
-
Expresson data file = UCEC-TP.medianexp.txt
-
Clinical data file = UCEC-TP.clin.merged.picked.txt
-
Number of patients = 54
-
Number of genes = 17814
-
Number of clinical features = 5
For survival clinical features, Wald's test in univariate Cox regression analysis with proportional hazards model (Andersen and Gill 1982) was used to estimate the P values using the 'coxph' function in R. Kaplan-Meier survival curves were plot using the four quartile subgroups of patients based on expression levels
For continuous numerical clinical features, Spearman's rank correlation coefficients (Spearman 1904) and two-tailed P values were estimated using 'cor.test' function in R
For multi-class clinical features (ordinal or nominal), one-way analysis of variance (Howell 2002) was applied to compare the log2-expression levels between different clinical classes using 'anova' function in R
For two-class clinical features, two-tailed Student's t test with unequal variance (Lehmann and Romano 2005) was applied to compare the log2-expression levels between the two clinical classes using 't.test' function in R
For multiple hypothesis correction, Q value is the False Discovery Rate (FDR) analogue of the P value (Benjamini and Hochberg 1995), defined as the minimum FDR at which the test may be called significant. We used the 'Benjamini and Hochberg' method of 'p.adjust' function in R to convert P values into Q values.
This is an experimental feature. The full results of the analysis summarized in this report can be downloaded from the TCGA Data Coordination Center.