This pipeline uses various statistical tests to identify genes whose promoter methylation levels correlated to selected clinical features.
Testing the association between 20139 genes and 9 clinical features across 306 samples, statistically thresholded by Q value < 0.05, 8 clinical features related to at least one genes.
-
1 gene correlated to 'Time to Death'.
-
ZNF266
-
4 genes correlated to 'AGE'.
-
SLC35D3 , XKR6 , C12ORF23 , HAND1
-
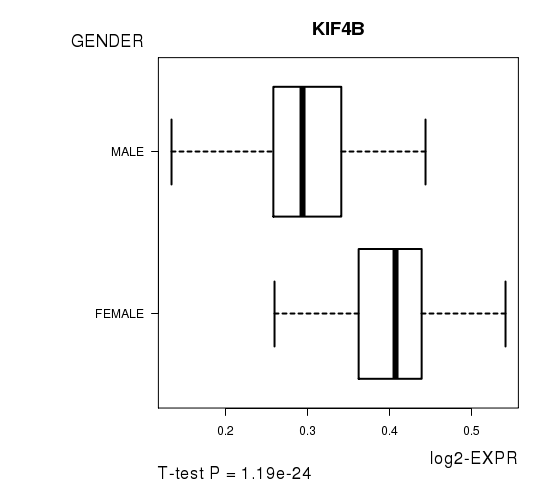
8 genes correlated to 'GENDER'.
-
KIF4B , FRG1B , C17ORF70 , NLRP2 , RPA1 , ...
-
13 genes correlated to 'RADIATIONS.RADIATION.REGIMENINDICATION'.
-
FLII , CKS2 , QRSL1 , RTN4IP1 , SNRNP40 , ...
-
5 genes correlated to 'NUMBERPACKYEARSSMOKED'.
-
MMADHC , C2ORF77__1 , KLHL23__2 , PHOSPHO2__1 , RAB21
-
96 genes correlated to 'LYMPH.NODE.METASTASIS'.
-
C19ORF60 , NR4A2 , UFM1 , C2CD3__1 , PPME1__1 , ...
-
2 genes correlated to 'NUMBER.OF.LYMPH.NODES'.
-
SLC47A2 , THSD4
-
55 genes correlated to 'NEOPLASM.DISEASESTAGE'.
-
FLJ40852__1 , WEE2 , UFM1 , C2CD3__1 , PPME1__1 , ...
-
No genes correlated to 'YEAROFTOBACCOSMOKINGONSET'
Complete statistical result table is provided in Supplement Table 1
Table 1. Get Full Table This table shows the clinical features, statistical methods used, and the number of genes that are significantly associated with each clinical feature at Q value < 0.05.
| Clinical feature | Statistical test | Significant genes | Associated with | Associated with | ||
|---|---|---|---|---|---|---|
| Time to Death | Cox regression test | N=1 | shorter survival | N=1 | longer survival | N=0 |
| AGE | Spearman correlation test | N=4 | older | N=4 | younger | N=0 |
| GENDER | t test | N=8 | male | N=2 | female | N=6 |
| RADIATIONS RADIATION REGIMENINDICATION | t test | N=13 | yes | N=2 | no | N=11 |
| NUMBERPACKYEARSSMOKED | Spearman correlation test | N=5 | higher numberpackyearssmoked | N=0 | lower numberpackyearssmoked | N=5 |
| YEAROFTOBACCOSMOKINGONSET | Spearman correlation test | N=0 | ||||
| LYMPH NODE METASTASIS | ANOVA test | N=96 | ||||
| NUMBER OF LYMPH NODES | Spearman correlation test | N=2 | higher number.of.lymph.nodes | N=2 | lower number.of.lymph.nodes | N=0 |
| NEOPLASM DISEASESTAGE | ANOVA test | N=55 |
Table S1. Basic characteristics of clinical feature: 'Time to Death'
| Time to Death | Duration (Months) | 0.1-210.9 (median=14.8) |
| censored | N = 185 | |
| death | N = 118 | |
| Significant markers | N = 1 | |
| associated with shorter survival | 1 | |
| associated with longer survival | 0 |
Table S2. Get Full Table List of one gene significantly associated with 'Time to Death' by Cox regression test
| HazardRatio | Wald_P | Q | C_index | |
|---|---|---|---|---|
| ZNF266 | 9001 | 1.313e-07 | 0.0026 | 0.611 |
Figure S1. Get High-res Image As an example, this figure shows the association of ZNF266 to 'Time to Death'. four curves present the cumulative survival rates of 4 quartile subsets of patients. P value = 1.31e-07 with univariate Cox regression analysis using continuous log-2 expression values.

Table S3. Basic characteristics of clinical feature: 'AGE'
| AGE | Mean (SD) | 61.16 (12) |
| Significant markers | N = 4 | |
| pos. correlated | 4 | |
| neg. correlated | 0 |
Table S4. Get Full Table List of 4 genes significantly correlated to 'AGE' by Spearman correlation test
| SpearmanCorr | corrP | Q | |
|---|---|---|---|
| SLC35D3 | 0.2949 | 1.489e-07 | 0.003 |
| XKR6 | 0.2841 | 4.331e-07 | 0.00872 |
| C12ORF23 | 0.271 | 1.501e-06 | 0.0302 |
| HAND1 | 0.2686 | 1.863e-06 | 0.0375 |
Figure S2. Get High-res Image As an example, this figure shows the association of SLC35D3 to 'AGE'. P value = 1.49e-07 with Spearman correlation analysis. The straight line presents the best linear regression.
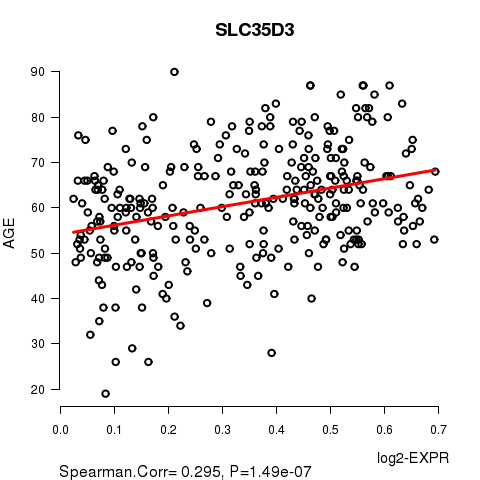
Table S5. Basic characteristics of clinical feature: 'GENDER'
| GENDER | Labels | N |
| FEMALE | 85 | |
| MALE | 221 | |
| Significant markers | N = 8 | |
| Higher in MALE | 2 | |
| Higher in FEMALE | 6 |
Table S6. Get Full Table List of 8 genes differentially expressed by 'GENDER'
| T(pos if higher in 'MALE') | ttestP | Q | AUC | |
|---|---|---|---|---|
| KIF4B | -12.39 | 1.189e-24 | 2.39e-20 | 0.8686 |
| FRG1B | -6.53 | 1.531e-09 | 3.08e-05 | 0.7352 |
| C17ORF70 | -5.5 | 9.359e-08 | 0.00188 | 0.6581 |
| NLRP2 | 5.31 | 3.84e-07 | 0.00773 | 0.6949 |
| RPA1 | -5.04 | 8.201e-07 | 0.0165 | 0.5742 |
| BRCA1__1 | -5.03 | 1.453e-06 | 0.0293 | 0.6859 |
| NBR2__1 | -5.03 | 1.453e-06 | 0.0293 | 0.6859 |
| SLC22A3 | 4.91 | 1.494e-06 | 0.0301 | 0.5732 |
Figure S3. Get High-res Image As an example, this figure shows the association of KIF4B to 'GENDER'. P value = 1.19e-24 with T-test analysis.
13 genes related to 'RADIATIONS.RADIATION.REGIMENINDICATION'.
Table S7. Basic characteristics of clinical feature: 'RADIATIONS.RADIATION.REGIMENINDICATION'
| RADIATIONS.RADIATION.REGIMENINDICATION | Labels | N |
| NO | 79 | |
| YES | 227 | |
| Significant markers | N = 13 | |
| Higher in YES | 2 | |
| Higher in NO | 11 |
Table S8. Get Full Table List of top 10 genes differentially expressed by 'RADIATIONS.RADIATION.REGIMENINDICATION'
| T(pos if higher in 'YES') | ttestP | Q | AUC | |
|---|---|---|---|---|
| FLII | 6.05 | 6.185e-09 | 0.000125 | 0.6935 |
| CKS2 | -5.6 | 1.16e-07 | 0.00234 | 0.7077 |
| QRSL1 | -5.47 | 1.936e-07 | 0.0039 | 0.6873 |
| RTN4IP1 | -5.47 | 1.936e-07 | 0.0039 | 0.6873 |
| SNRNP40 | -5.42 | 2.88e-07 | 0.0058 | 0.6969 |
| ZCCHC17 | -5.42 | 2.88e-07 | 0.0058 | 0.6969 |
| LSM12 | -5.39 | 3.869e-07 | 0.00779 | 0.6954 |
| RPL7L1 | -5.23 | 5.575e-07 | 0.0112 | 0.6828 |
| MIR632 | -5.2 | 7.475e-07 | 0.015 | 0.6906 |
| ZNF207 | -5.2 | 7.475e-07 | 0.015 | 0.6906 |
Figure S4. Get High-res Image As an example, this figure shows the association of FLII to 'RADIATIONS.RADIATION.REGIMENINDICATION'. P value = 6.18e-09 with T-test analysis.

Table S9. Basic characteristics of clinical feature: 'NUMBERPACKYEARSSMOKED'
| NUMBERPACKYEARSSMOKED | Mean (SD) | 49.6 (37) |
| Significant markers | N = 5 | |
| pos. correlated | 0 | |
| neg. correlated | 5 |
Table S10. Get Full Table List of 5 genes significantly correlated to 'NUMBERPACKYEARSSMOKED' by Spearman correlation test
| SpearmanCorr | corrP | Q | |
|---|---|---|---|
| MMADHC | -0.3684 | 9.646e-07 | 0.0194 |
| C2ORF77__1 | -0.3653 | 1.212e-06 | 0.0244 |
| KLHL23__2 | -0.3653 | 1.212e-06 | 0.0244 |
| PHOSPHO2__1 | -0.3653 | 1.212e-06 | 0.0244 |
| RAB21 | -0.3641 | 1.318e-06 | 0.0265 |
Figure S5. Get High-res Image As an example, this figure shows the association of MMADHC to 'NUMBERPACKYEARSSMOKED'. P value = 9.65e-07 with Spearman correlation analysis. The straight line presents the best linear regression.

Table S11. Basic characteristics of clinical feature: 'YEAROFTOBACCOSMOKINGONSET'
| YEAROFTOBACCOSMOKINGONSET | Mean (SD) | 1964.57 (12) |
| Significant markers | N = 0 |
Table S12. Basic characteristics of clinical feature: 'LYMPH.NODE.METASTASIS'
| LYMPH.NODE.METASTASIS | Labels | N |
| N0 | 99 | |
| N1 | 33 | |
| N2 | 6 | |
| N2A | 4 | |
| N2B | 57 | |
| N2C | 32 | |
| N3 | 5 | |
| NX | 60 | |
| Significant markers | N = 96 |
Table S13. Get Full Table List of top 10 genes differentially expressed by 'LYMPH.NODE.METASTASIS'
| ANOVA_P | Q | |
|---|---|---|
| C19ORF60 | 4.446e-12 | 8.95e-08 |
| NR4A2 | 4.787e-12 | 9.64e-08 |
| UFM1 | 1.412e-11 | 2.84e-07 |
| C2CD3__1 | 5.243e-11 | 1.06e-06 |
| PPME1__1 | 5.243e-11 | 1.06e-06 |
| DNAJC10 | 6.57e-11 | 1.32e-06 |
| POLI | 8.015e-11 | 1.61e-06 |
| C11ORF45 | 9.231e-11 | 1.86e-06 |
| KCNJ5 | 9.231e-11 | 1.86e-06 |
| CAB39L__1 | 9.597e-11 | 1.93e-06 |
Figure S6. Get High-res Image As an example, this figure shows the association of C19ORF60 to 'LYMPH.NODE.METASTASIS'. P value = 4.45e-12 with ANOVA analysis.

Table S14. Basic characteristics of clinical feature: 'NUMBER.OF.LYMPH.NODES'
| NUMBER.OF.LYMPH.NODES | Mean (SD) | 2.72 (5.3) |
| Significant markers | N = 2 | |
| pos. correlated | 2 | |
| neg. correlated | 0 |
Table S15. Get Full Table List of 2 genes significantly correlated to 'NUMBER.OF.LYMPH.NODES' by Spearman correlation test
| SpearmanCorr | corrP | Q | |
|---|---|---|---|
| SLC47A2 | 0.32 | 7.977e-07 | 0.0161 |
| THSD4 | 0.3123 | 1.51e-06 | 0.0304 |
Figure S7. Get High-res Image As an example, this figure shows the association of SLC47A2 to 'NUMBER.OF.LYMPH.NODES'. P value = 7.98e-07 with Spearman correlation analysis. The straight line presents the best linear regression.
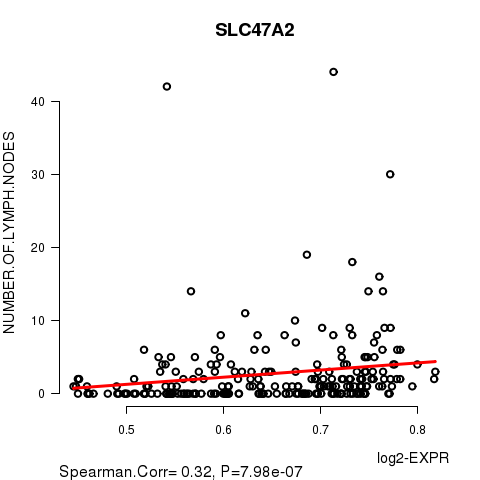
Table S16. Basic characteristics of clinical feature: 'NEOPLASM.DISEASESTAGE'
| NEOPLASM.DISEASESTAGE | Labels | N |
| STAGE I | 17 | |
| STAGE II | 47 | |
| STAGE III | 41 | |
| STAGE IVA | 149 | |
| STAGE IVB | 6 | |
| Significant markers | N = 55 |
Table S17. Get Full Table List of top 10 genes differentially expressed by 'NEOPLASM.DISEASESTAGE'
| ANOVA_P | Q | |
|---|---|---|
| FLJ40852__1 | 2.802e-09 | 5.64e-05 |
| WEE2 | 2.802e-09 | 5.64e-05 |
| UFM1 | 3.089e-09 | 6.22e-05 |
| C2CD3__1 | 4.26e-09 | 8.58e-05 |
| PPME1__1 | 4.26e-09 | 8.58e-05 |
| EIF4A1__1 | 5.502e-09 | 0.000111 |
| C1ORF151 | 6.099e-09 | 0.000123 |
| C11ORF45 | 7.224e-09 | 0.000145 |
| HDLBP | 7.211e-09 | 0.000145 |
| KCNJ5 | 7.224e-09 | 0.000145 |
Figure S8. Get High-res Image As an example, this figure shows the association of FLJ40852__1 to 'NEOPLASM.DISEASESTAGE'. P value = 2.8e-09 with ANOVA analysis.

-
Expresson data file = HNSC-TP.meth.by_min_expr_corr.data.txt
-
Clinical data file = HNSC-TP.clin.merged.picked.txt
-
Number of patients = 306
-
Number of genes = 20139
-
Number of clinical features = 9
For survival clinical features, Wald's test in univariate Cox regression analysis with proportional hazards model (Andersen and Gill 1982) was used to estimate the P values using the 'coxph' function in R. Kaplan-Meier survival curves were plot using the four quartile subgroups of patients based on expression levels
For continuous numerical clinical features, Spearman's rank correlation coefficients (Spearman 1904) and two-tailed P values were estimated using 'cor.test' function in R
For two-class clinical features, two-tailed Student's t test with unequal variance (Lehmann and Romano 2005) was applied to compare the log2-expression levels between the two clinical classes using 't.test' function in R
For multi-class clinical features (ordinal or nominal), one-way analysis of variance (Howell 2002) was applied to compare the log2-expression levels between different clinical classes using 'anova' function in R
For multiple hypothesis correction, Q value is the False Discovery Rate (FDR) analogue of the P value (Benjamini and Hochberg 1995), defined as the minimum FDR at which the test may be called significant. We used the 'Benjamini and Hochberg' method of 'p.adjust' function in R to convert P values into Q values.
This is an experimental feature. The full results of the analysis summarized in this report can be downloaded from the TCGA Data Coordination Center.