This report serves to describe the mutational landscape and properties of a given individual set, as well as rank genes and genesets according to mutational significance. MutSig v1.5 was used to generate the results found in this report.
-
Working with individual set: STAD-TP
-
Number of patients in set: 221
The input for this pipeline is a set of individuals with the following files associated for each:
-
An annotated .maf file describing the mutations called for the respective individual, and their properties.
-
A .wig file that contains information about the coverage of the sample.
-
MAF used for this analysis:STAD-TP.final_analysis_set.maf
-
Significantly mutated genes (q ≤ 0.1): 53
-
Mutations seen in COSMIC: 499
-
Significantly mutated genes in COSMIC territory: 30
-
Genes with clustered mutations (≤ 3 aa apart): 886
-
Significantly mutated genesets: 18
-
Significantly mutated genesets: (excluding sig. mutated genes):0
-
Read 221 MAFs of type "Broad"
-
Total number of mutations in input MAFs: 112521
-
After removing 38 mutations outside chr1-24: 112483
-
After removing 711 blacklisted mutations: 111772
-
After removing 1912 noncoding mutations: 109860
-
Number of mutations before filtering: 109860
-
After removing 1339 mutations outside gene set: 108521
-
After removing 114 mutations outside category set: 108407
-
After removing 3 "impossible" mutations in
-
gene-patient-category bins of zero coverage: 106951
Table 1. Get Full Table Table representing breakdown of mutations by type.
| type | count |
|---|---|
| Frame_Shift_Del | 2296 |
| Frame_Shift_Ins | 488 |
| In_Frame_Del | 202 |
| In_Frame_Ins | 9 |
| Missense_Mutation | 70652 |
| Nonsense_Mutation | 3548 |
| Nonstop_Mutation | 72 |
| Silent | 29387 |
| Splice_Site | 1555 |
| Translation_Start_Site | 198 |
| Total | 108407 |
Table 2. Get Full Table A breakdown of mutation rates per category discovered for this individual set.
| category | n | N | rate | rate_per_mb | relative_rate | exp_ns_s_ratio |
|---|---|---|---|---|---|---|
| *CpG->T | 25171 | 355853720 | 0.000071 | 71 | 5.8 | 2.1 |
| *Np(A/C/T)->transit | 22506 | 5121780072 | 4.4e-06 | 4.4 | 0.36 | 2 |
| *ApG->G | 3506 | 992607213 | 3.5e-06 | 3.5 | 0.29 | 2.1 |
| transver | 19662 | 6470241005 | 3e-06 | 3 | 0.25 | 5 |
| indel+null | 8066 | 6470241005 | 1.2e-06 | 1.2 | 0.1 | NaN |
| double_null | 107 | 6470241005 | 1.7e-08 | 0.017 | 0.0014 | NaN |
| Total | 79018 | 6470241005 | 0.000012 | 12 | 1 | 3.5 |
The x axis represents the samples. The y axis represents the exons, one row per exon, and they are sorted by average coverage across samples. For exons with exactly the same average coverage, they are sorted next by the %GC of the exon. (The secondary sort is especially useful for the zero-coverage exons at the bottom).
Figure 1.
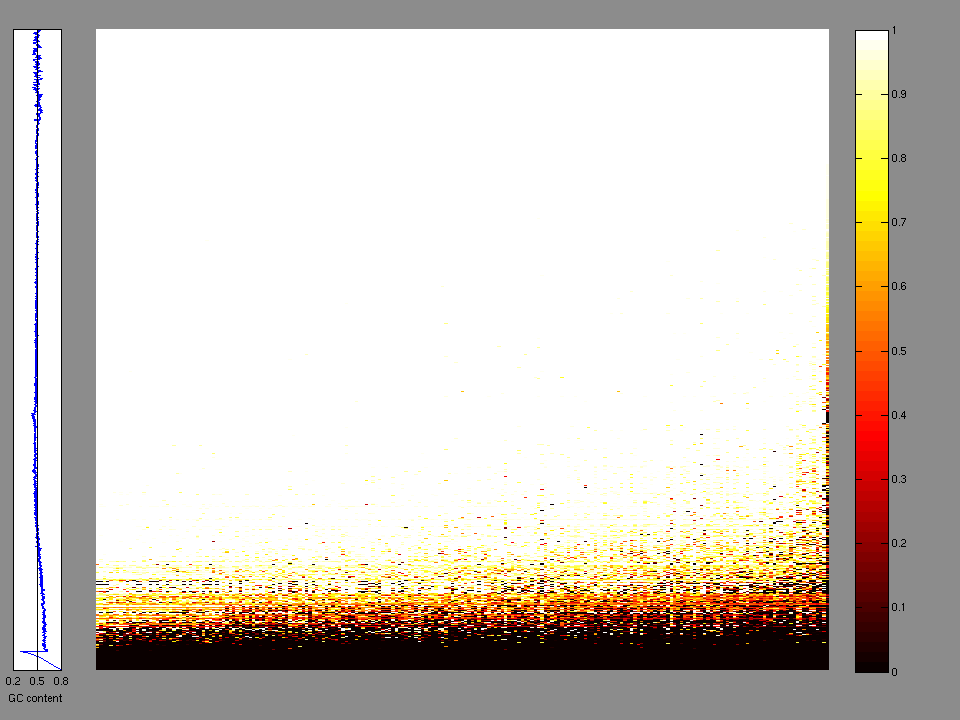
Figure 2. Patients counts and rates file used to generate this plot: STAD-TP.patients.counts_and_rates.txt
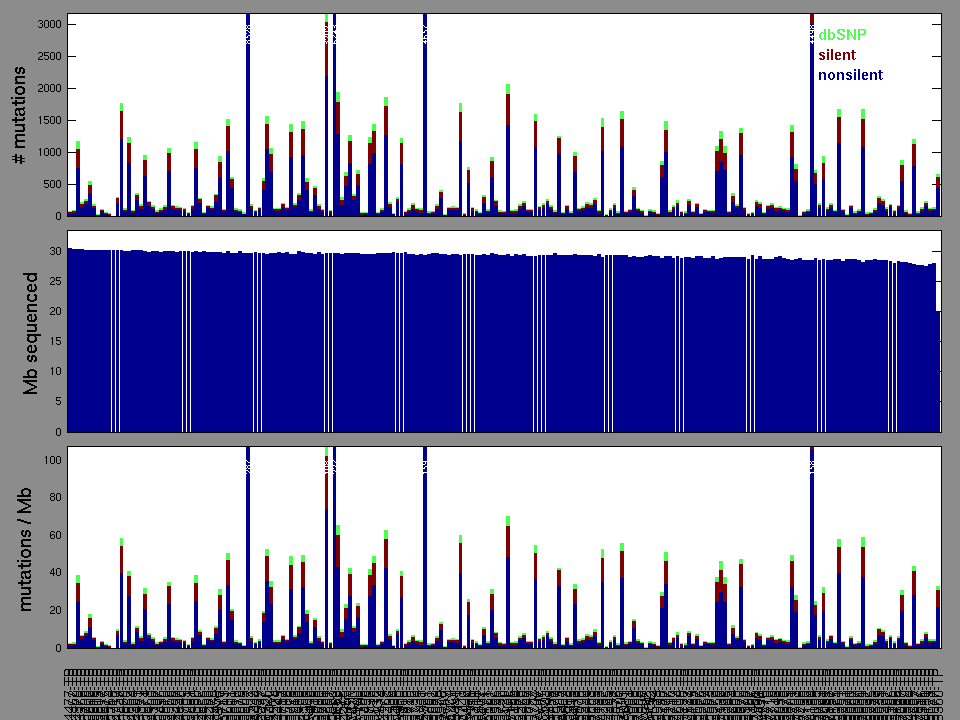
Figure 3. Needs description.

Figure 4. Needs description.

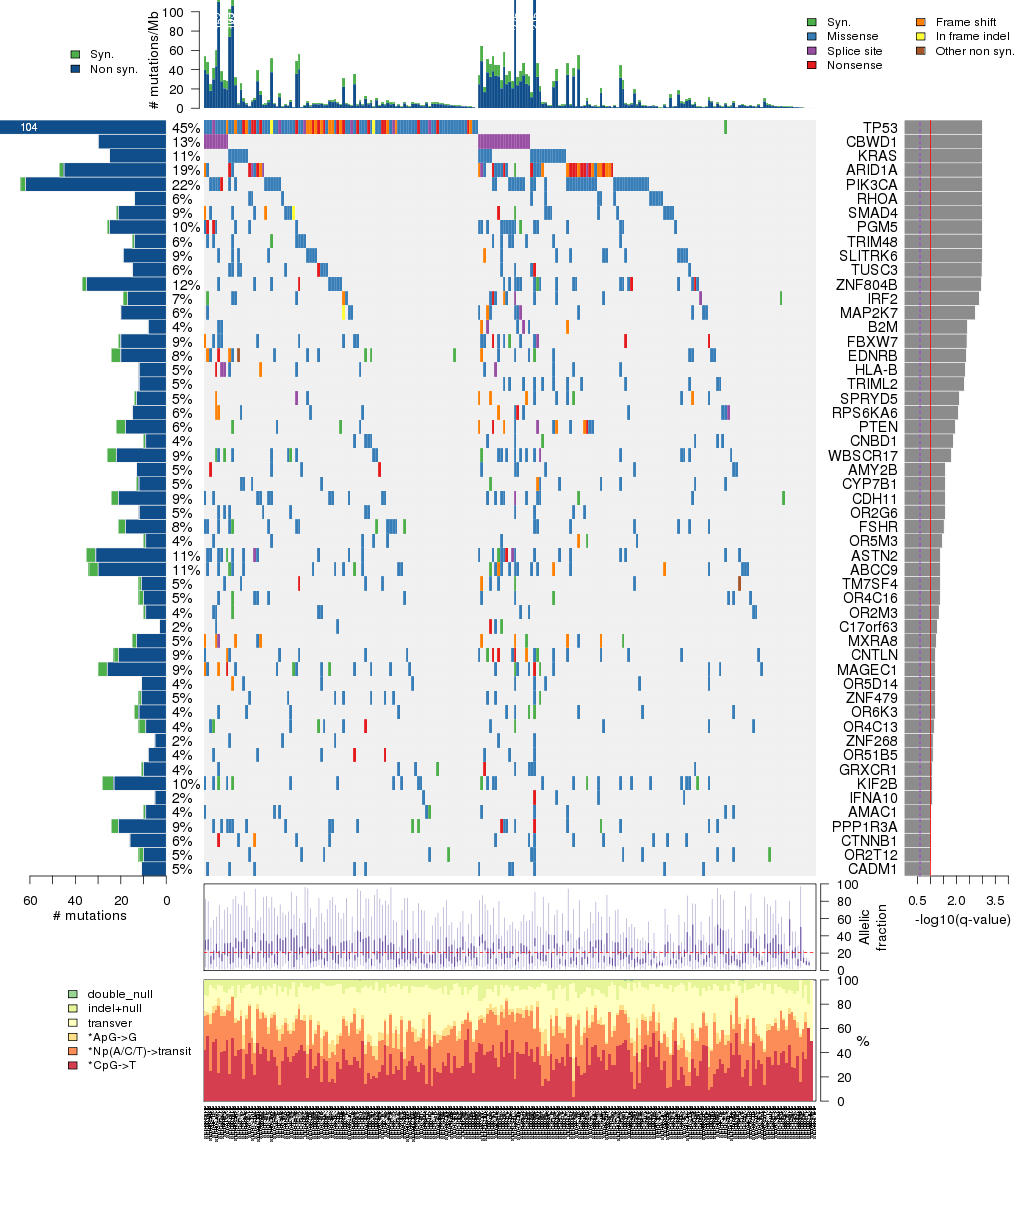
Figure 5. Get High-res Image The matrix in the center of the figure represents individual mutations in patient samples, color-coded by type of mutation, for the significantly mutated genes. The rate of synonymous and non-synonymous mutations is displayed at the top of the matrix. The barplot on the left of the matrix shows the number of mutations in each gene. The percentages represent the fraction of tumors with at least one mutation in the specified gene. The barplot to the right of the matrix displays the q-values for the most significantly mutated genes. The purple boxplots below the matrix (only displayed if required columns are present in the provided MAF) represent the distributions of allelic fractions observed in each sample. The plot at the bottom represents the base substitution distribution of individual samples, using the same categories that were used to calculate significance.
Column Descriptions:
-
N = number of sequenced bases in this gene across the individual set
-
n = number of (nonsilent) mutations in this gene across the individual set
-
npat = number of patients (individuals) with at least one nonsilent mutation
-
nsite = number of unique sites having a non-silent mutation
-
nsil = number of silent mutations in this gene across the individual set
-
n1 = number of nonsilent mutations of type: *CpG->T
-
n2 = number of nonsilent mutations of type: *Np(A/C/T)->transit
-
n3 = number of nonsilent mutations of type: *ApG->G
-
n4 = number of nonsilent mutations of type: transver
-
n5 = number of nonsilent mutations of type: indel+null
-
n6 = number of nonsilent mutations of type: double_null
-
p_ns_s = p-value for the observed nonsilent/silent ratio being elevated in this gene
-
p = p-value (overall)
-
q = q-value, False Discovery Rate (Benjamini-Hochberg procedure)
Table 3. Get Full Table A Ranked List of Significantly Mutated Genes. Number of significant genes found: 53. Number of genes displayed: 35. Click on a gene name to display its stick figure depicting the distribution of mutations and mutation types across the chosen gene (this feature may not be available for all significant genes).
| rank | gene | description | N | n | npat | nsite | nsil | n1 | n2 | n3 | n4 | n5 | n6 | p_ns_s | p | q |
|---|---|---|---|---|---|---|---|---|---|---|---|---|---|---|---|---|
| 1 | TP53 | tumor protein p53 | 272497 | 103 | 99 | 66 | 1 | 28 | 21 | 2 | 14 | 37 | 1 | 1.6e-11 | 2.2e-15 | 2.1e-11 |
| 2 | CBWD1 | COBW domain containing 1 | 210334 | 30 | 28 | 3 | 0 | 0 | 1 | 0 | 1 | 28 | 0 | 0.007 | 3e-15 | 2.1e-11 |
| 3 | KRAS | v-Ki-ras2 Kirsten rat sarcoma viral oncogene homolog | 153529 | 25 | 25 | 6 | 0 | 0 | 20 | 0 | 5 | 0 | 0 | 0.00027 | 4e-15 | 2.1e-11 |
| 4 | ARID1A | AT rich interactive domain 1A (SWI-like) | 1285806 | 45 | 41 | 45 | 2 | 6 | 5 | 1 | 4 | 27 | 2 | 0.0007 | 4.6e-15 | 2.1e-11 |
| 5 | PIK3CA | phosphoinositide-3-kinase, catalytic, alpha polypeptide | 723978 | 62 | 48 | 31 | 2 | 10 | 40 | 3 | 8 | 1 | 0 | 3.9e-07 | 6.1e-15 | 2.2e-11 |
| 6 | RHOA | ras homolog gene family, member A | 132155 | 14 | 13 | 10 | 0 | 1 | 5 | 0 | 8 | 0 | 0 | 0.027 | 9.3e-14 | 2.8e-10 |
| 7 | SMAD4 | SMAD family member 4 | 374970 | 21 | 19 | 18 | 1 | 5 | 6 | 0 | 6 | 3 | 1 | 0.024 | 1.3e-13 | 3.3e-10 |
| 8 | PGM5 | phosphoglucomutase 5 | 305048 | 25 | 22 | 7 | 1 | 4 | 18 | 0 | 1 | 2 | 0 | 0.00064 | 1e-10 | 2.3e-07 |
| 9 | TRIM48 | tripartite motif-containing 48 | 135763 | 14 | 14 | 2 | 1 | 0 | 13 | 0 | 1 | 0 | 0 | 0.018 | 2.6e-10 | 5.1e-07 |
| 10 | SLITRK6 | SLIT and NTRK-like family, member 6 | 558667 | 19 | 19 | 19 | 0 | 3 | 6 | 1 | 8 | 1 | 0 | 0.0044 | 2.4e-09 | 4.4e-06 |
| 11 | TUSC3 | tumor suppressor candidate 3 | 237782 | 15 | 14 | 13 | 0 | 5 | 0 | 3 | 5 | 2 | 0 | 0.026 | 1.9e-08 | 0.000032 |
| 12 | ZNF804B | zinc finger protein 804B | 895133 | 35 | 27 | 34 | 2 | 2 | 8 | 1 | 21 | 3 | 0 | 0.0069 | 4.8e-08 | 0.000073 |
| 13 | IRF2 | interferon regulatory factor 2 | 238325 | 17 | 15 | 16 | 2 | 5 | 2 | 0 | 5 | 4 | 1 | 0.13 | 1.8e-07 | 0.00024 |
| 14 | MAP2K7 | mitogen-activated protein kinase kinase 7 | 219244 | 20 | 14 | 20 | 0 | 10 | 4 | 0 | 3 | 3 | 0 | 0.00062 | 6e-07 | 0.00077 |
| 15 | B2M | beta-2-microglobulin | 82186 | 8 | 8 | 8 | 0 | 0 | 2 | 0 | 2 | 3 | 1 | 0.14 | 2.2e-06 | 0.0027 |
| 16 | FBXW7 | F-box and WD repeat domain containing 7 | 548512 | 20 | 19 | 13 | 1 | 11 | 4 | 0 | 0 | 5 | 0 | 0.023 | 2.6e-06 | 0.0029 |
| 17 | EDNRB | endothelin receptor type B | 303308 | 20 | 18 | 17 | 4 | 8 | 3 | 0 | 5 | 4 | 0 | 0.19 | 2.9e-06 | 0.0031 |
| 18 | HLA-B | major histocompatibility complex, class I, B | 217984 | 12 | 12 | 12 | 0 | 1 | 2 | 2 | 2 | 4 | 1 | 0.03 | 3.3e-06 | 0.0033 |
| 19 | TRIML2 | tripartite motif family-like 2 | 263175 | 12 | 12 | 12 | 0 | 1 | 4 | 1 | 6 | 0 | 0 | 0.029 | 3.9e-06 | 0.0037 |
| 20 | SPRYD5 | SPRY domain containing 5 | 301898 | 13 | 12 | 10 | 1 | 0 | 0 | 2 | 5 | 6 | 0 | 0.45 | 7.4e-06 | 0.0067 |
| 21 | RPS6KA6 | ribosomal protein S6 kinase, 90kDa, polypeptide 6 | 454067 | 15 | 13 | 13 | 0 | 3 | 1 | 1 | 5 | 5 | 0 | 0.048 | 8.5e-06 | 0.0073 |
| 22 | PTEN | phosphatase and tensin homolog (mutated in multiple advanced cancers 1) | 266766 | 18 | 14 | 16 | 4 | 1 | 4 | 0 | 6 | 7 | 0 | 0.58 | 0.000012 | 0.0097 |
| 23 | CNBD1 | cyclic nucleotide binding domain containing 1 | 218431 | 9 | 9 | 7 | 1 | 0 | 1 | 3 | 5 | 0 | 0 | 0.21 | 0.000015 | 0.012 |
| 24 | WBSCR17 | Williams-Beuren syndrome chromosome region 17 | 398022 | 22 | 20 | 20 | 4 | 9 | 6 | 3 | 3 | 1 | 0 | 0.077 | 0.000019 | 0.015 |
| 25 | AMY2B | amylase, alpha 2B (pancreatic) | 348165 | 13 | 11 | 13 | 0 | 2 | 5 | 0 | 4 | 2 | 0 | 0.044 | 0.000035 | 0.024 |
| 26 | CYP7B1 | cytochrome P450, family 7, subfamily B, polypeptide 1 | 309578 | 12 | 11 | 11 | 1 | 1 | 1 | 0 | 9 | 1 | 0 | 0.33 | 0.000035 | 0.024 |
| 27 | CDH11 | cadherin 11, type 2, OB-cadherin (osteoblast) | 518587 | 21 | 20 | 19 | 3 | 8 | 2 | 0 | 10 | 1 | 0 | 0.068 | 0.000039 | 0.025 |
| 28 | OR2G6 | olfactory receptor, family 2, subfamily G, member 6 | 210674 | 12 | 11 | 12 | 0 | 1 | 6 | 0 | 5 | 0 | 0 | 0.015 | 0.000039 | 0.025 |
| 29 | FSHR | follicle stimulating hormone receptor | 468783 | 18 | 18 | 17 | 3 | 2 | 4 | 2 | 10 | 0 | 0 | 0.2 | 0.000046 | 0.028 |
| 30 | OR5M3 | olfactory receptor, family 5, subfamily M, member 3 | 203247 | 9 | 8 | 9 | 1 | 2 | 1 | 2 | 3 | 1 | 0 | 0.26 | 0.000053 | 0.032 |
| 31 | ASTN2 | astrotactin 2 | 789219 | 31 | 25 | 31 | 4 | 12 | 8 | 0 | 8 | 3 | 0 | 0.011 | 0.000068 | 0.039 |
| 32 | ABCC9 | ATP-binding cassette, sub-family C (CFTR/MRP), member 9 | 1088873 | 30 | 25 | 29 | 4 | 8 | 9 | 1 | 9 | 3 | 0 | 0.054 | 7e-05 | 0.039 |
| 33 | TM7SF4 | transmembrane 7 superfamily member 4 | 314591 | 11 | 10 | 11 | 1 | 1 | 1 | 3 | 3 | 3 | 0 | 0.16 | 0.000071 | 0.039 |
| 34 | OR4C16 | olfactory receptor, family 4, subfamily C, member 16 | 205186 | 10 | 10 | 8 | 2 | 1 | 3 | 0 | 6 | 0 | 0 | 0.42 | 0.000076 | 0.041 |
| 35 | OR2M3 | olfactory receptor, family 2, subfamily M, member 3 | 208182 | 9 | 8 | 9 | 1 | 1 | 4 | 2 | 2 | 0 | 0 | 0.18 | 0.000087 | 0.045 |
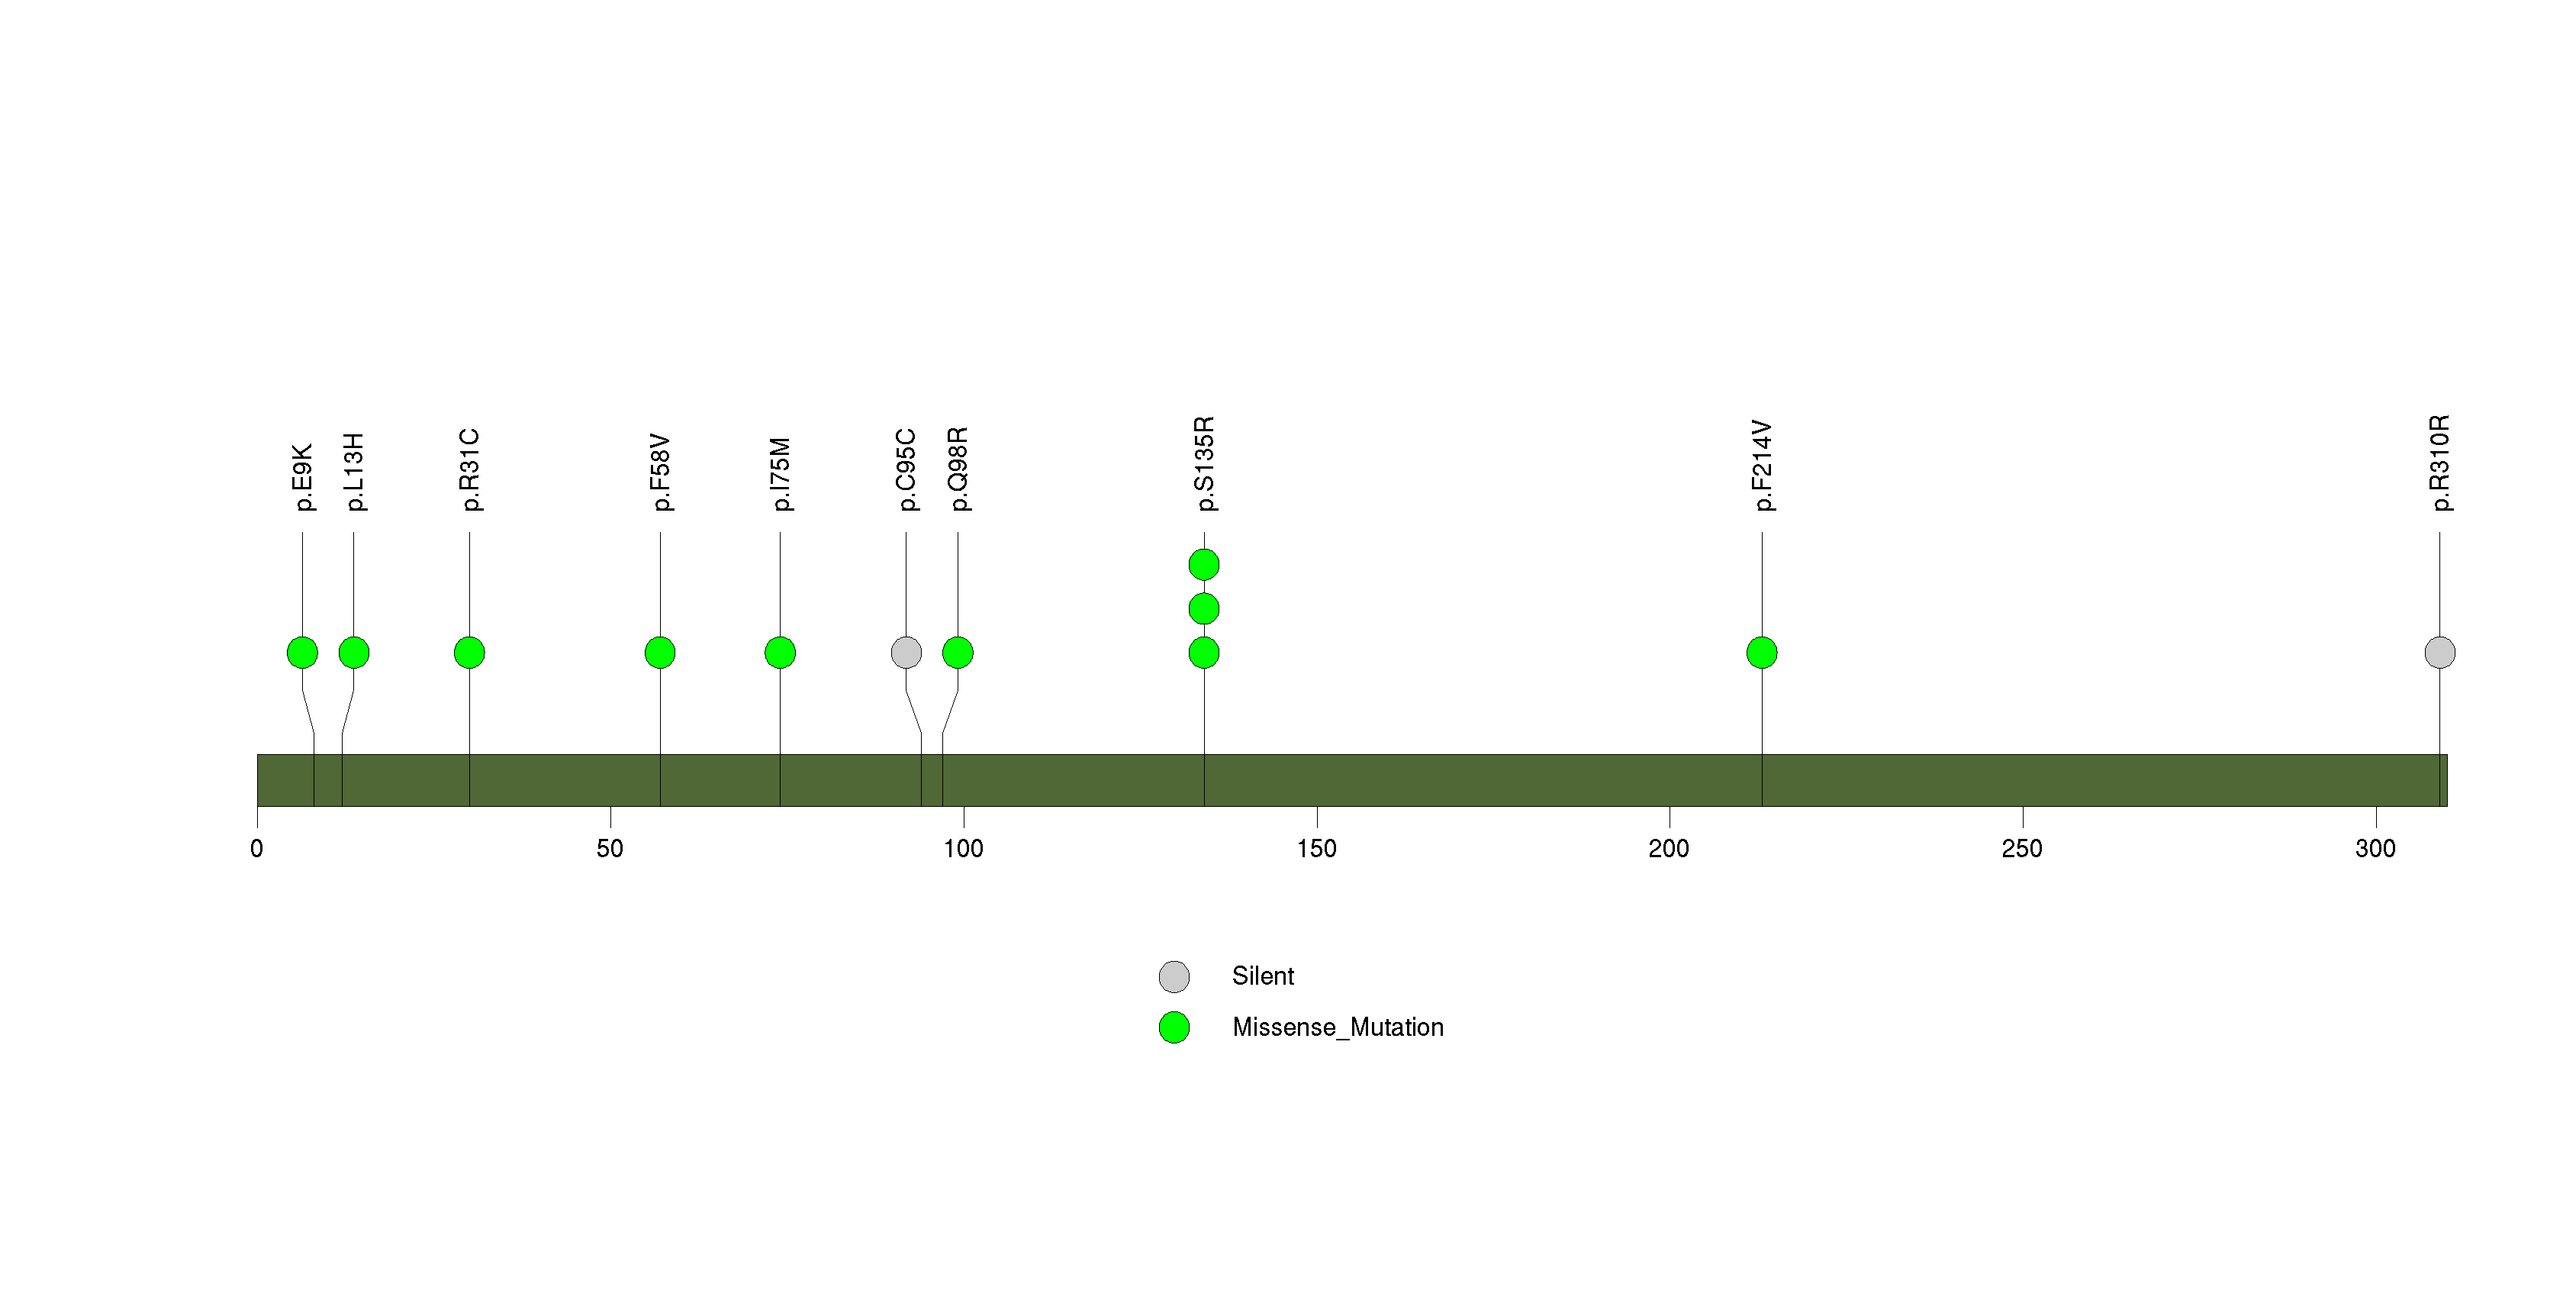
Figure S1. This figure depicts the distribution of mutations and mutation types across the TP53 significant gene.
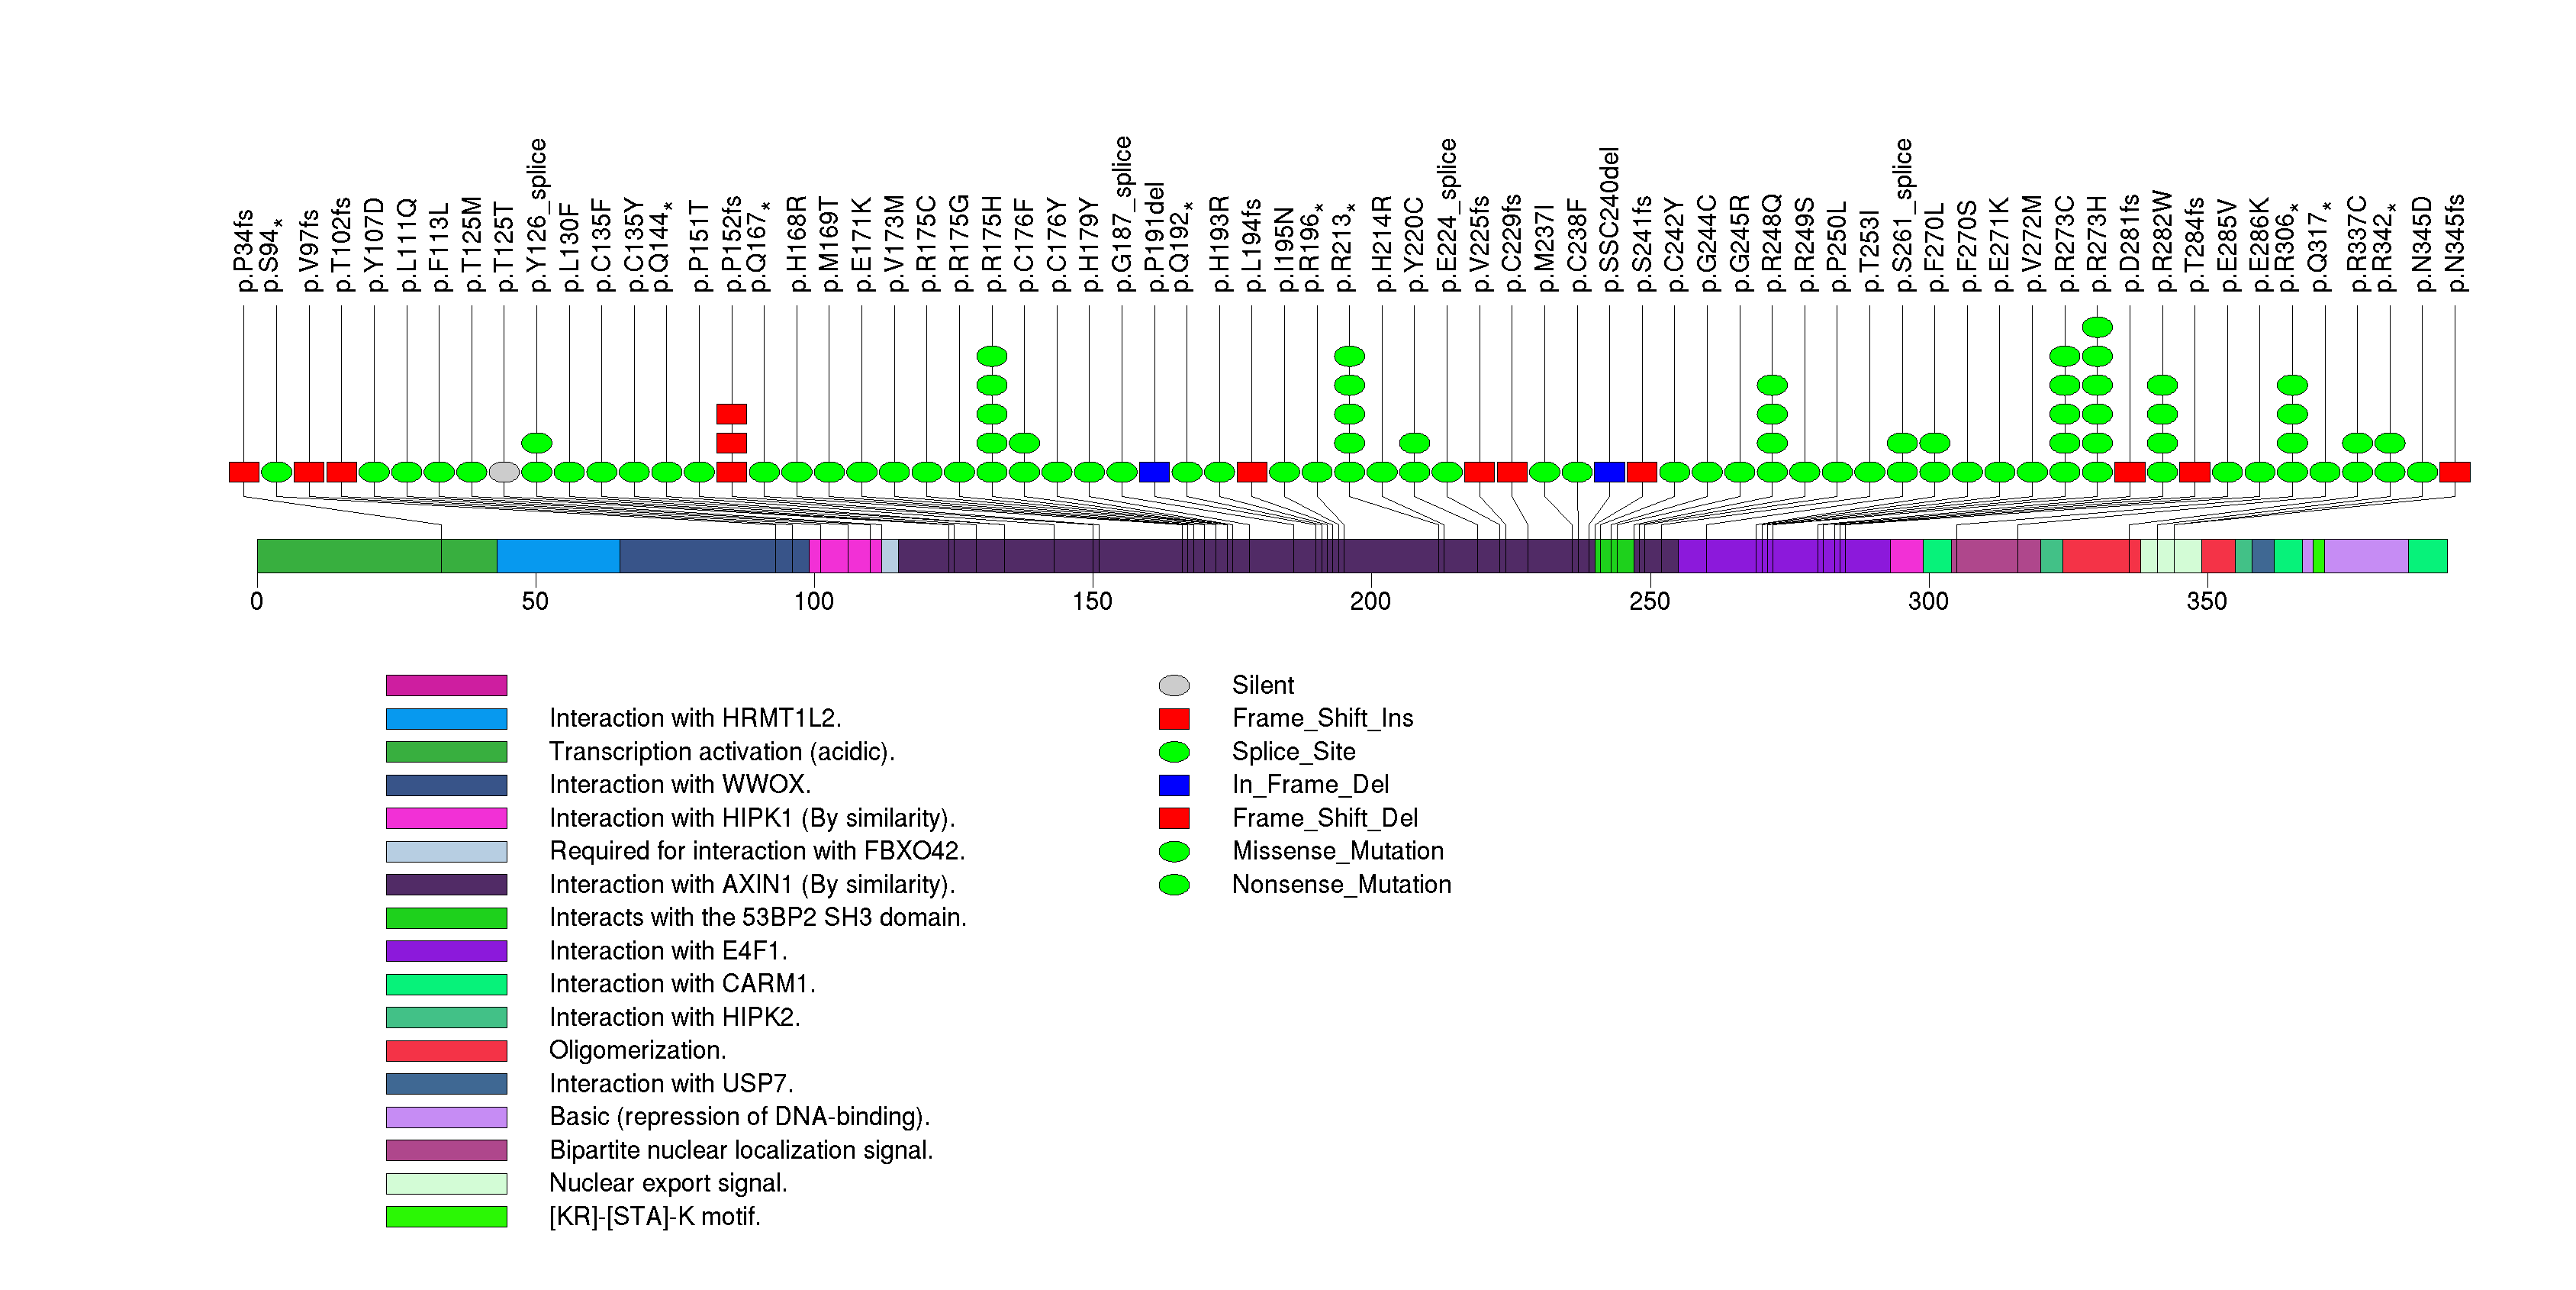
Figure S2. This figure depicts the distribution of mutations and mutation types across the CBWD1 significant gene.
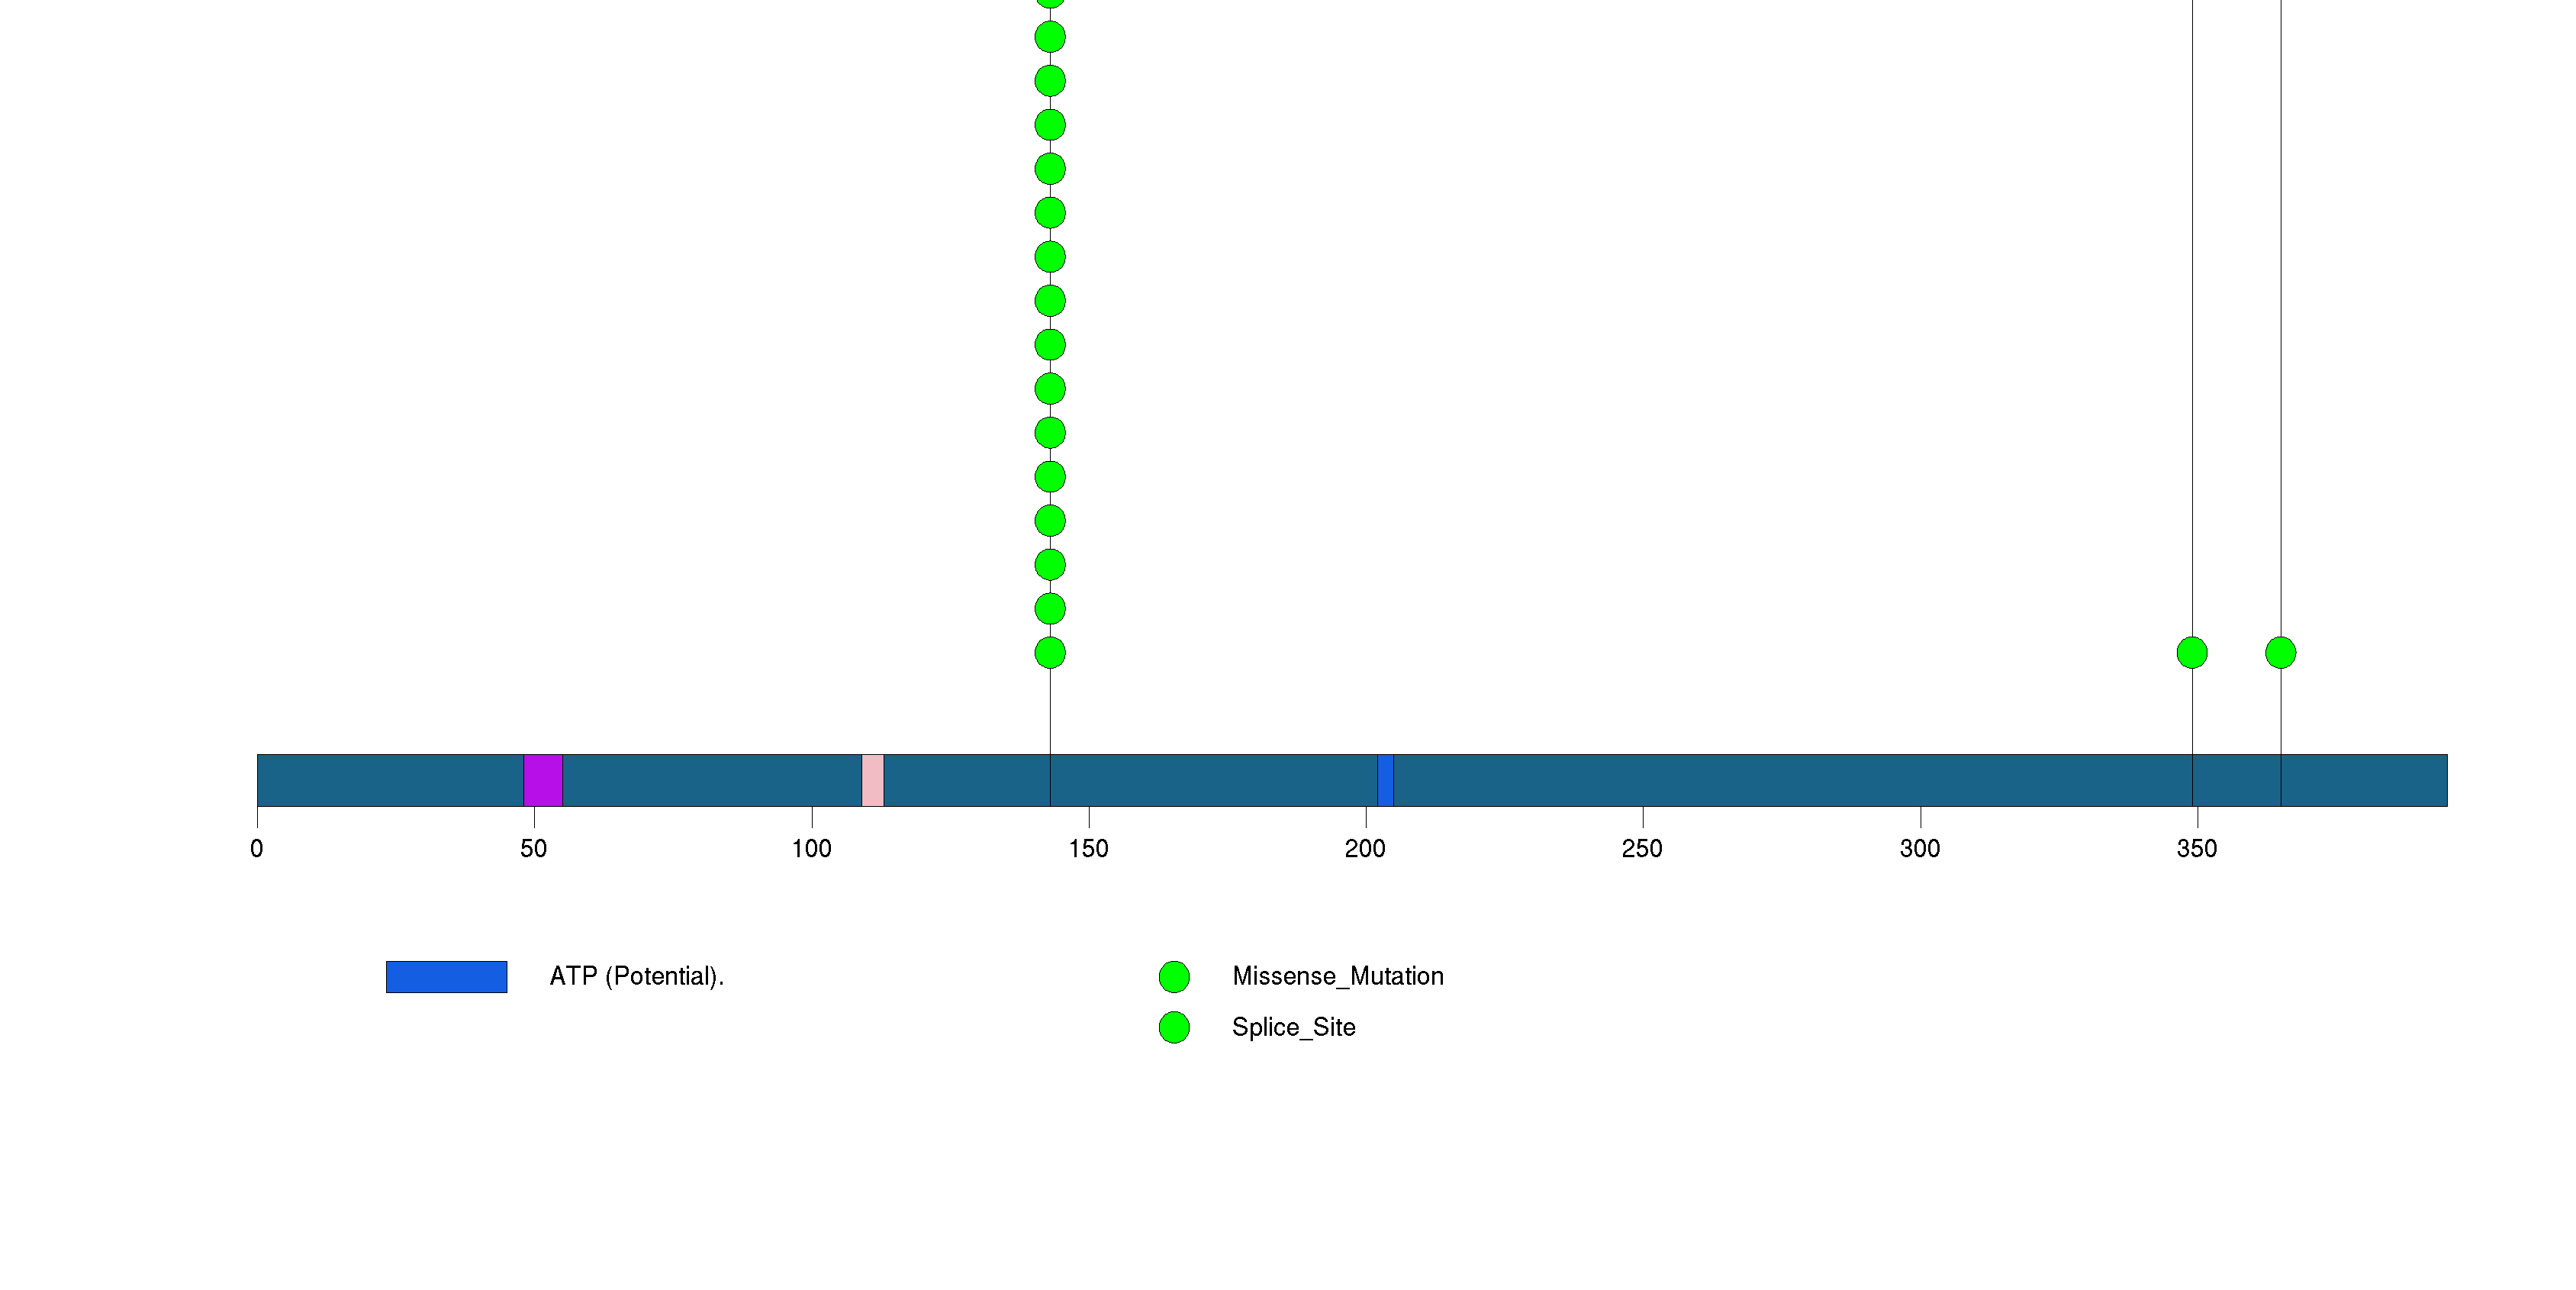
Figure S3. This figure depicts the distribution of mutations and mutation types across the KRAS significant gene.
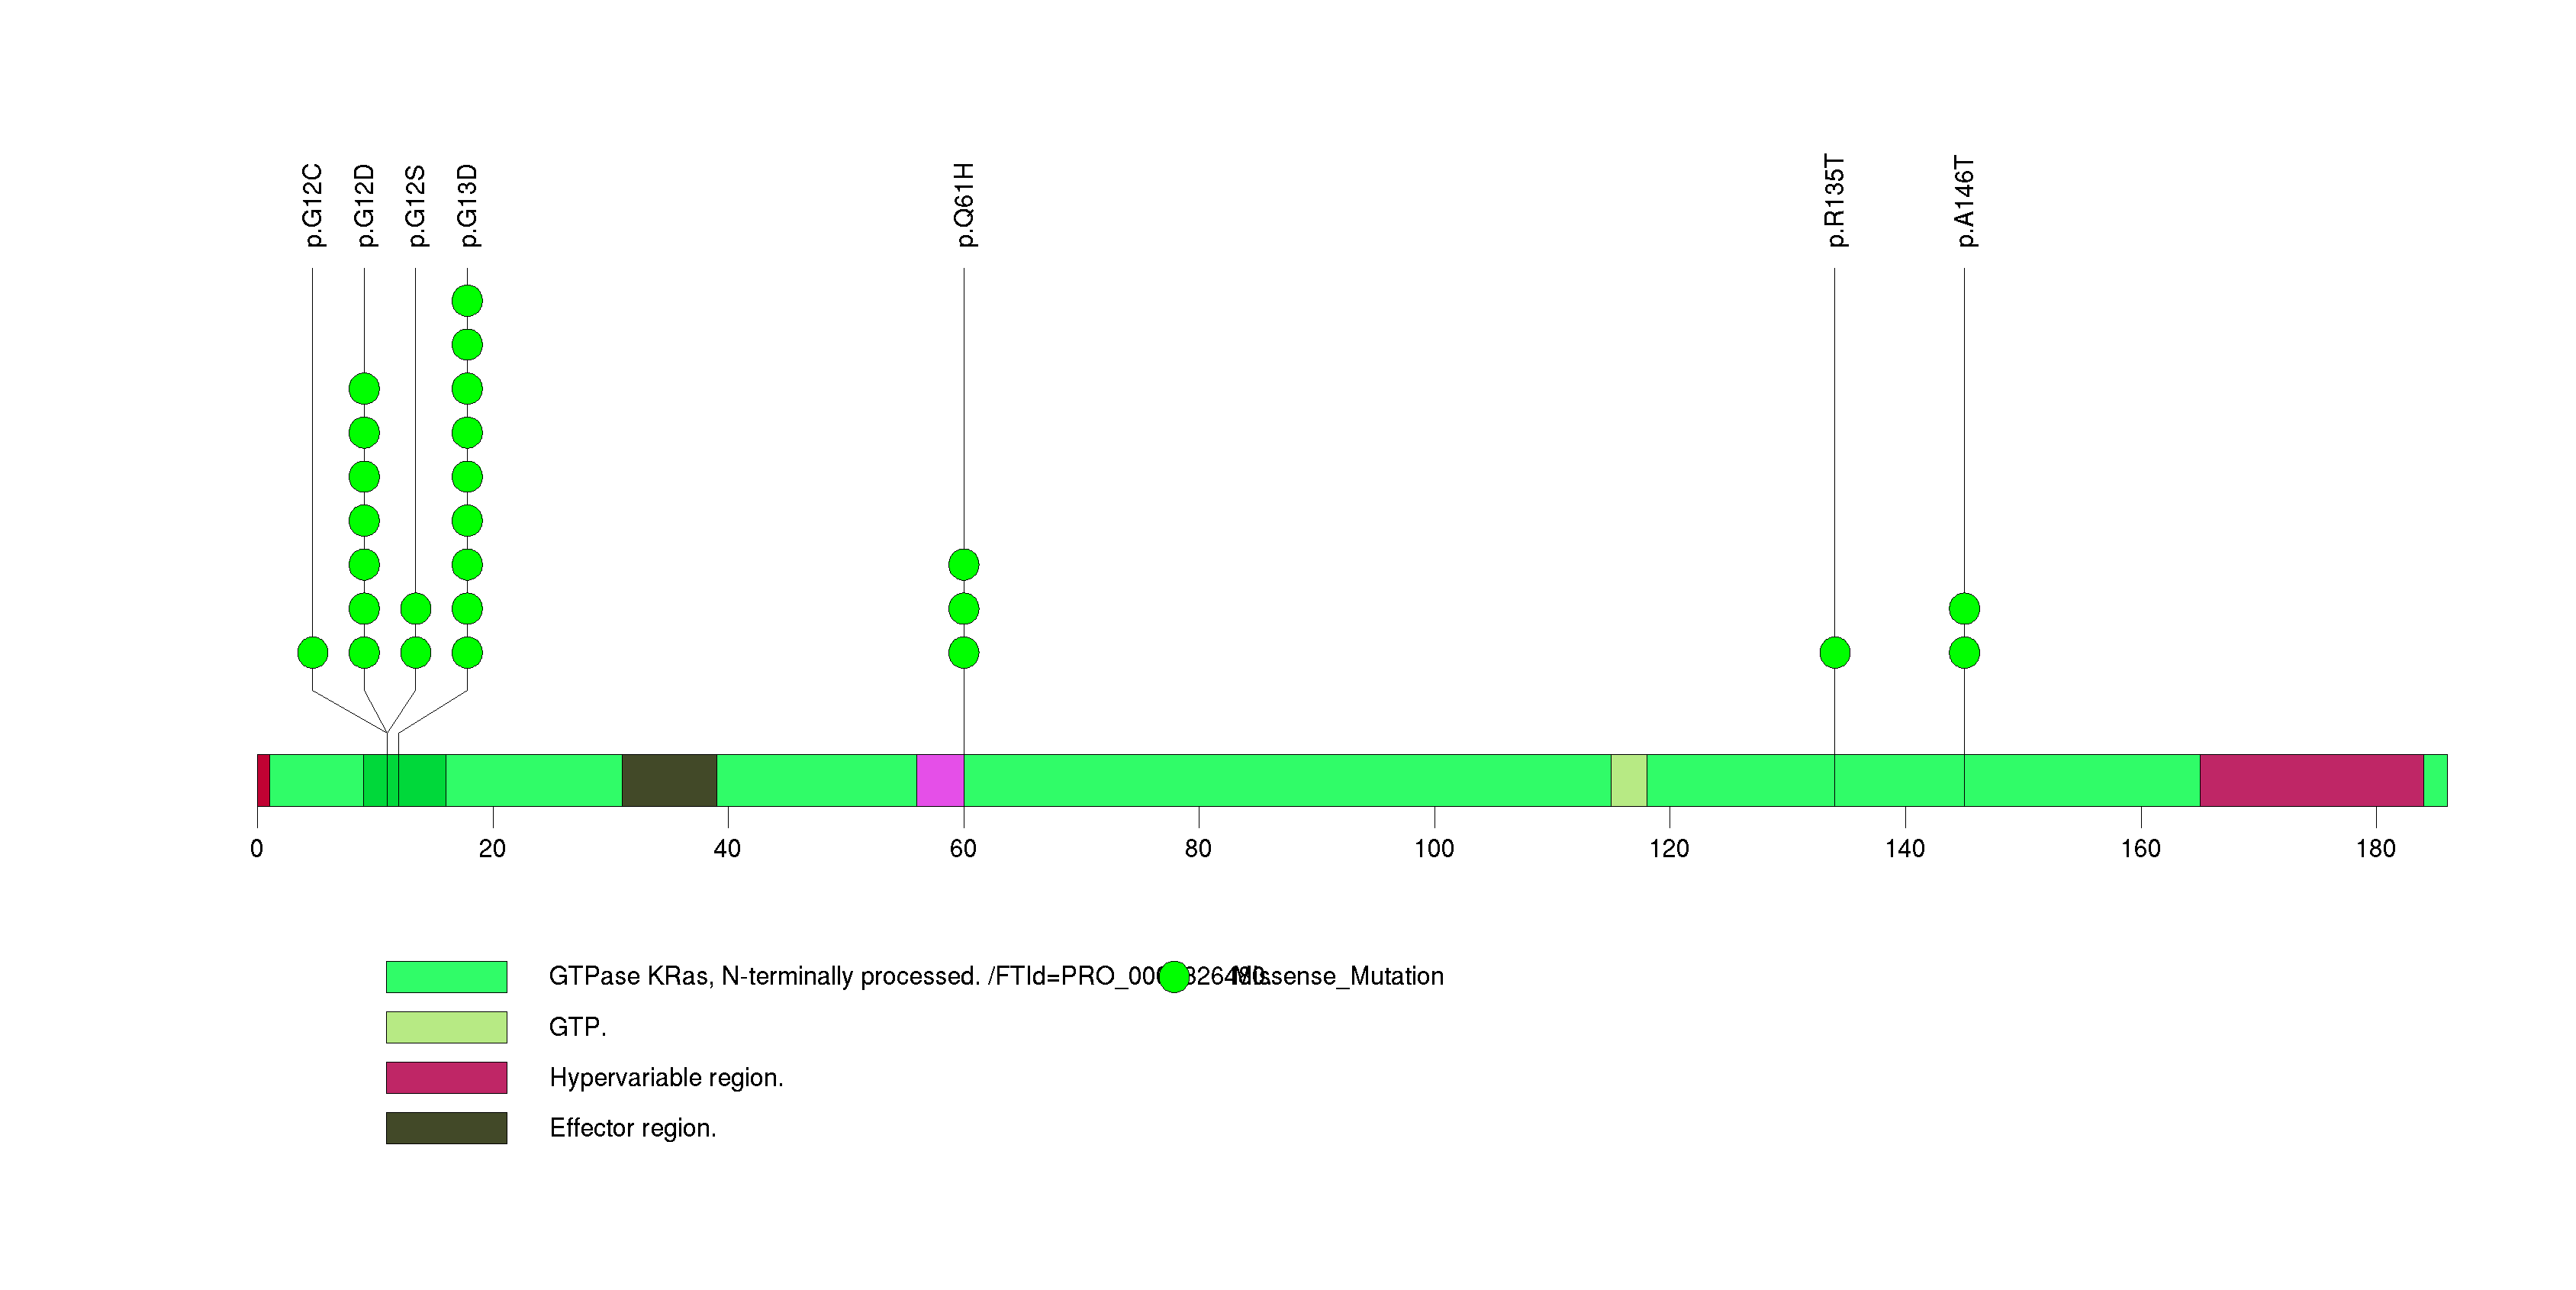
Figure S4. This figure depicts the distribution of mutations and mutation types across the ARID1A significant gene.
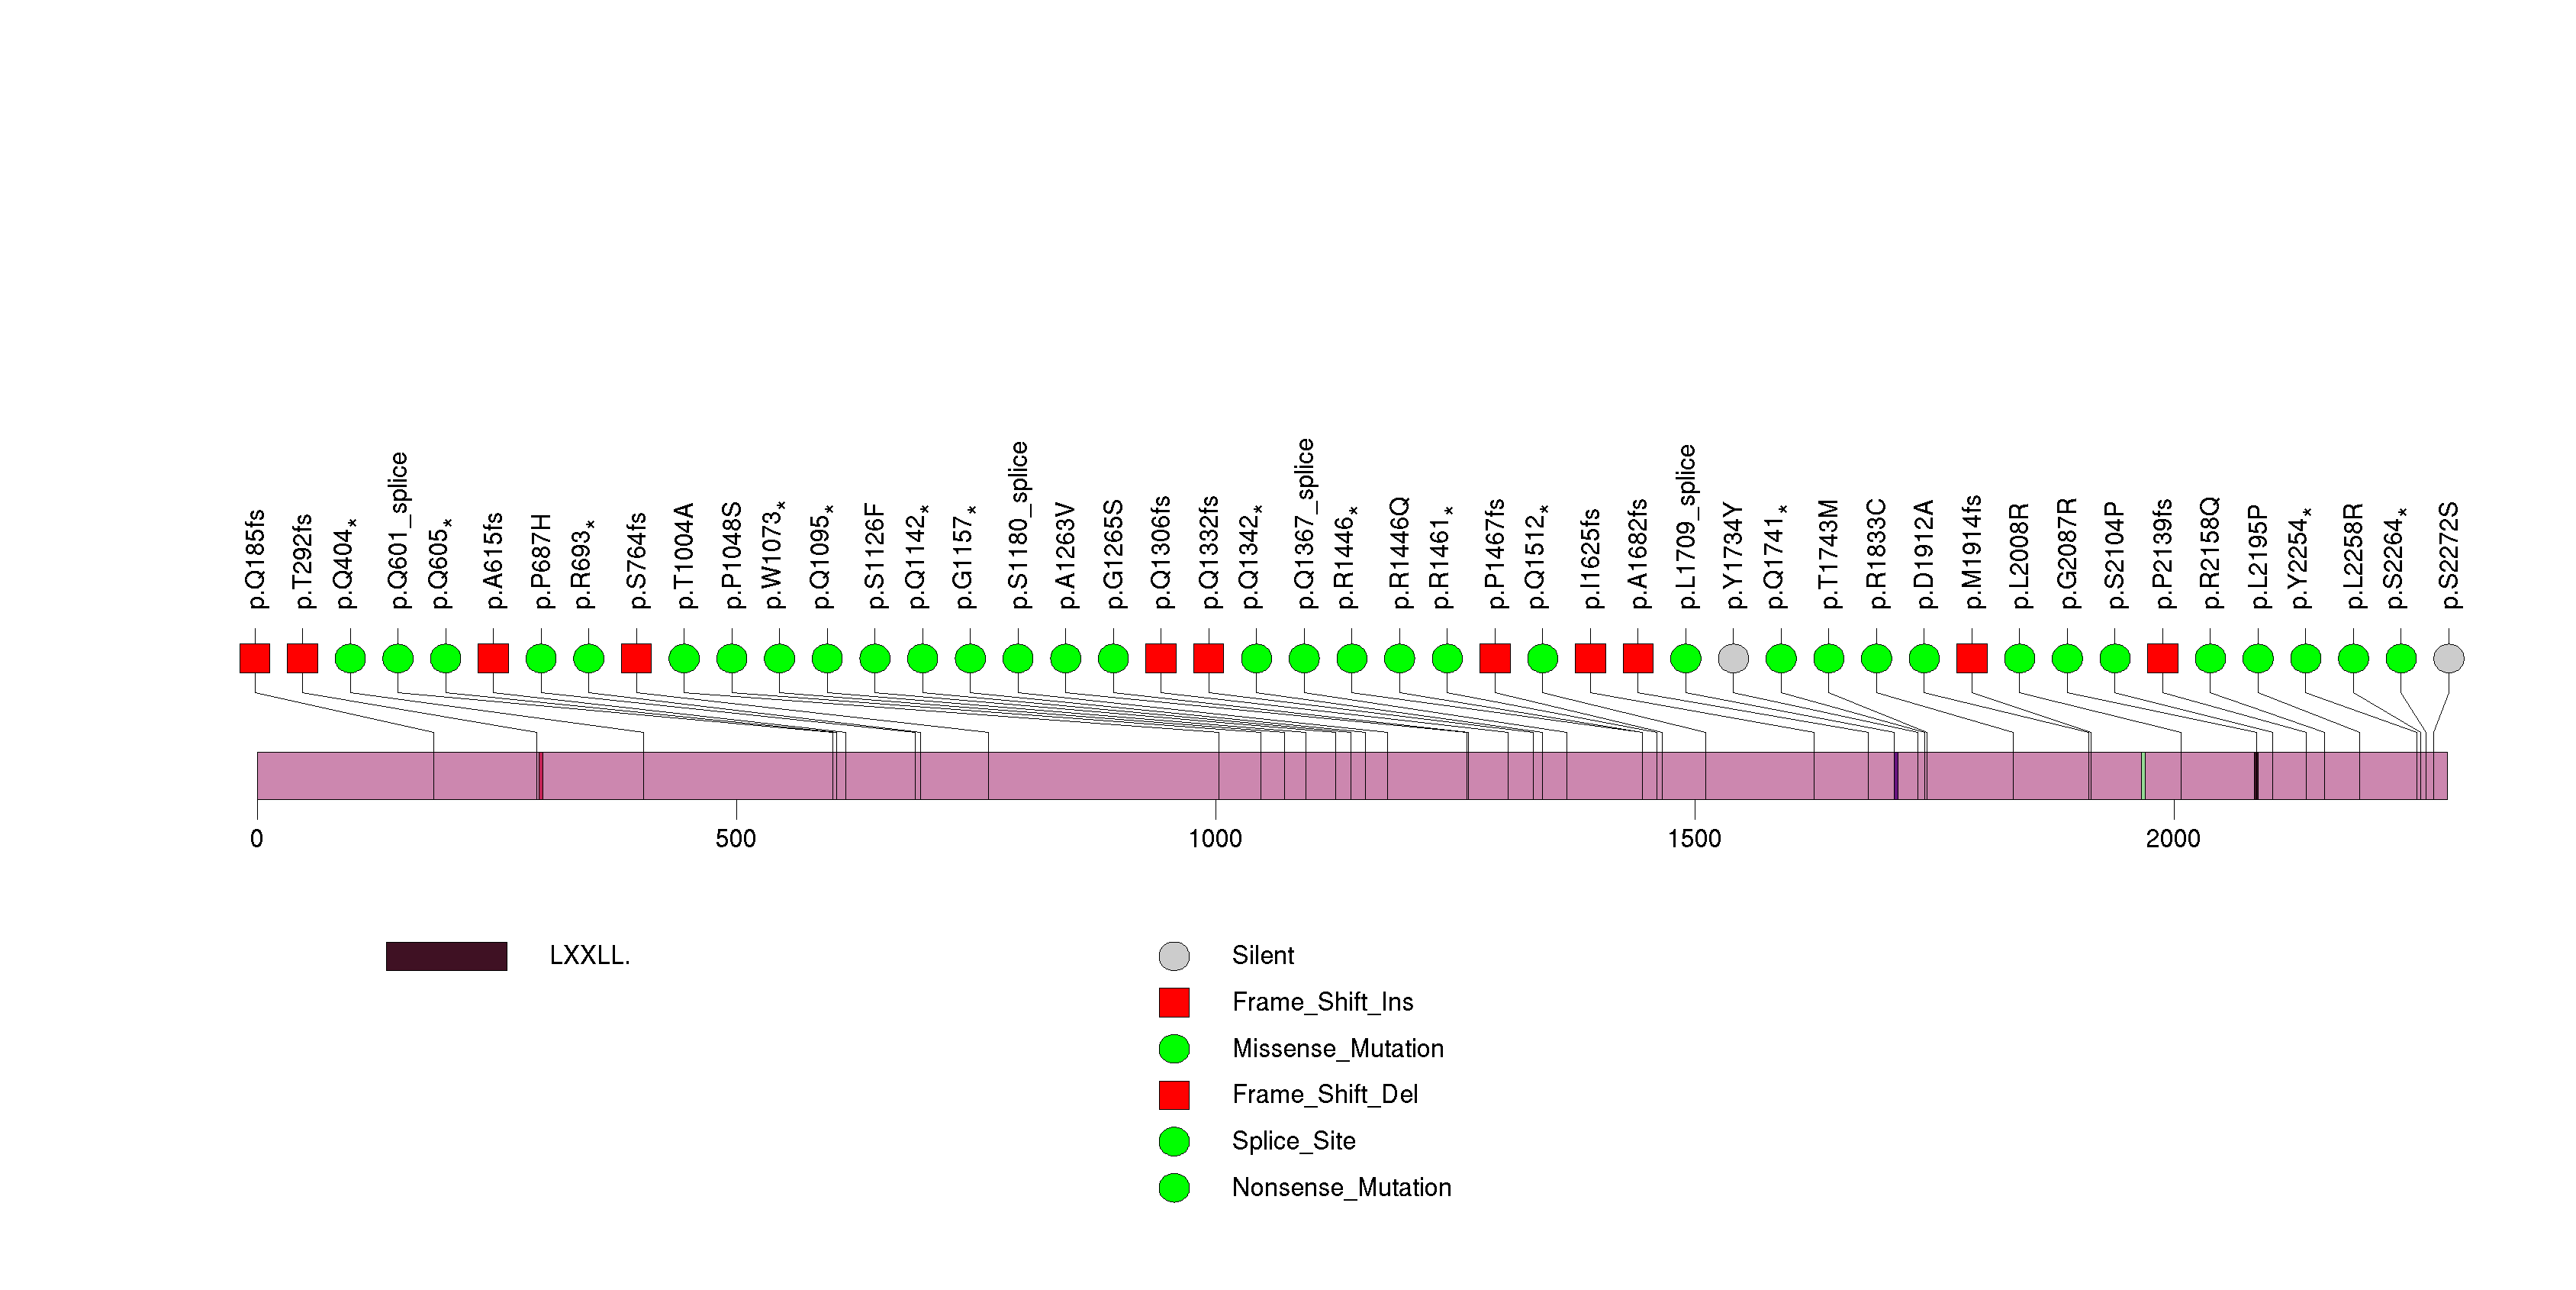
Figure S5. This figure depicts the distribution of mutations and mutation types across the PIK3CA significant gene.
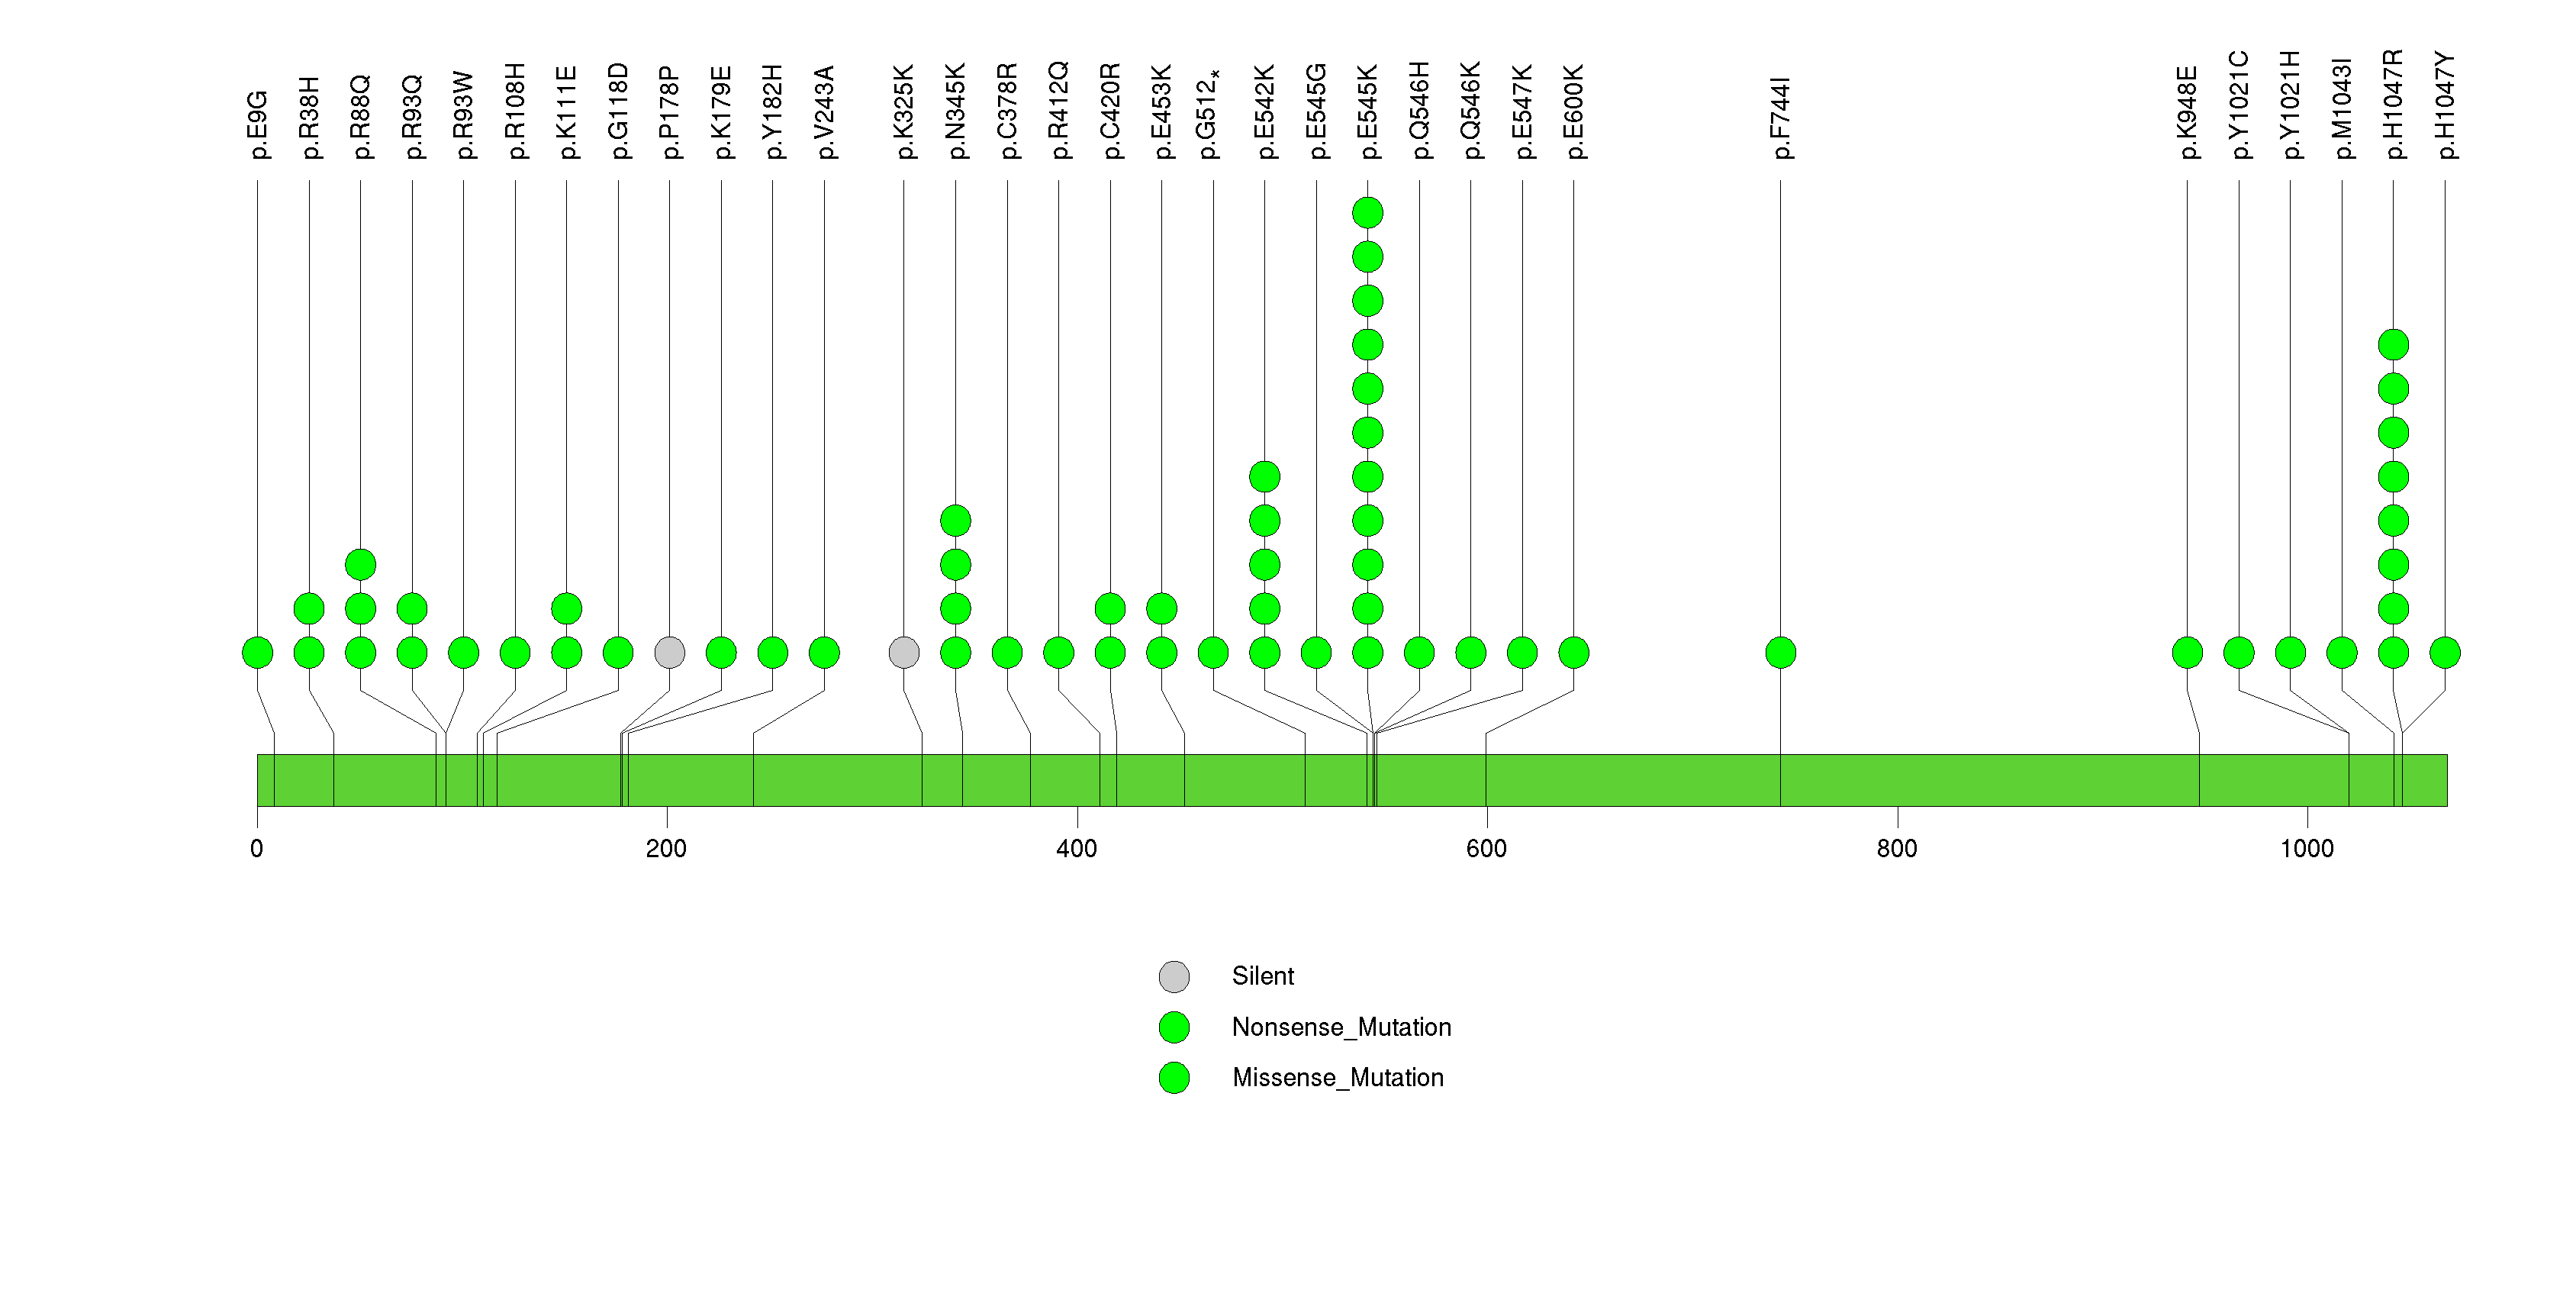
Figure S6. This figure depicts the distribution of mutations and mutation types across the RHOA significant gene.
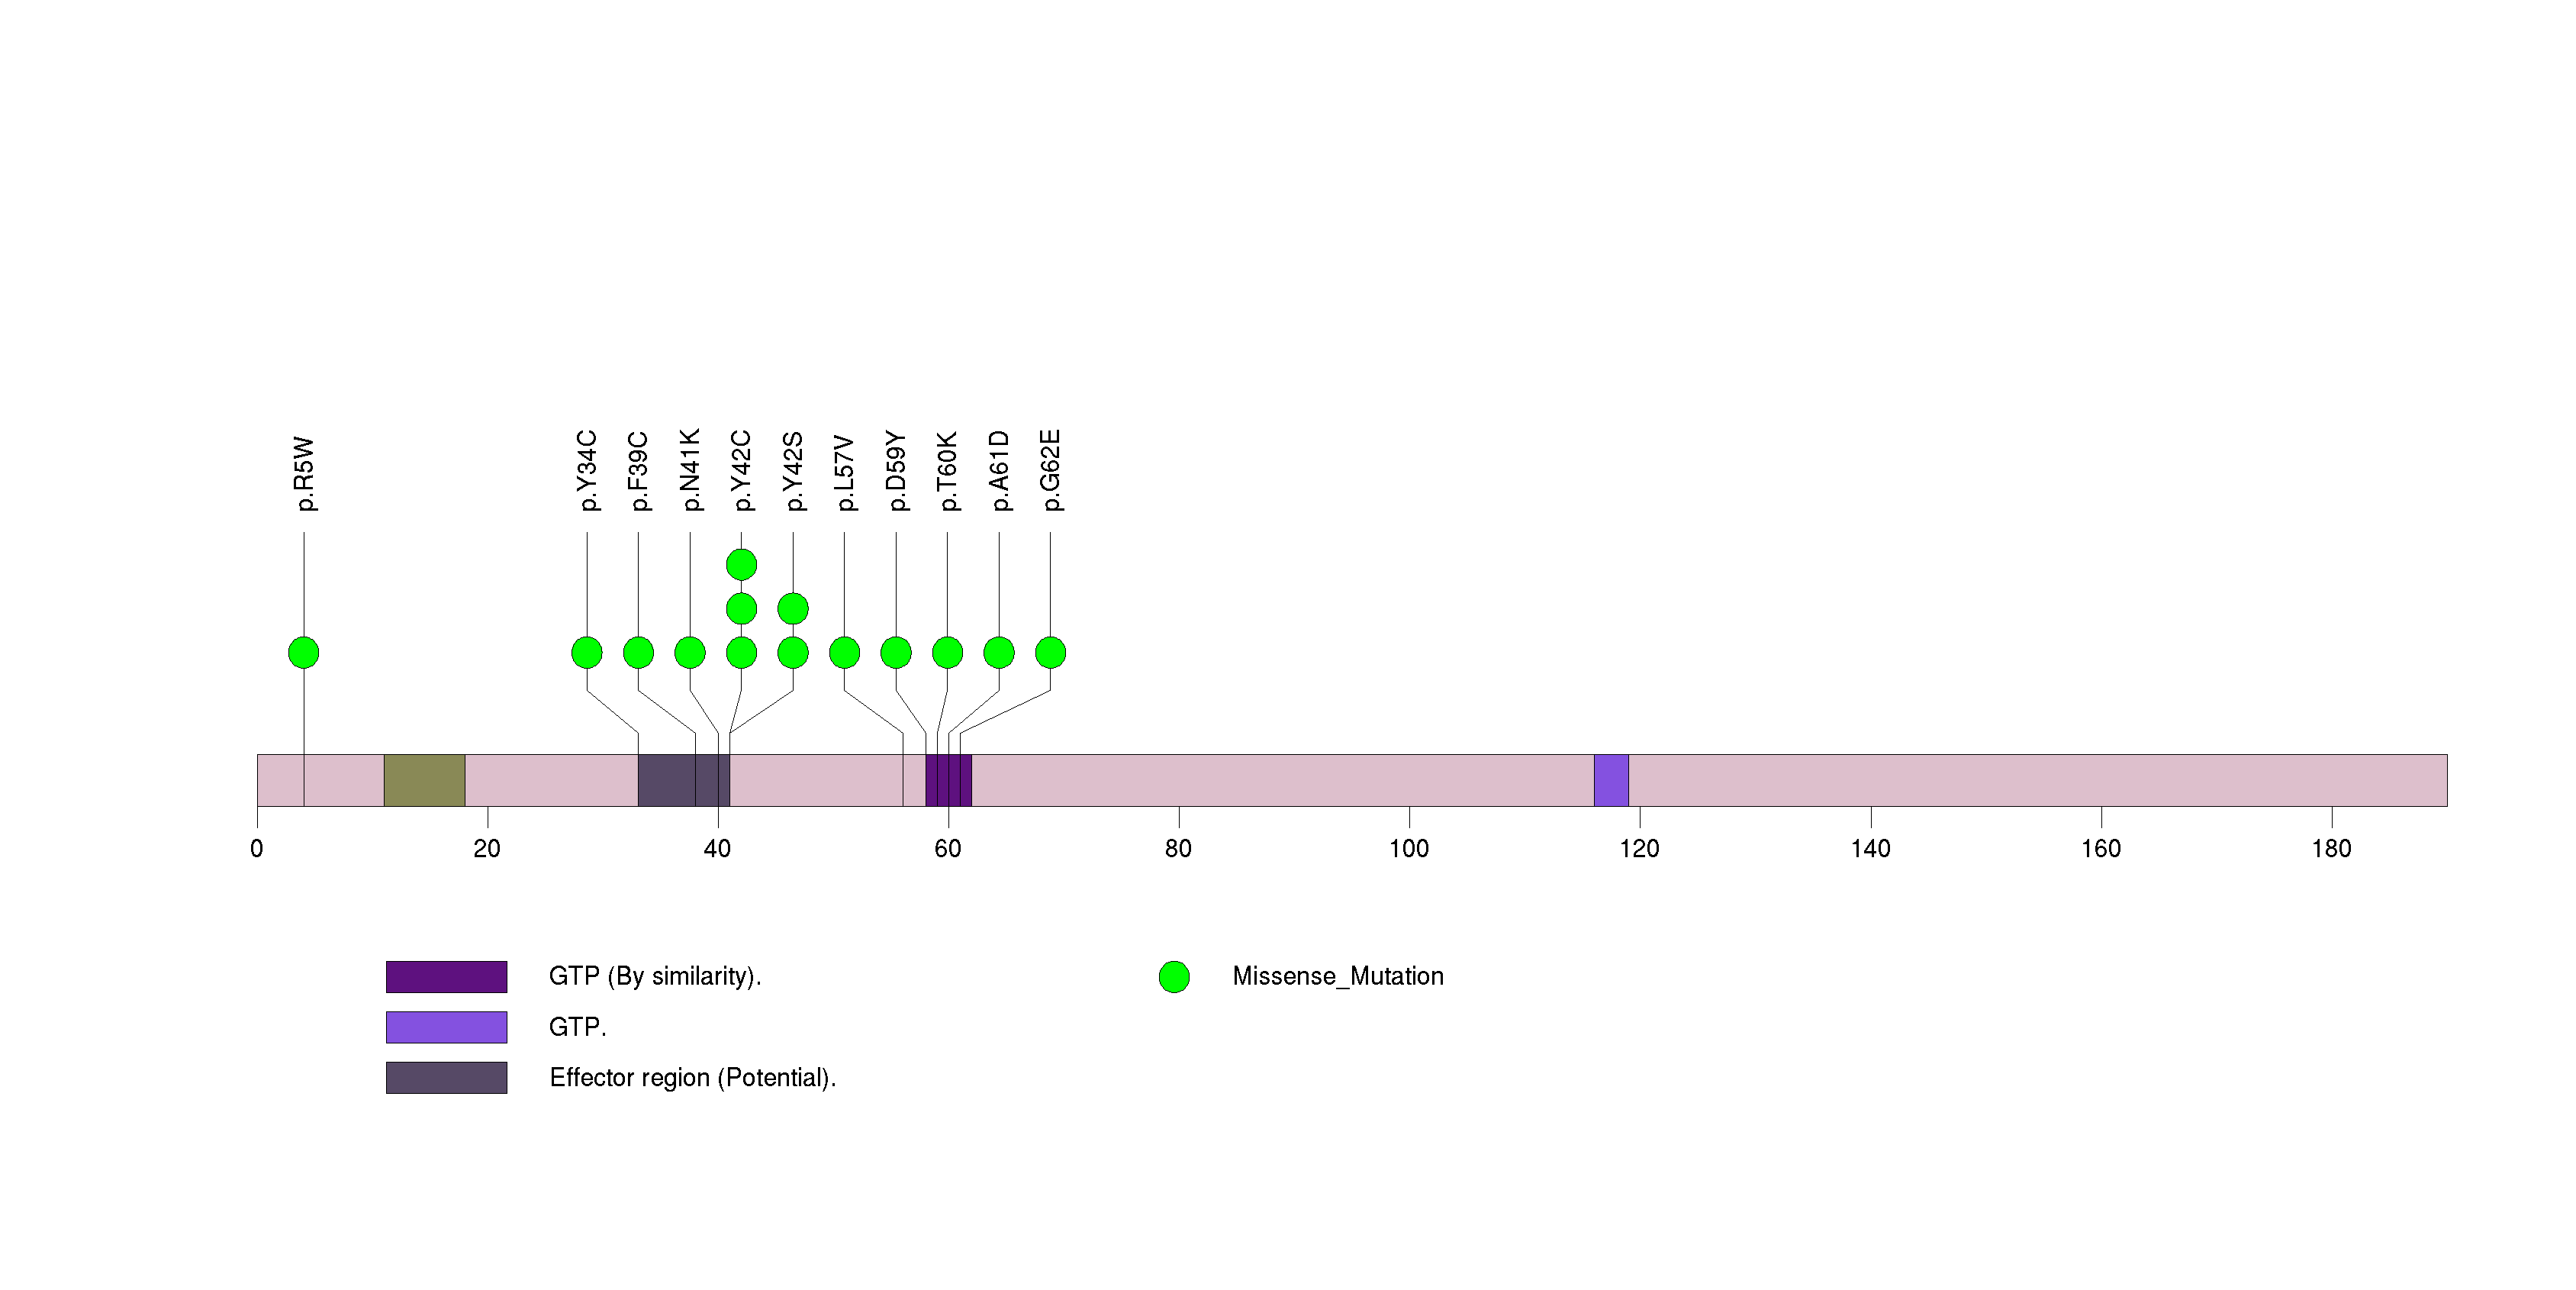
Figure S7. This figure depicts the distribution of mutations and mutation types across the SMAD4 significant gene.
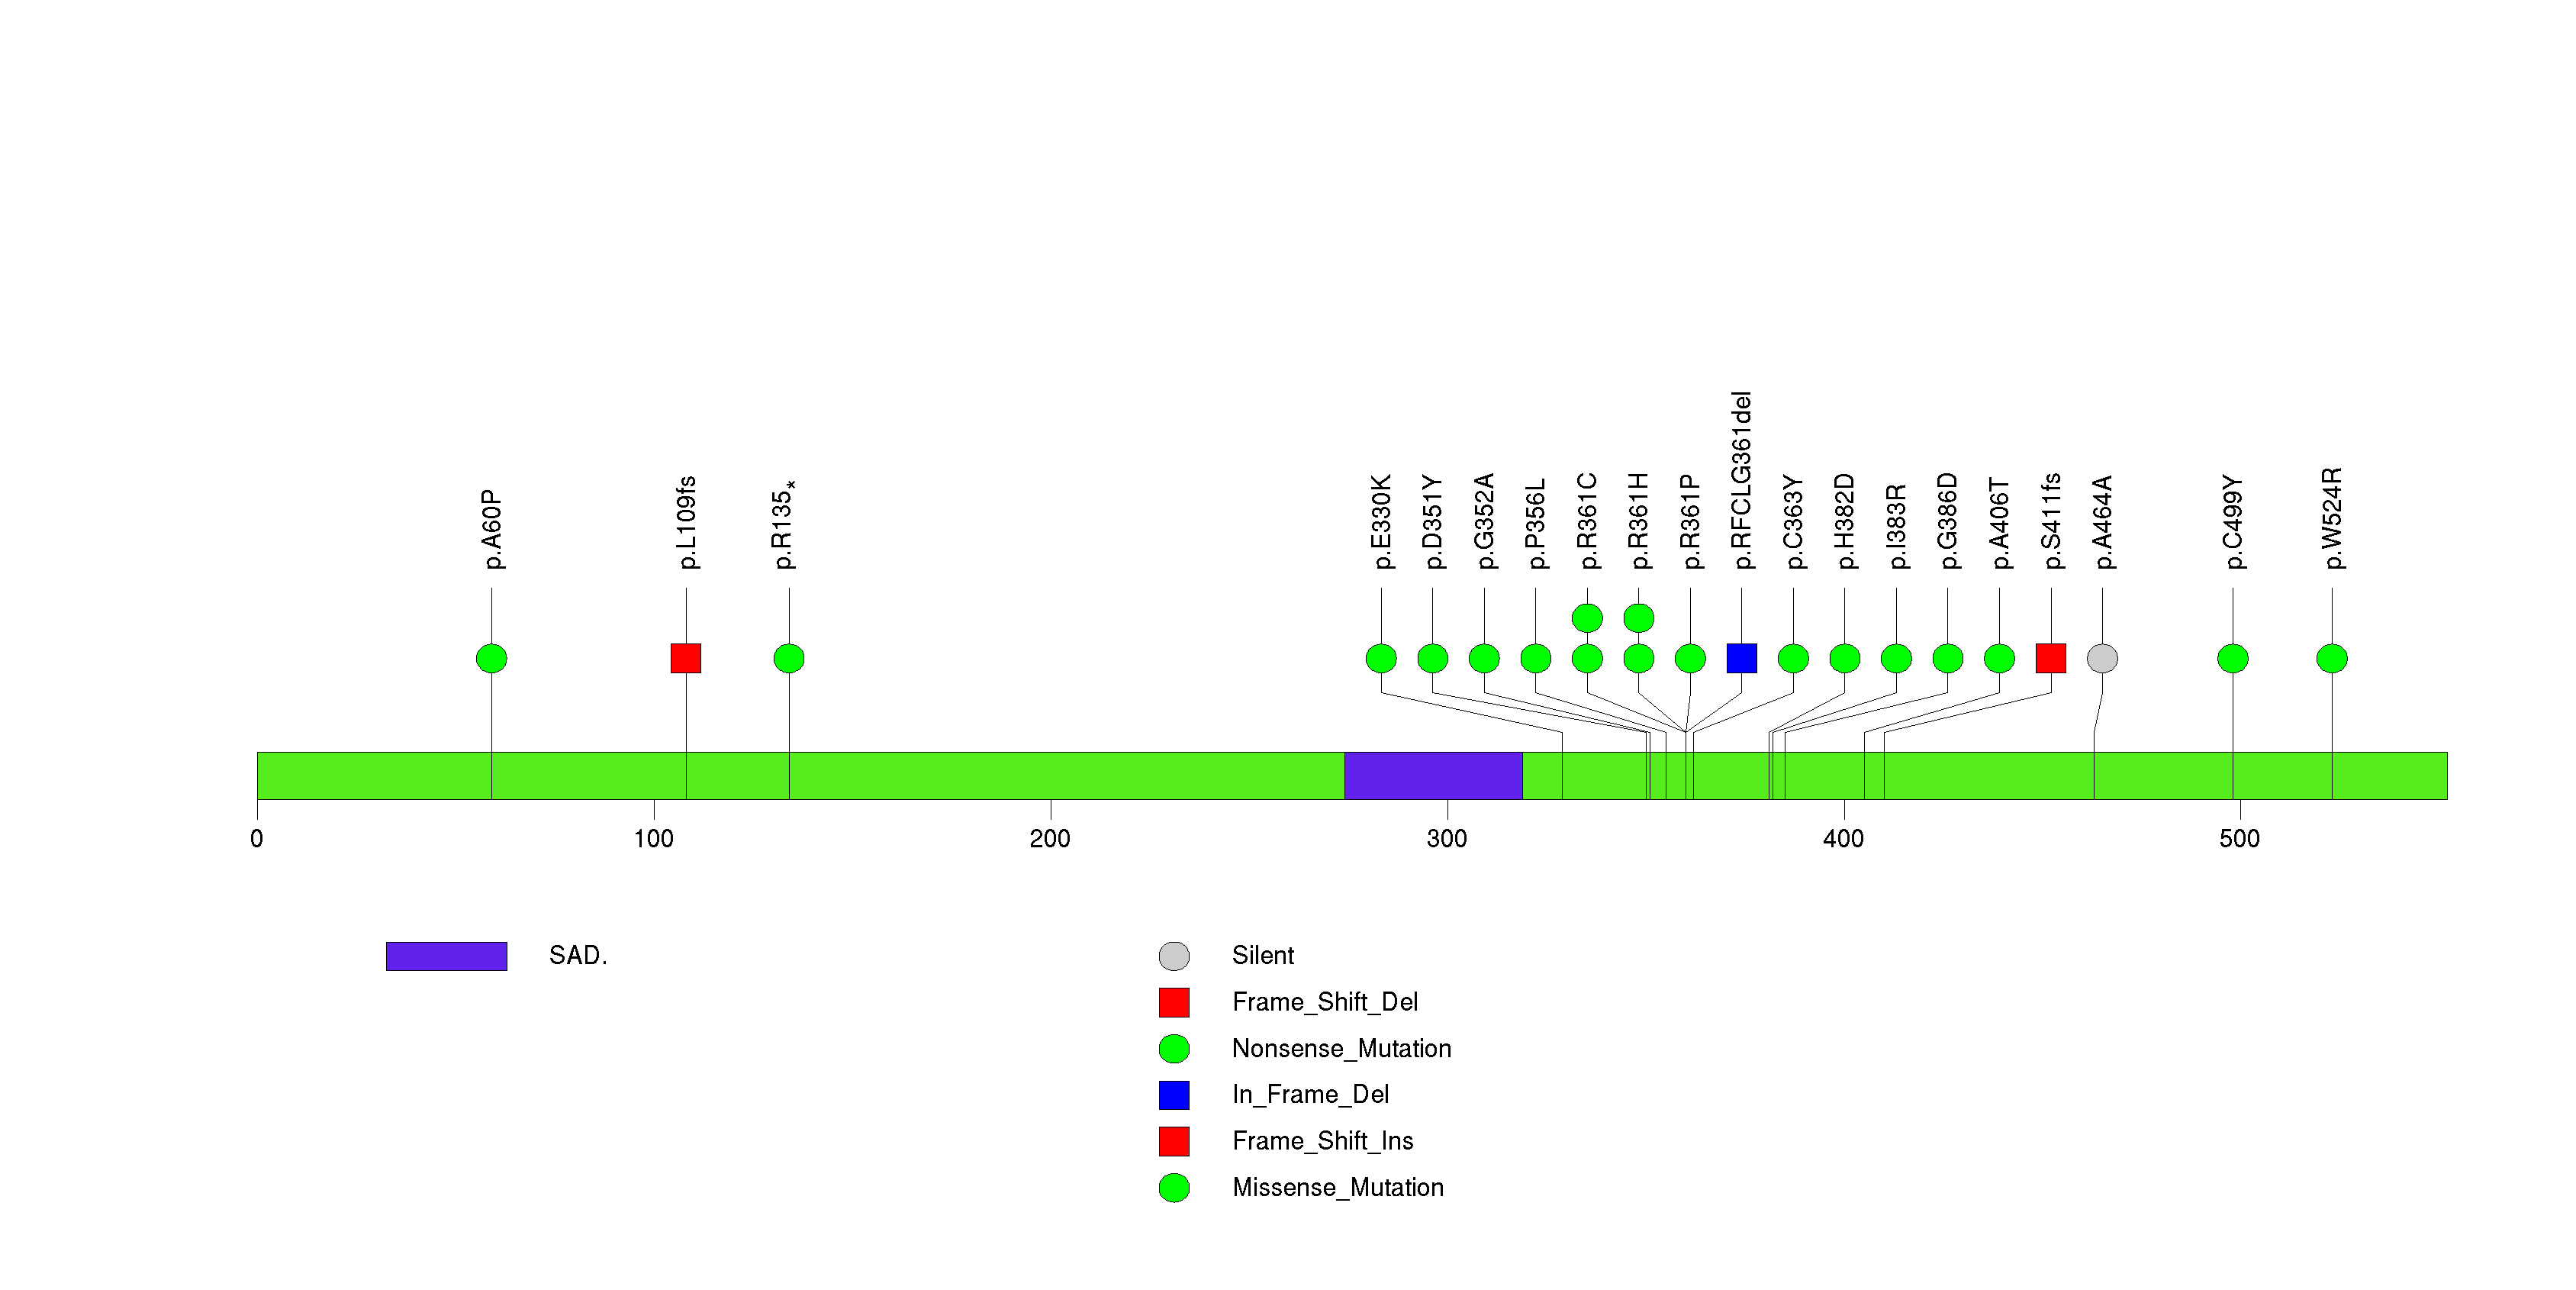
Figure S8. This figure depicts the distribution of mutations and mutation types across the PGM5 significant gene.
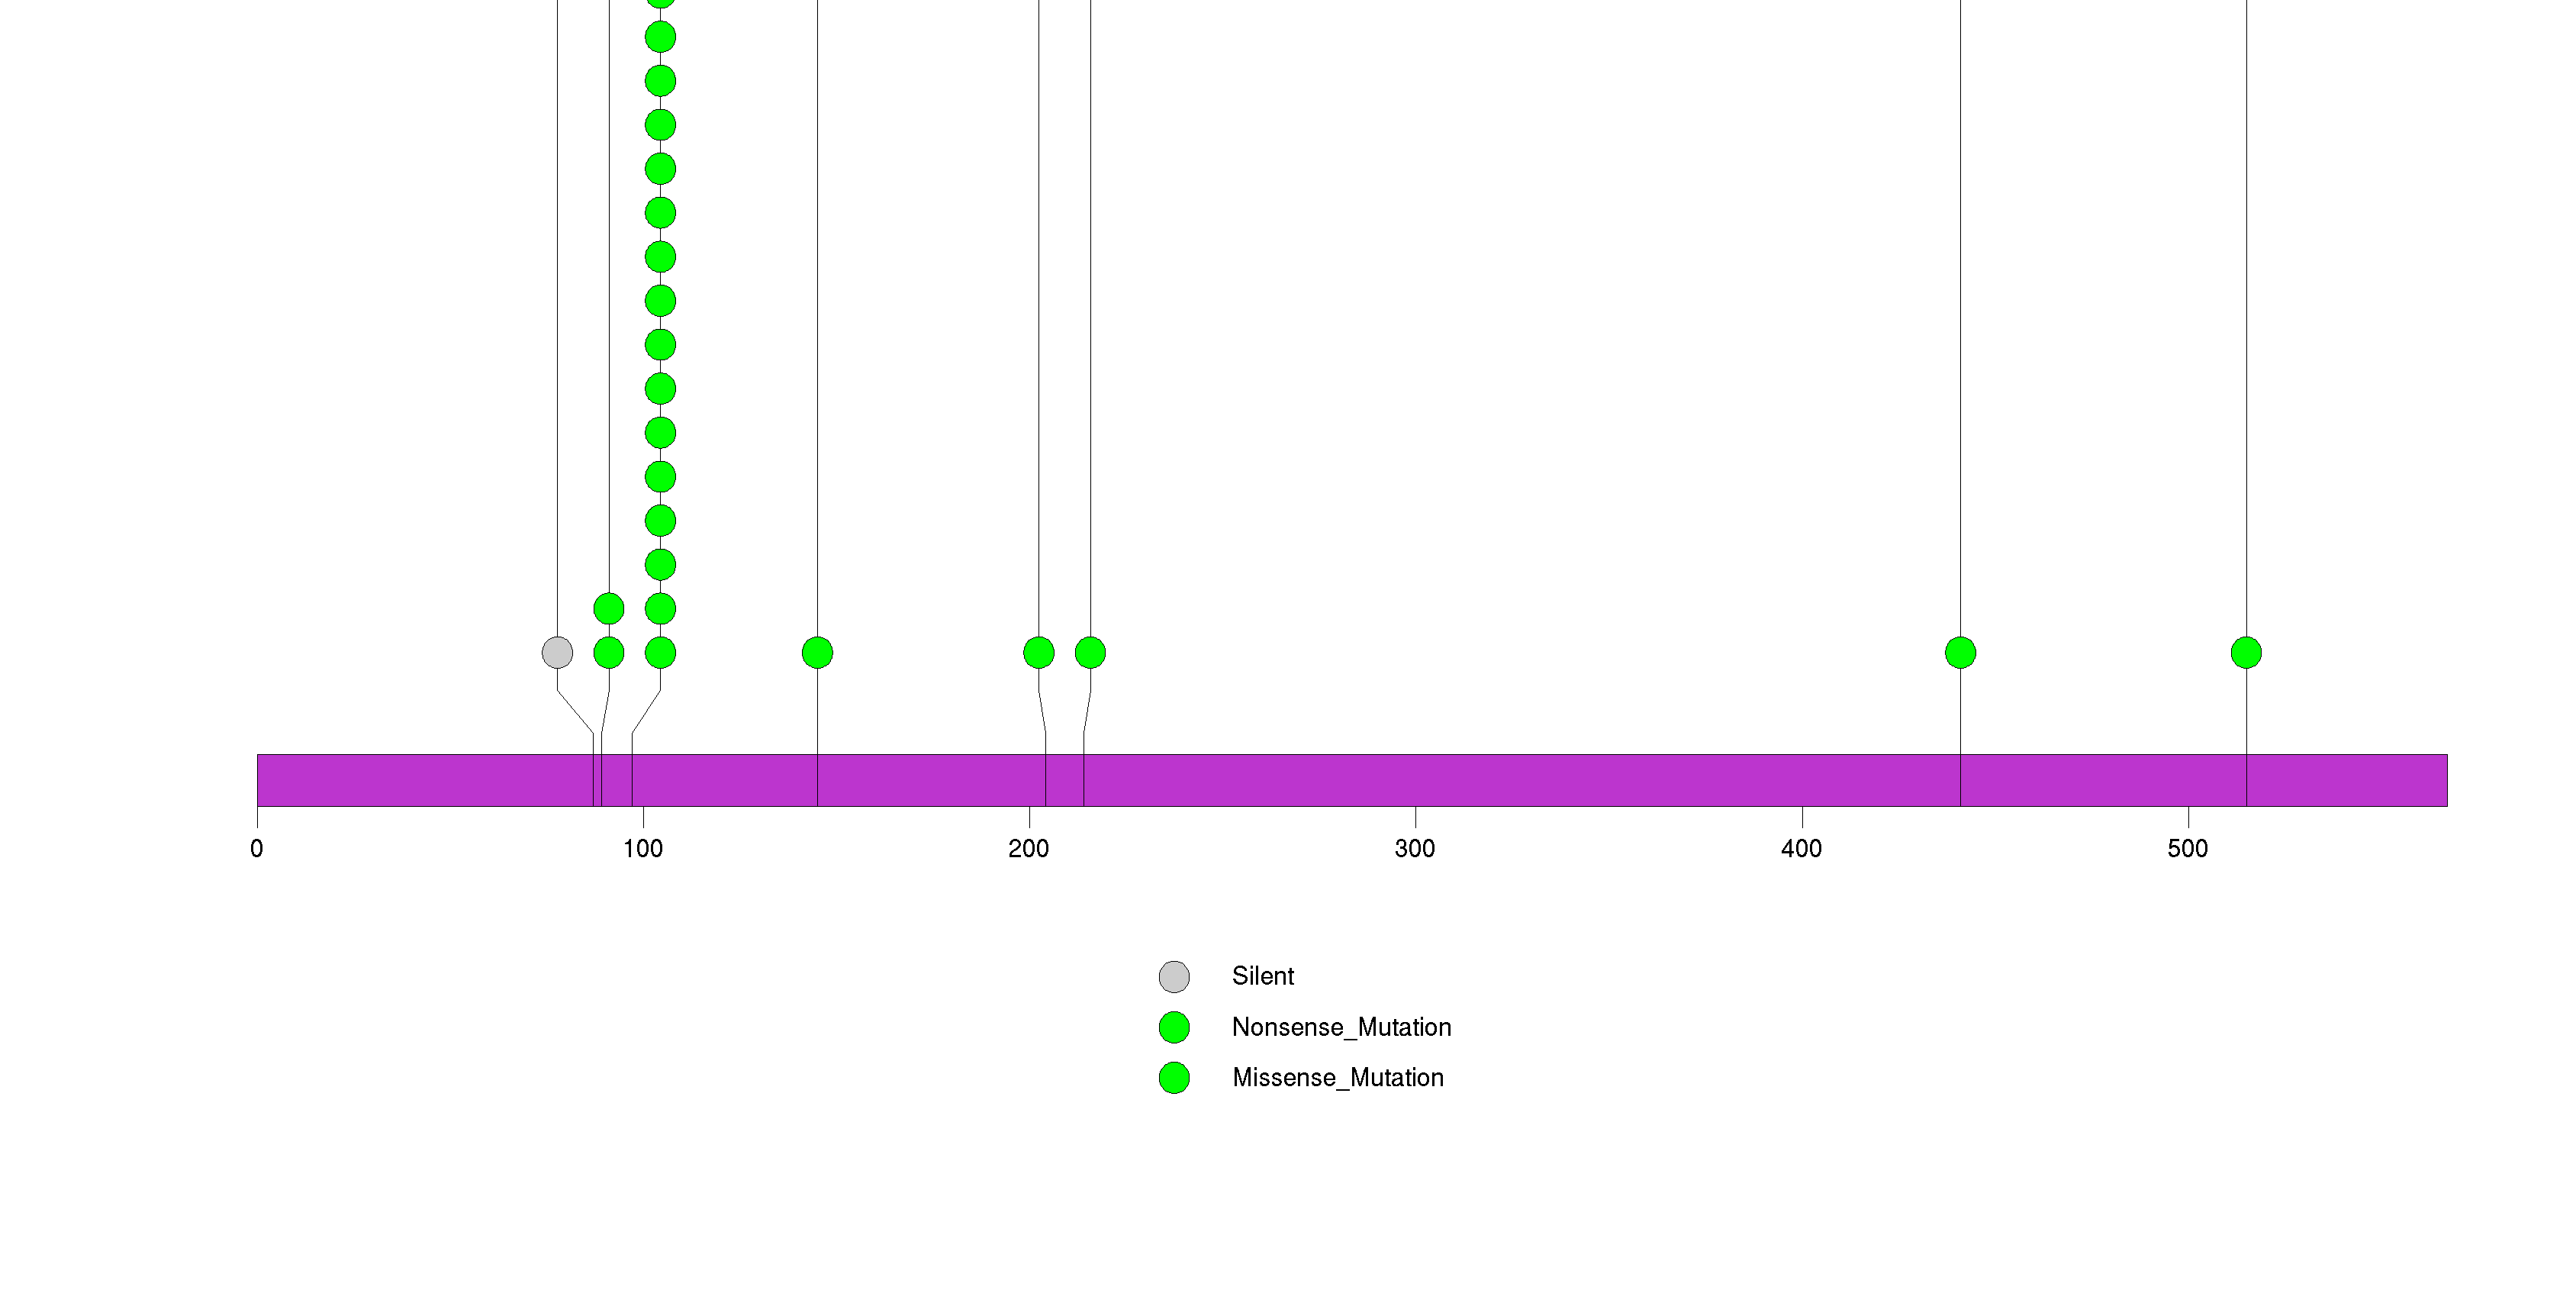
Figure S9. This figure depicts the distribution of mutations and mutation types across the TRIM48 significant gene.
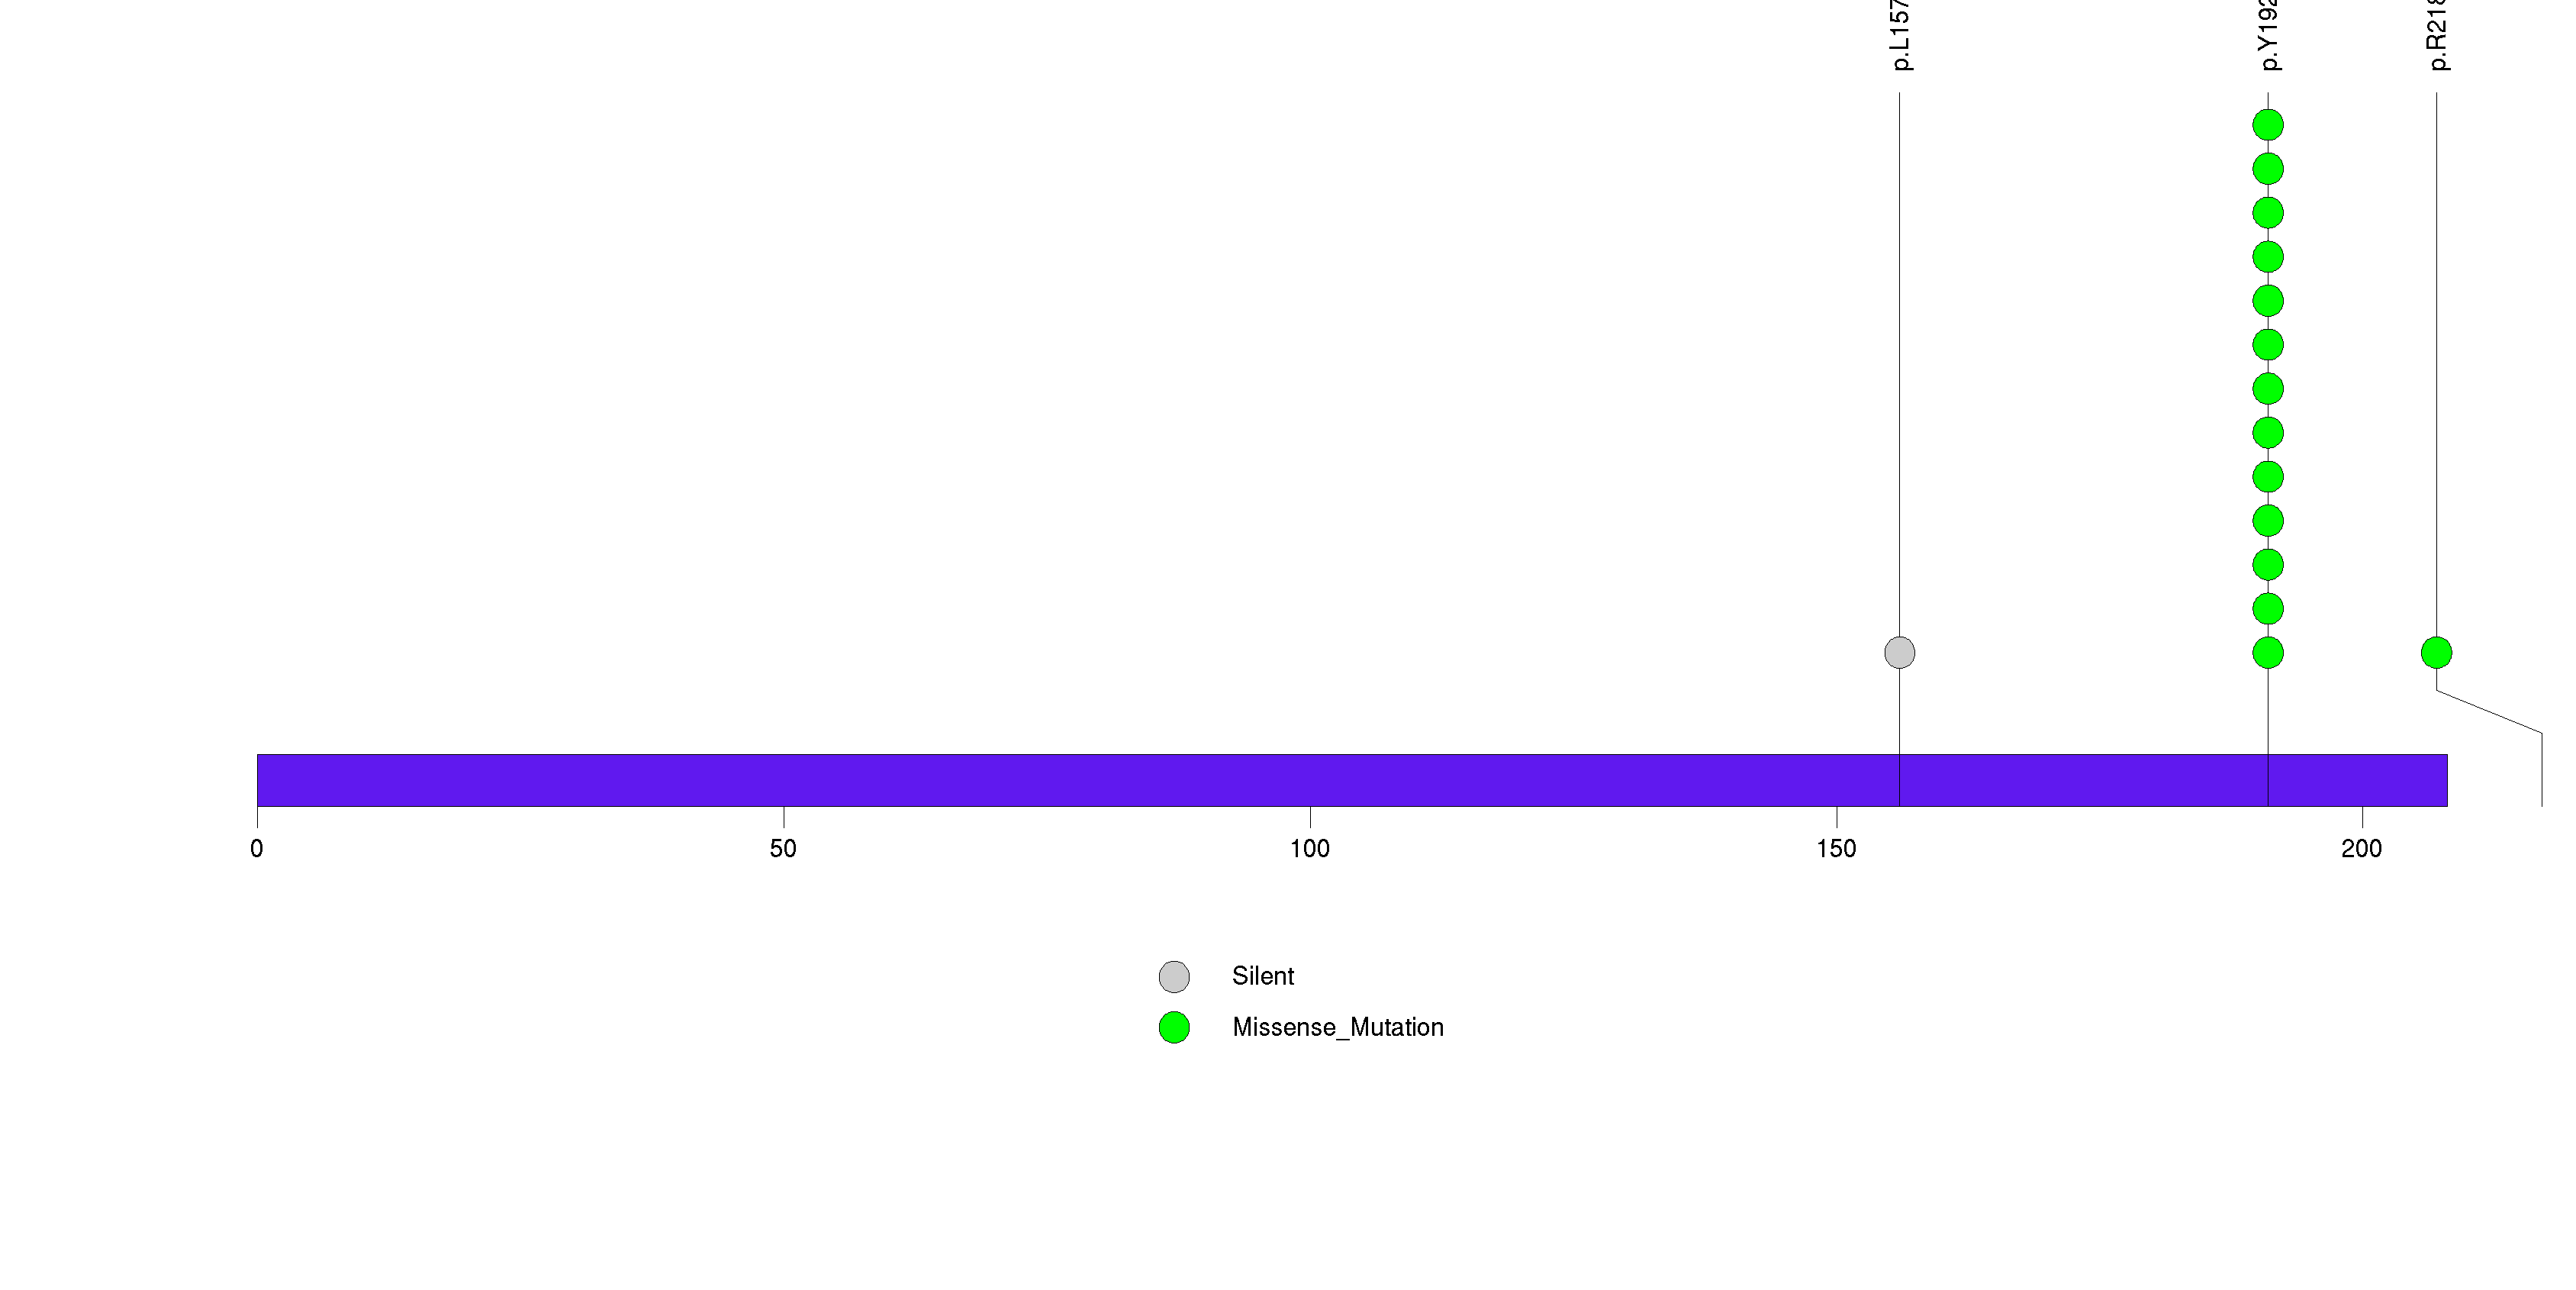
Figure S10. This figure depicts the distribution of mutations and mutation types across the SLITRK6 significant gene.
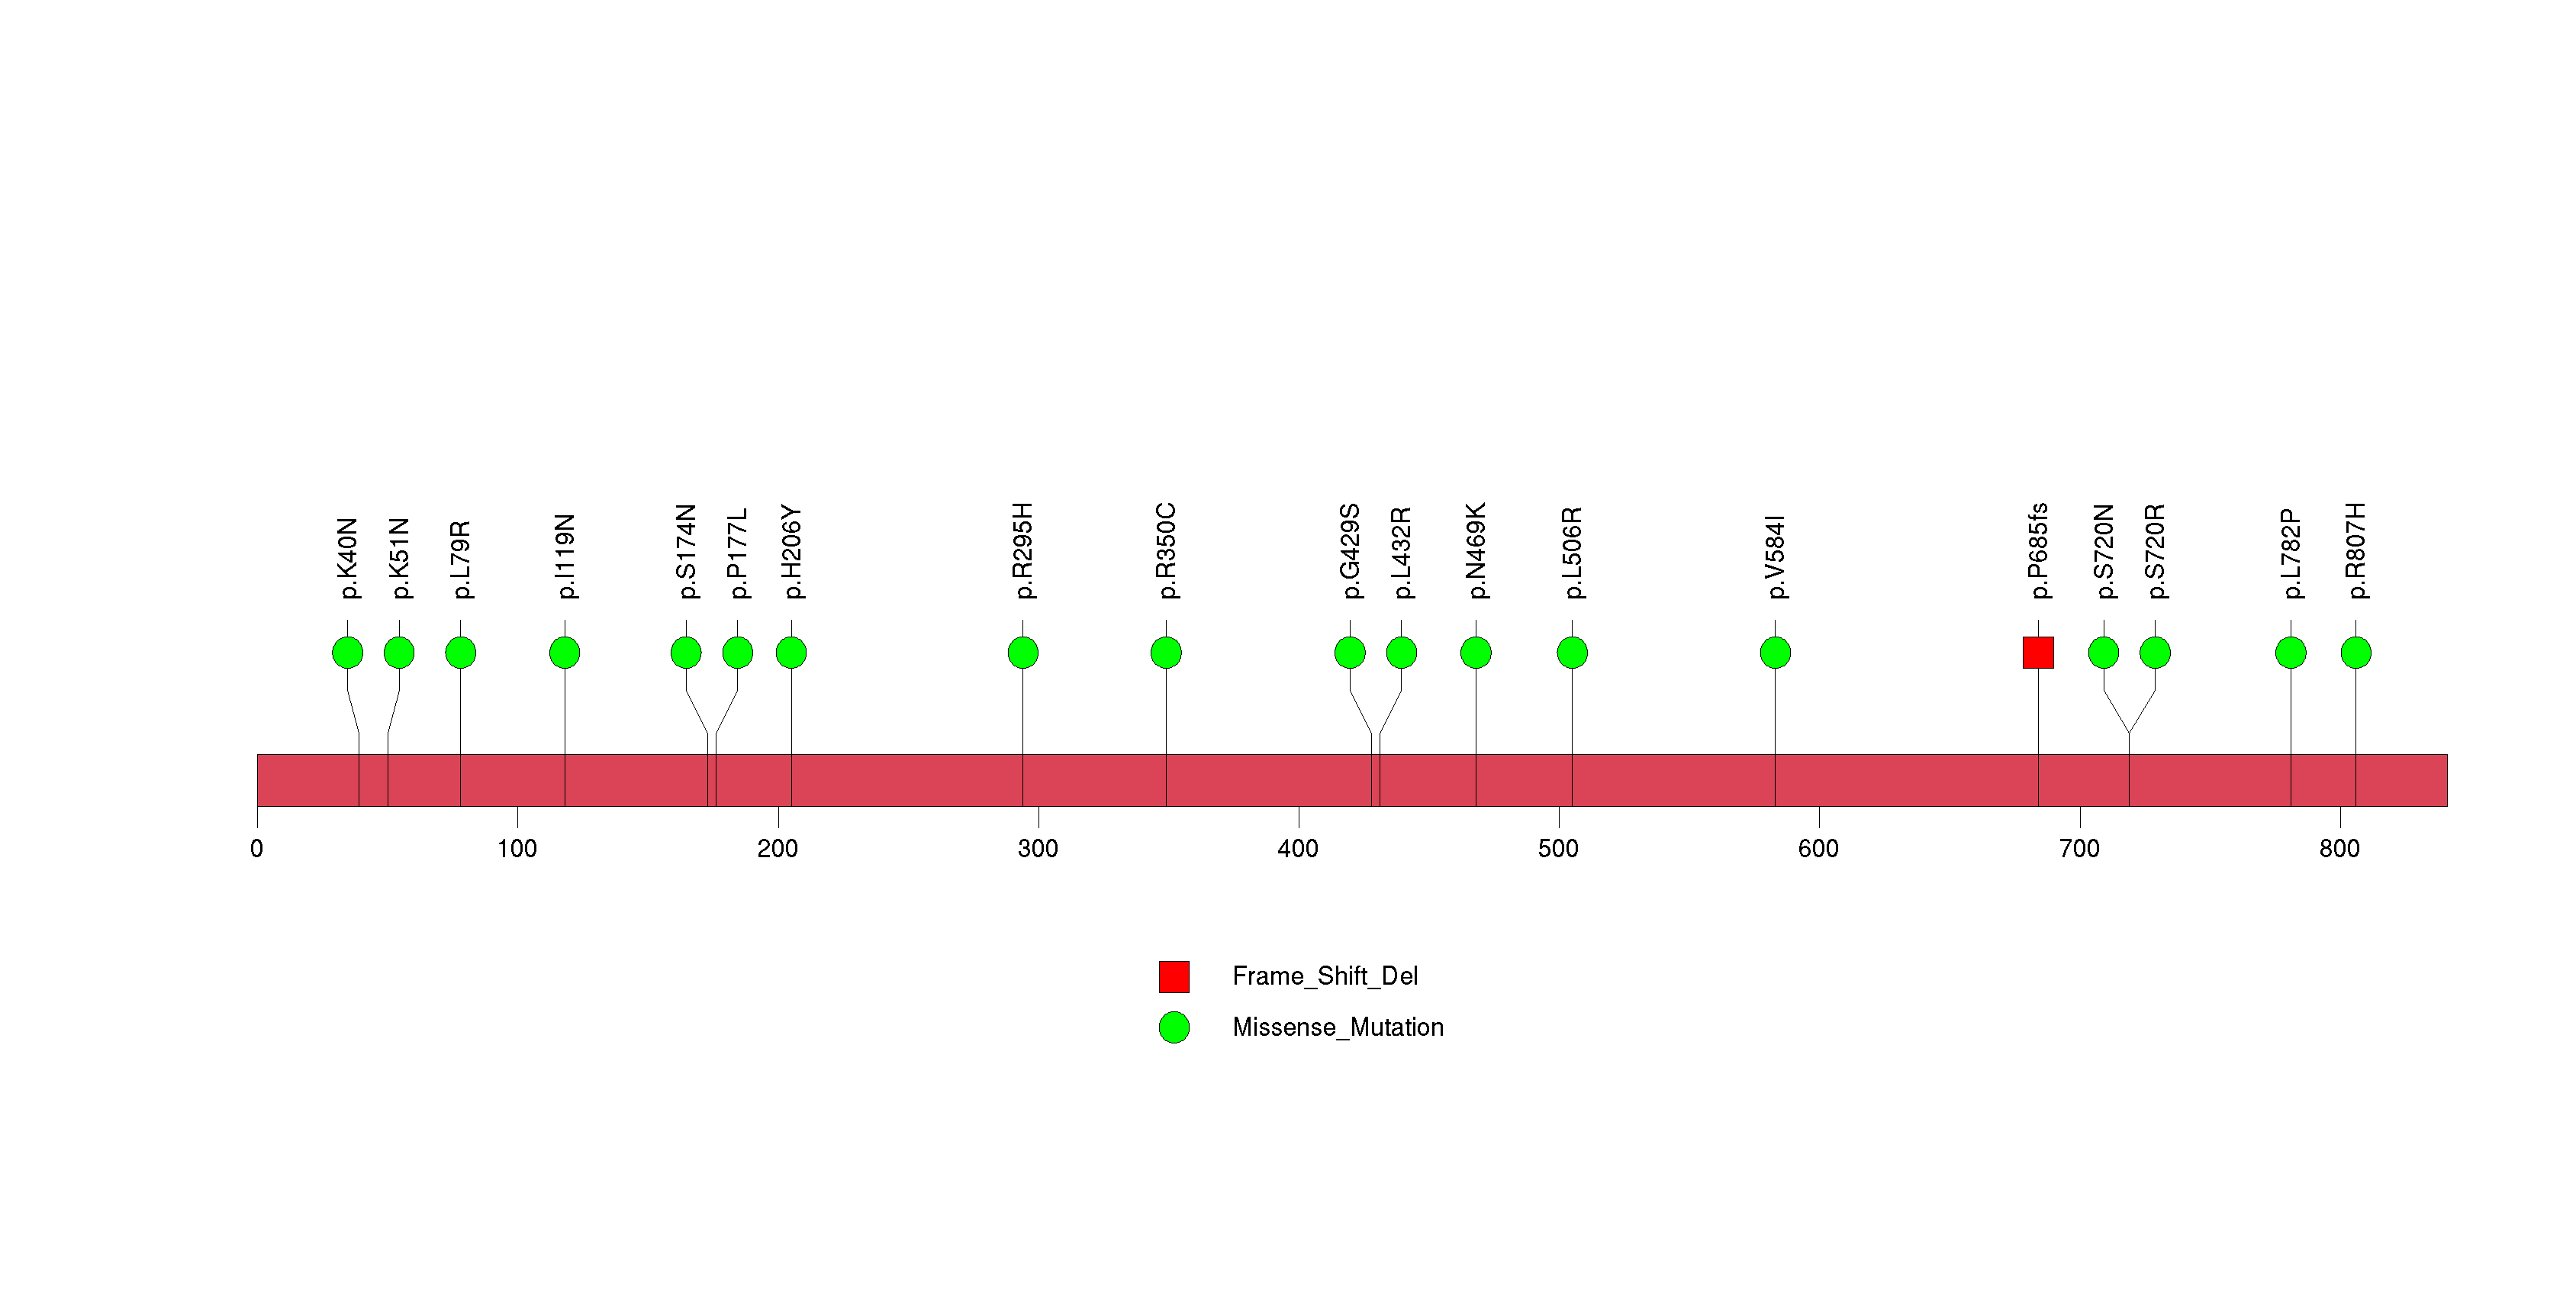
Figure S11. This figure depicts the distribution of mutations and mutation types across the TUSC3 significant gene.
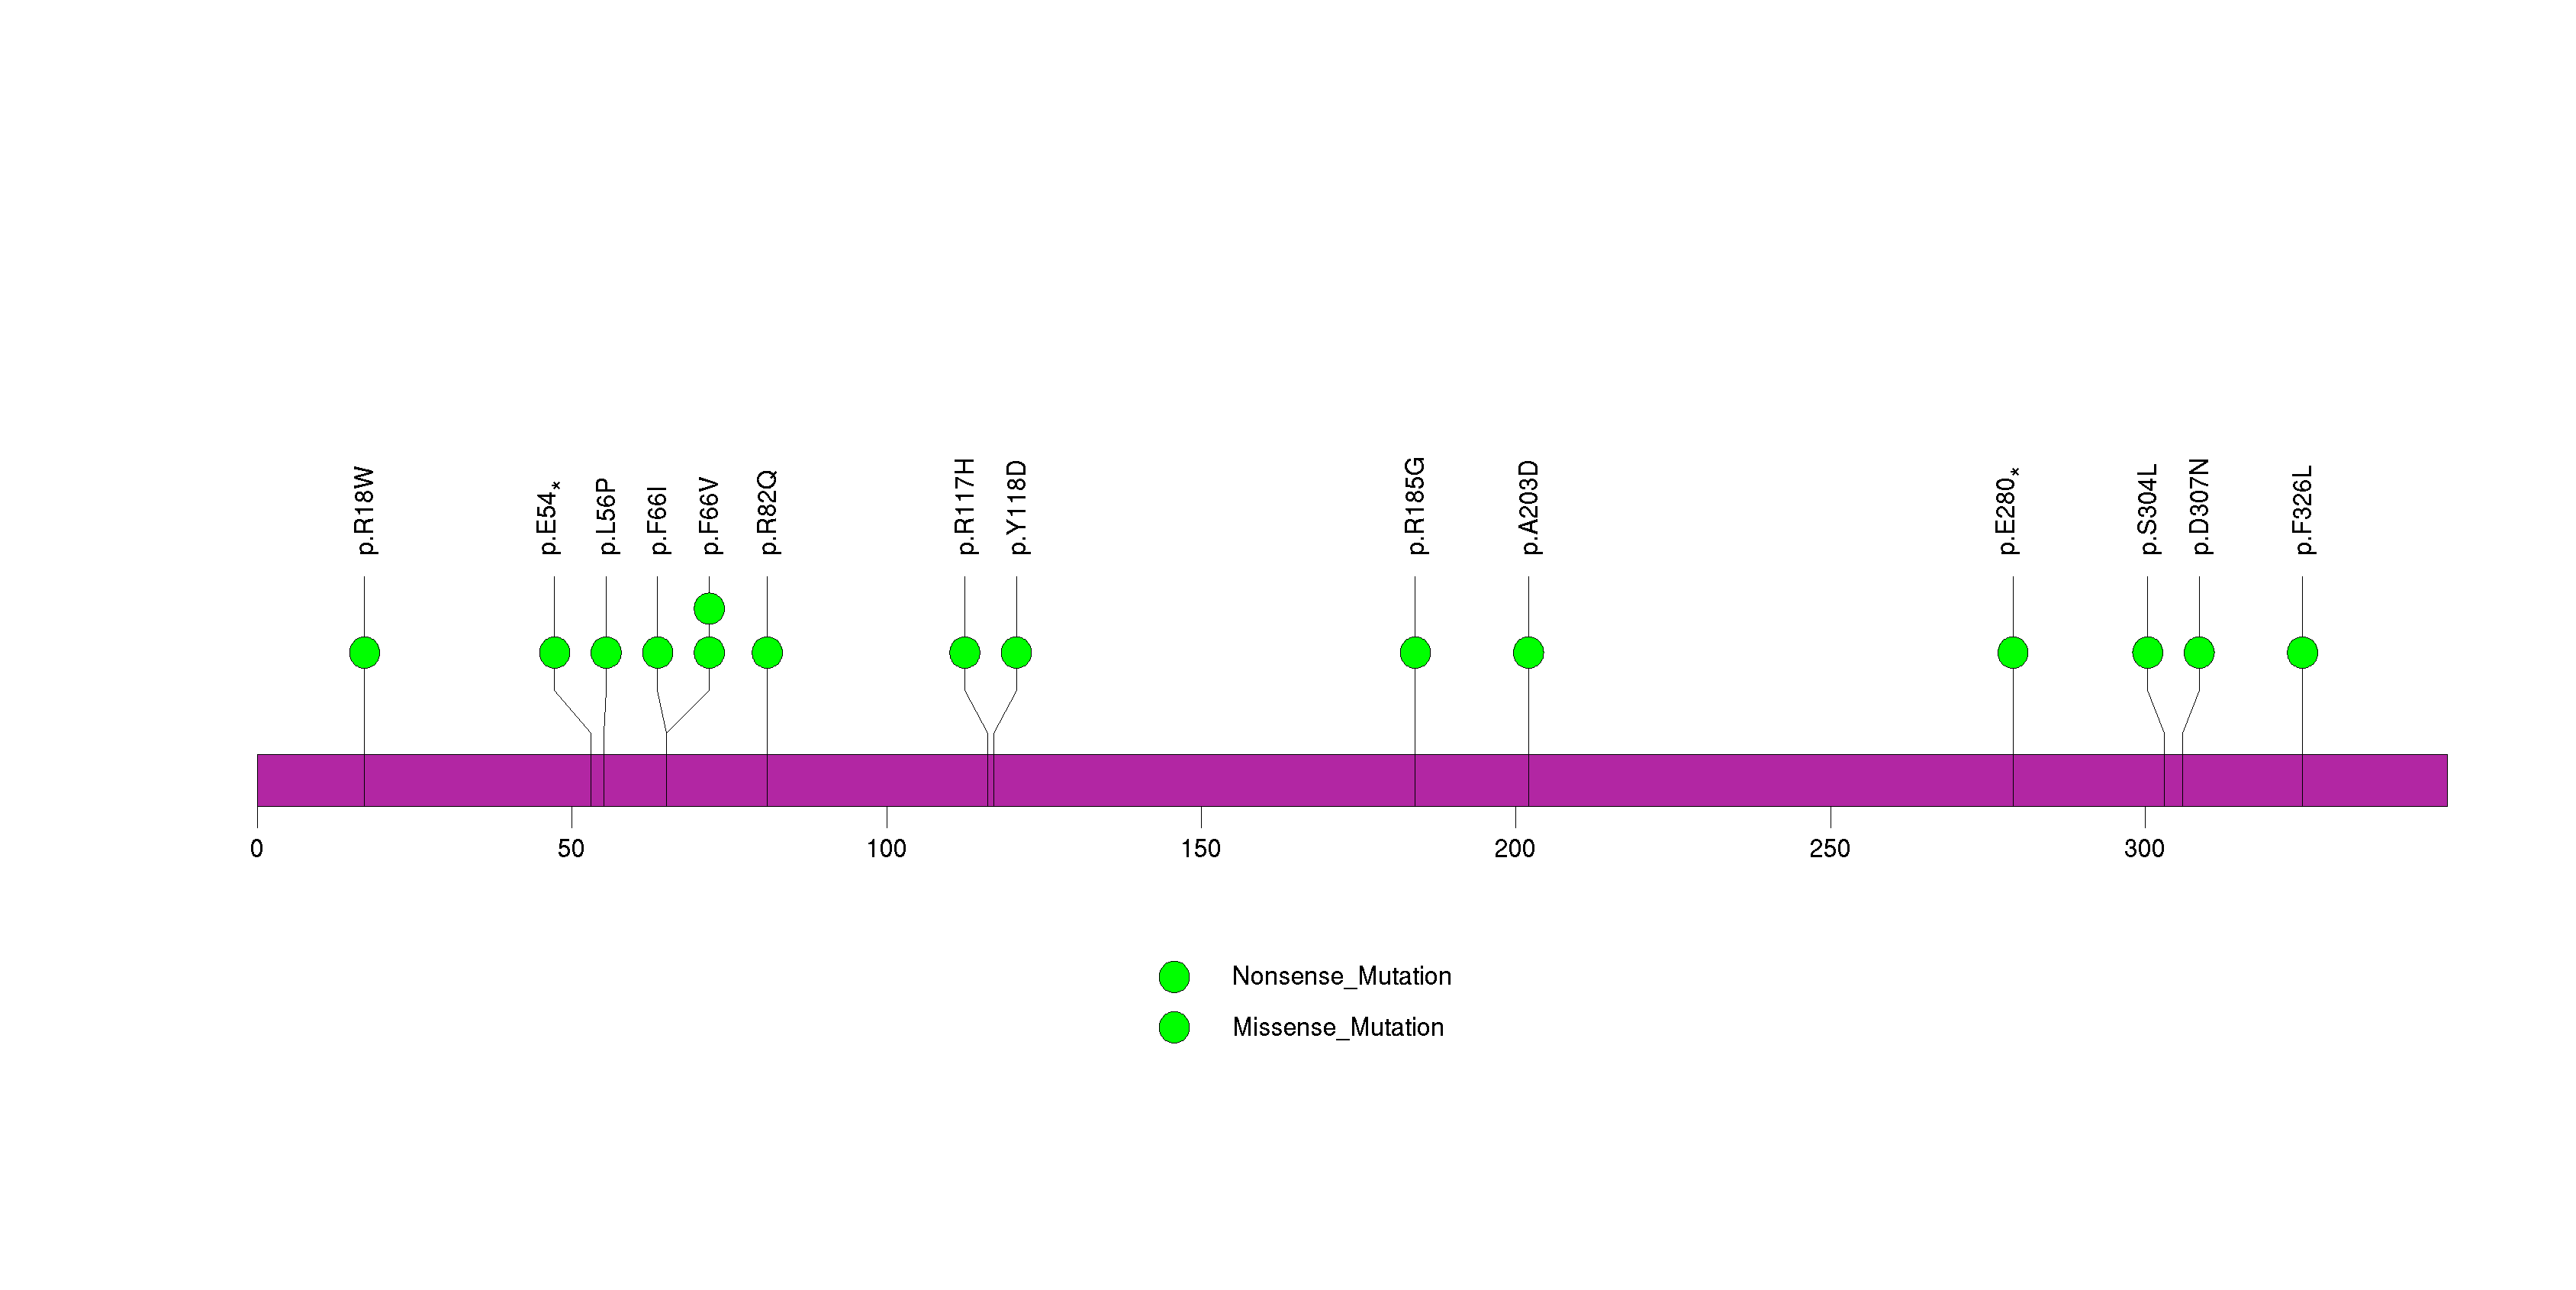
Figure S12. This figure depicts the distribution of mutations and mutation types across the ZNF804B significant gene.
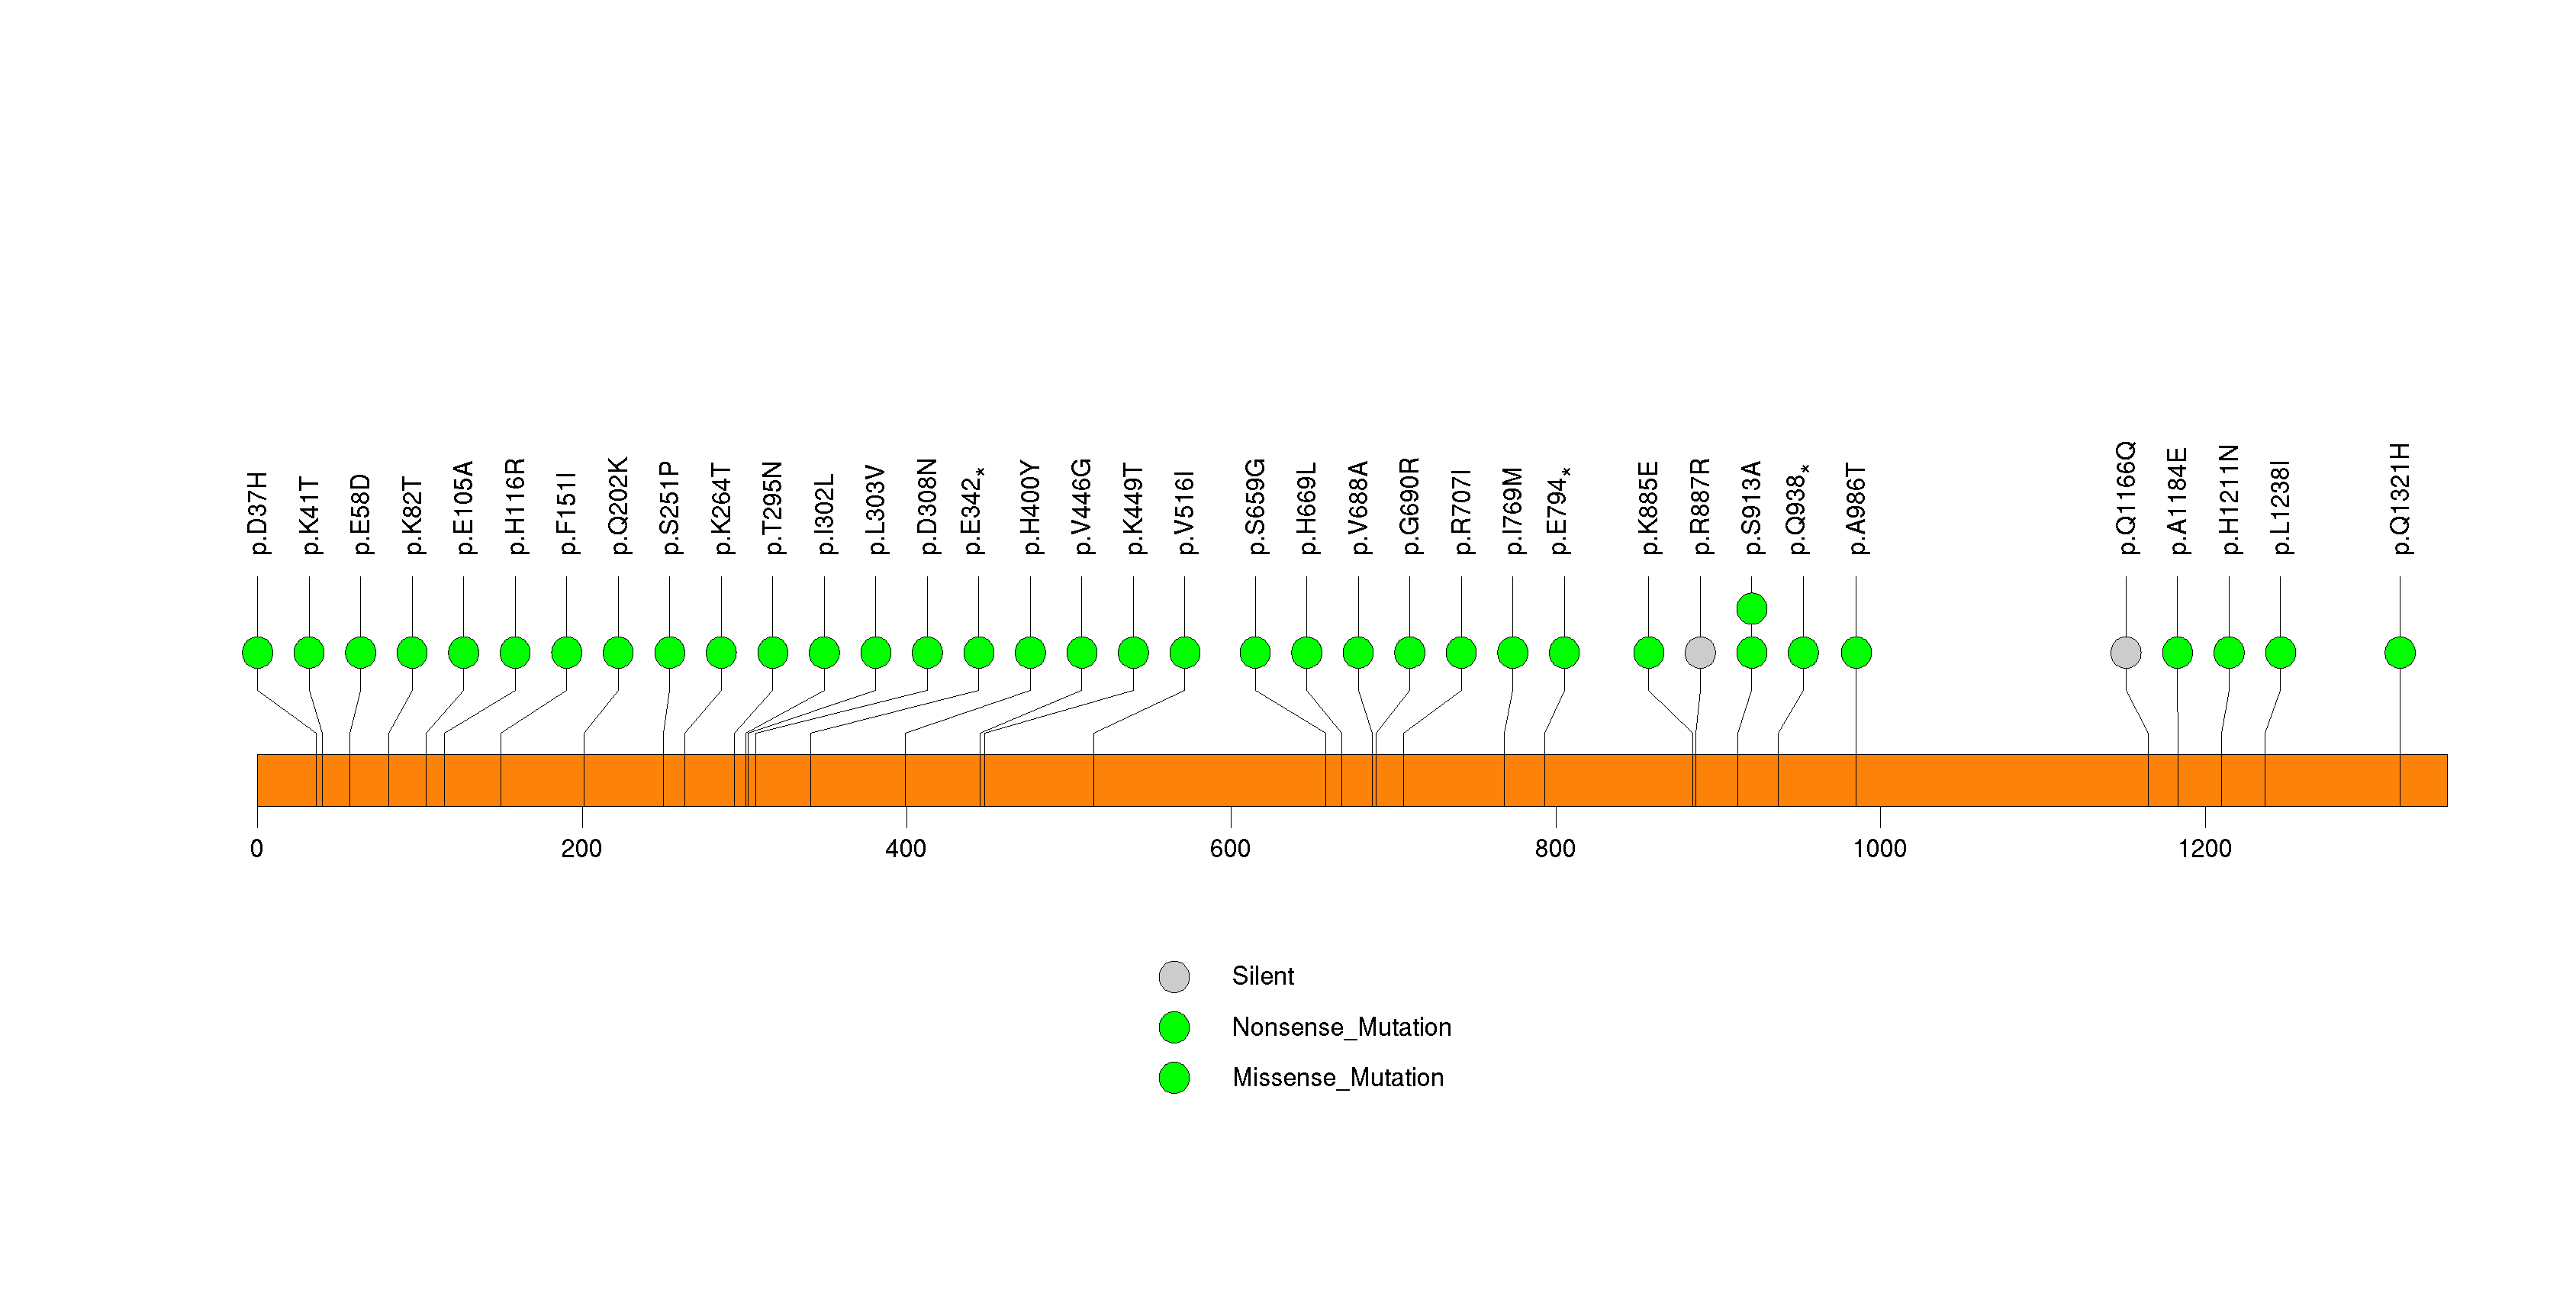
Figure S13. This figure depicts the distribution of mutations and mutation types across the IRF2 significant gene.
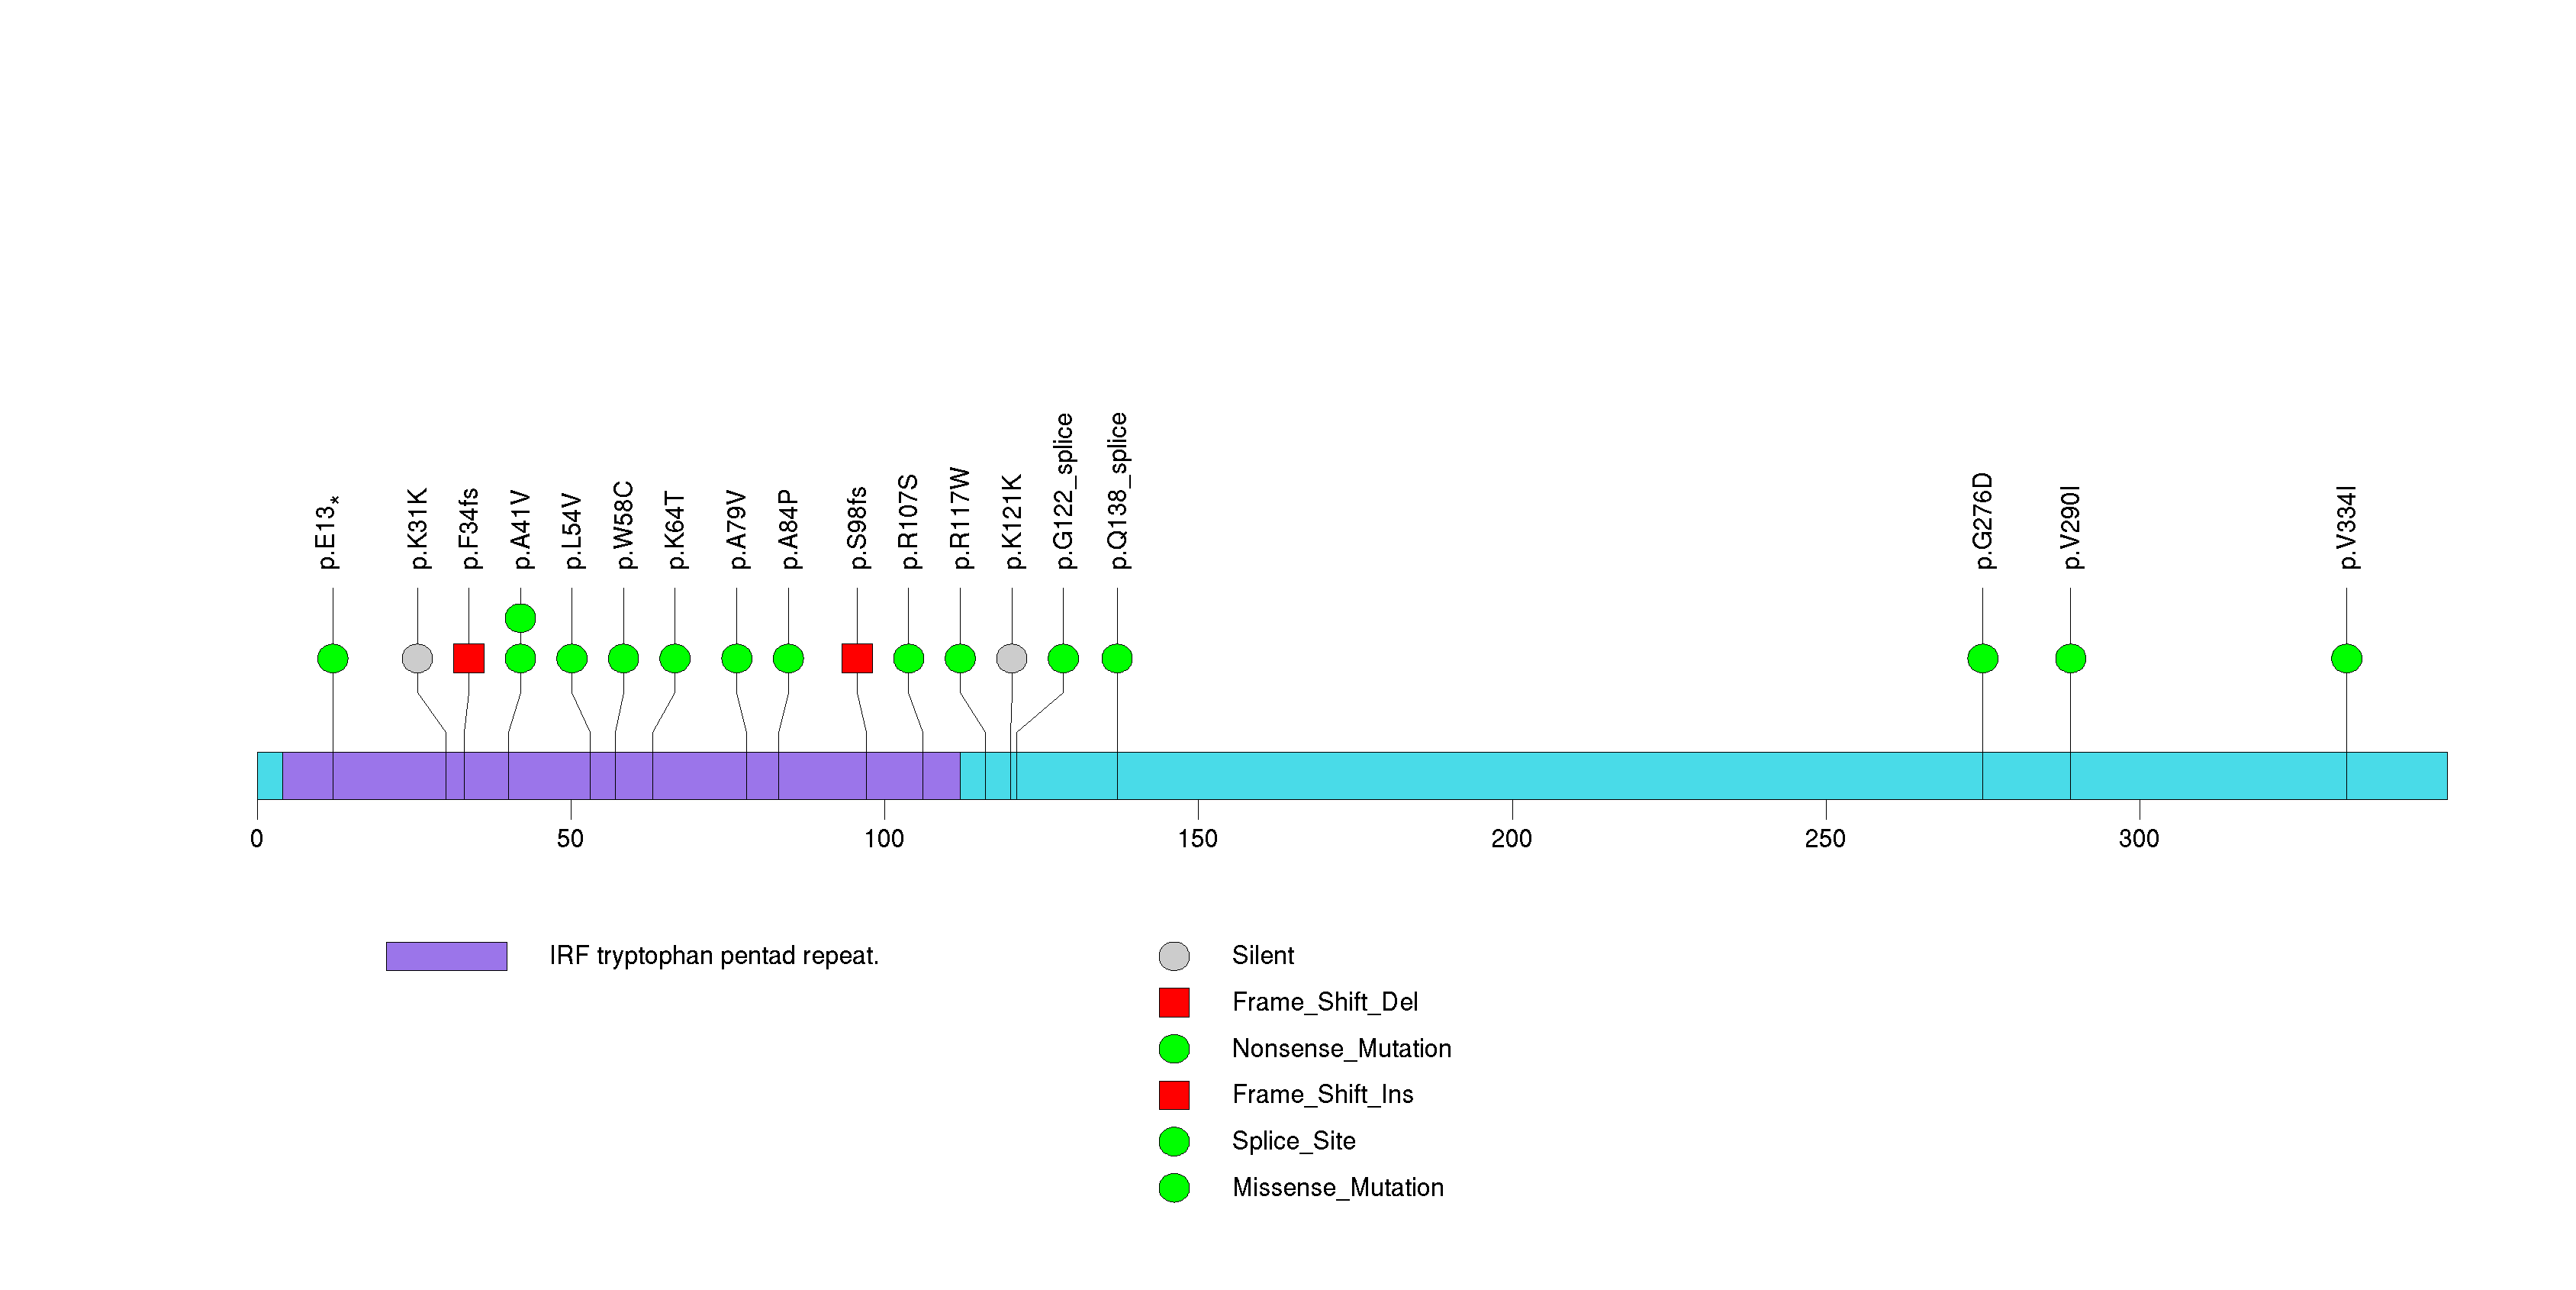
Figure S14. This figure depicts the distribution of mutations and mutation types across the MAP2K7 significant gene.
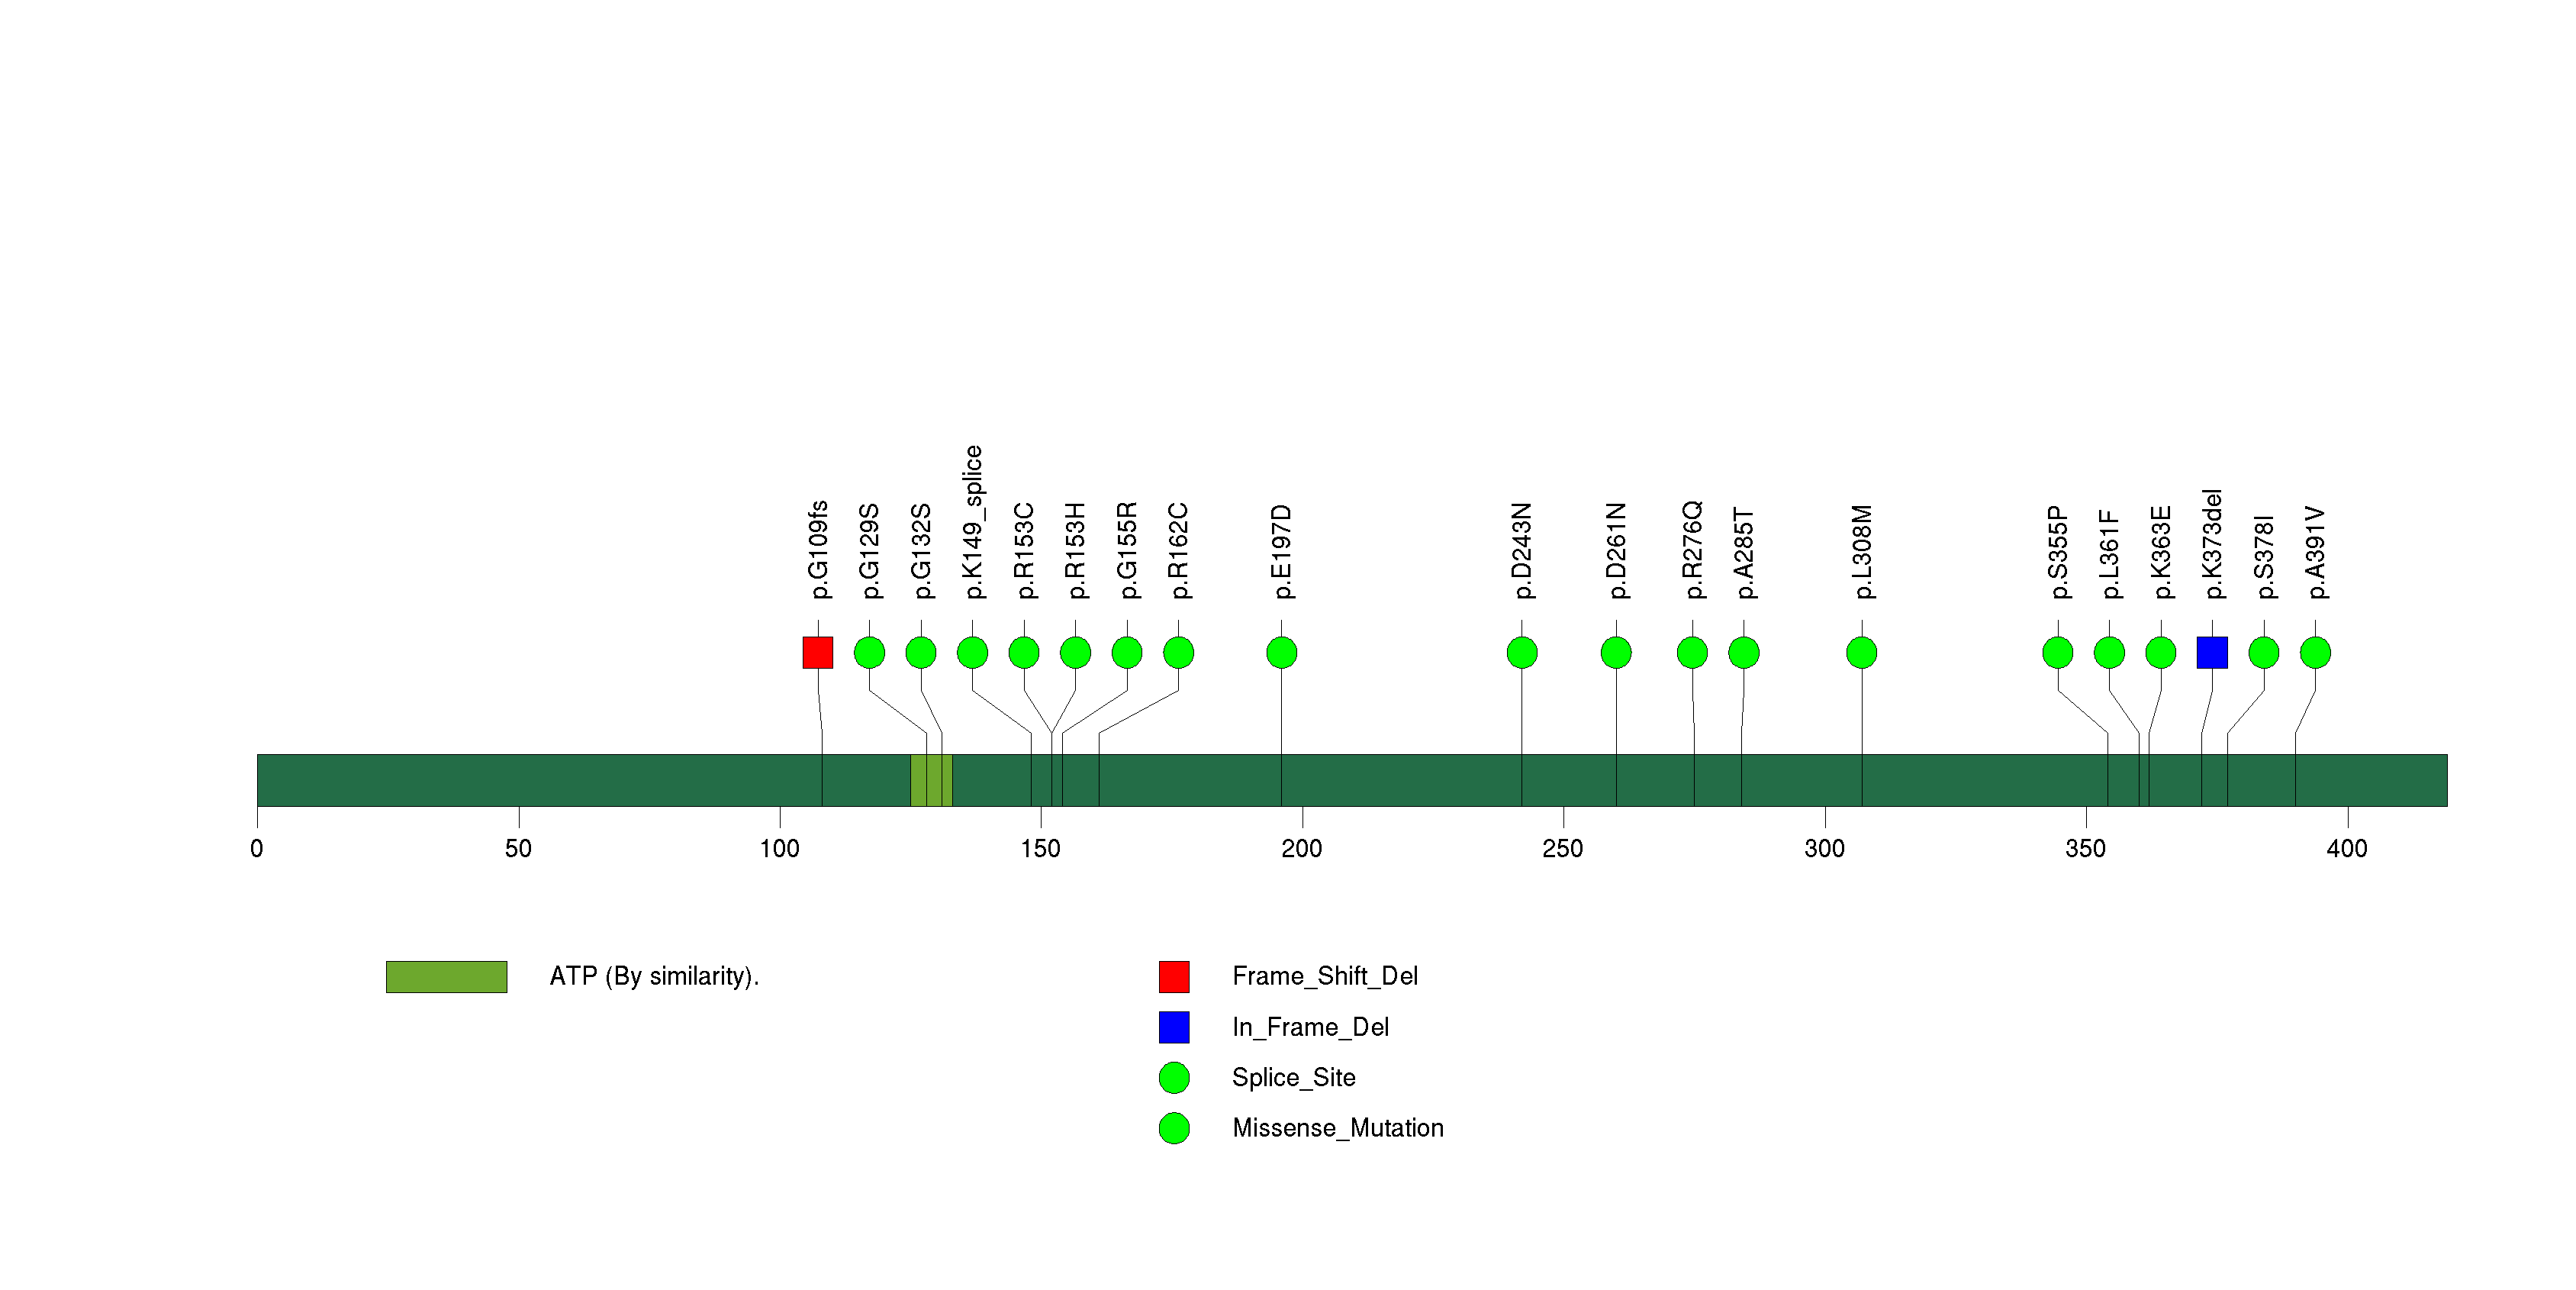
Figure S15. This figure depicts the distribution of mutations and mutation types across the B2M significant gene.
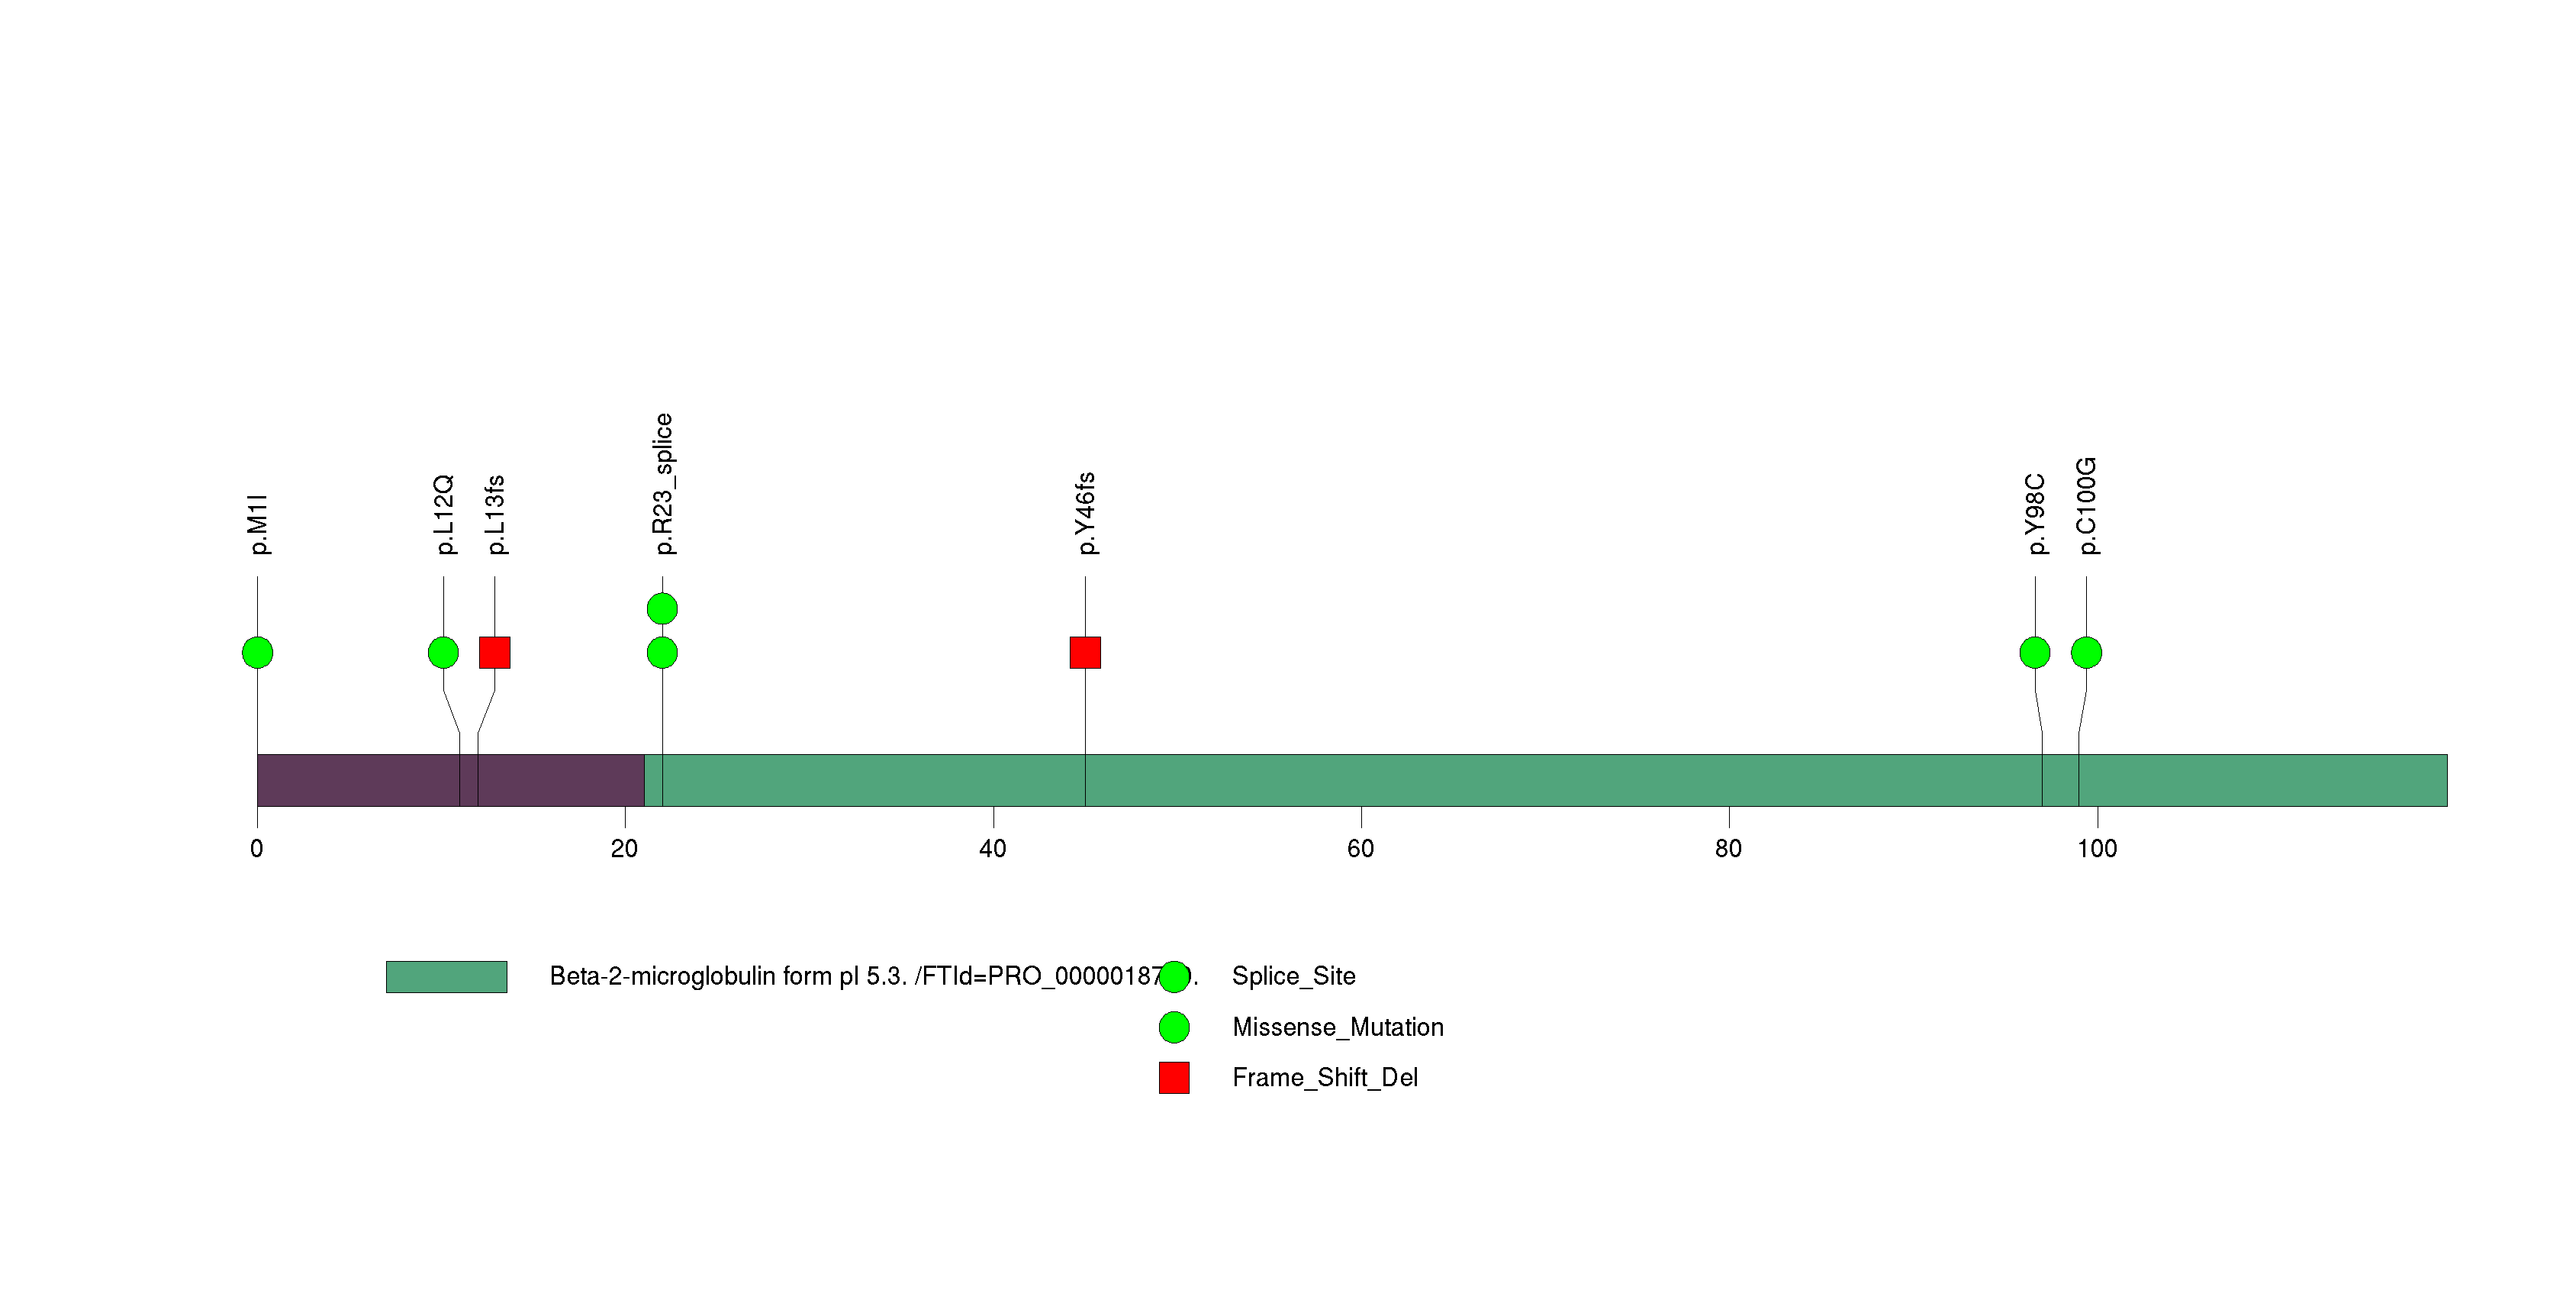
Figure S16. This figure depicts the distribution of mutations and mutation types across the FBXW7 significant gene.
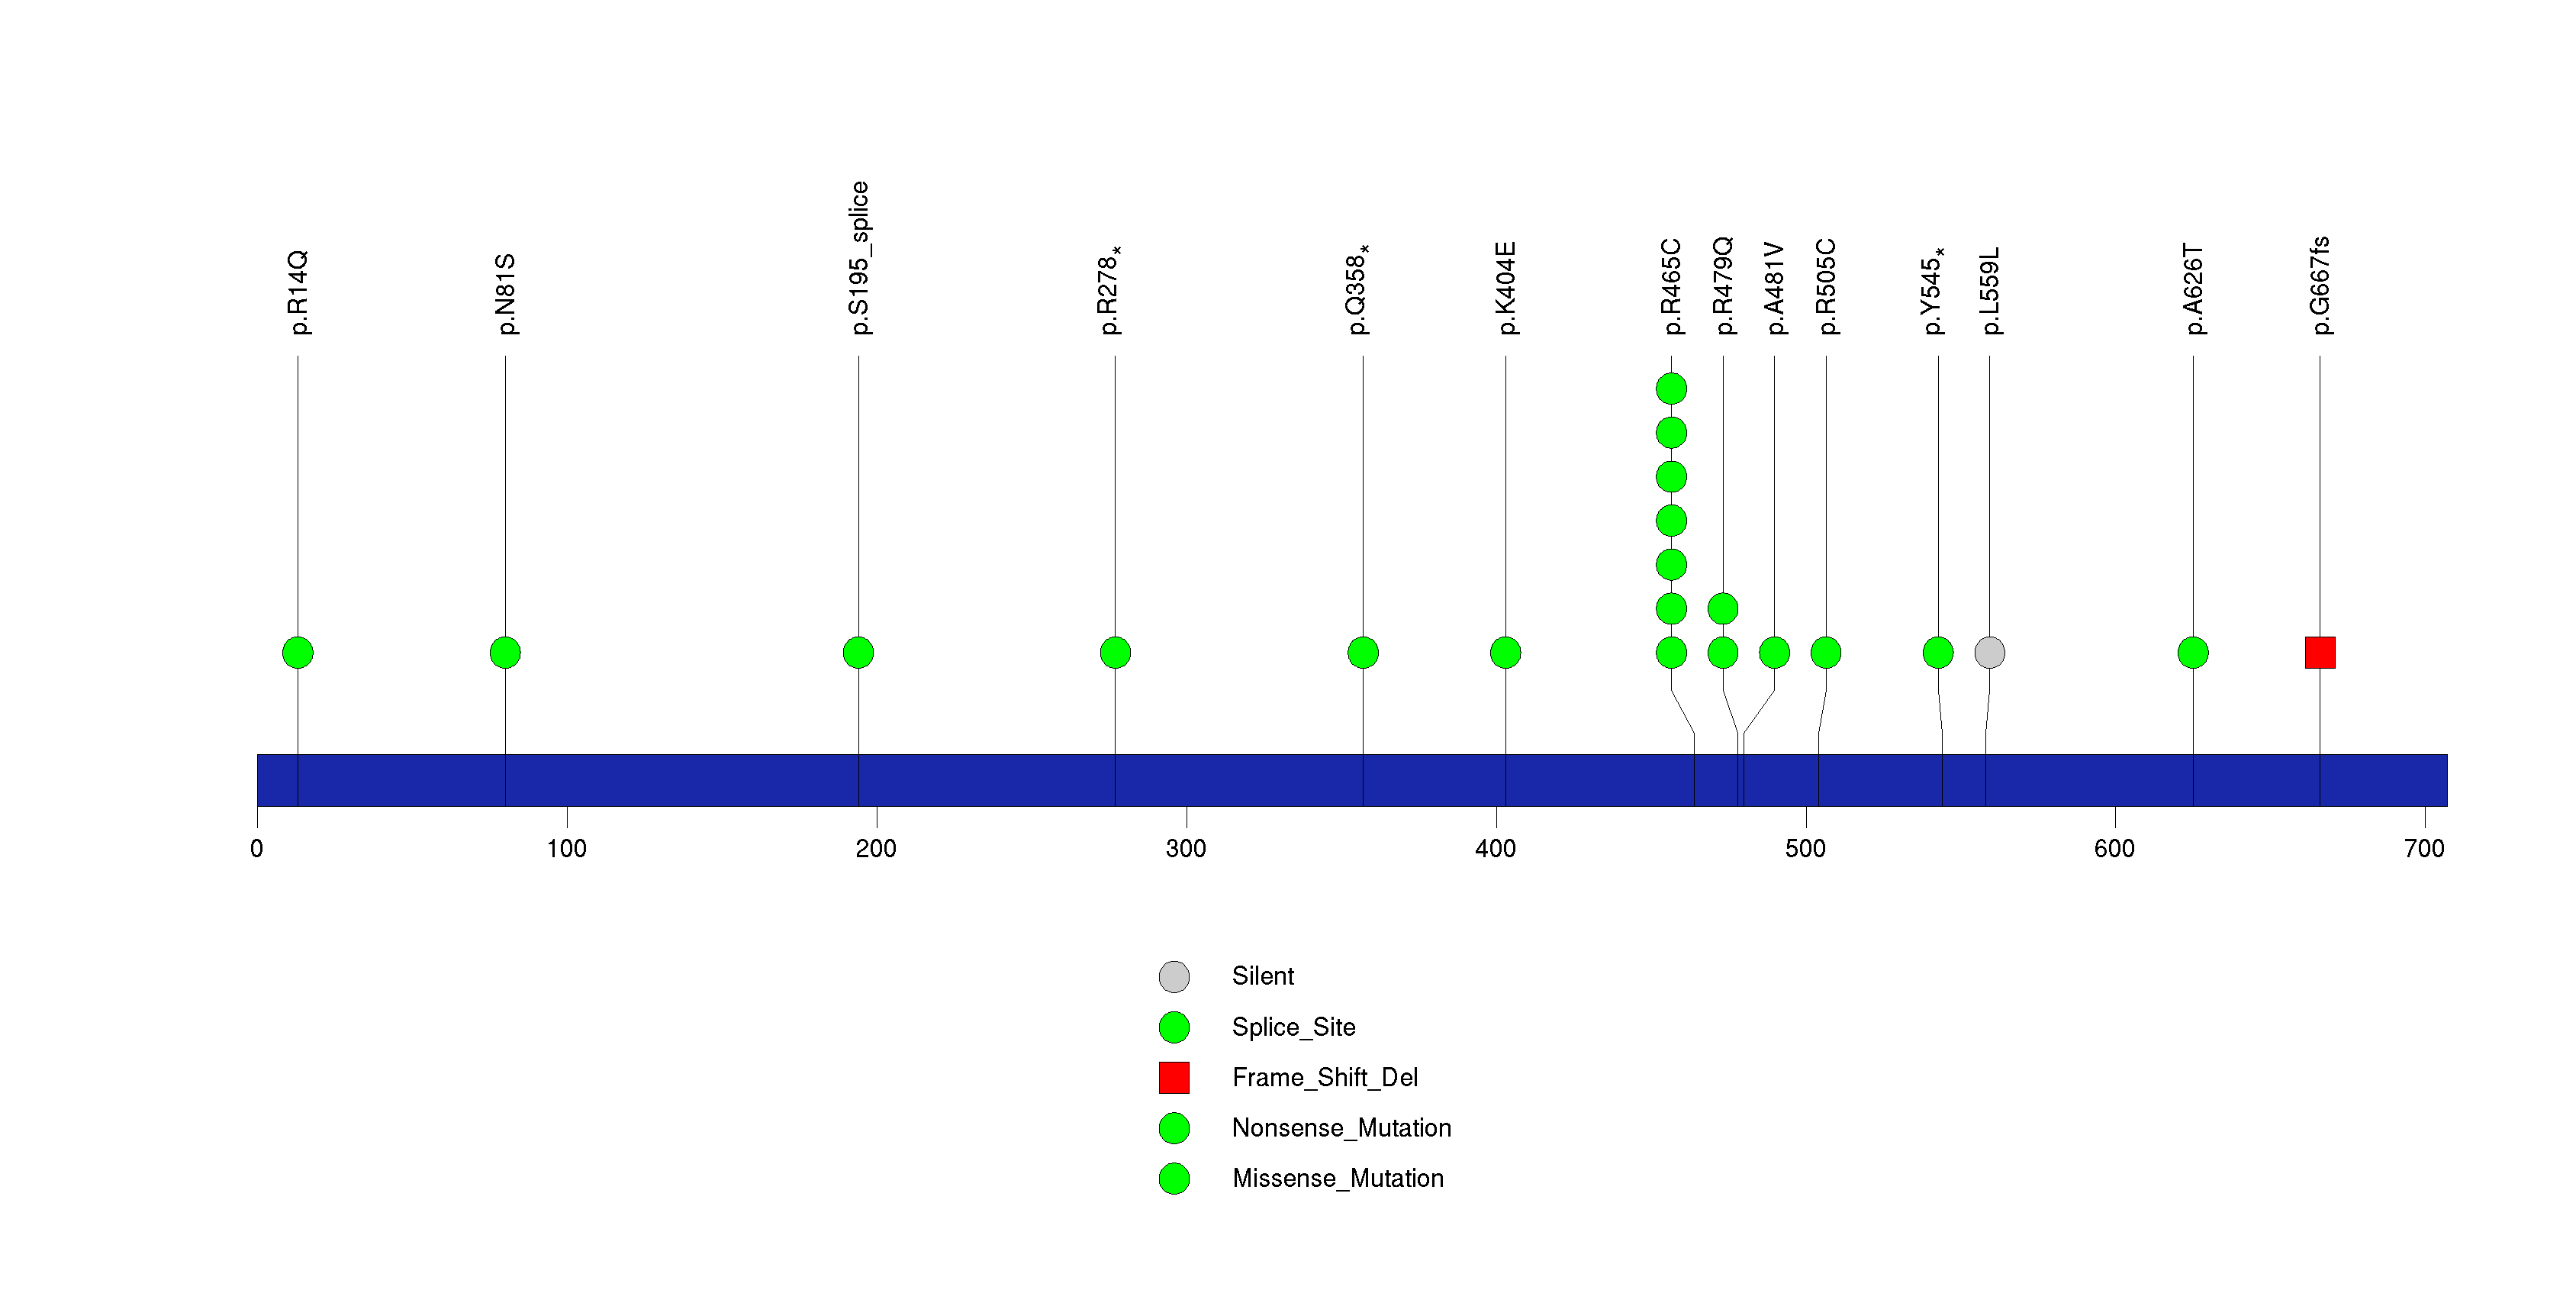
Figure S17. This figure depicts the distribution of mutations and mutation types across the EDNRB significant gene.
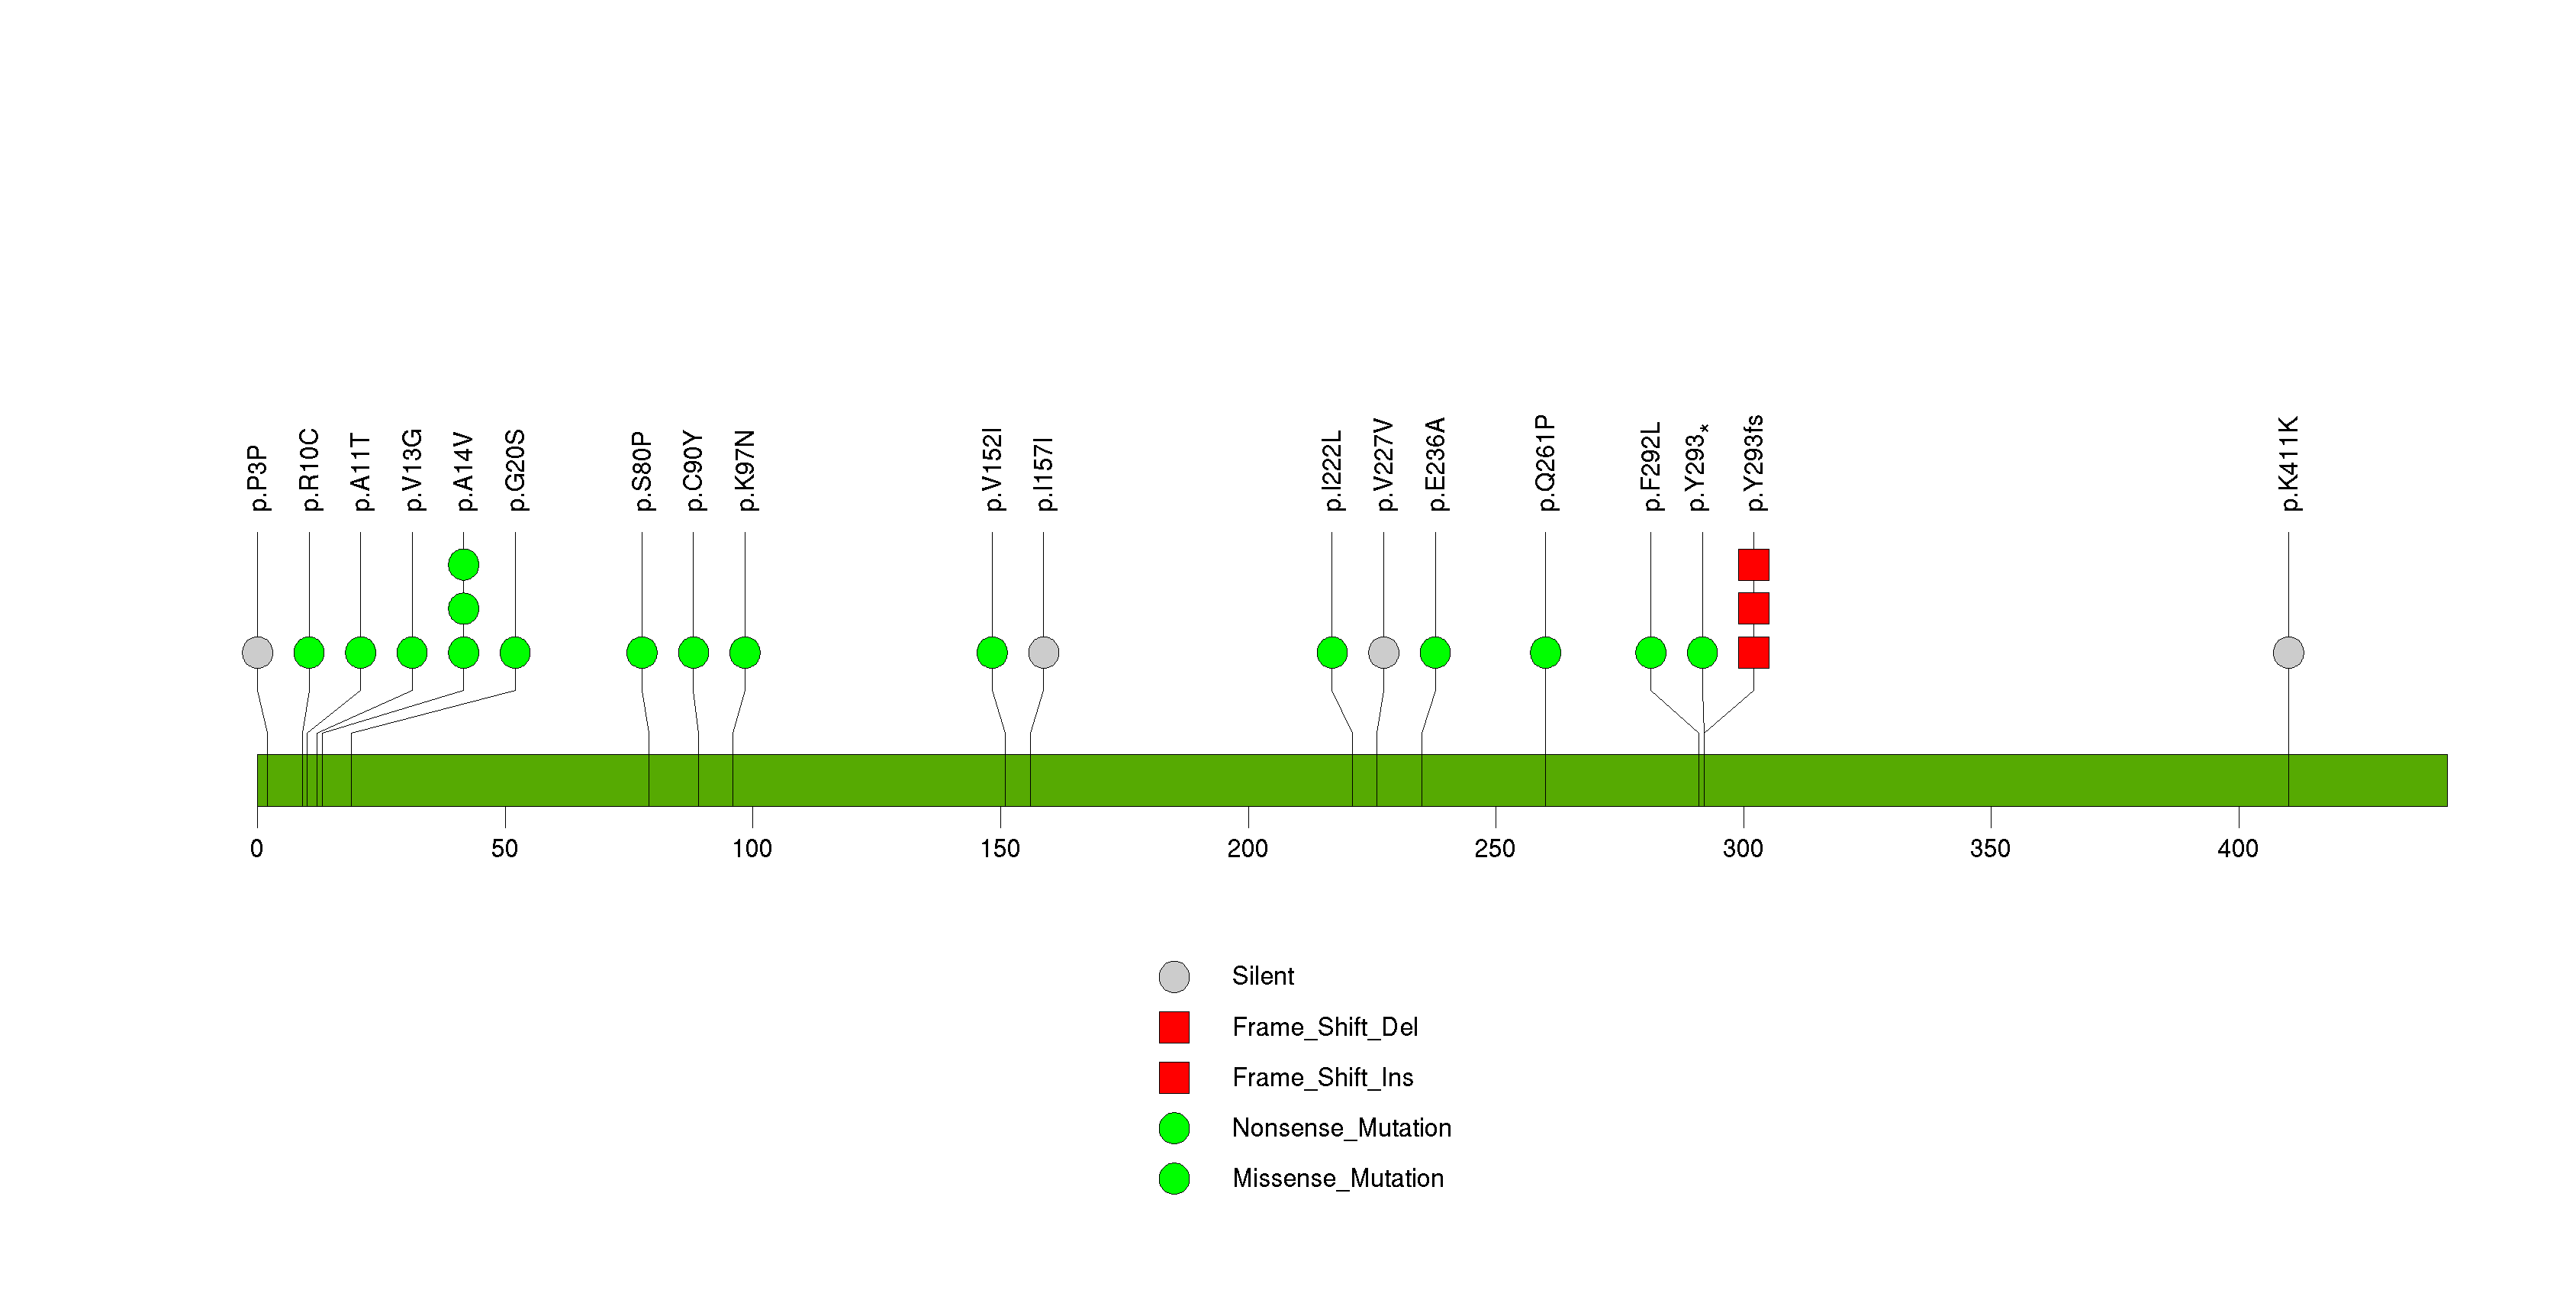
Figure S18. This figure depicts the distribution of mutations and mutation types across the HLA-B significant gene.
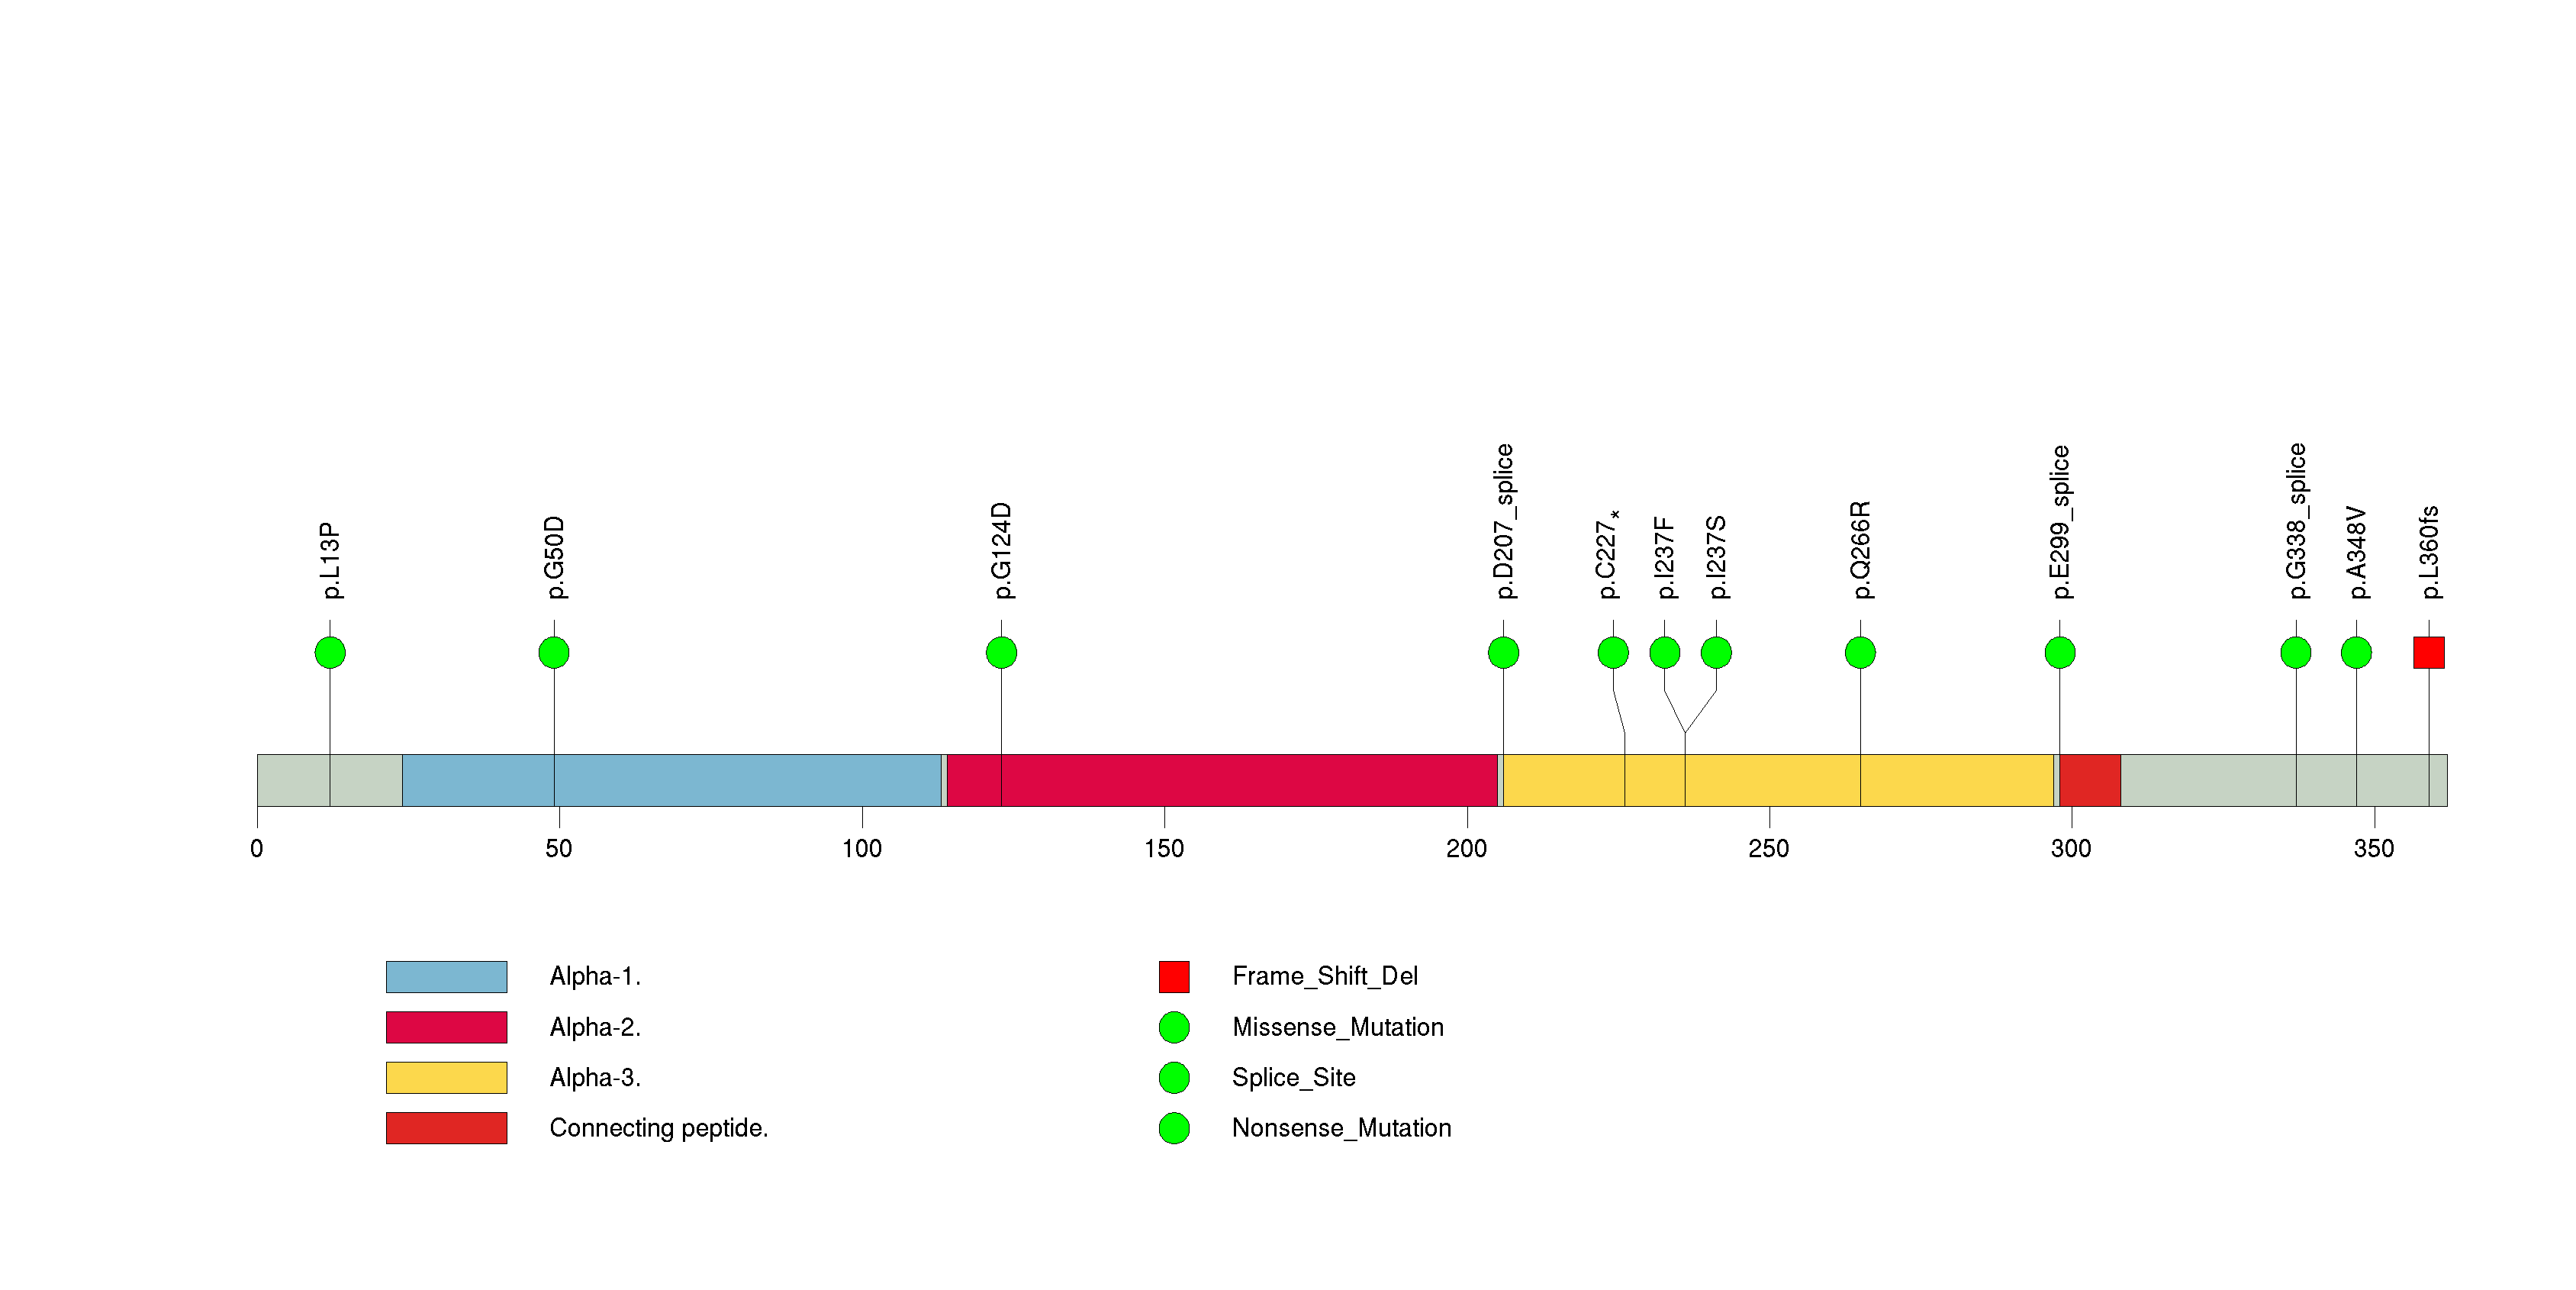
Figure S19. This figure depicts the distribution of mutations and mutation types across the TRIML2 significant gene.
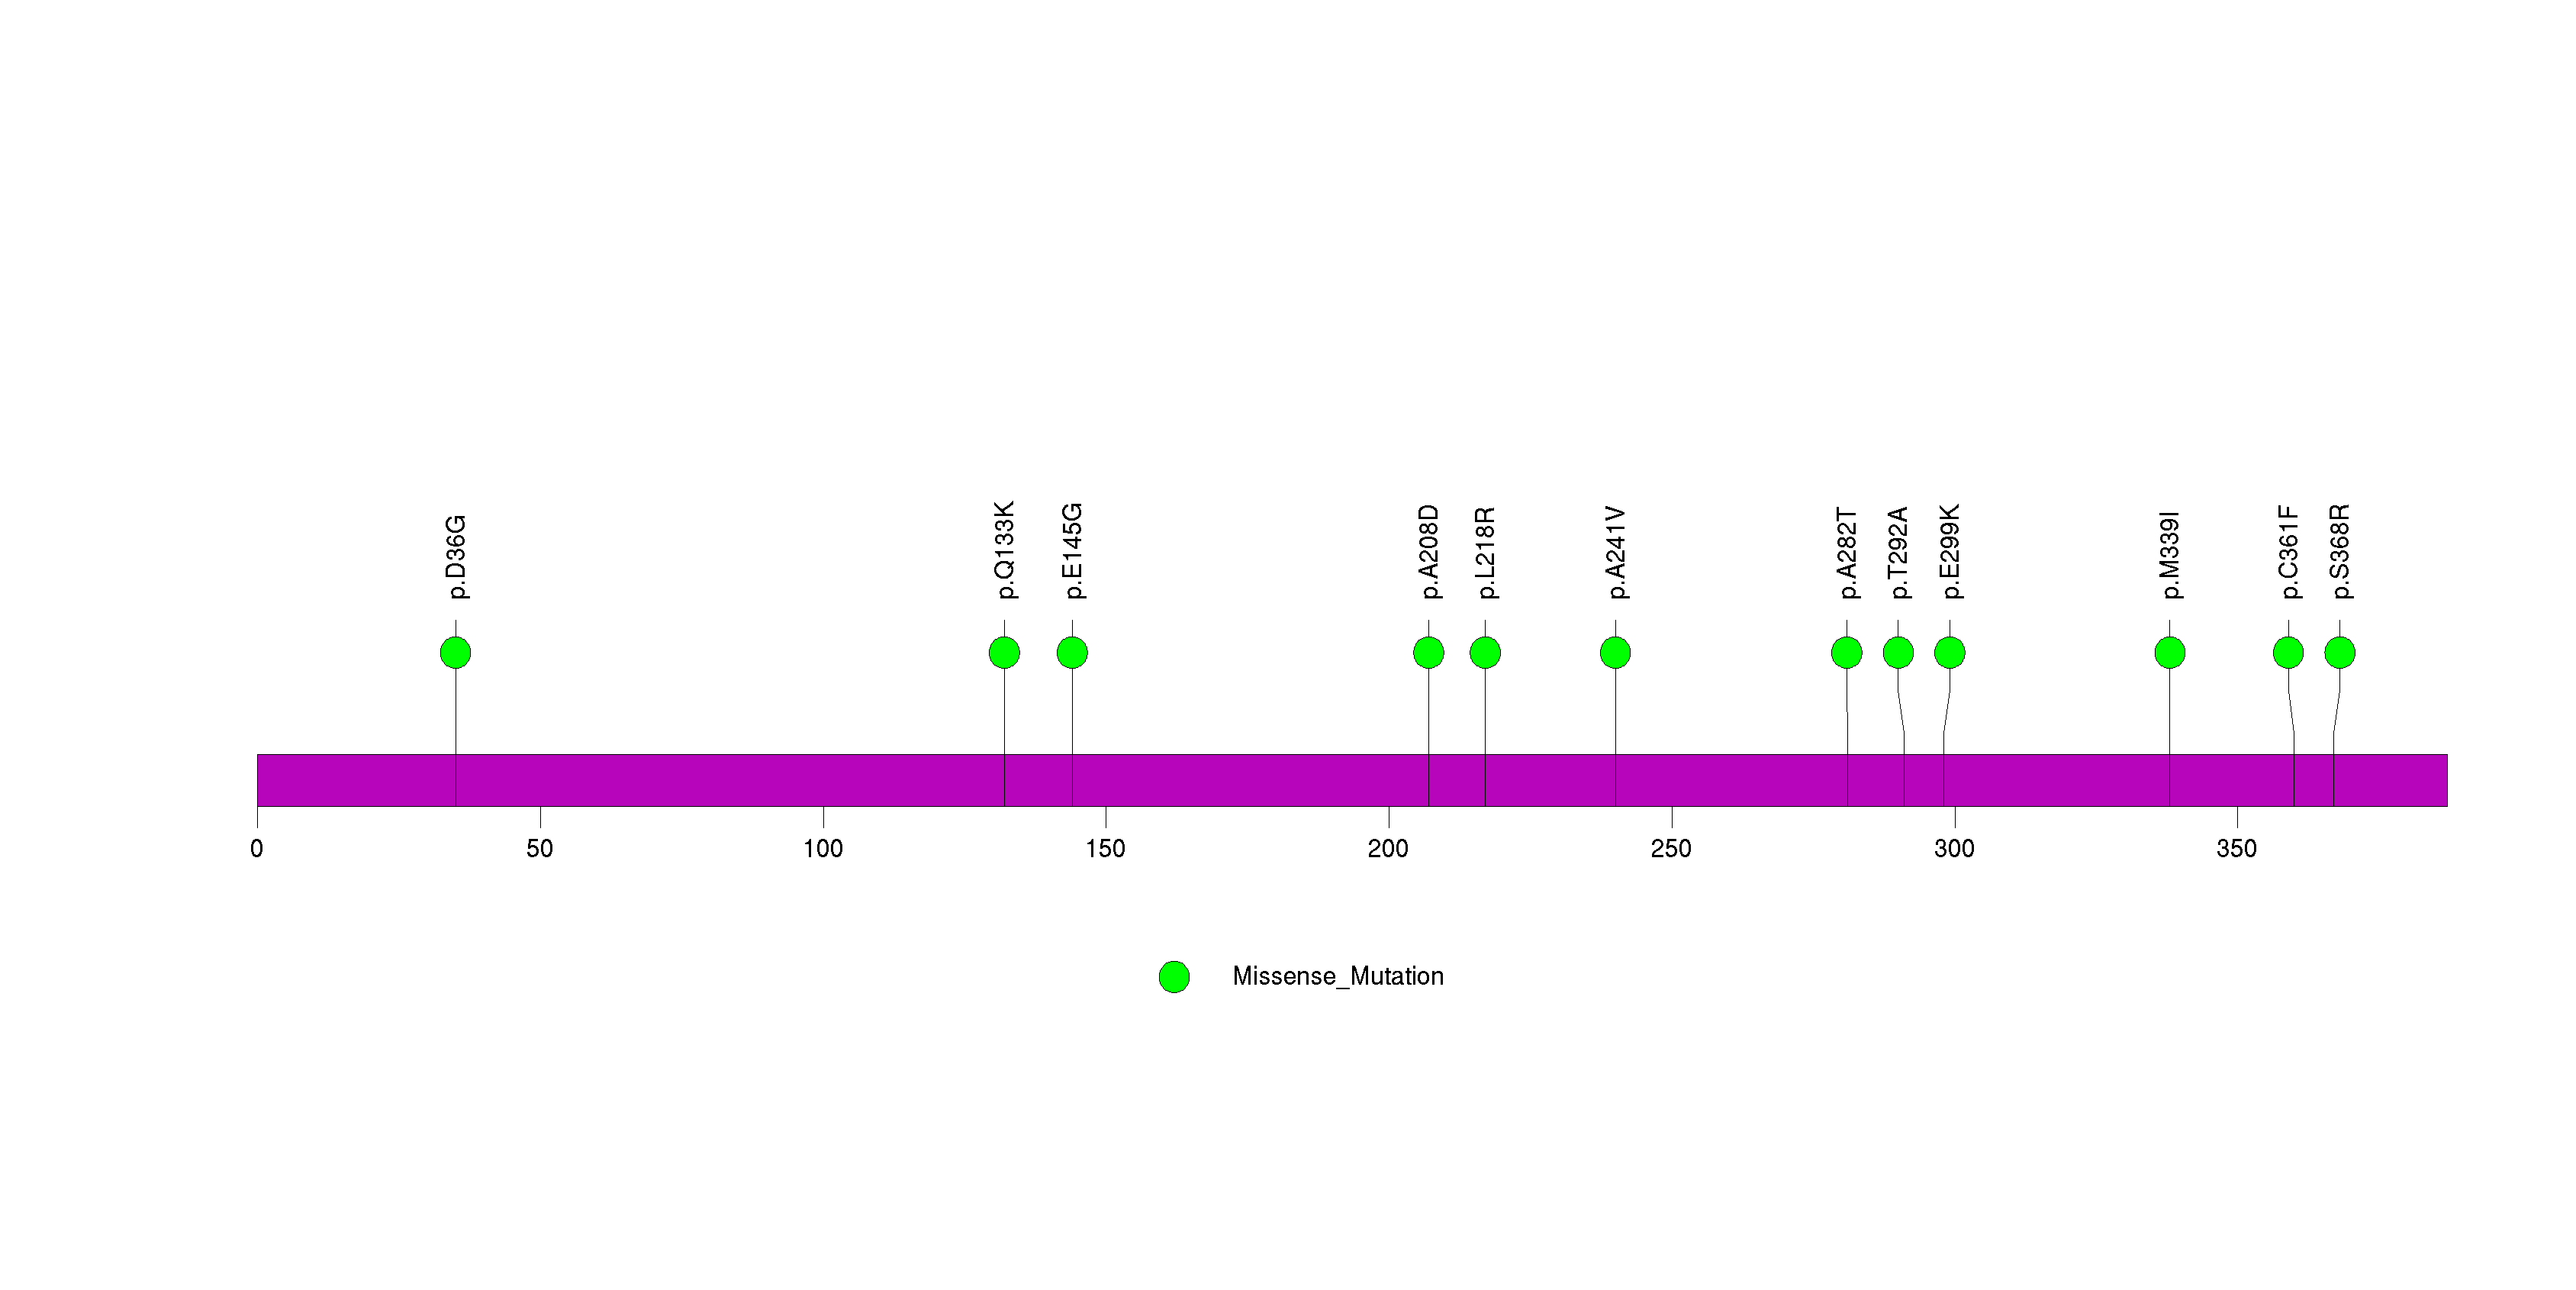
Figure S20. This figure depicts the distribution of mutations and mutation types across the SPRYD5 significant gene.
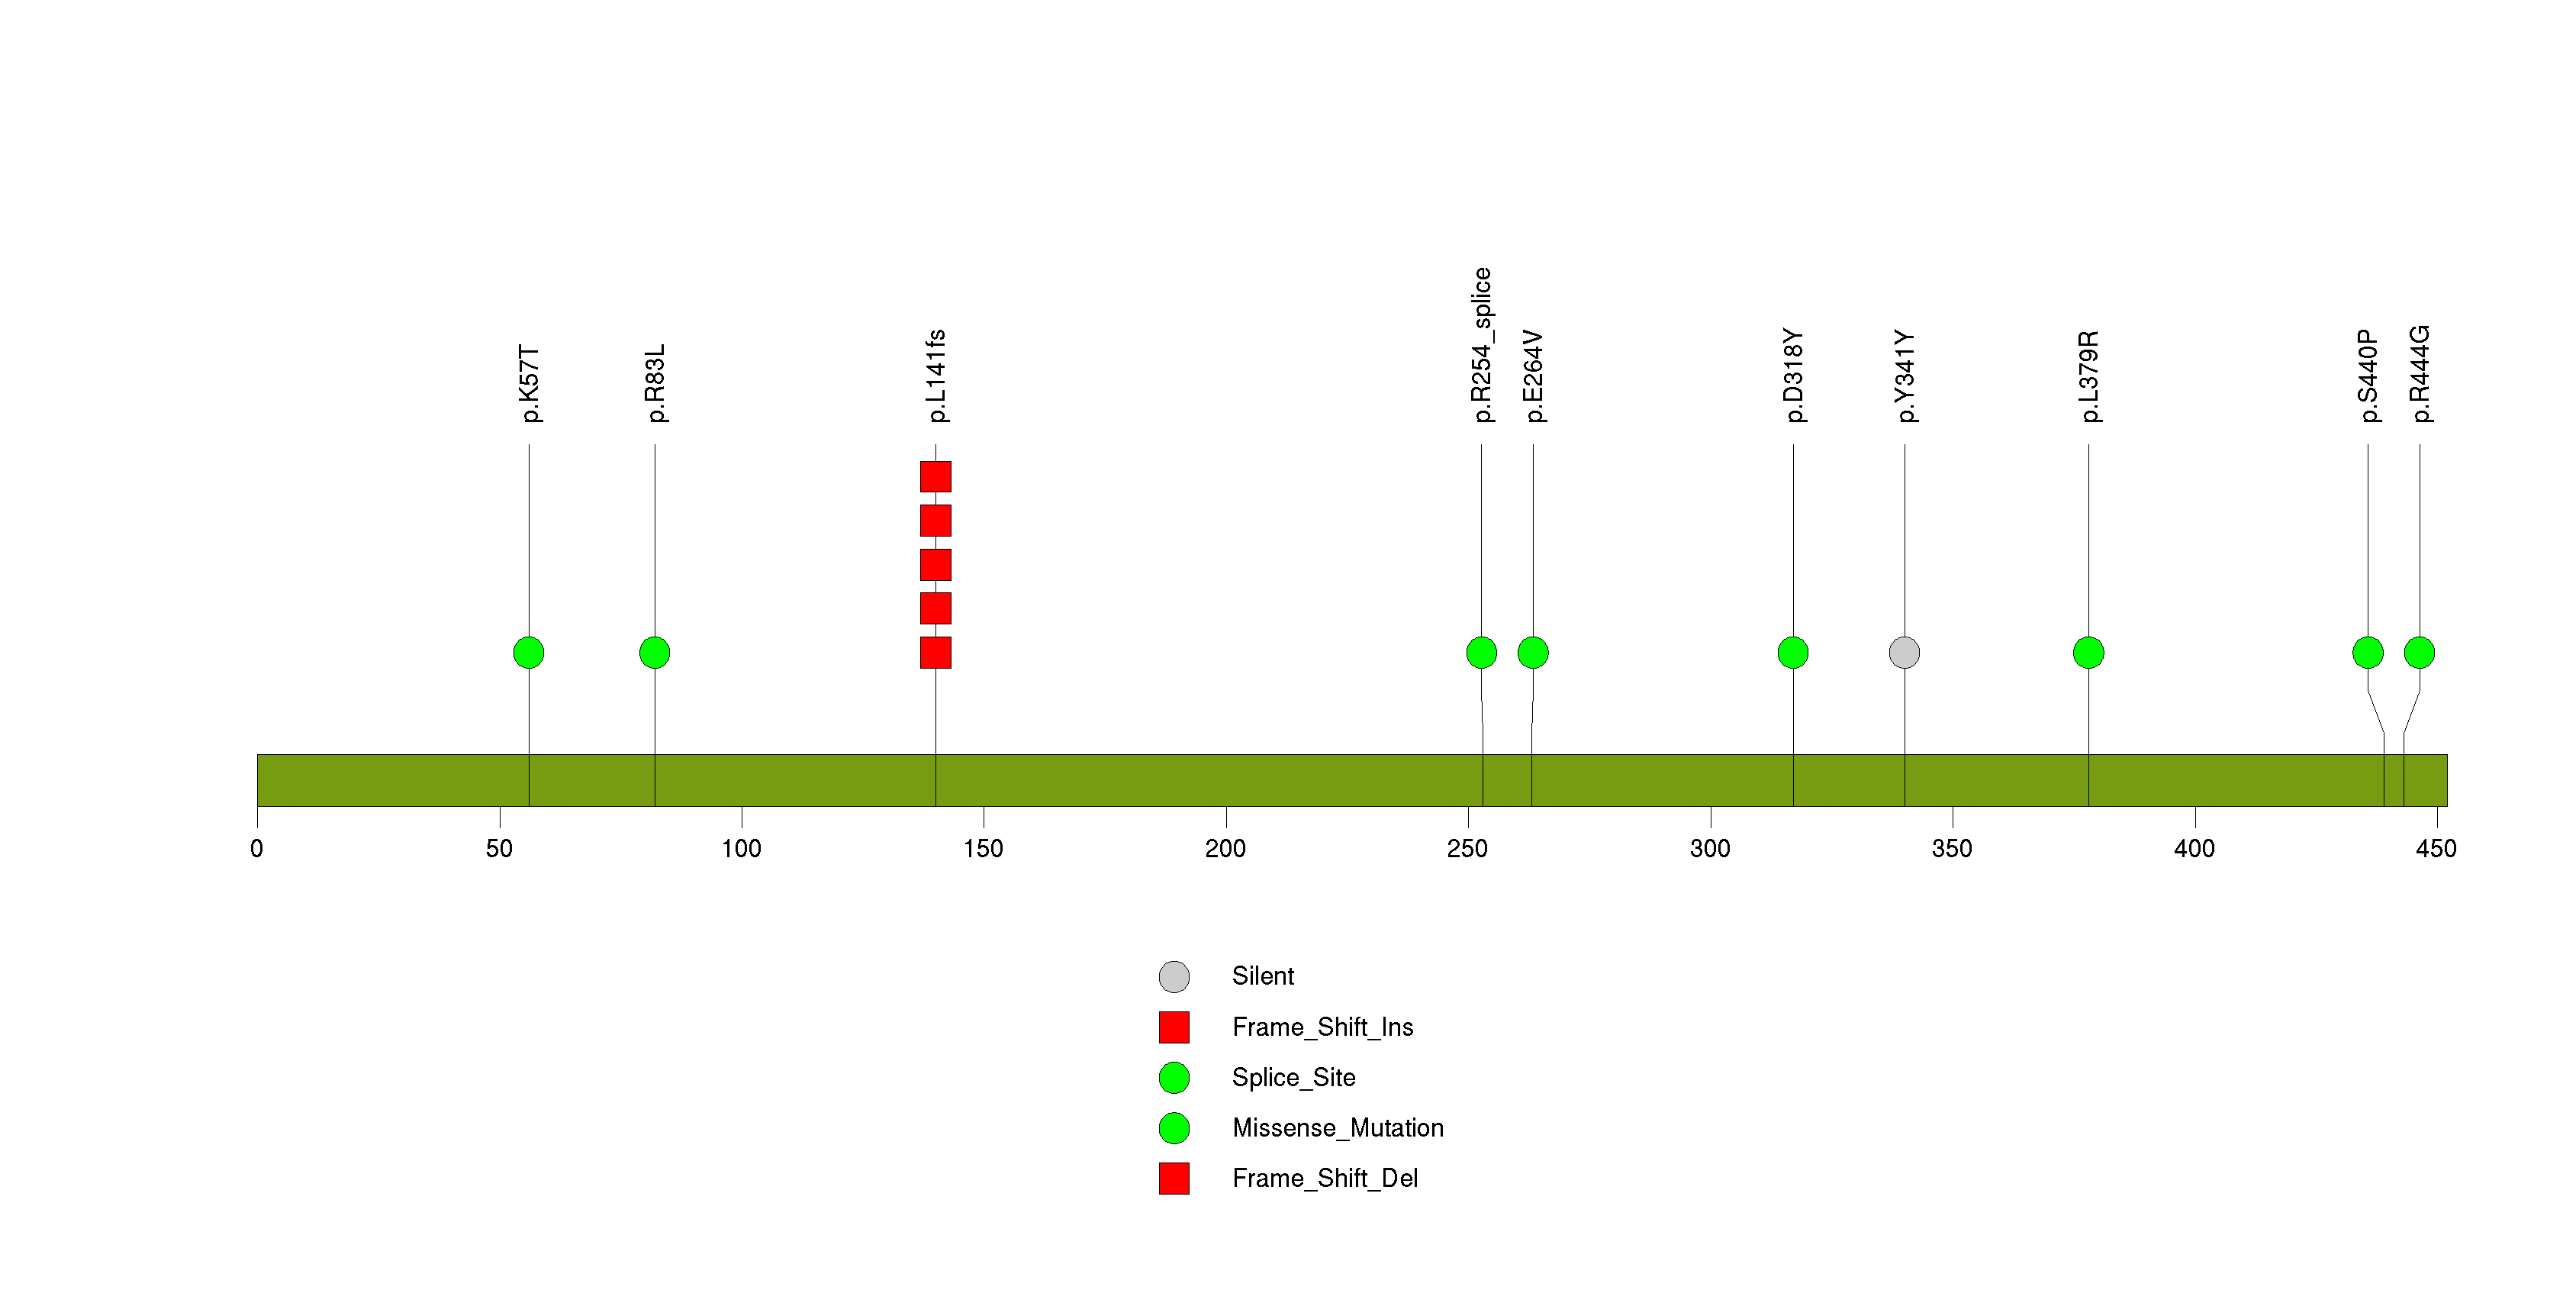
Figure S21. This figure depicts the distribution of mutations and mutation types across the RPS6KA6 significant gene.
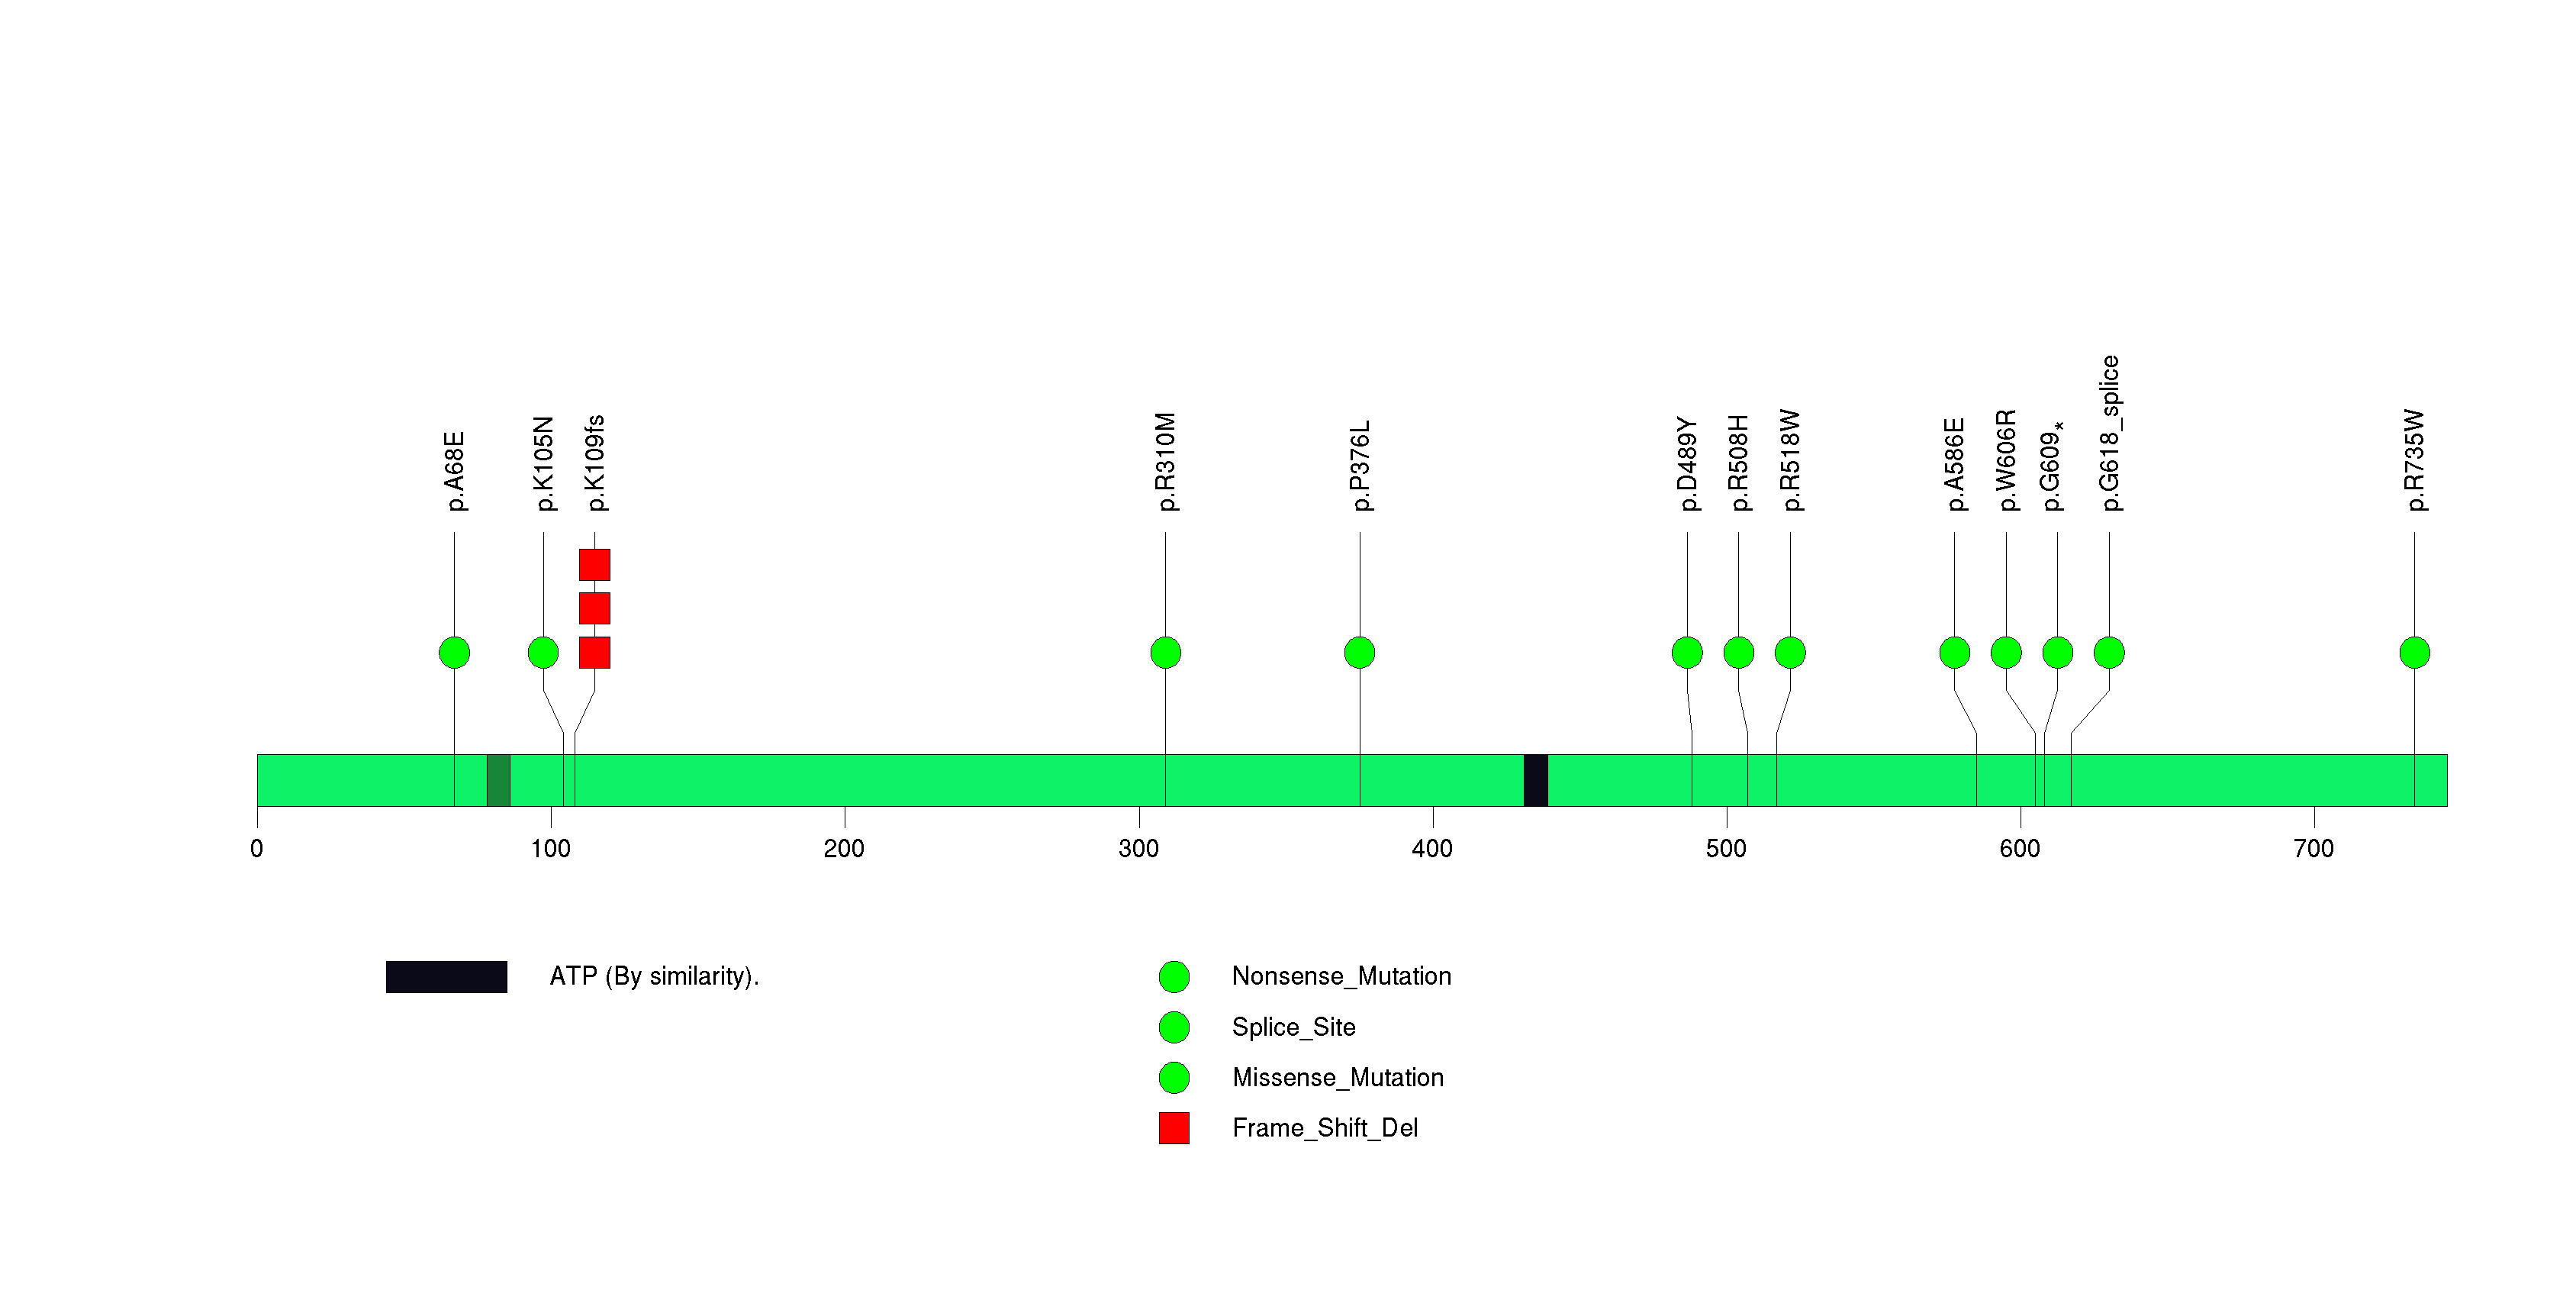
Figure S22. This figure depicts the distribution of mutations and mutation types across the PTEN significant gene.
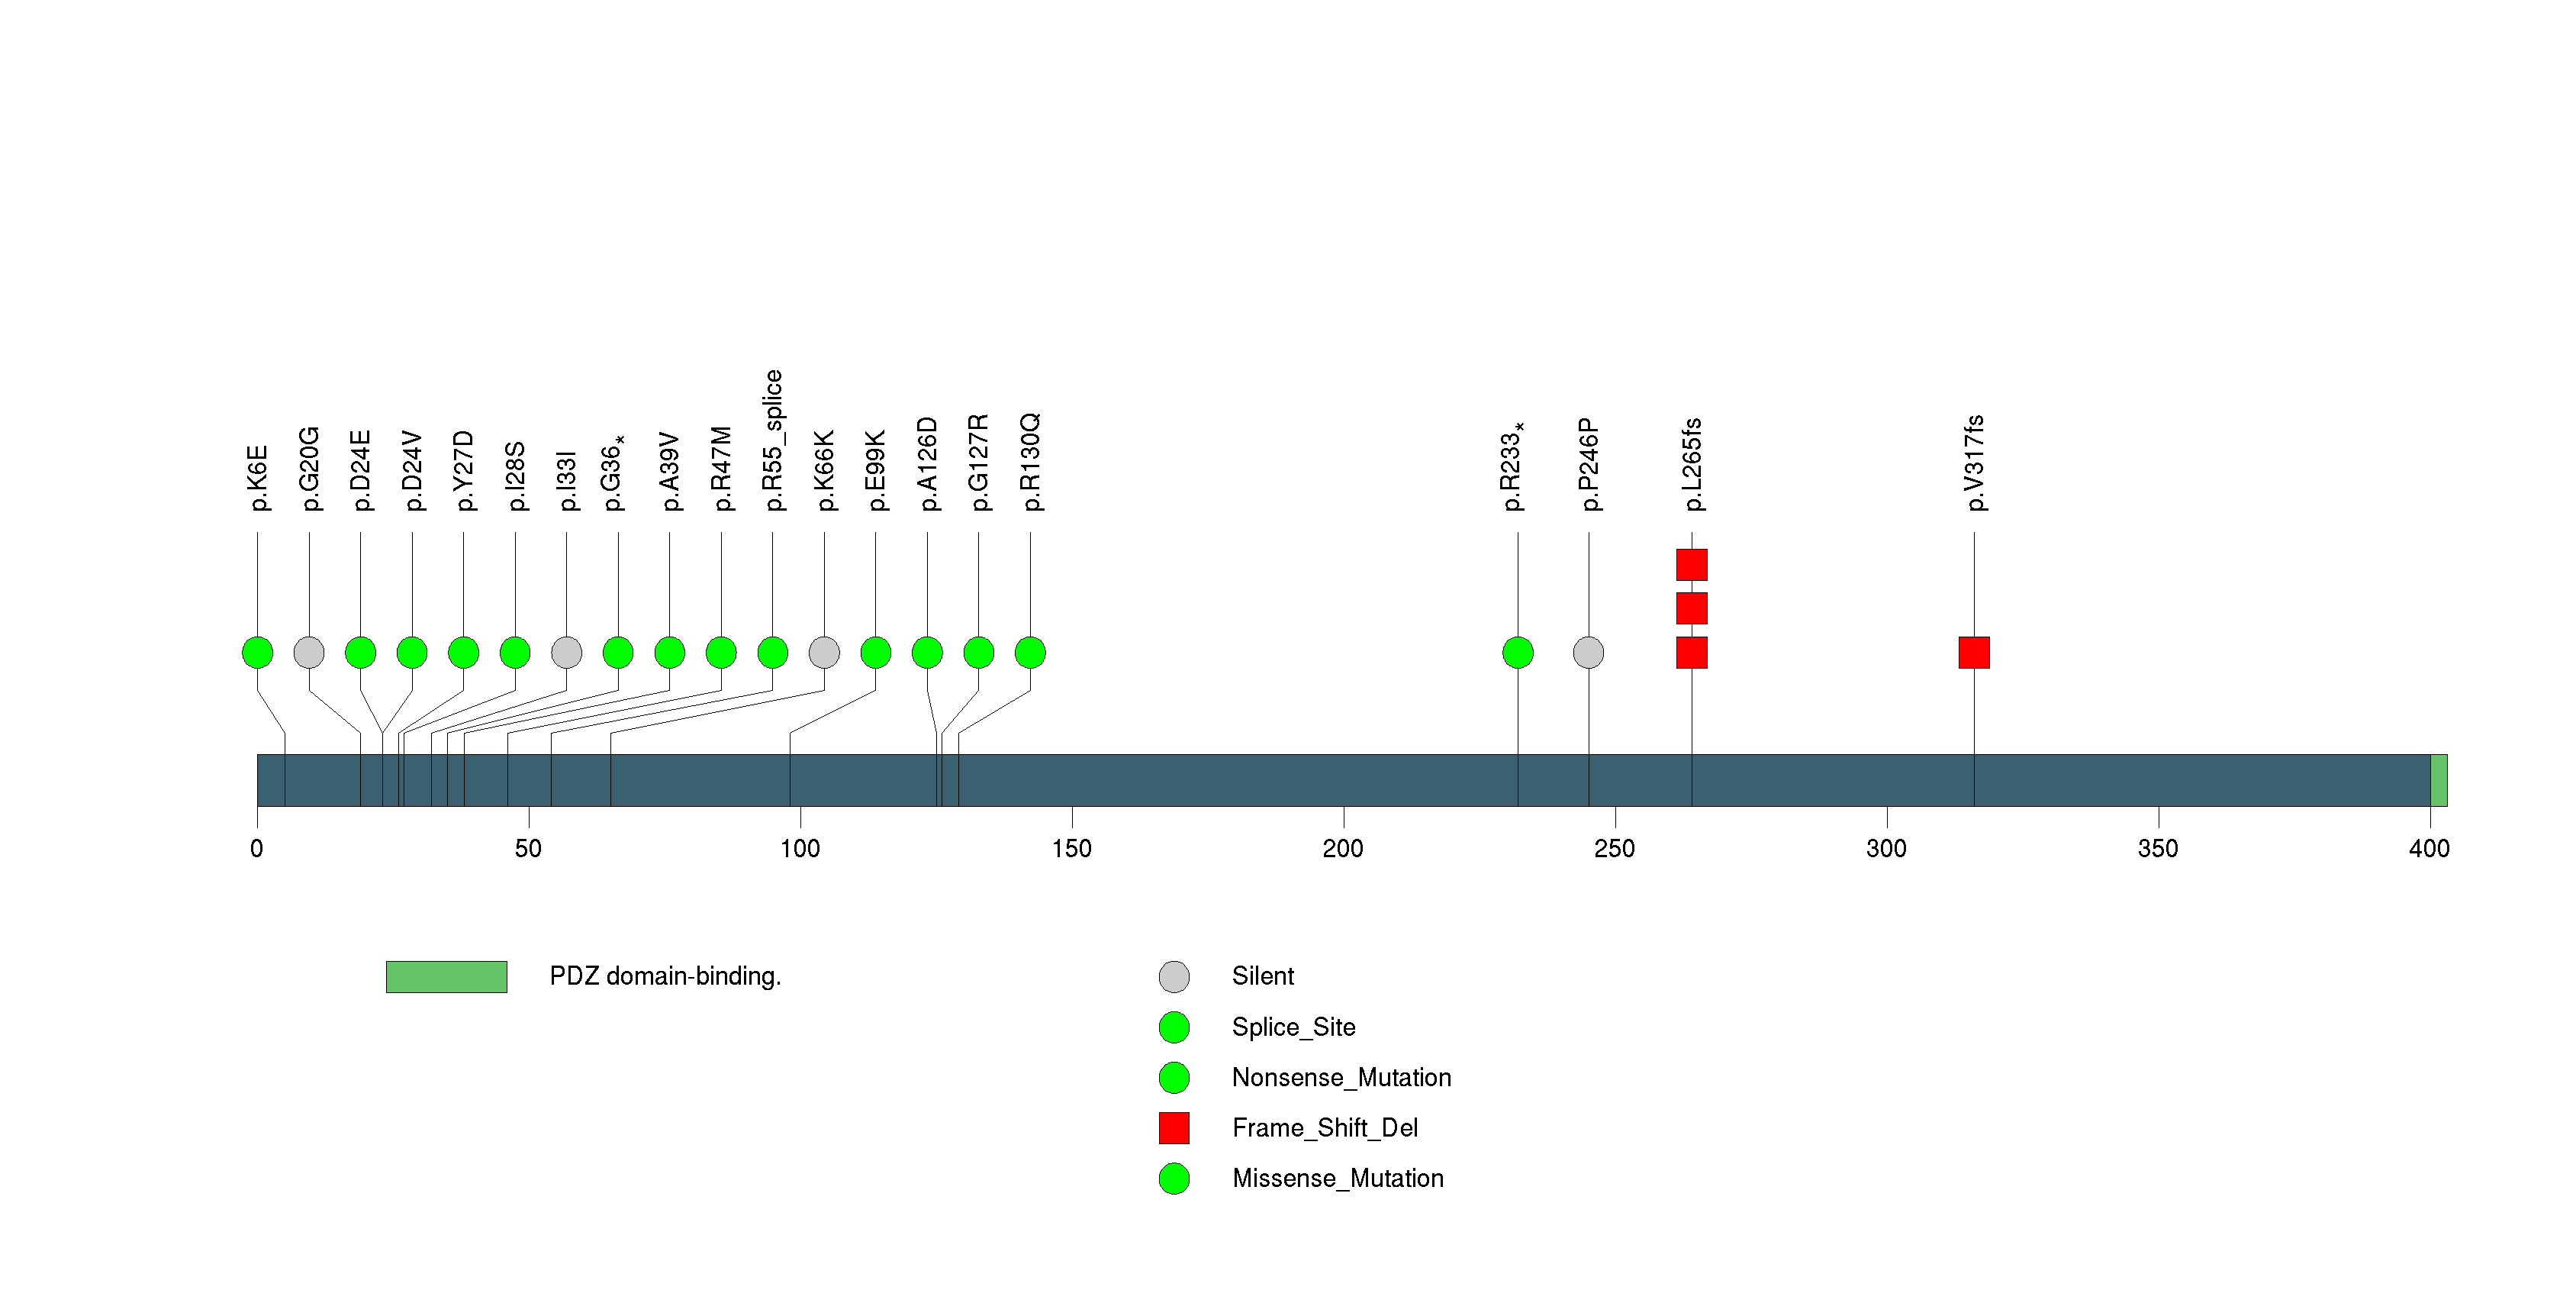
Figure S23. This figure depicts the distribution of mutations and mutation types across the CNBD1 significant gene.
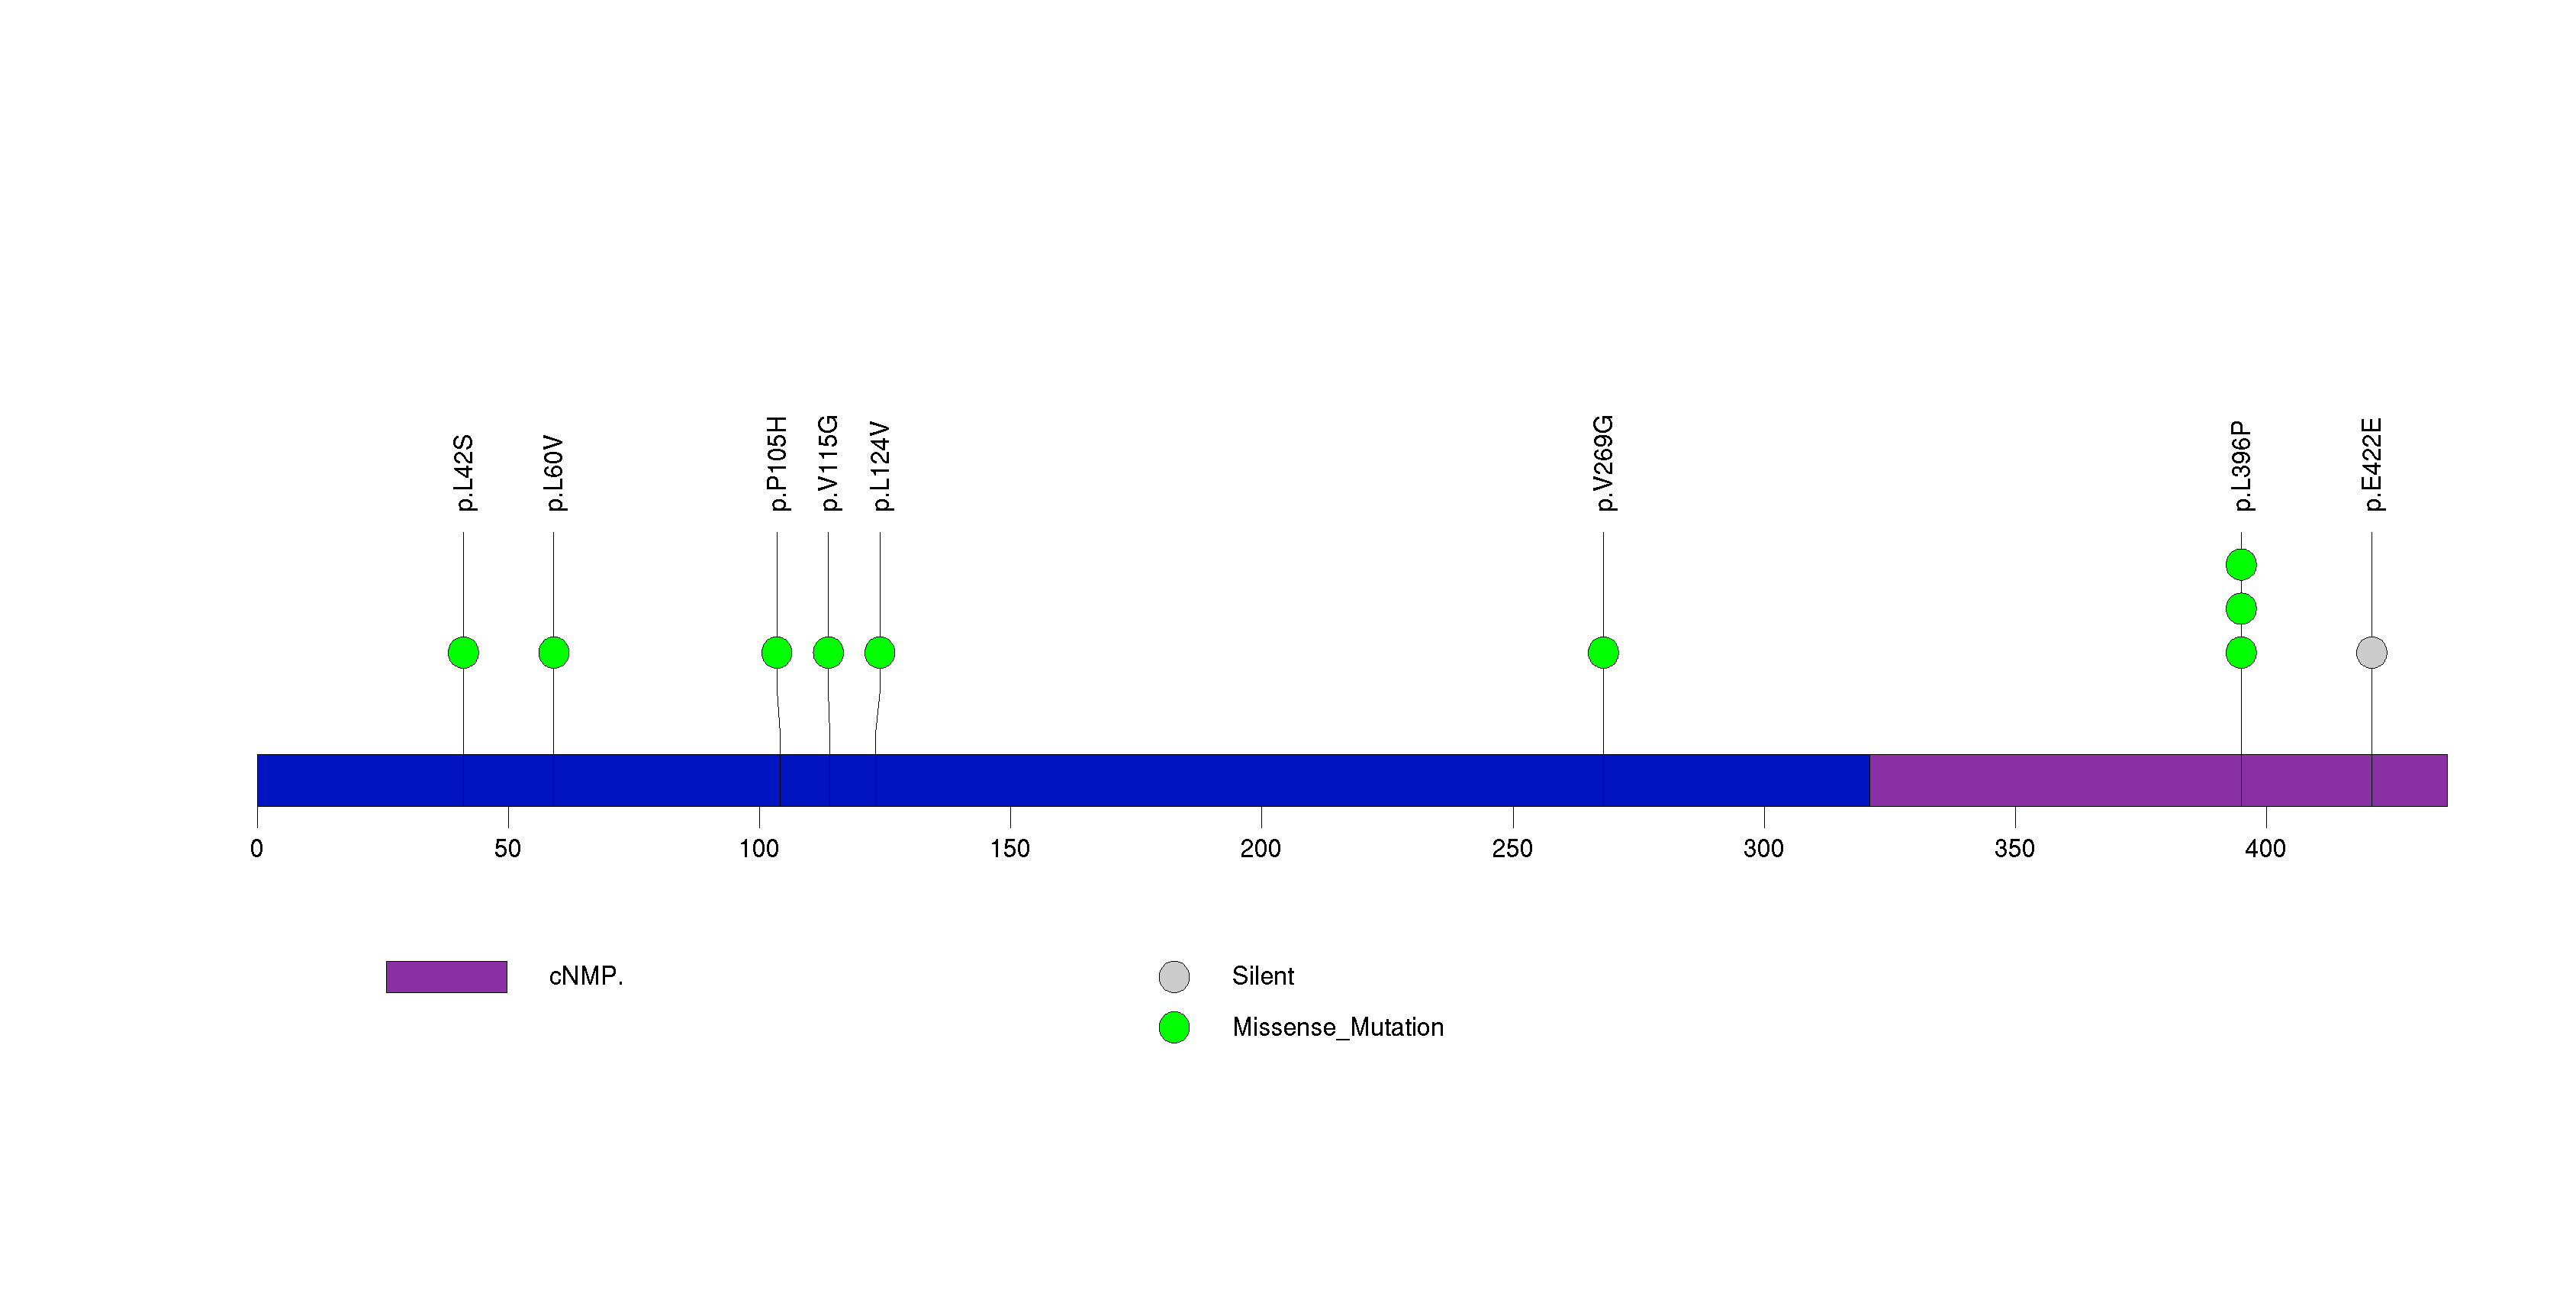
Figure S24. This figure depicts the distribution of mutations and mutation types across the WBSCR17 significant gene.
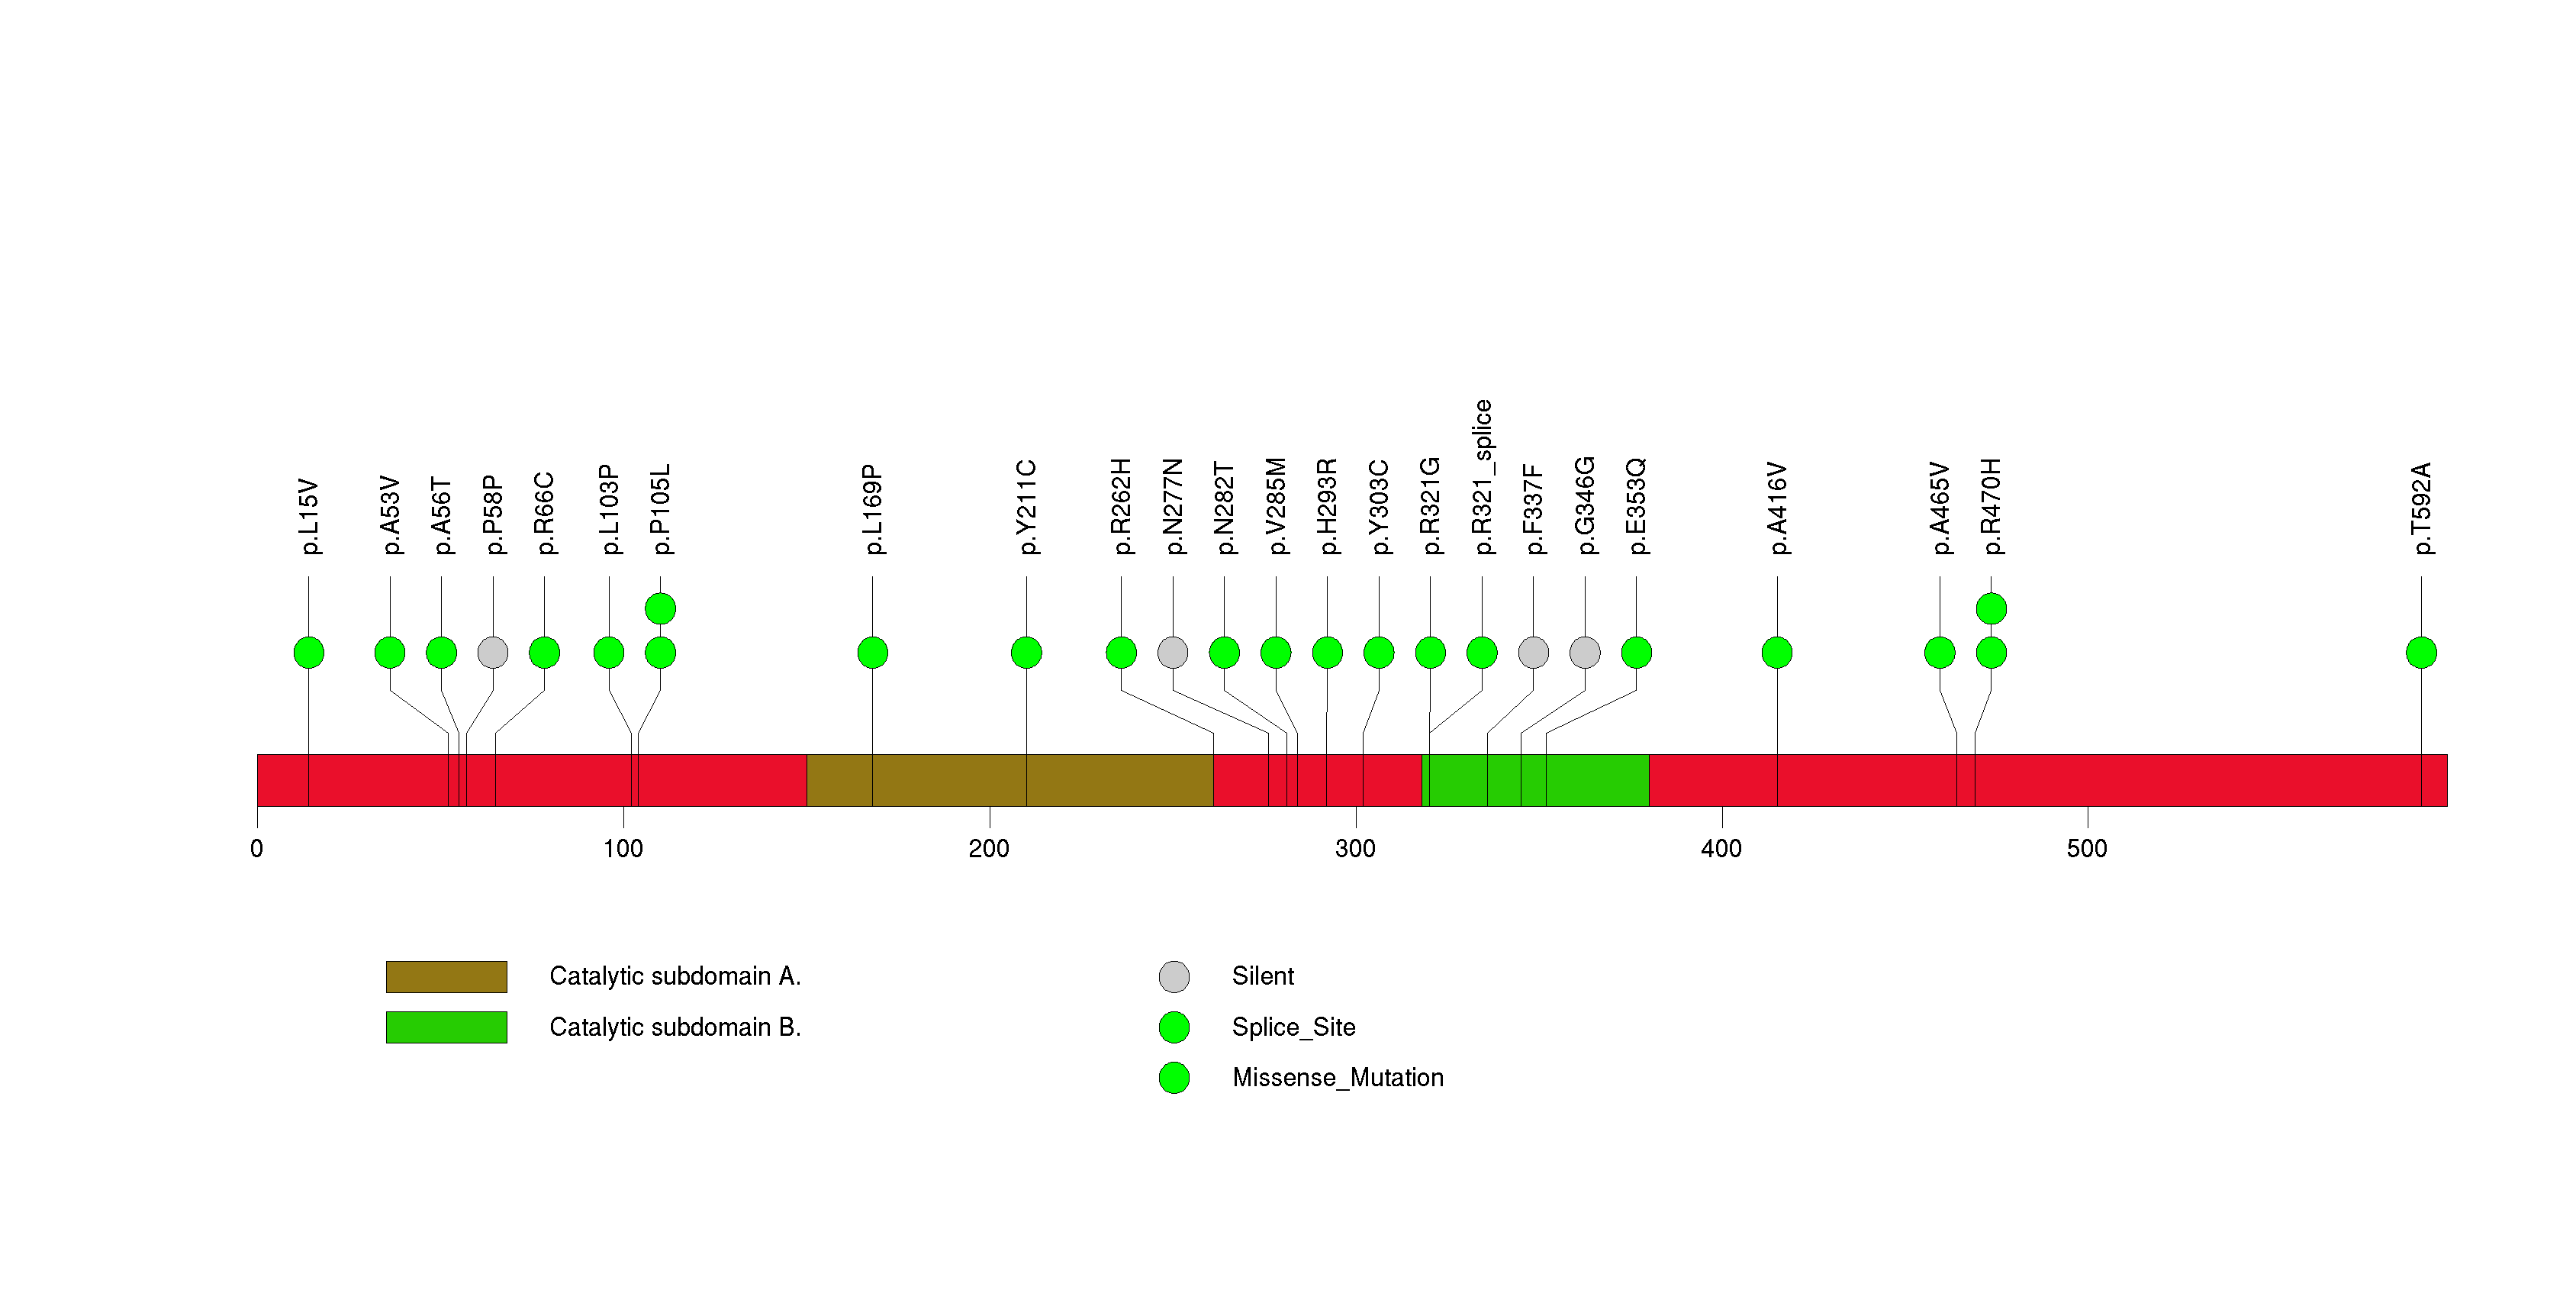
Figure S25. This figure depicts the distribution of mutations and mutation types across the AMY2B significant gene.
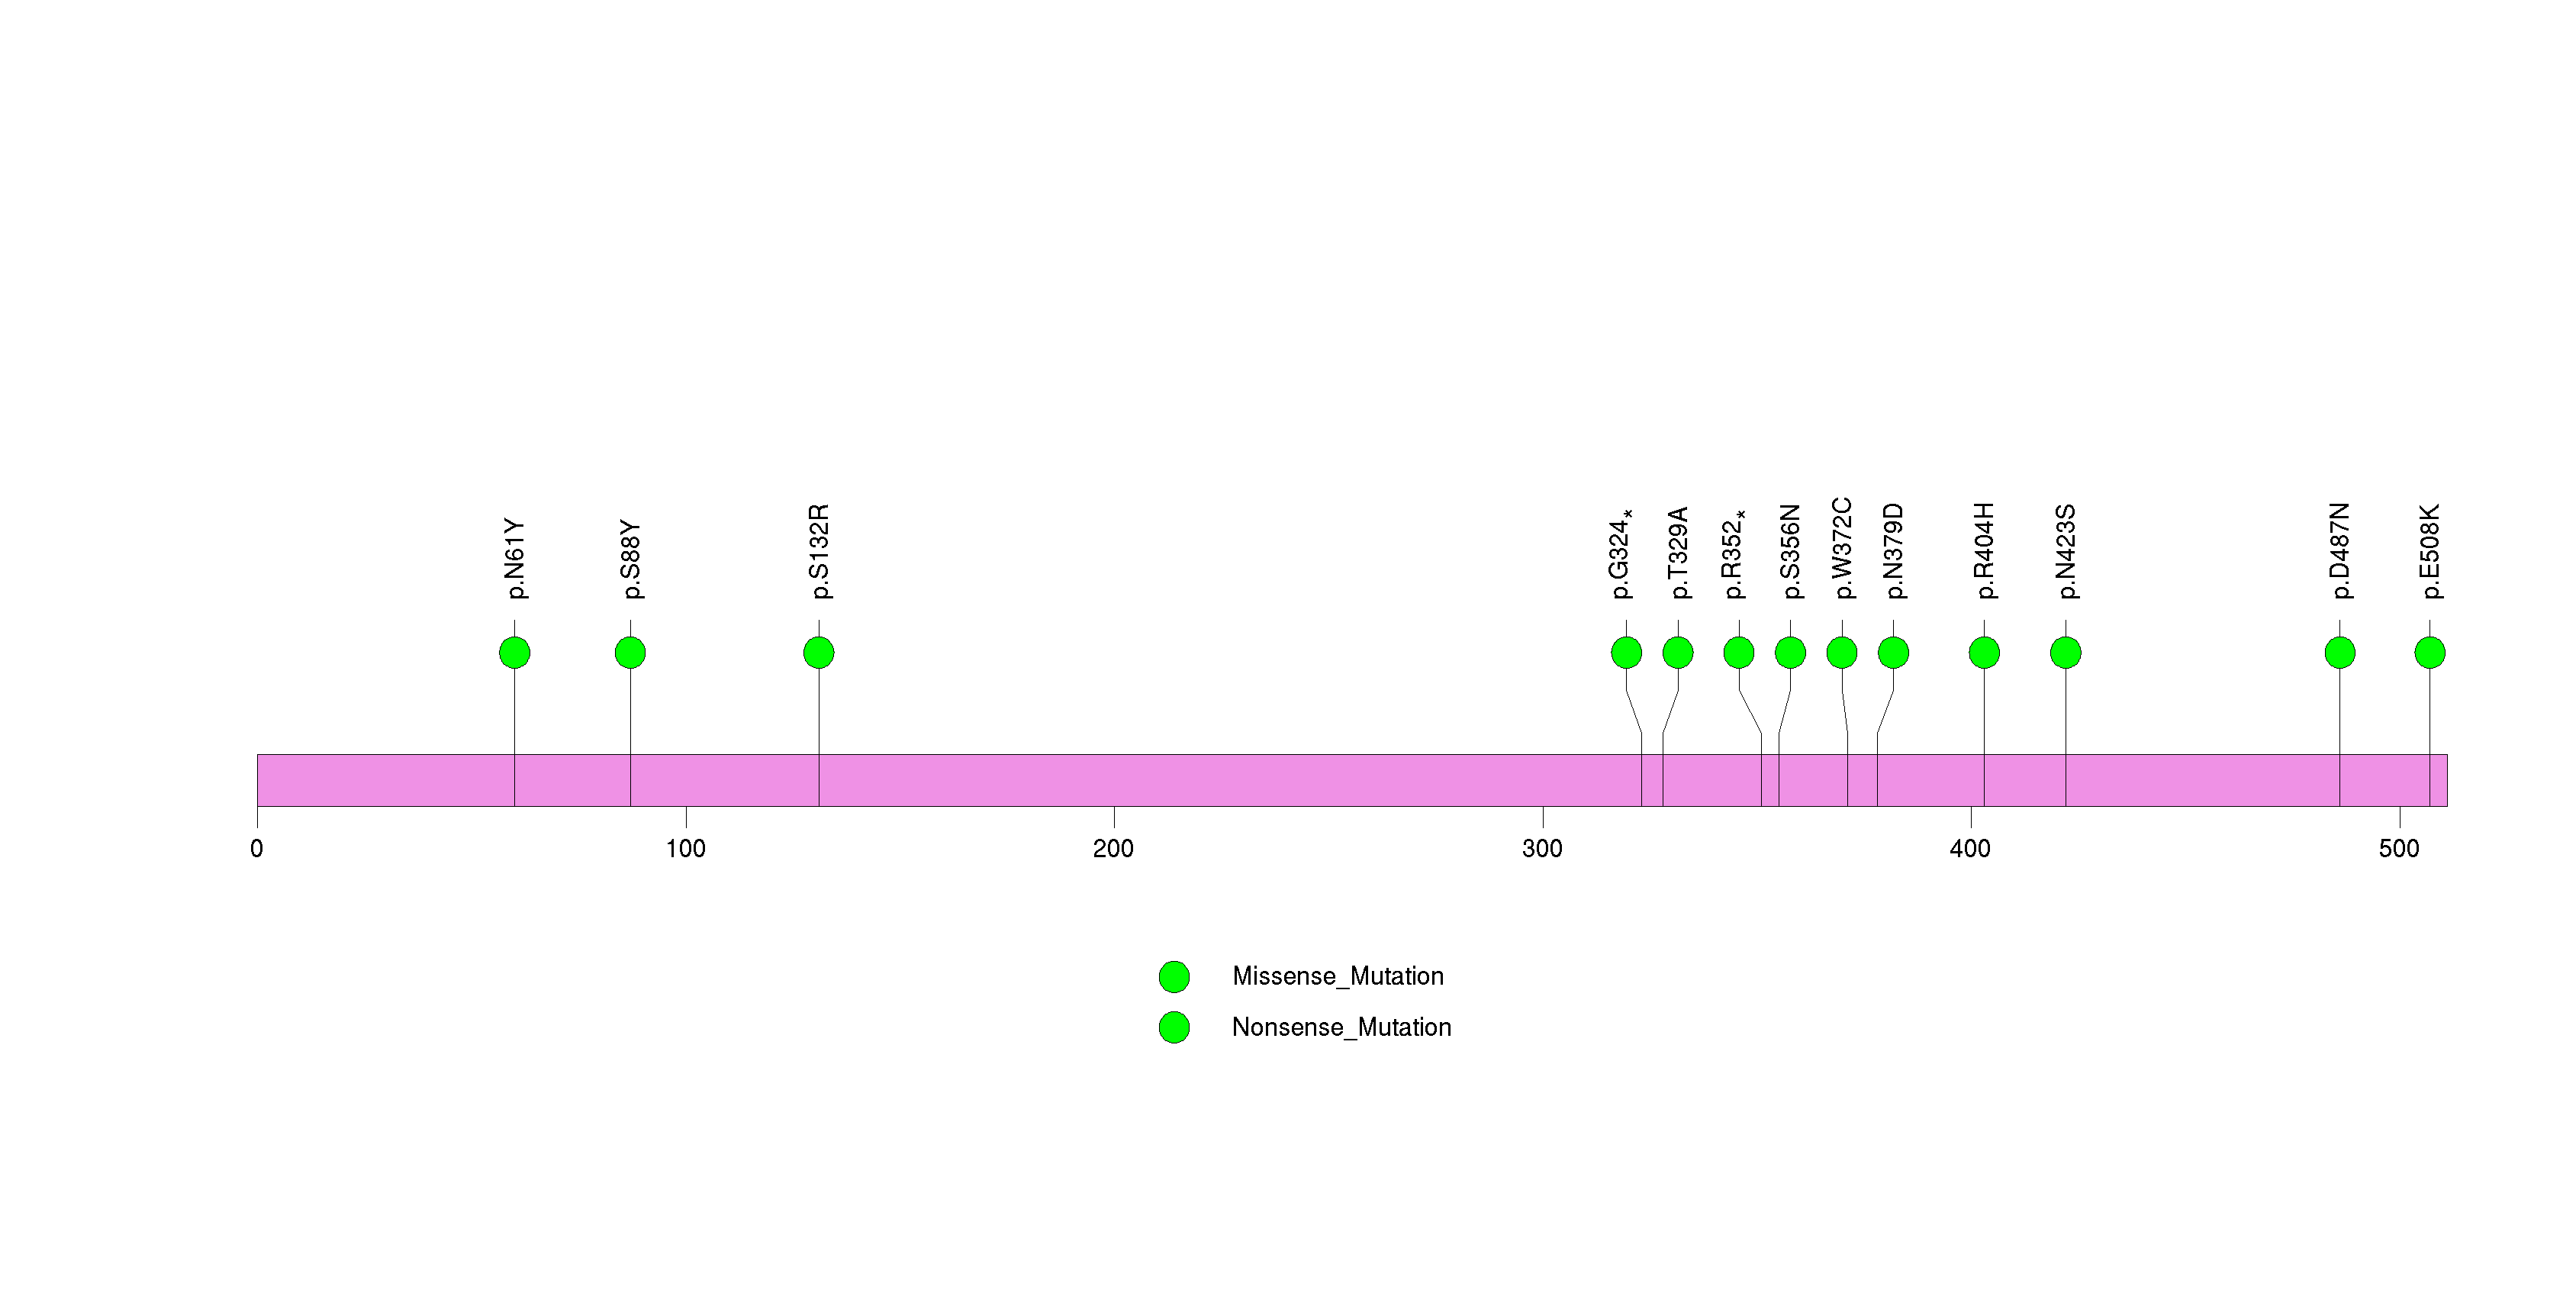
Figure S26. This figure depicts the distribution of mutations and mutation types across the CYP7B1 significant gene.
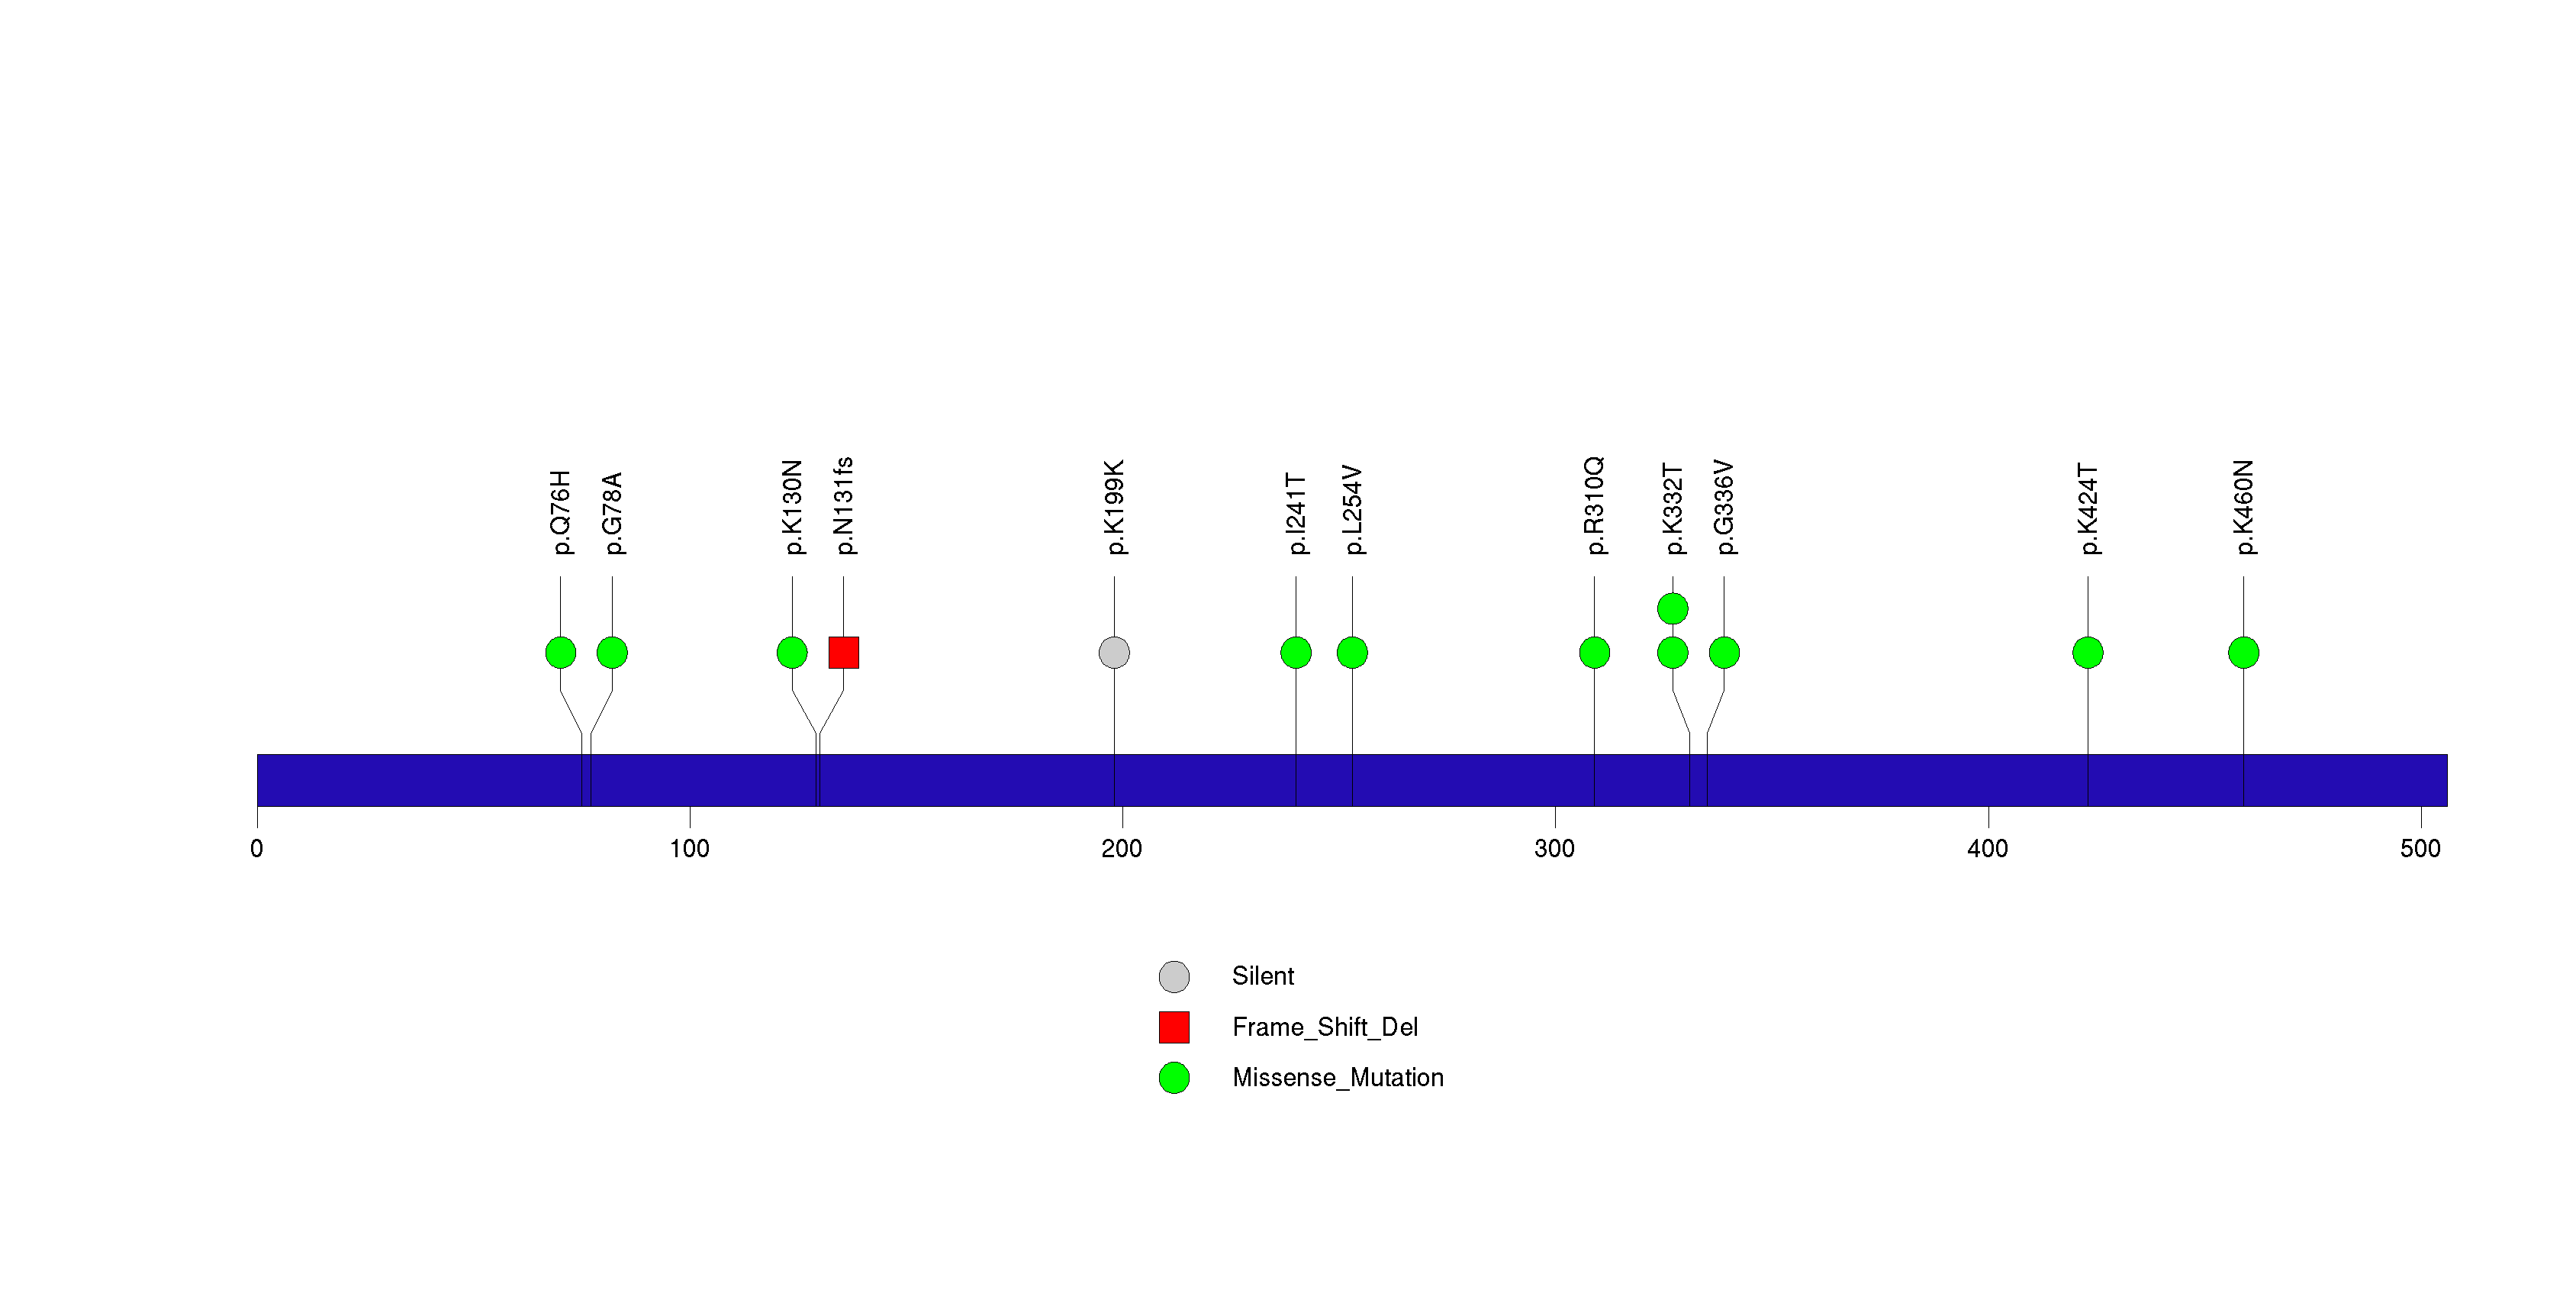
Figure S27. This figure depicts the distribution of mutations and mutation types across the CDH11 significant gene.
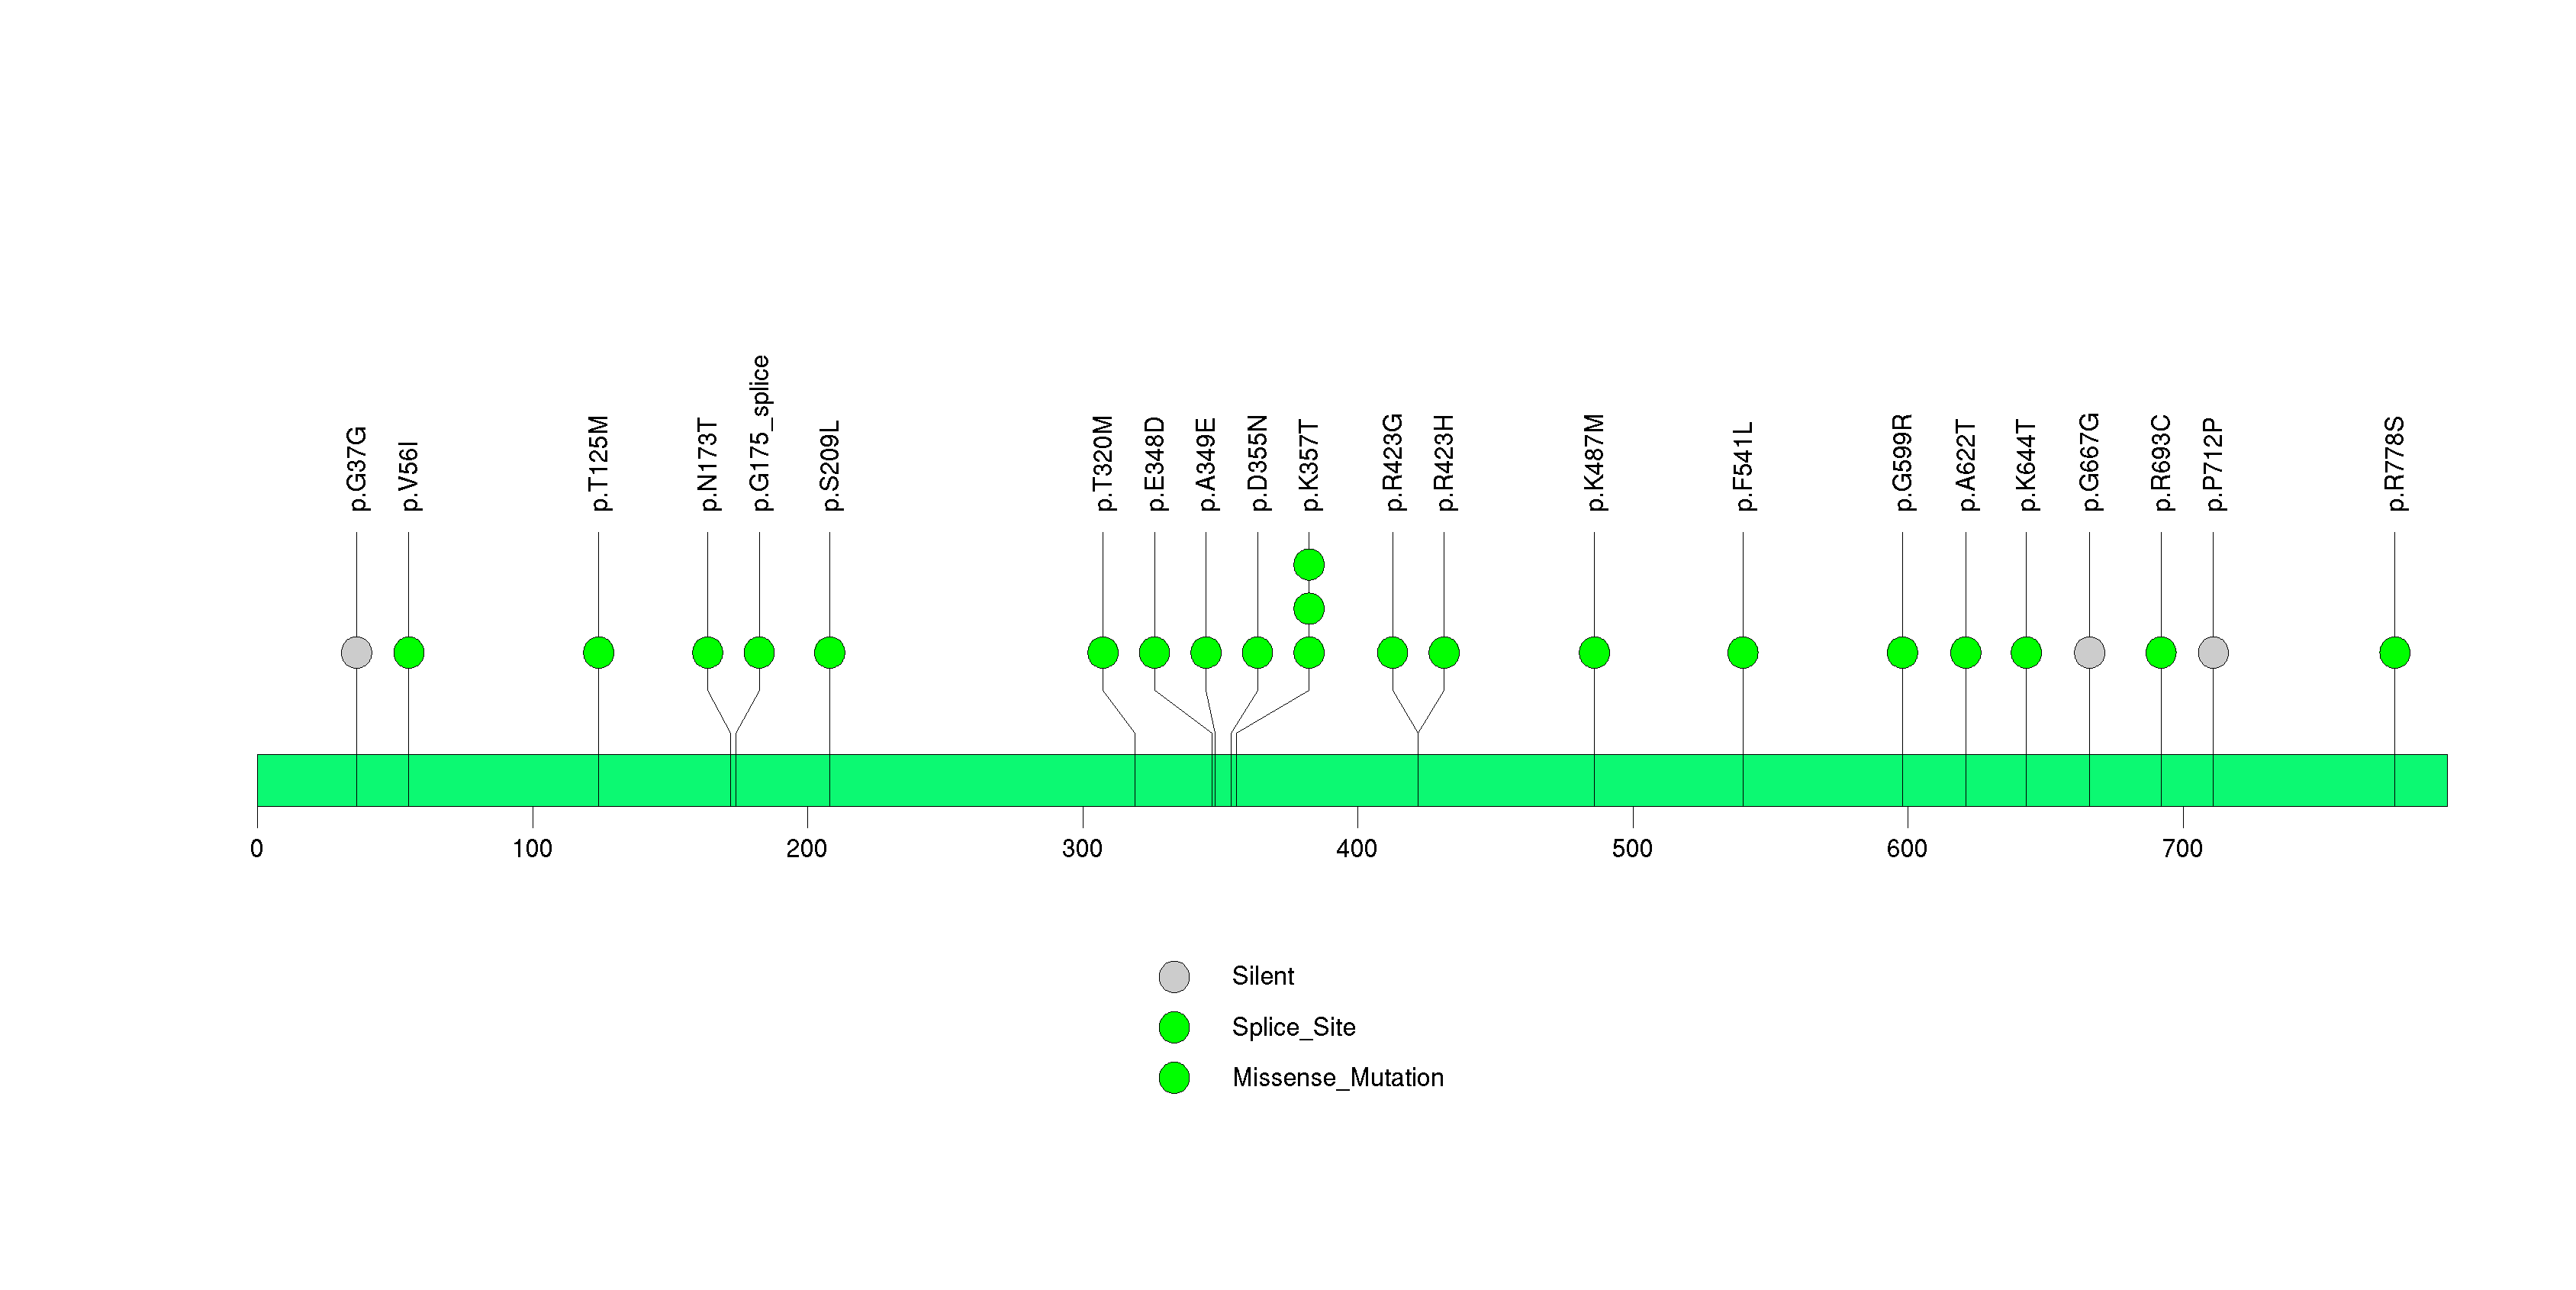
Figure S28. This figure depicts the distribution of mutations and mutation types across the OR2G6 significant gene.
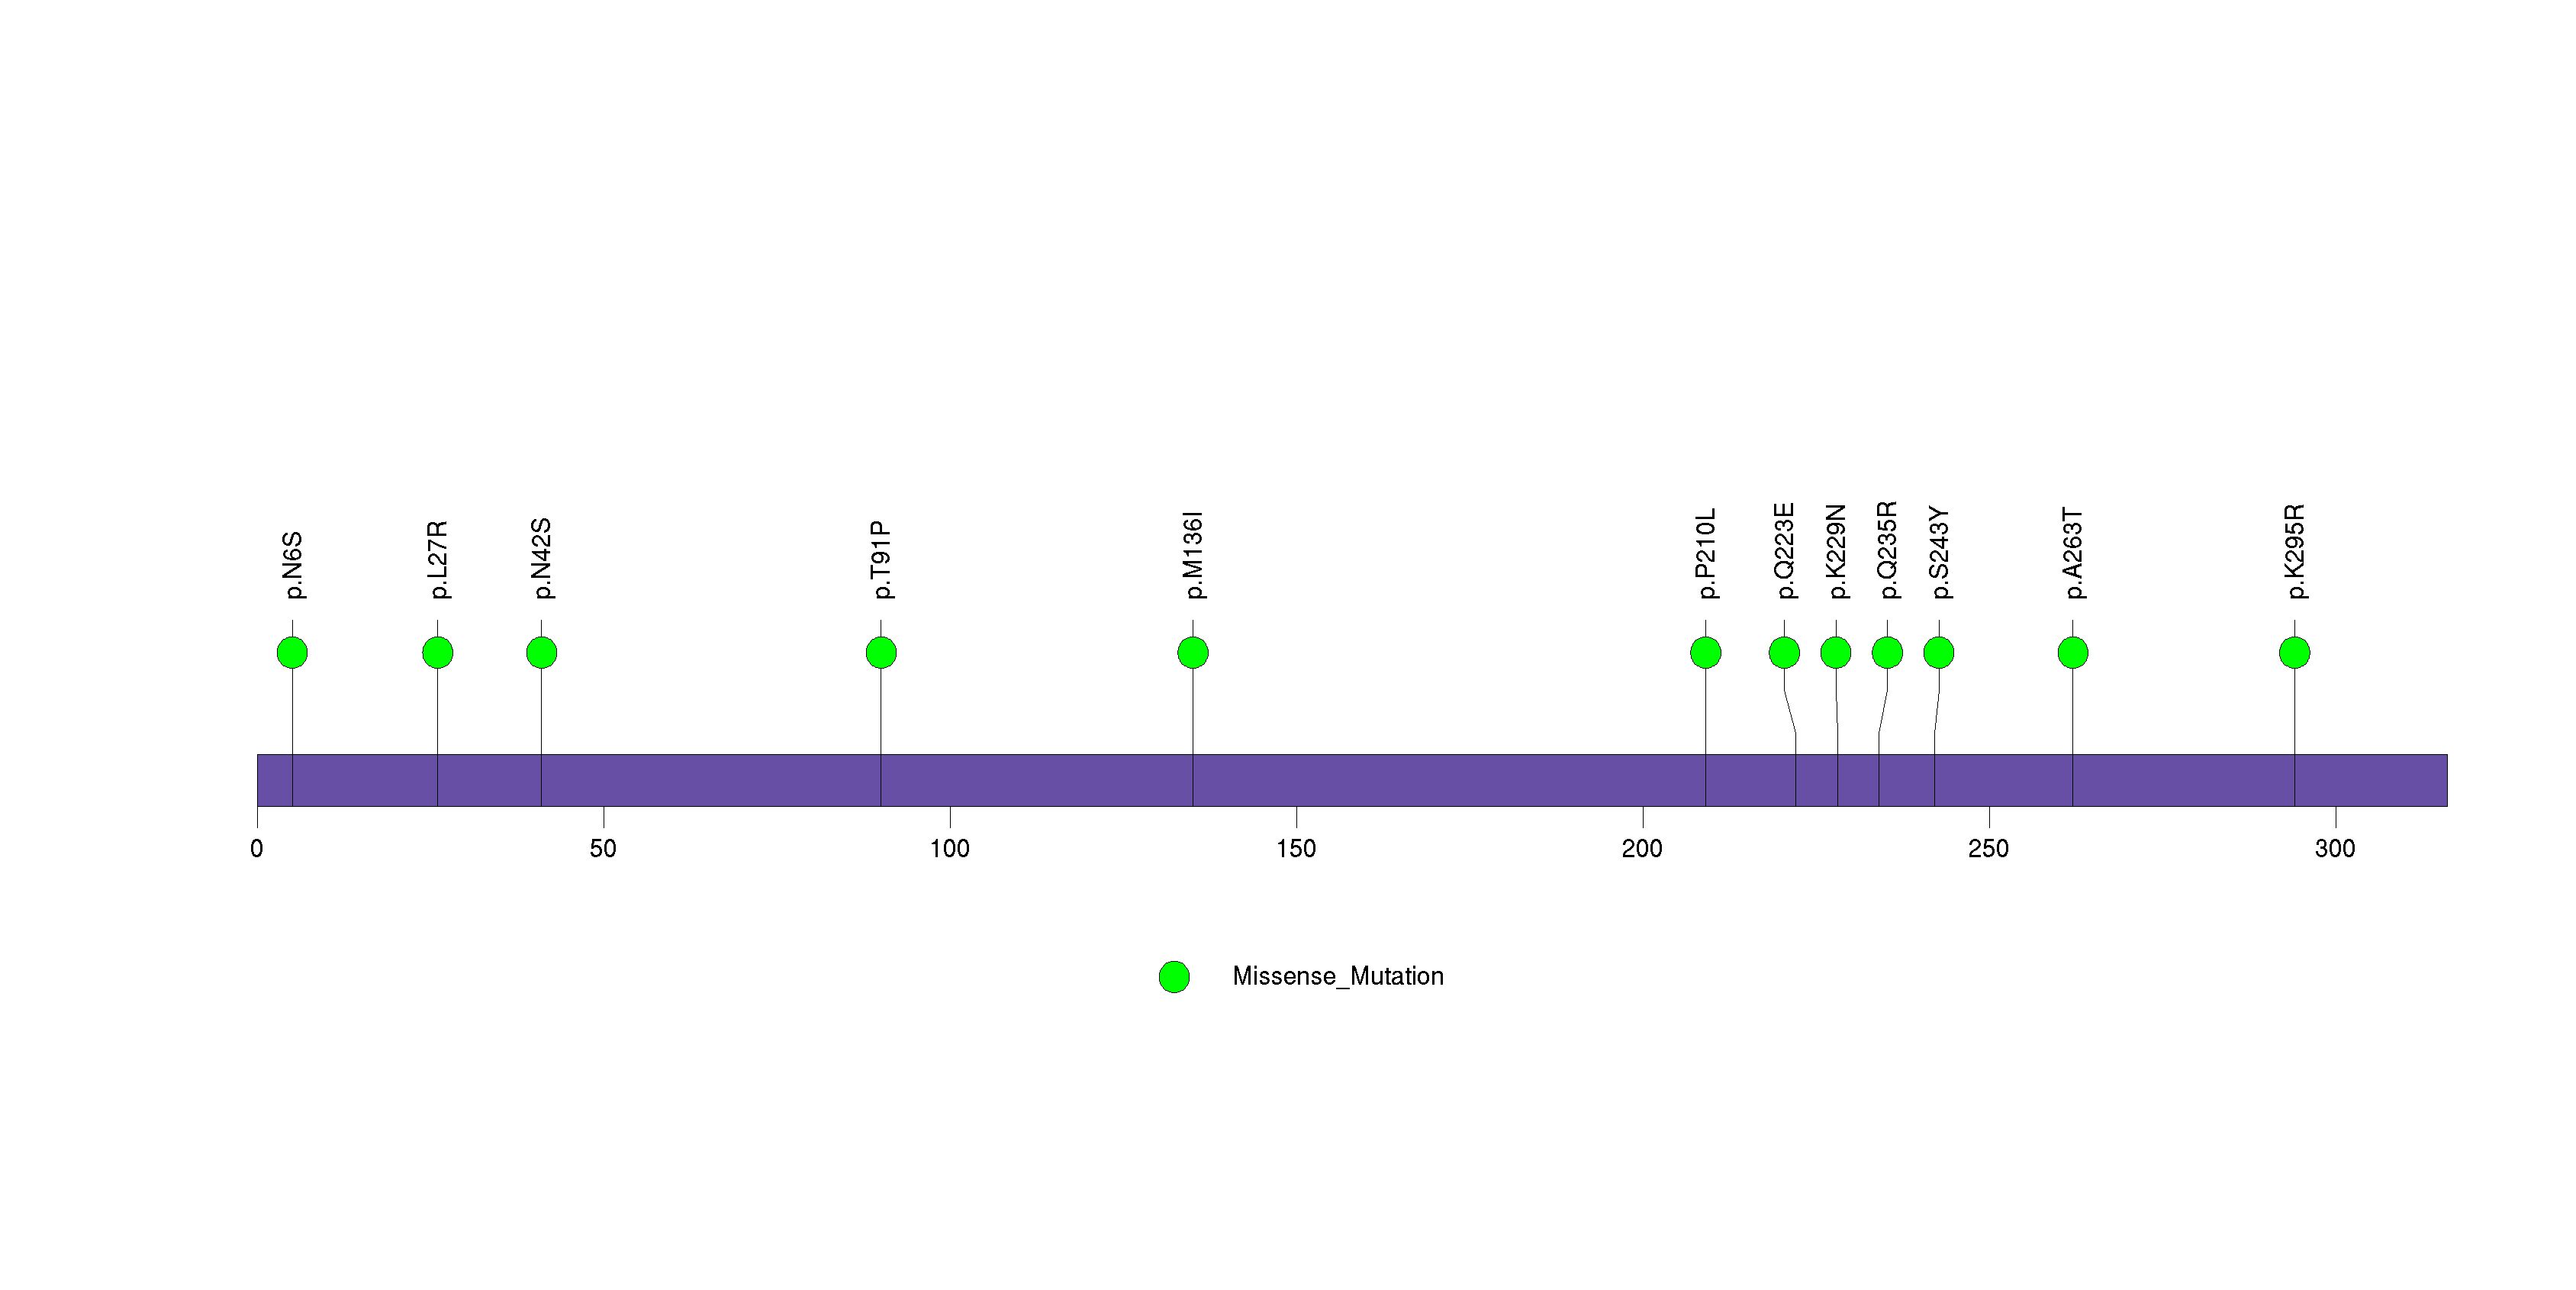
Figure S29. This figure depicts the distribution of mutations and mutation types across the FSHR significant gene.
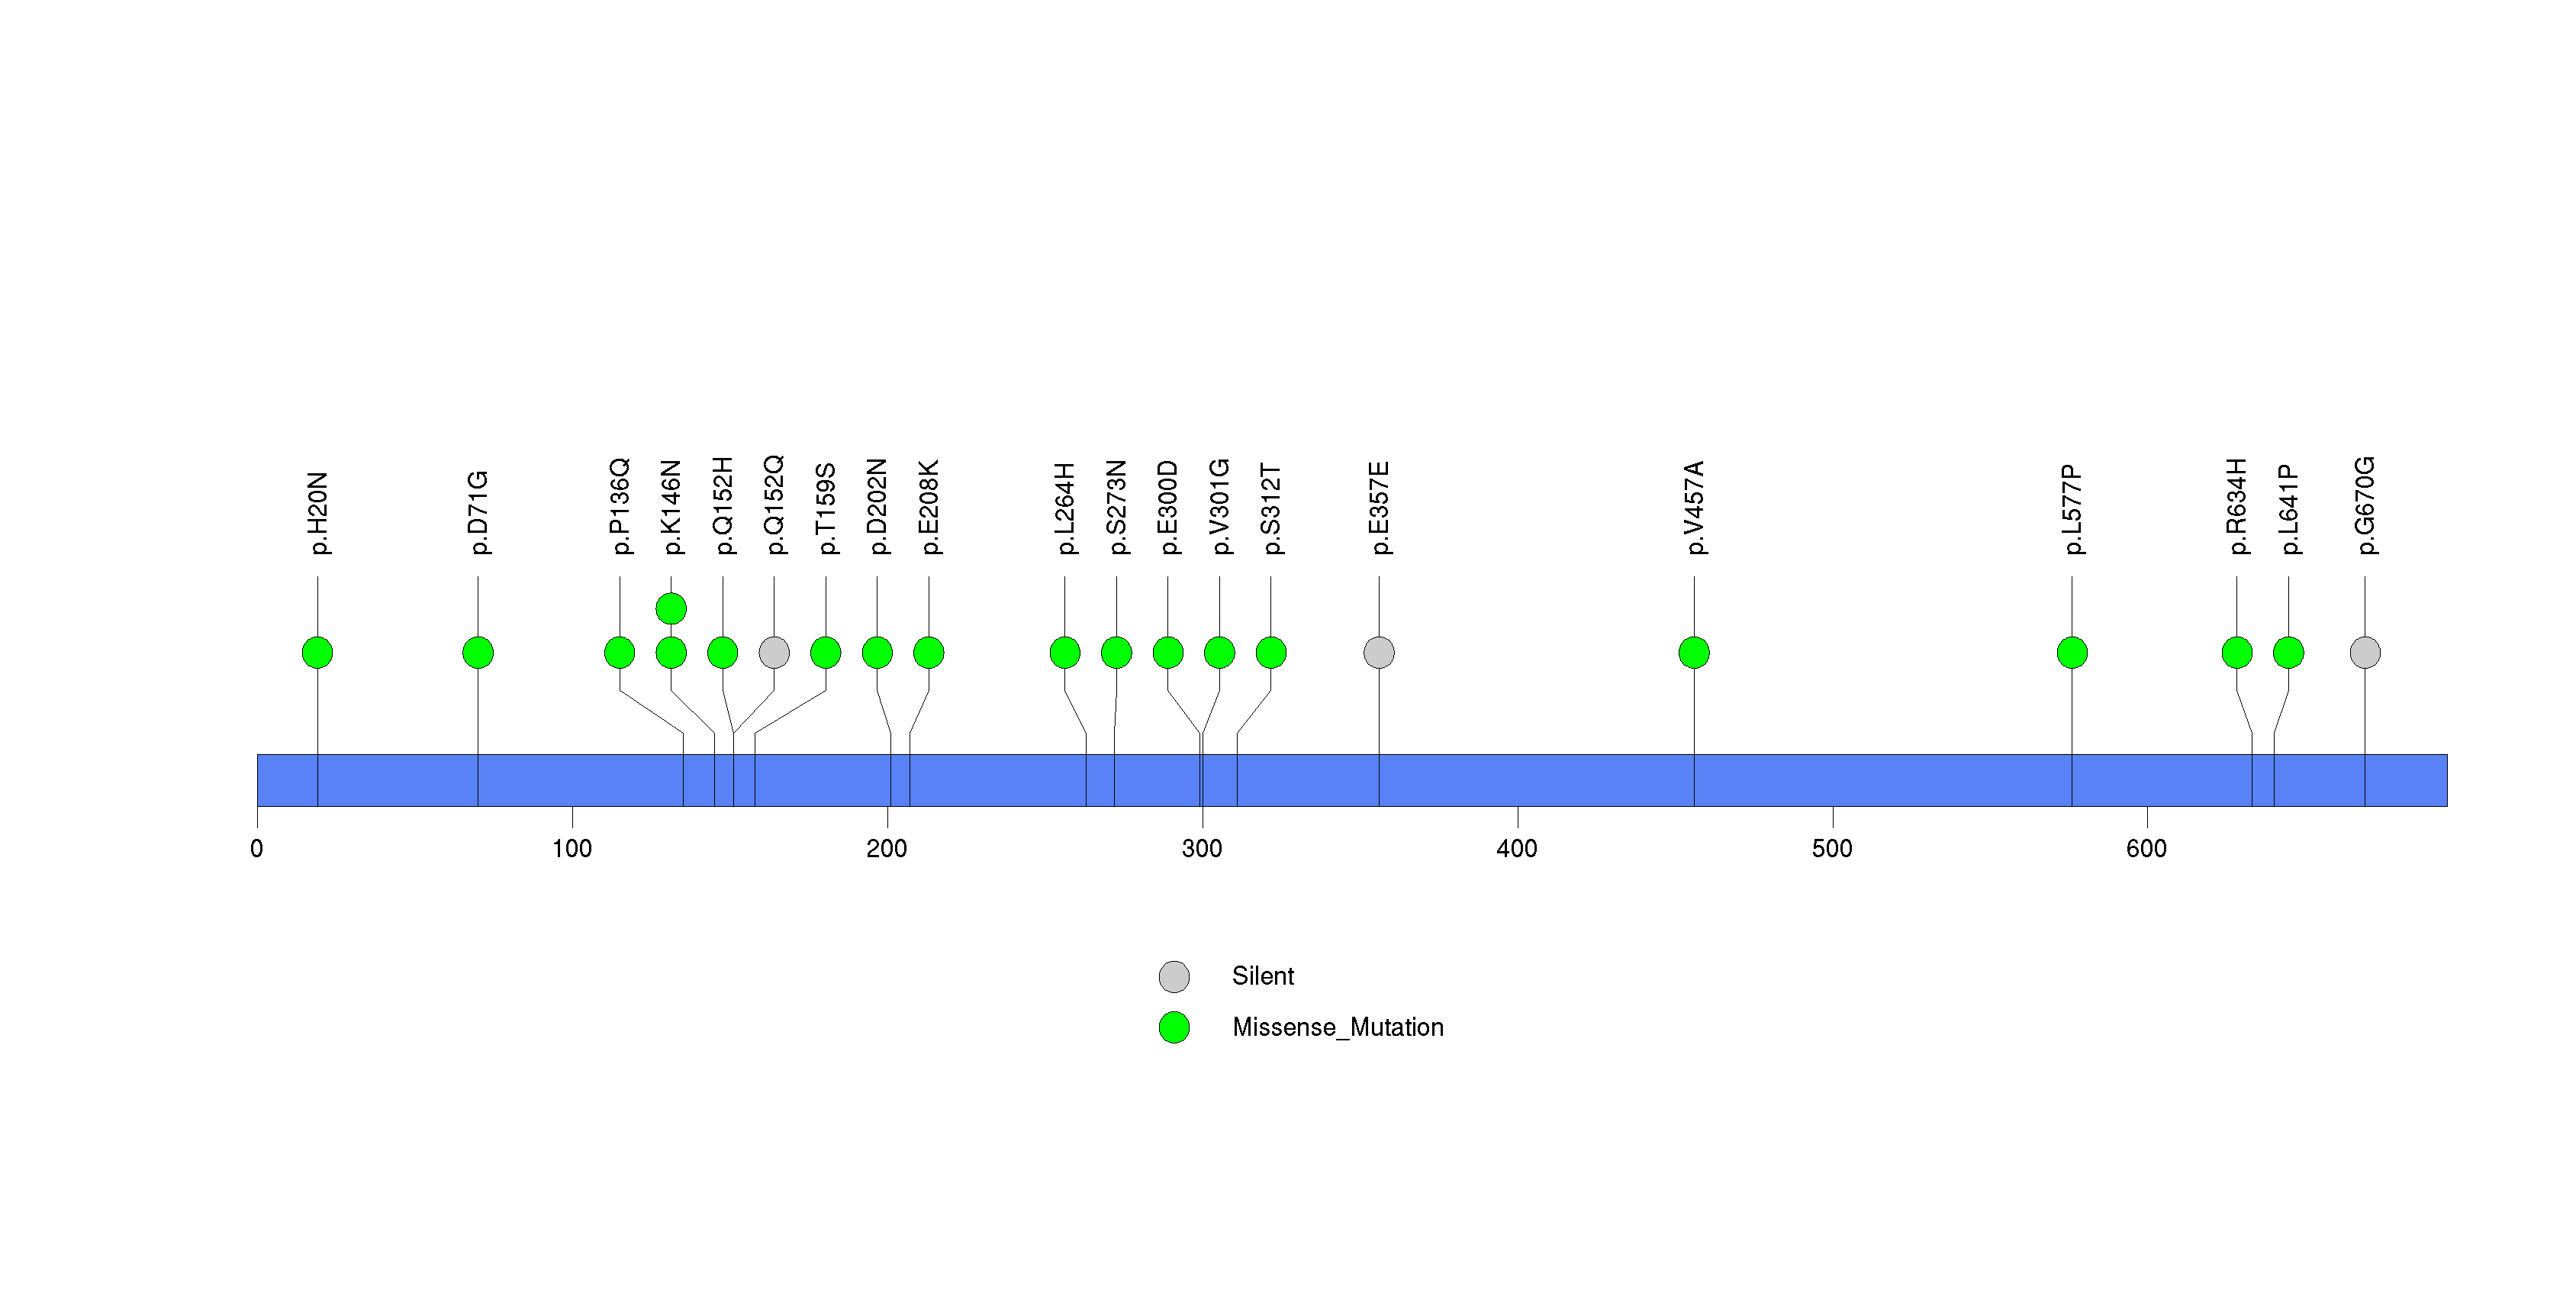
Figure S30. This figure depicts the distribution of mutations and mutation types across the OR5M3 significant gene.
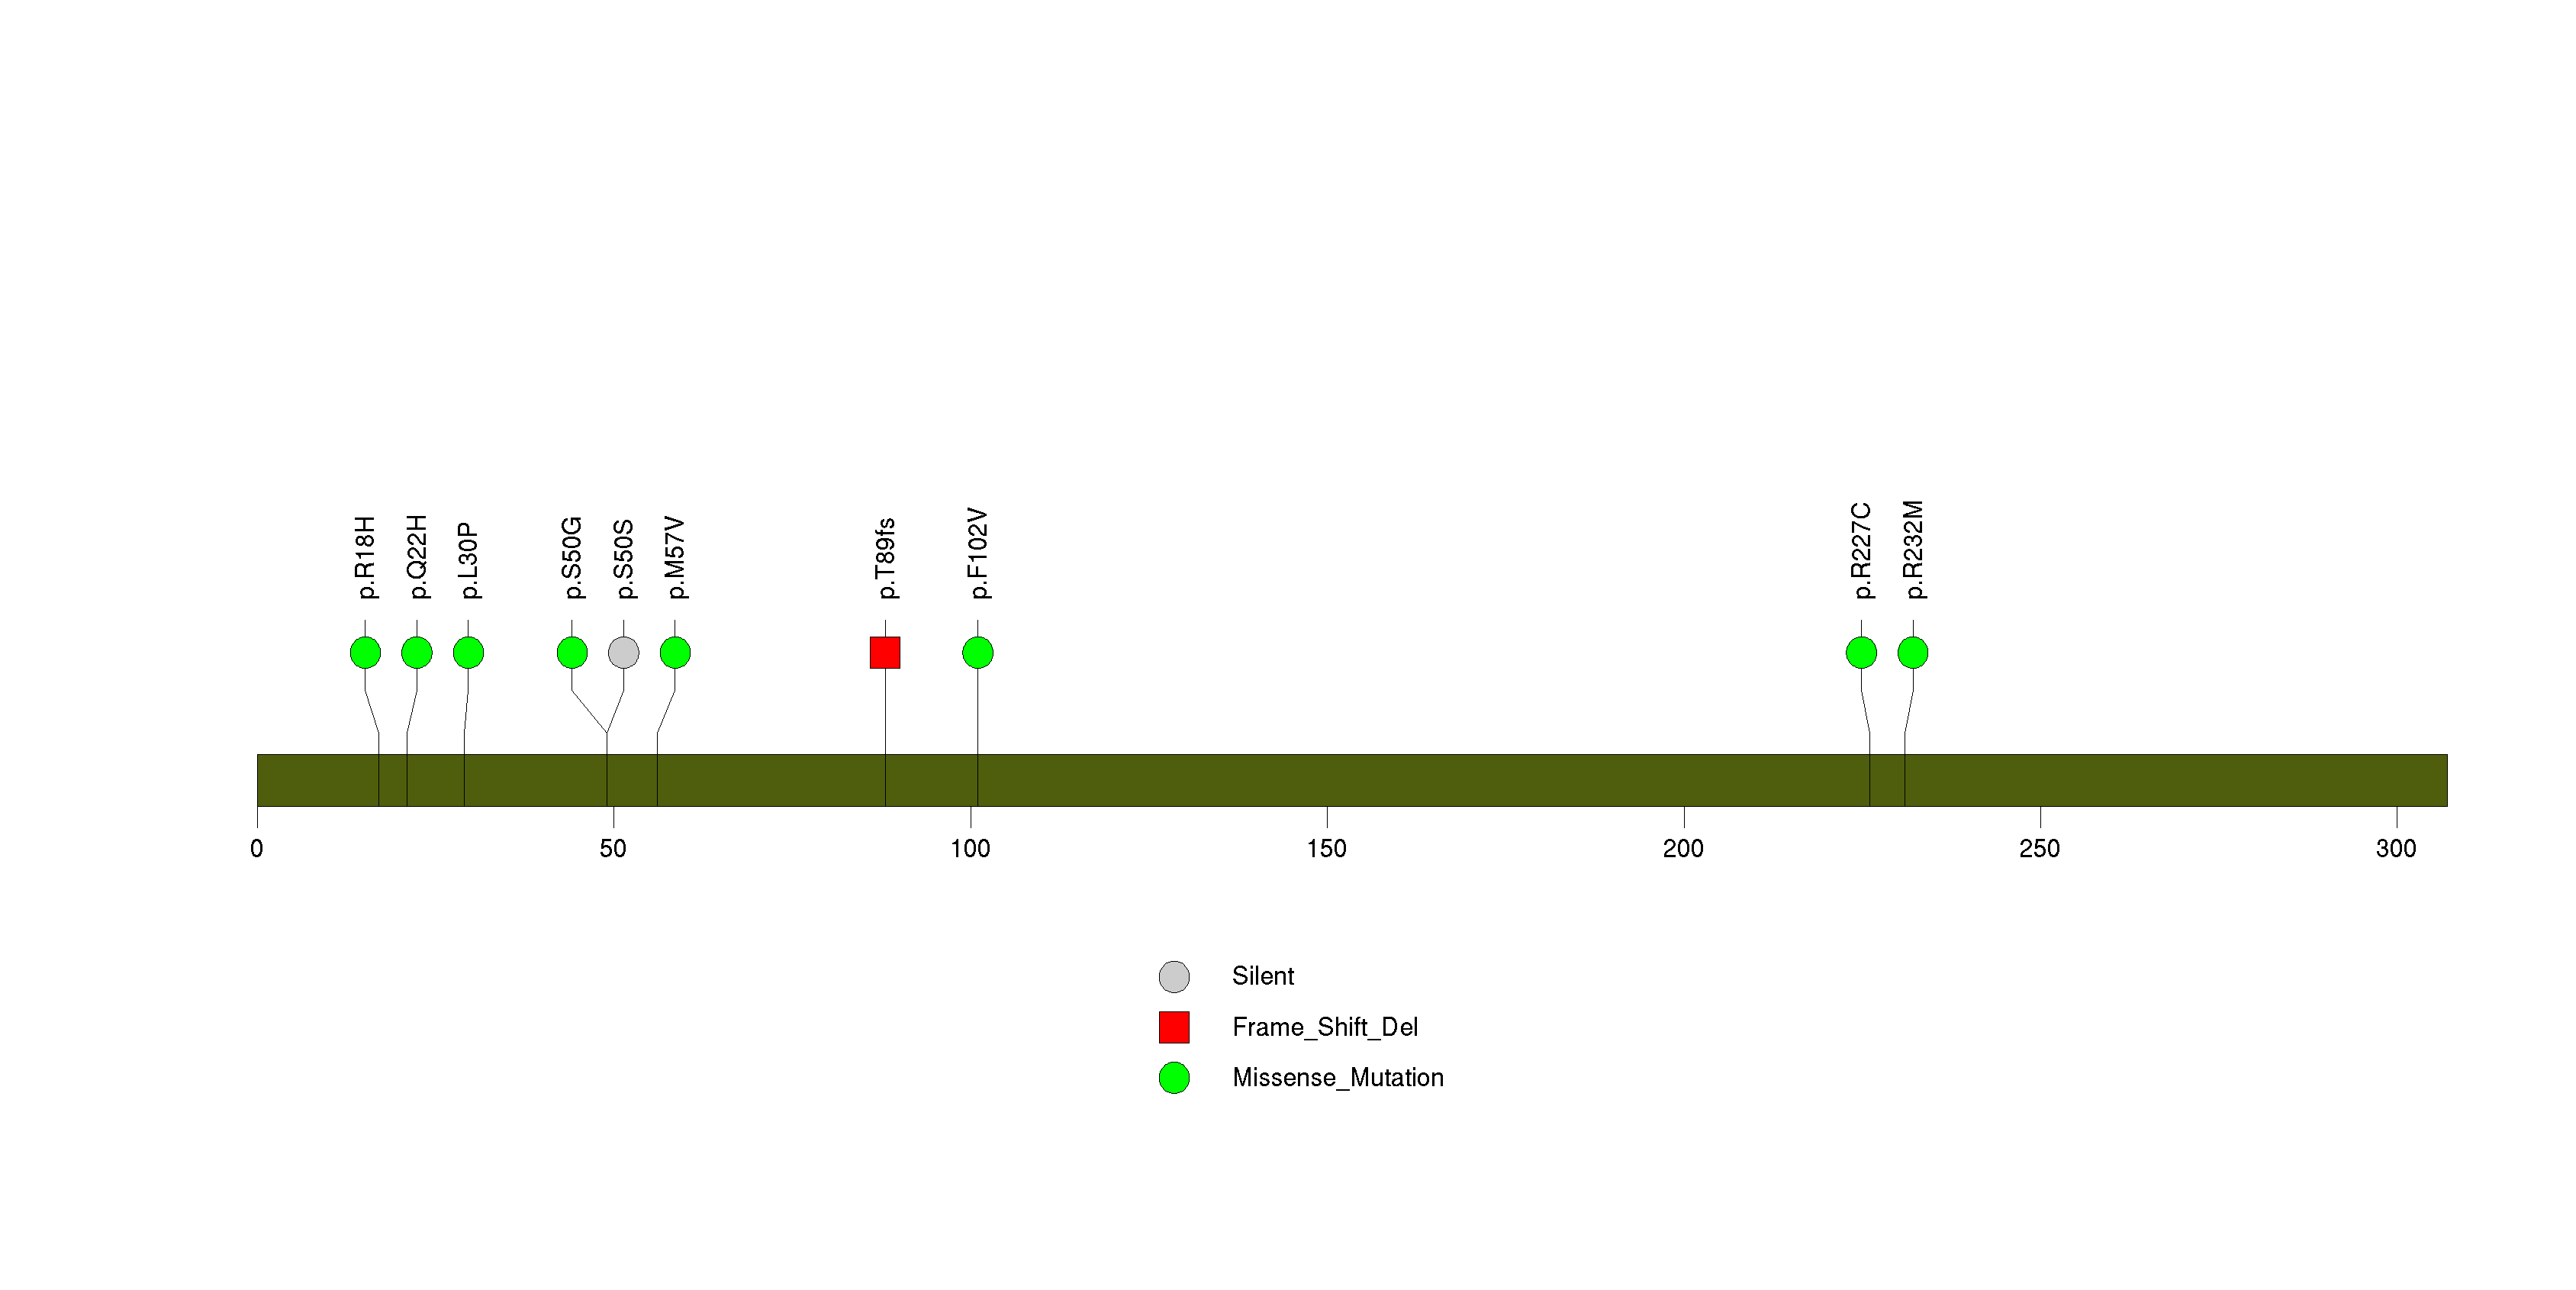
Figure S31. This figure depicts the distribution of mutations and mutation types across the ASTN2 significant gene.
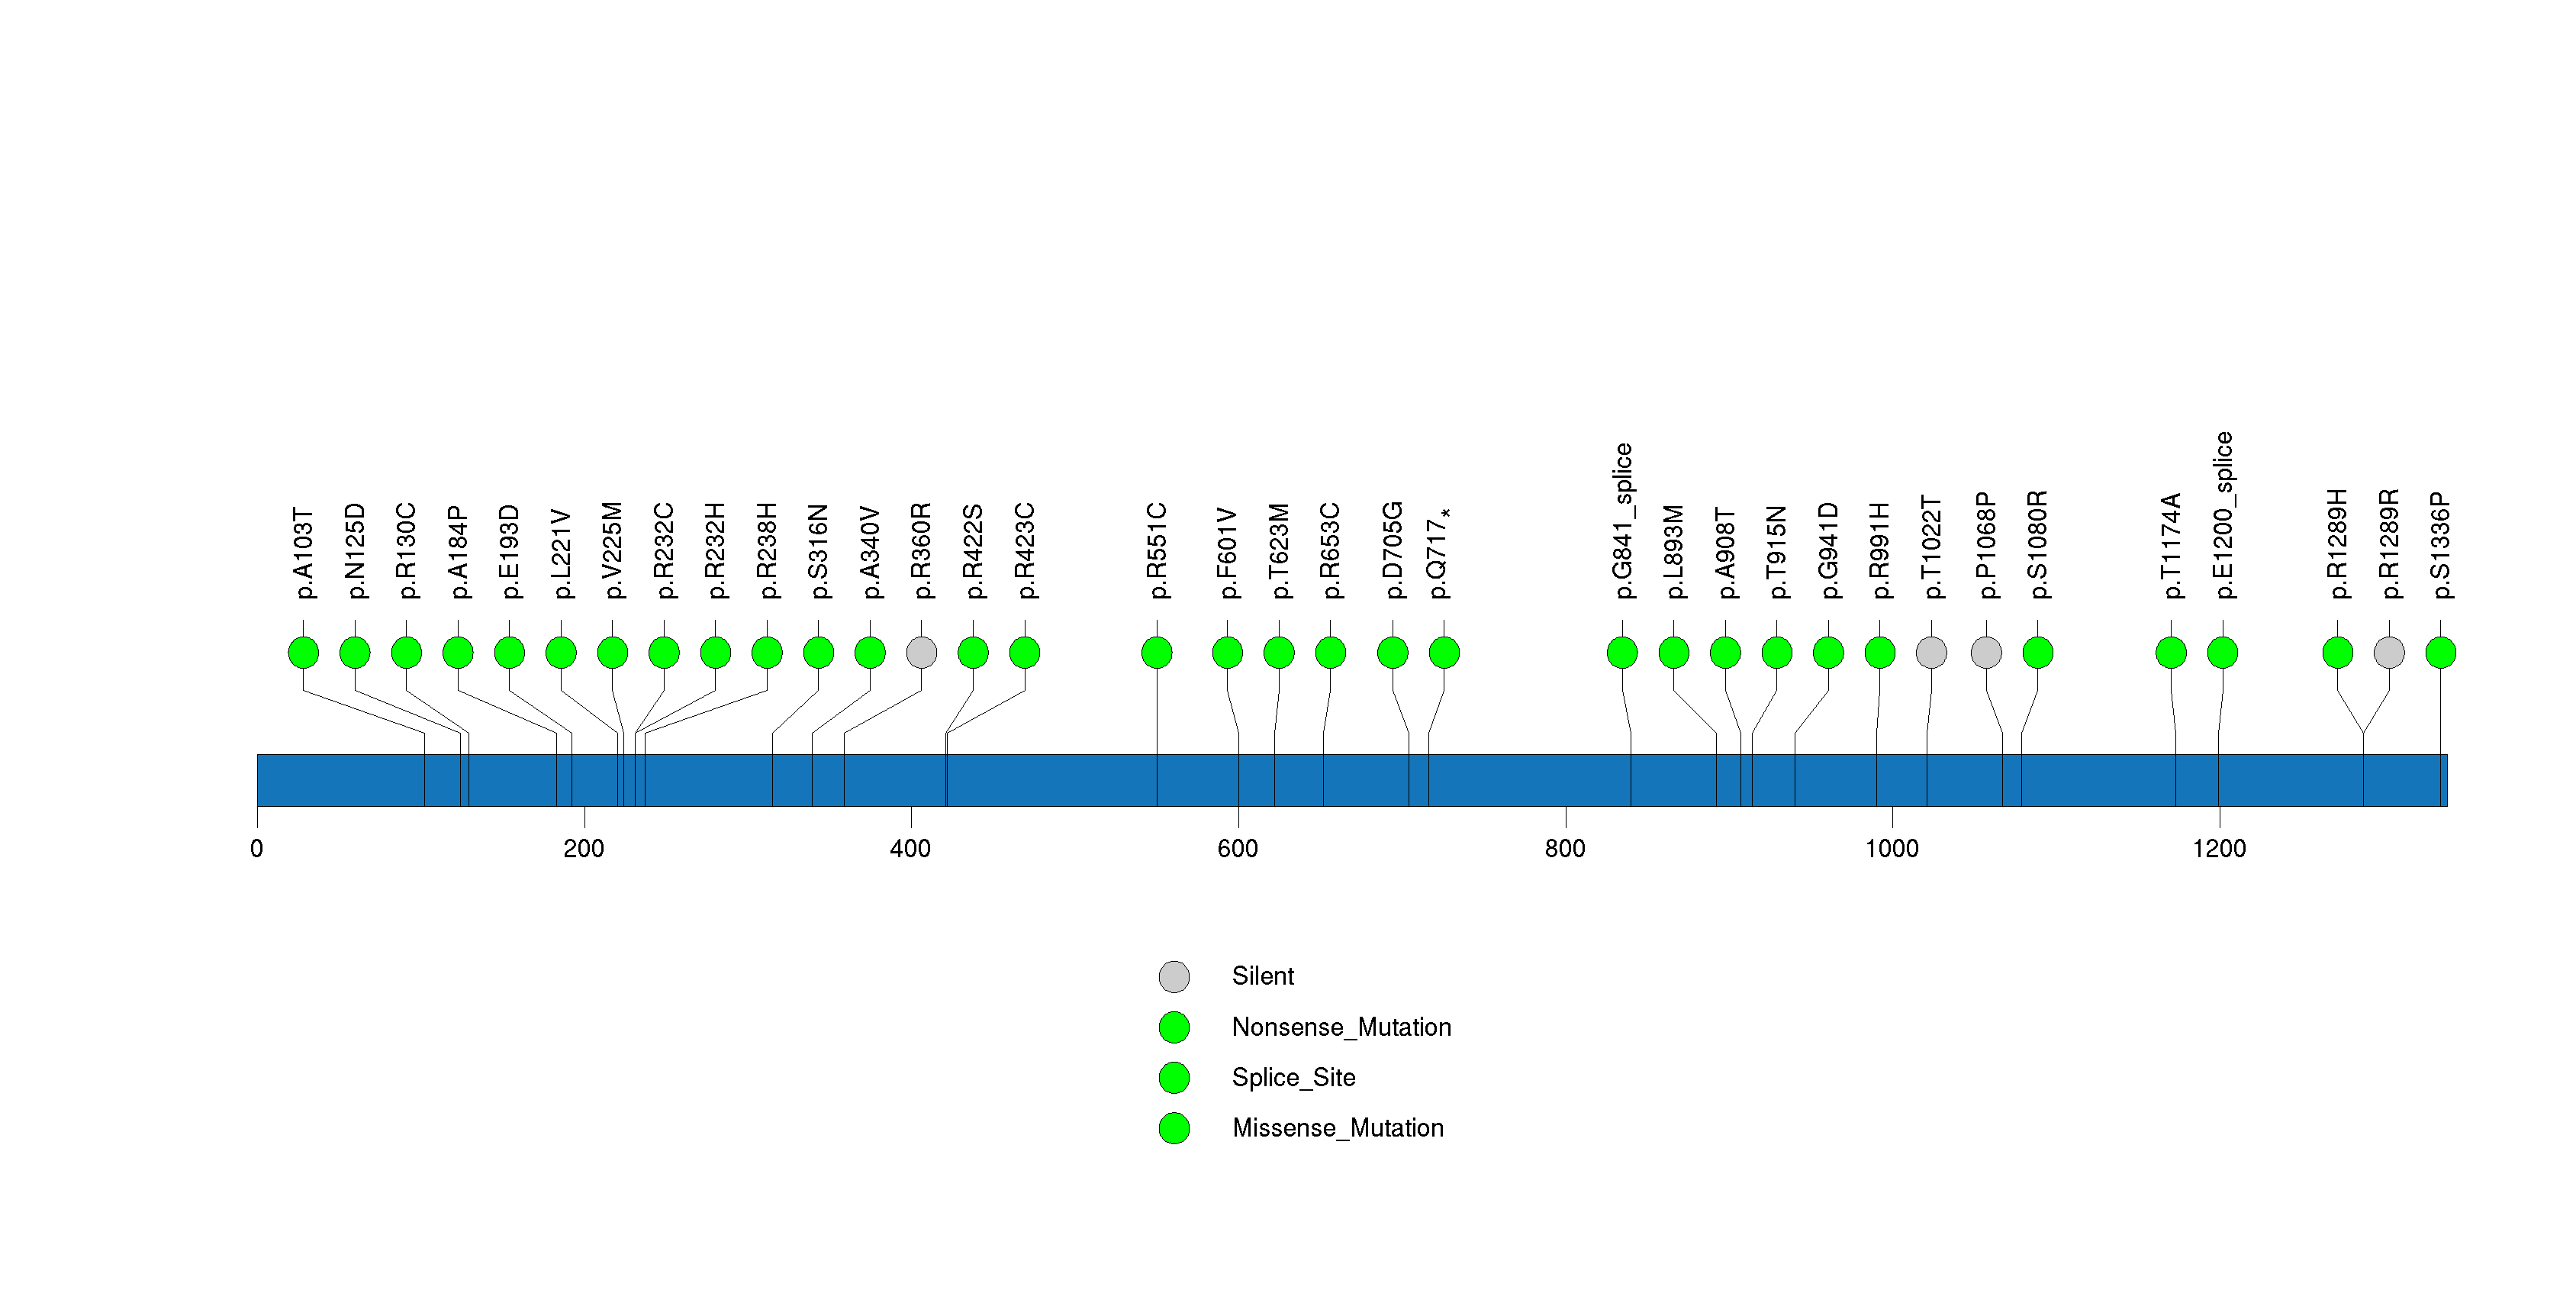
Figure S32. This figure depicts the distribution of mutations and mutation types across the ABCC9 significant gene.
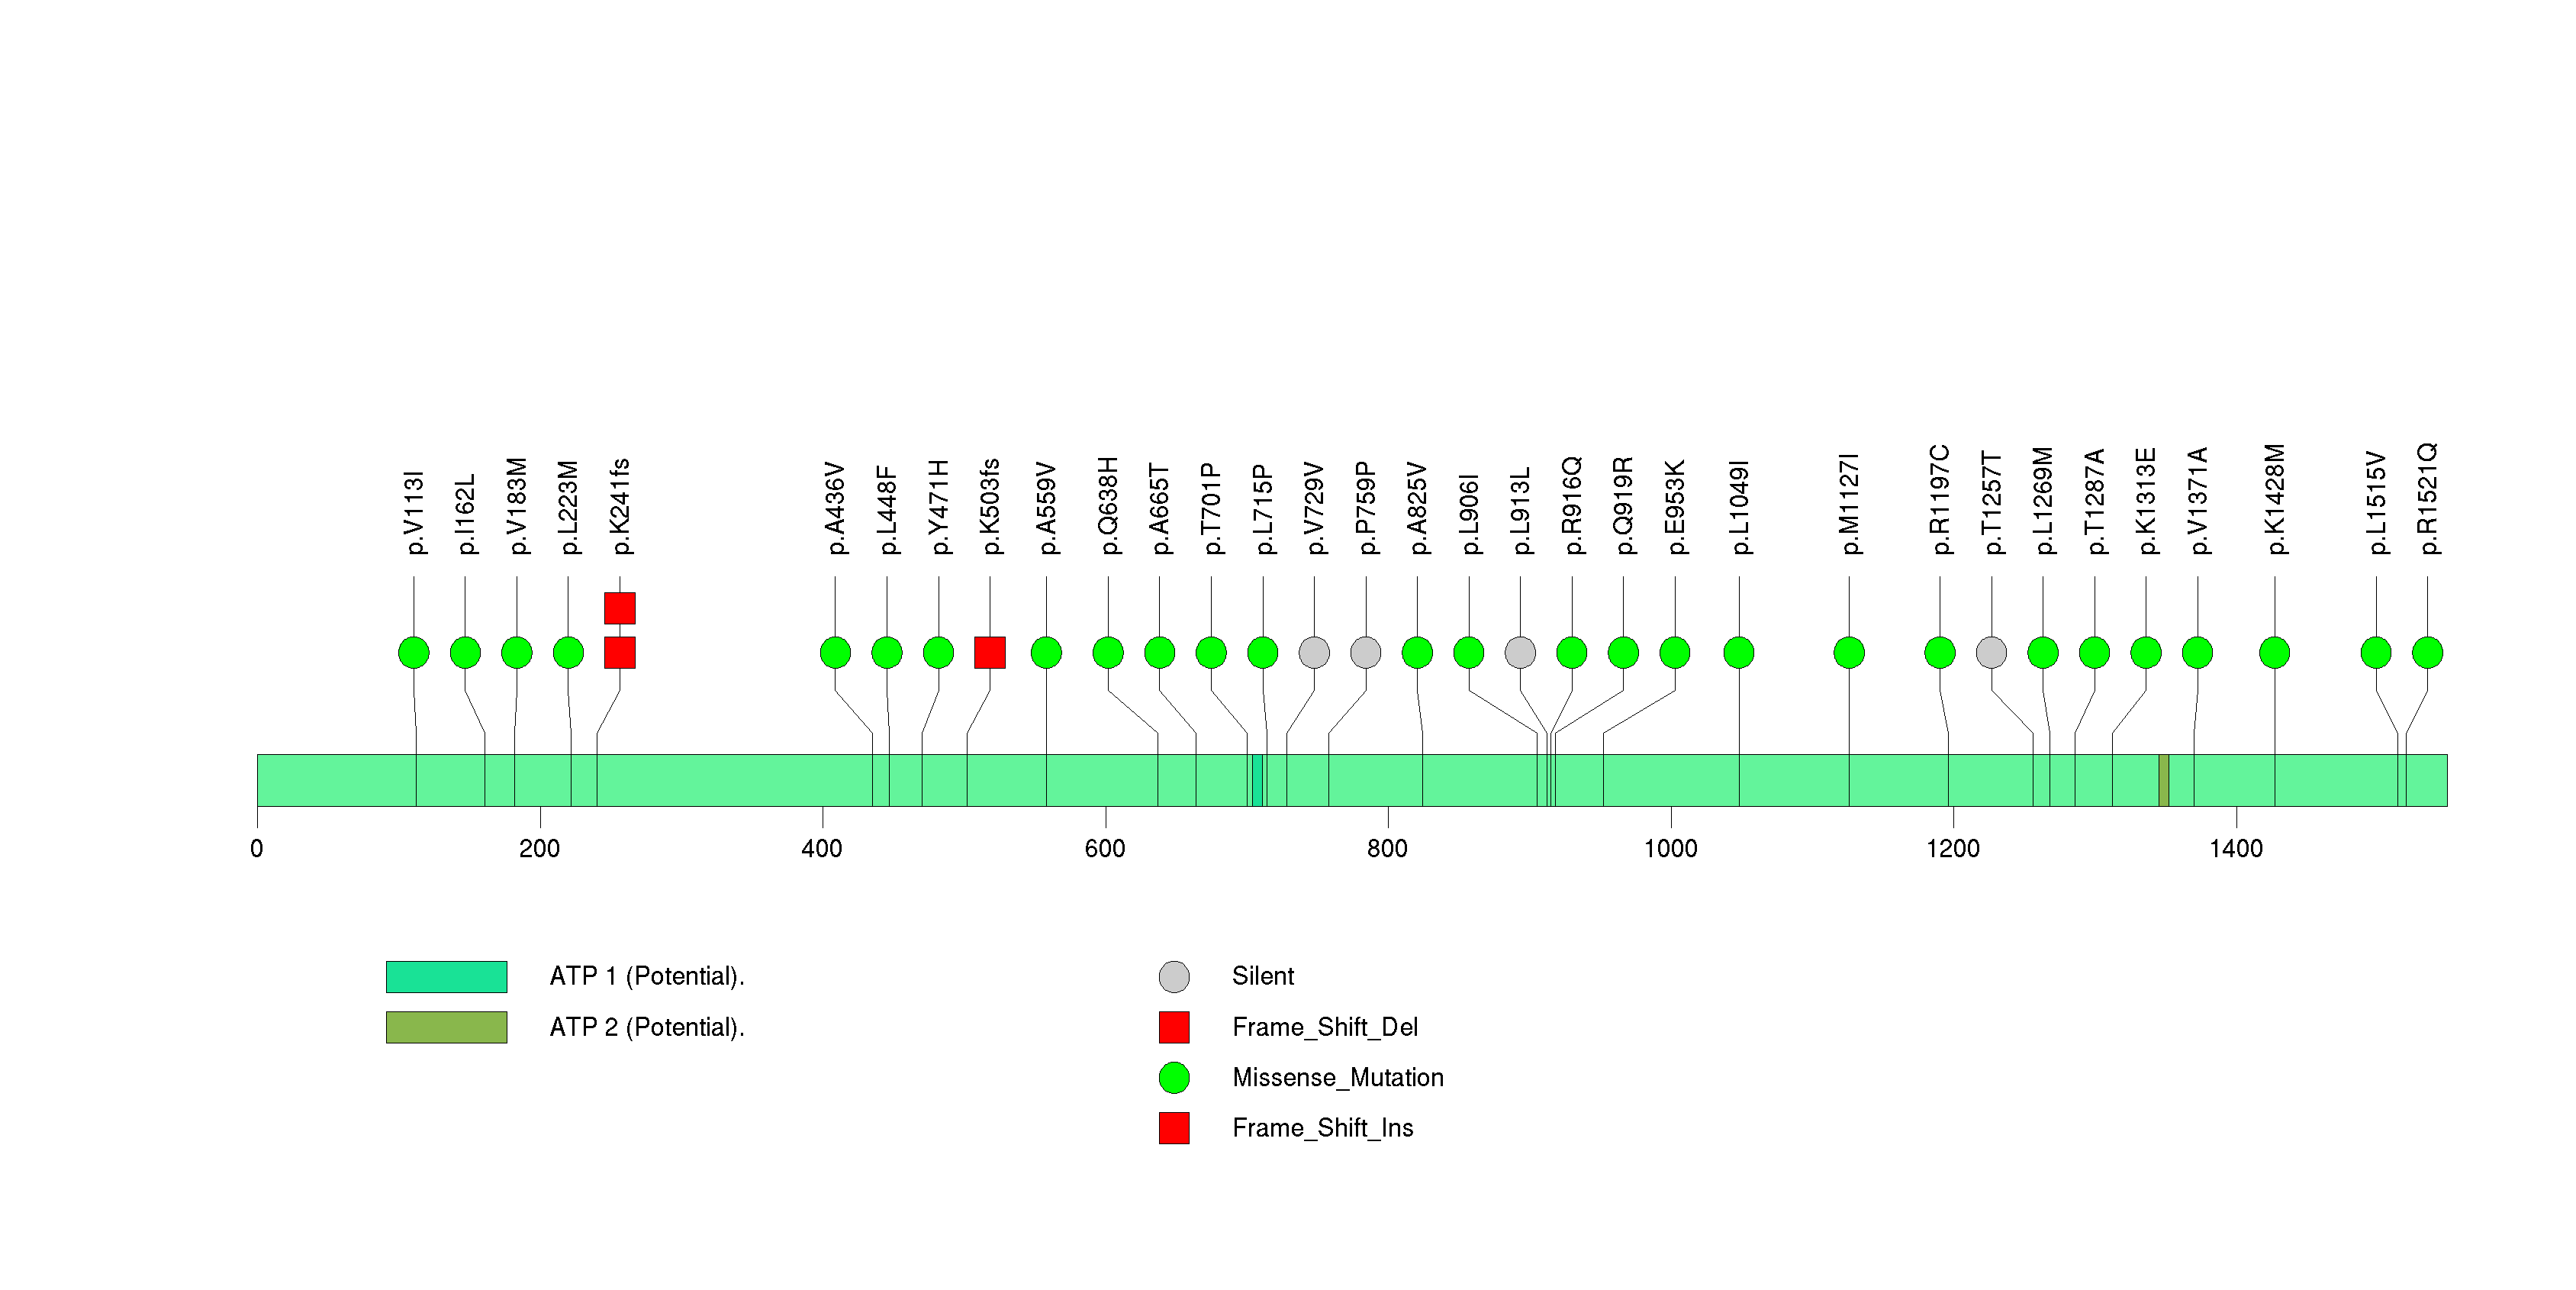
Figure S33. This figure depicts the distribution of mutations and mutation types across the TM7SF4 significant gene.
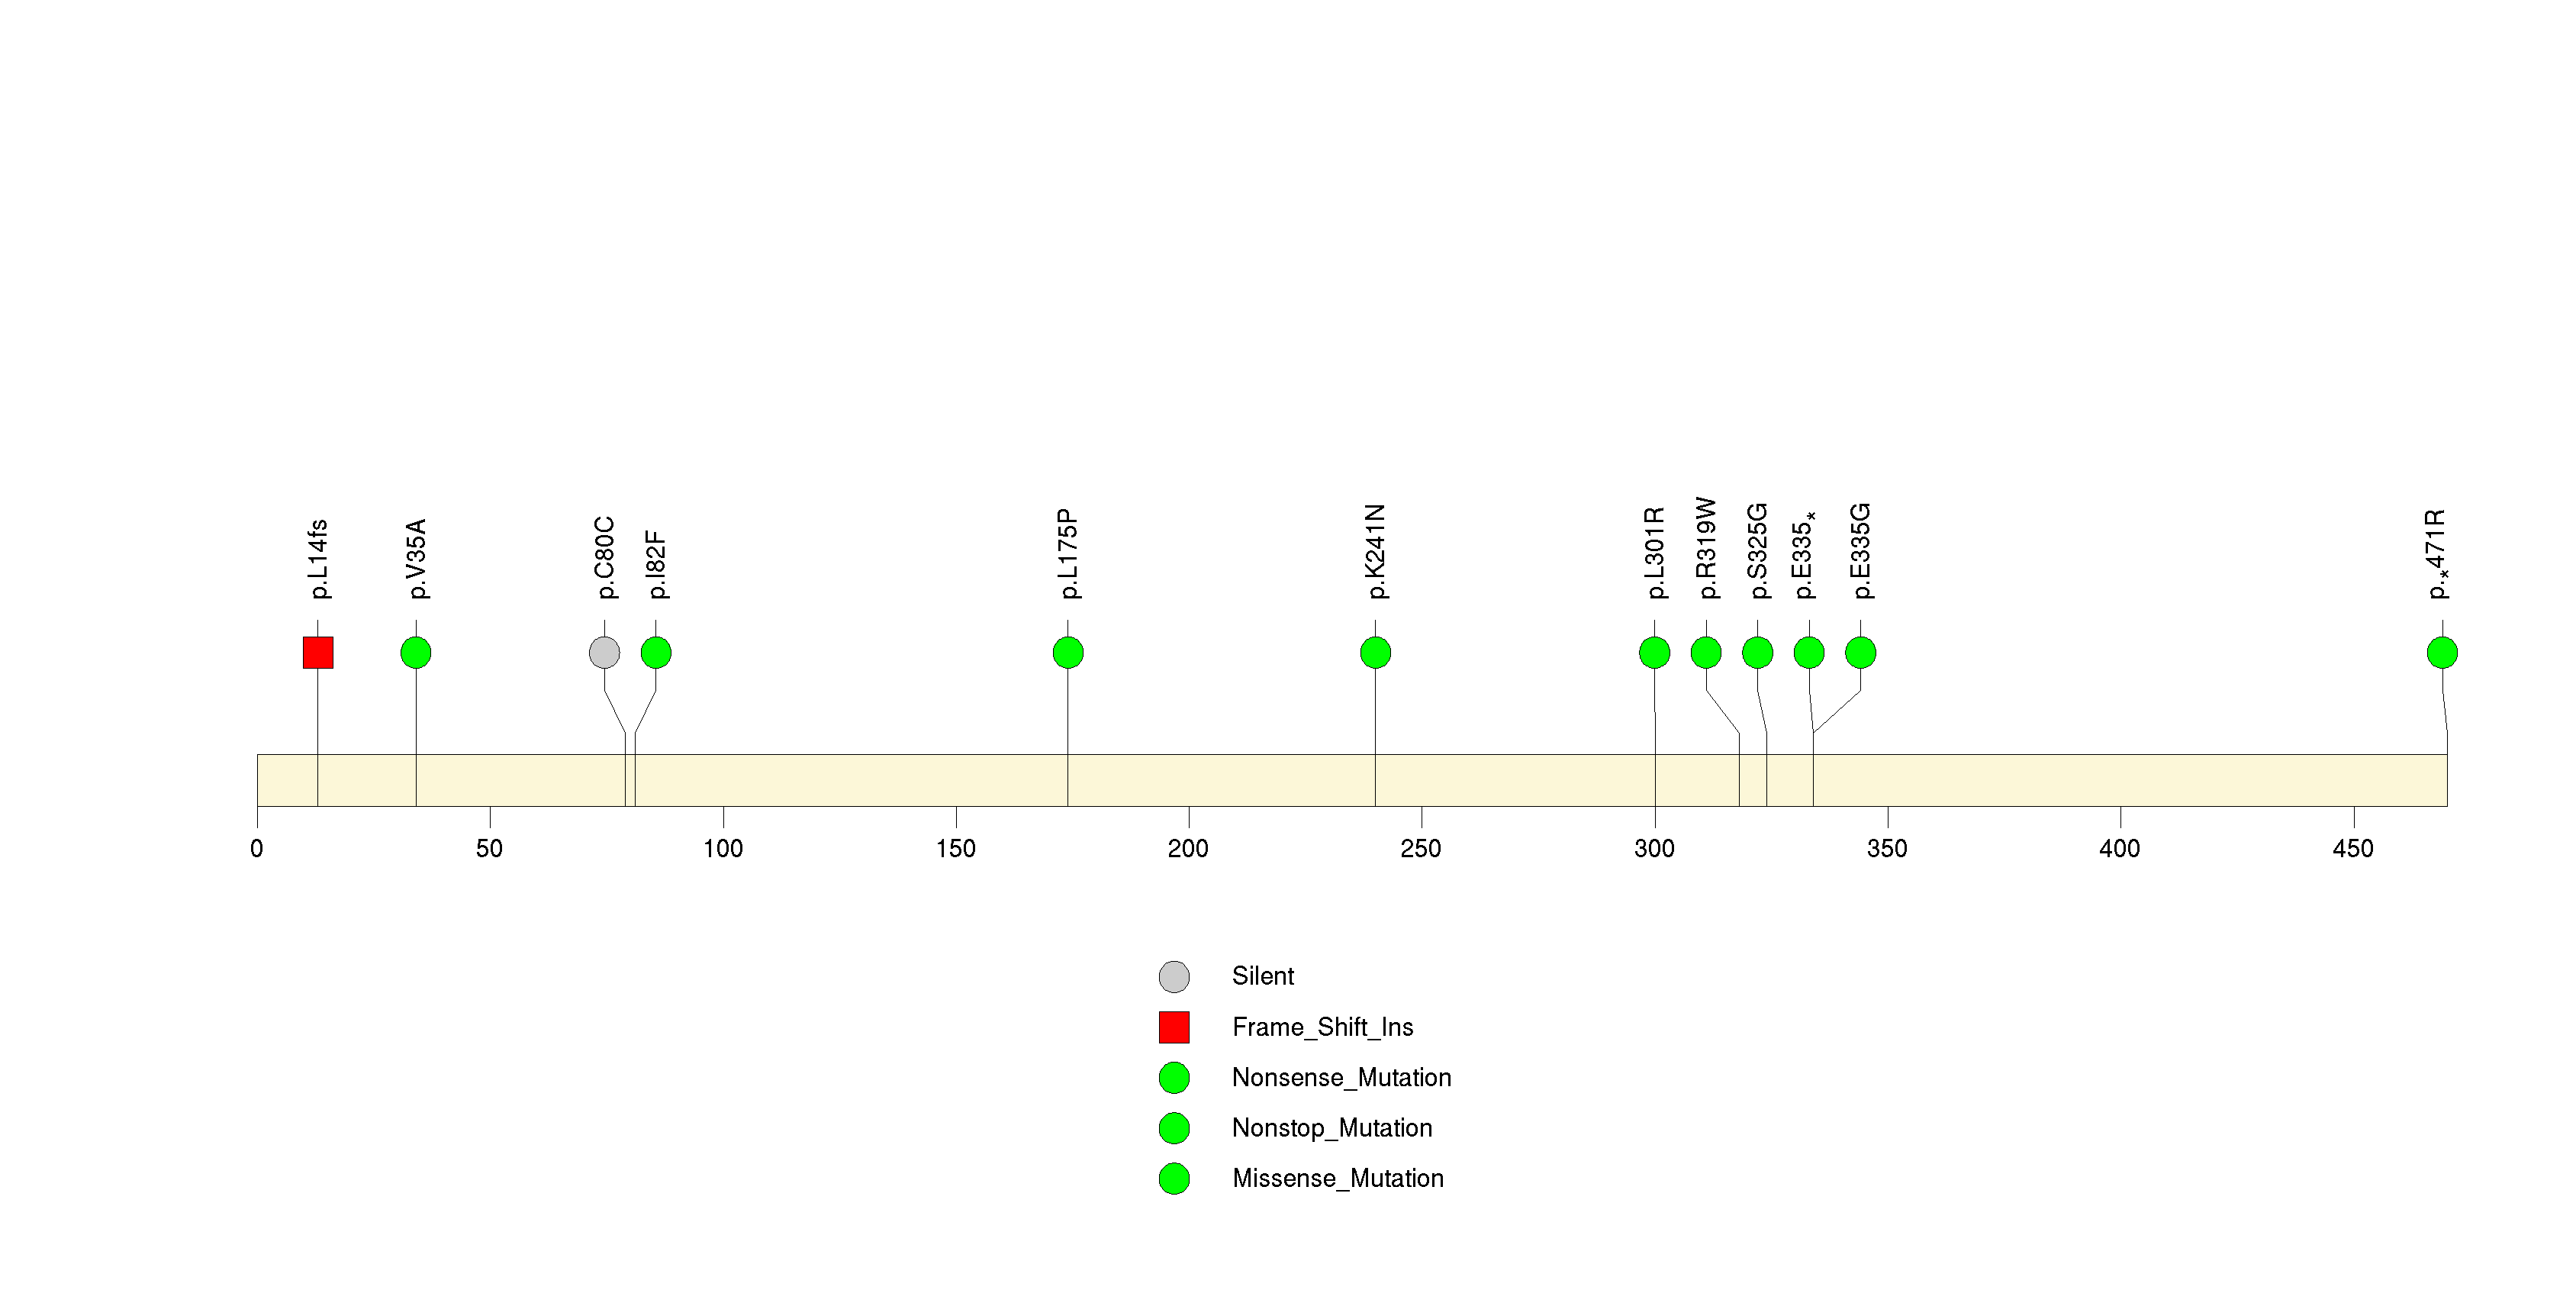
Figure S34. This figure depicts the distribution of mutations and mutation types across the OR4C16 significant gene.
In this analysis, COSMIC is used as a filter to increase power by restricting the territory of each gene. Cosmic version: v48.
Table 4. Get Full Table Significantly mutated genes (COSMIC territory only). To access the database please go to: COSMIC. Number of significant genes found: 30. Number of genes displayed: 10
| rank | gene | description | n | cos | n_cos | N_cos | cos_ev | p | q |
|---|---|---|---|---|---|---|---|---|---|
| 1 | ERBB3 | v-erb-b2 erythroblastic leukemia viral oncogene homolog 3 (avian) | 29 | 6 | 6 | 1326 | 6 | 0 | 0 |
| 2 | KRAS | v-Ki-ras2 Kirsten rat sarcoma viral oncogene homolog | 25 | 52 | 24 | 11492 | 166293 | 0 | 0 |
| 3 | TP53 | tumor protein p53 | 103 | 356 | 96 | 78676 | 26850 | 0 | 0 |
| 4 | PIK3CA | phosphoinositide-3-kinase, catalytic, alpha polypeptide | 62 | 220 | 54 | 48620 | 19016 | 0 | 0 |
| 5 | FBXW7 | F-box and WD repeat domain containing 7 | 20 | 91 | 13 | 20111 | 681 | 0 | 0 |
| 6 | SMAD4 | SMAD family member 4 | 21 | 159 | 17 | 35139 | 66 | 0 | 0 |
| 7 | CDH1 | cadherin 1, type 1, E-cadherin (epithelial) | 19 | 185 | 11 | 40885 | 35 | 6.9e-12 | 4.5e-09 |
| 8 | PTEN | phosphatase and tensin homolog (mutated in multiple advanced cancers 1) | 18 | 767 | 18 | 169507 | 551 | 1e-11 | 5.8e-09 |
| 9 | APC | adenomatous polyposis coli | 35 | 839 | 18 | 185419 | 374 | 4.5e-11 | 2.2e-08 |
| 10 | ERBB2 | v-erb-b2 erythroblastic leukemia viral oncogene homolog 2, neuro/glioblastoma derived oncogene homolog (avian) | 12 | 42 | 6 | 9282 | 75 | 2.7e-09 | 1.2e-06 |
Note:
n - number of (nonsilent) mutations in this gene across the individual set.
cos = number of unique mutated sites in this gene in COSMIC
n_cos = overlap between n and cos.
N_cos = number of individuals times cos.
cos_ev = total evidence: number of reports in COSMIC for mutations seen in this gene.
p = p-value for seeing the observed amount of overlap in this gene)
q = q-value, False Discovery Rate (Benjamini-Hochberg procedure)
Table 5. Get Full Table Genes with Clustered Mutations
| num | gene | desc | n | mindist | nmuts0 | nmuts3 | nmuts12 | npairs0 | npairs3 | npairs12 |
|---|---|---|---|---|---|---|---|---|---|---|
| 2260 | CBWD1 | COBW domain containing 1 | 30 | 0 | 378 | 378 | 378 | 378 | 378 | 378 |
| 10164 | PGM5 | phosphoglucomutase 5 | 25 | 0 | 154 | 154 | 191 | 154 | 154 | 191 |
| 10268 | PIK3CA | phosphoinositide-3-kinase, catalytic, alpha polypeptide | 62 | 0 | 130 | 231 | 269 | 130 | 231 | 269 |
| 14157 | TP53 | tumor protein p53 | 103 | 0 | 114 | 252 | 521 | 114 | 252 | 521 |
| 7240 | KRAS | v-Ki-ras2 Kirsten rat sarcoma viral oncogene homolog | 25 | 0 | 85 | 175 | 177 | 85 | 175 | 177 |
| 14283 | TRIM48 | tripartite motif-containing 48 | 14 | 0 | 78 | 78 | 78 | 78 | 78 | 78 |
| 4892 | FBXW7 | F-box and WD repeat domain containing 7 | 20 | 0 | 22 | 24 | 24 | 22 | 24 | 24 |
| 8732 | NBPF10 | neuroblastoma breakpoint family, member 10 | 20 | 0 | 22 | 22 | 23 | 22 | 22 | 23 |
| 4426 | ERBB3 | v-erb-b2 erythroblastic leukemia viral oncogene homolog 3 (avian) | 29 | 0 | 17 | 17 | 26 | 17 | 17 | 26 |
| 15089 | XPOT | exportin, tRNA (nuclear export receptor for tRNAs) | 9 | 0 | 15 | 15 | 15 | 15 | 15 | 15 |
Note:
n - number of mutations in this gene in the individual set.
mindist - distance (in aa) between closest pair of mutations in this gene
npairs3 - how many pairs of mutations are within 3 aa of each other.
npairs12 - how many pairs of mutations are within 12 aa of each other.
Table 6. Get Full Table A Ranked List of Significantly Mutated Genesets. (Source: MSigDB GSEA Cannonical Pathway Set).Number of significant genesets found: 18. Number of genesets displayed: 10
| rank | geneset | description | genes | N_genes | mut_tally | N | n | npat | nsite | nsil | n1 | n2 | n3 | n4 | n5 | n6 | p_ns_s | p | q |
|---|---|---|---|---|---|---|---|---|---|---|---|---|---|---|---|---|---|---|---|
| 1 | ARFPATHWAY | Cyclin-dependent kinase inhibitor 2A is a tumor suppressor that induces G1 arrest and can activate the p53 pathway, leading to G2/M arrest. | ABL1, CDKN2A, E2F1, MDM2, MYC, PIK3CA, PIK3R1, POLR1A, POLR1B, POLR1C, POLR1D, RAC1, RB1, TBX2, TP53, TWIST1 | 16 | ABL1(4), CDKN2A(7), E2F1(2), MDM2(3), MYC(3), PIK3CA(62), PIK3R1(8), POLR1A(12), POLR1B(4), POLR1C(2), POLR1D(1), RB1(6), TBX2(3), TP53(103), TWIST1(1) | 6653717 | 221 | 147 | 152 | 31 | 56 | 78 | 6 | 31 | 49 | 1 | 3.4e-09 | <1.00e-15 | <1.71e-13 |
| 2 | PLK3PATHWAY | Active Plk3 phosphorylates CDC25c, blocking the G2/M transition, and phosphorylates p53 to induce apoptosis. | ATM, ATR, CDC25C, CHEK1, CHEK2, CNK, TP53, YWHAH | 7 | ATM(30), ATR(13), CDC25C(7), CHEK1(4), CHEK2(7), TP53(103), YWHAH(3) | 5264371 | 167 | 129 | 129 | 15 | 45 | 34 | 5 | 32 | 48 | 3 | 5.9e-07 | <1.00e-15 | <1.71e-13 |
| 3 | RBPATHWAY | The ATM protein kinase recognizes DNA damage and blocks cell cycle progression by phosphorylating chk1 and p53, which normally inhibits Rb to allow G1/S transitions. | ATM, CDC2, CDC25A, CDC25B, CDC25C, CDK2, CDK4, CHEK1, MYT1, RB1, TP53, WEE1, YWHAH | 12 | ATM(30), CDC25A(3), CDC25B(4), CDC25C(7), CDK2(3), CHEK1(4), MYT1(14), RB1(6), TP53(103), WEE1(2), YWHAH(3) | 5794957 | 179 | 127 | 139 | 14 | 48 | 41 | 6 | 34 | 47 | 3 | 7e-10 | <1.00e-15 | <1.71e-13 |
| 4 | PMLPATHWAY | Ring-shaped PML nuclear bodies regulate transcription and are required co-activators in p53- and DAXX-mediated apoptosis. | CREBBP, DAXX, HRAS, PAX3, PML, PRAM-1, RARA, RB1, SIRT1, SP100, TNF, TNFRSF1A, TNFRSF1B, TNFRSF6, TNFSF6, TP53, UBL1 | 13 | CREBBP(27), DAXX(9), PAX3(7), PML(7), RARA(2), RB1(6), SIRT1(4), SP100(10), TNF(1), TNFRSF1A(3), TNFRSF1B(1), TP53(103) | 6230239 | 180 | 122 | 142 | 25 | 57 | 43 | 4 | 28 | 47 | 1 | 1.5e-07 | 1.11e-15 | 1.71e-13 |
| 5 | SA_G1_AND_S_PHASES | Cdk2, 4, and 6 bind cyclin D in G1, while cdk2/cyclin E promotes the G1/S transition. | ARF1, ARF3, CCND1, CDK2, CDK4, CDKN1A, CDKN1B, CDKN2A, CFL1, E2F1, E2F2, MDM2, NXT1, PRB1, TP53 | 15 | ARF1(4), CCND1(1), CDK2(3), CDKN1A(1), CDKN2A(7), CFL1(1), E2F1(2), E2F2(3), MDM2(3), NXT1(2), PRB1(2), TP53(103) | 2761021 | 132 | 114 | 95 | 12 | 38 | 31 | 3 | 16 | 43 | 1 | 6.1e-08 | 1.67e-15 | 2.05e-13 |
| 6 | RNAPATHWAY | dsRNA-activated protein kinase phosphorylates elF2a, which generally inhibits translation, and activates NF-kB to provoke inflammation. | CHUK, DNAJC3, EIF2S1, EIF2S2, MAP3K14, NFKB1, NFKBIA, PRKR, RELA, TP53 | 9 | DNAJC3(3), EIF2S1(2), EIF2S2(3), MAP3K14(3), NFKB1(7), NFKBIA(1), RELA(3), TP53(103) | 3207445 | 125 | 106 | 88 | 7 | 34 | 29 | 2 | 20 | 39 | 1 | 3.6e-09 | 3.77e-15 | 2.80e-13 |
| 7 | CHEMICALPATHWAY | DNA damage promotes Bid cleavage, which stimulates mitochondrial cytochrome c release and consequent caspase activation, resulting in apoptosis. | ADPRT, AKT1, APAF1, ATM, BAD, BAX, BCL2, BCL2L1, BID, CASP3, CASP6, CASP7, CASP9, CYCS, EIF2S1, PRKCA, PRKCB1, PTK2, PXN, STAT1, TLN1, TP53 | 20 | AKT1(3), APAF1(5), ATM(30), BAD(3), BAX(1), BCL2(2), BID(2), CASP3(2), CASP6(1), CASP7(2), CASP9(2), EIF2S1(2), PRKCA(3), PTK2(10), PXN(3), STAT1(7), TLN1(14), TP53(103) | 8999666 | 195 | 131 | 156 | 21 | 57 | 46 | 11 | 30 | 48 | 3 | 1.2e-09 | 4.22e-15 | 2.80e-13 |
| 8 | ATMPATHWAY | The tumor-suppressing protein kinase ATM responds to radiation-induced DNA damage by blocking cell-cycle progression and activating DNA repair. | ABL1, ATM, BRCA1, CDKN1A, CHEK1, CHEK2, GADD45A, JUN, MAPK8, MDM2, MRE11A, NBS1, NFKB1, NFKBIA, RAD50, RAD51, RBBP8, RELA, TP53, TP73 | 19 | ABL1(4), ATM(30), BRCA1(14), CDKN1A(1), CHEK1(4), CHEK2(7), JUN(3), MAPK8(5), MDM2(3), MRE11A(2), NFKB1(7), NFKBIA(1), RAD50(9), RAD51(1), RBBP8(6), RELA(3), TP53(103), TP73(2) | 9791154 | 205 | 137 | 167 | 22 | 51 | 47 | 8 | 44 | 52 | 3 | 7.8e-09 | 4.44e-15 | 2.80e-13 |
| 9 | P53PATHWAY | p53 induces cell cycle arrest or apoptosis under conditions of DNA damage. | APAF1, ATM, BAX, BCL2, CCND1, CCNE1, CDK2, CDK4, CDKN1A, E2F1, GADD45A, MDM2, PCNA, RB1, TIMP3, TP53 | 16 | APAF1(5), ATM(30), BAX(1), BCL2(2), CCND1(1), CCNE1(3), CDK2(3), CDKN1A(1), E2F1(2), MDM2(3), PCNA(2), RB1(6), TIMP3(3), TP53(103) | 5961338 | 165 | 128 | 126 | 19 | 44 | 40 | 5 | 30 | 43 | 3 | 3.5e-07 | 4.66e-15 | 2.80e-13 |
| 10 | P53HYPOXIAPATHWAY | Hypoxia induces p53 accumulation and consequent apoptosis with p53-mediated cell cycle arrest, which is present under conditions of DNA damage. | ABCB1, AKT1, ATM, BAX, CDKN1A, CPB2, CSNK1A1, CSNK1D, FHL2, GADD45A, HIC1, HIF1A, HSPA1A, HSPCA, IGFBP3, MAPK8, MDM2, NFKBIB, NQO1, TP53 | 19 | ABCB1(18), AKT1(3), ATM(30), BAX(1), CDKN1A(1), CPB2(6), CSNK1A1(3), CSNK1D(2), FHL2(2), HIC1(5), HIF1A(5), HSPA1A(1), IGFBP3(5), MAPK8(5), MDM2(3), NFKBIB(5), NQO1(2), TP53(103) | 6815341 | 200 | 134 | 162 | 20 | 56 | 47 | 6 | 33 | 55 | 3 | 1.2e-10 | 5.00e-15 | 2.80e-13 |
Table 7. Get Full Table A Ranked List of Significantly Mutated Genesets (Excluding Significantly Mutated Genes). Number of significant genesets found: 0. Number of genesets displayed: 10
| rank | geneset | description | genes | N_genes | mut_tally | N | n | npat | nsite | nsil | n1 | n2 | n3 | n4 | n5 | n6 | p_ns_s | p | q |
|---|---|---|---|---|---|---|---|---|---|---|---|---|---|---|---|---|---|---|---|
| 1 | HSA00472_D_ARGININE_AND_D_ORNITHINE_METABOLISM | Genes involved in D-arginine and D-ornithine metabolism | DAO | 1 | DAO(8) | 238419 | 8 | 8 | 8 | 0 | 3 | 1 | 1 | 1 | 2 | 0 | 0.086 | 0.002 | 1 |
| 2 | SLRPPATHWAY | Small leucine-rich proteoglycans (SLRPs) interact with and reorganize collagen fibers in the extracellular matrix. | BGN, DCN, DSPG3, FMOD, KERA, LUM | 5 | BGN(1), DCN(5), FMOD(8), KERA(1), LUM(5) | 1194047 | 20 | 19 | 20 | 4 | 10 | 4 | 1 | 5 | 0 | 0 | 0.13 | 0.31 | 1 |
| 3 | EOSINOPHILSPATHWAY | Recruitment of eosinophils in the inflammatory response observed in asthma occurs via the chemoattractant eotaxin binding to the CCR3 receptor. | CCL11, CCL5, CCR3, CSF2, HLA-DRA, HLA-DRB1, IL3, IL5 | 8 | CCL11(1), CCL5(1), CCR3(6), HLA-DRA(6), IL3(1) | 999988 | 15 | 14 | 15 | 3 | 8 | 5 | 0 | 2 | 0 | 0 | 0.13 | 0.43 | 1 |
| 4 | NUCLEOTIDE_SUGARS_METABOLISM | GALE, GALT, TGDS, UGDH, UXS1 | 5 | GALE(1), GALT(1), TGDS(3), UGDH(5), UXS1(3) | 1268853 | 13 | 12 | 13 | 1 | 4 | 5 | 1 | 2 | 1 | 0 | 0.049 | 0.64 | 1 | |
| 5 | FOSBPATHWAY | FOSB gene expression and drug abuse | CDK5, FOSB, GRIA2, JUND, PPP1R1B | 5 | CDK5(2), FOSB(3), GRIA2(17), JUND(1), PPP1R1B(1) | 1225092 | 24 | 20 | 24 | 5 | 6 | 9 | 1 | 6 | 2 | 0 | 0.13 | 0.66 | 1 |
| 6 | HSA00031_INOSITOL_METABOLISM | Genes involved in inositol metabolism | ALDH6A1, TPI1 | 2 | ALDH6A1(4), TPI1(1) | 539342 | 5 | 5 | 5 | 1 | 2 | 2 | 1 | 0 | 0 | 0 | 0.36 | 0.73 | 1 |
| 7 | PEPIPATHWAY | Proepithelin (PEPI) induces epithelial cells to secrete IL-8, which promotes elastase secretion by neutrophils. | ELA1, ELA2, ELA2A, ELA2B, ELA3B, GRN, IL8, SLPI | 3 | GRN(4), IL8(1), SLPI(1) | 563163 | 6 | 5 | 6 | 2 | 3 | 2 | 0 | 1 | 0 | 0 | 0.5 | 0.77 | 1 |
| 8 | HSA00643_STYRENE_DEGRADATION | Genes involved in styrene degradation | FAH, GSTZ1, HGD | 3 | FAH(3), GSTZ1(3), HGD(3) | 730546 | 9 | 8 | 9 | 3 | 4 | 2 | 0 | 3 | 0 | 0 | 0.49 | 0.77 | 1 |
| 9 | IL18PATHWAY | Pro-inflammatory IL-18 is activated in macrophages by caspase-1 cleavage and, in conjunction with IL-12, stimulates Th1 cell differentiation. | CASP1, IFNG, IL12A, IL12B, IL18, IL2 | 6 | CASP1(2), IFNG(2), IL12A(2), IL12B(1), IL18(1) | 980615 | 8 | 8 | 8 | 2 | 0 | 3 | 1 | 4 | 0 | 0 | 0.56 | 0.78 | 1 |
| 10 | TCRMOLECULE | T Cell Receptor and CD3 Complex | CD3D, CD3E, CD3G, CD3Z, TRA@, TRB@ | 3 | CD3E(2) | 375013 | 2 | 2 | 2 | 1 | 0 | 1 | 1 | 0 | 0 | 0 | 0.82 | 0.79 | 1 |
In brief, we tabulate the number of mutations and the number of covered bases for each gene. The counts are broken down by mutation context category: four context categories that are discovered by MutSig, and one for indel and 'null' mutations, which include indels, nonsense mutations, splice-site mutations, and non-stop (read-through) mutations. For each gene, we calculate the probability of seeing the observed constellation of mutations, i.e. the product P1 x P2 x ... x Pm, or a more extreme one, given the background mutation rates calculated across the dataset. [1]
This is an experimental feature. The full results of the analysis summarized in this report can be downloaded from the TCGA Data Coordination Center.