This pipeline computes the correlation between significant arm-level copy number variations (cnvs) and selected clinical features.
Testing the association between copy number variation 54 arm-level events and 7 clinical features across 19 patients, 3 significant findings detected with Q value < 0.25.
-
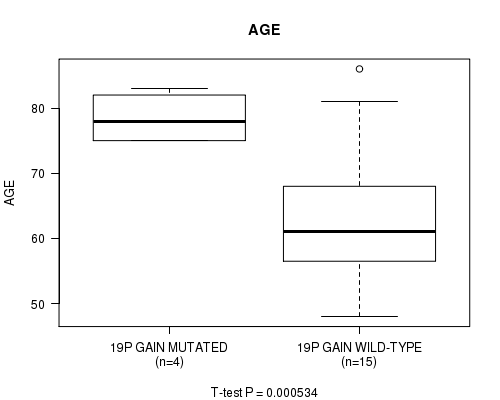
19P GAIN MUTATION ANALYSIS cnv correlated to 'AGE'.
-
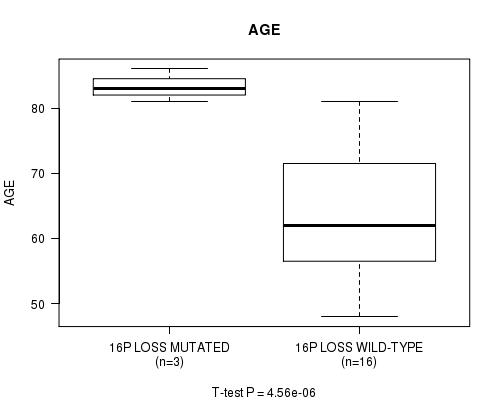
16P LOSS MUTATION ANALYSIS cnv correlated to 'AGE'.
-
16Q LOSS MUTATION ANALYSIS cnv correlated to 'AGE'.
Table 1. Get Full Table Overview of the association between significant copy number variation of 54 arm-level events and 7 clinical features. Shown in the table are P values (Q values). Thresholded by Q value < 0.25, 3 significant findings detected.
|
Clinical Features |
Time to Death |
AGE |
NEOPLASM DISEASESTAGE |
PATHOLOGY T STAGE |
PATHOLOGY N STAGE |
GENDER | NUMBERPACKYEARSSMOKED | ||
| nCNV (%) | nWild-Type | logrank test | t-test | Chi-square test | Fisher's exact test | Fisher's exact test | Fisher's exact test | t-test | |
| 19P GAIN MUTATION ANALYSIS | 4 (21%) | 15 |
0.0443 (1.00) |
0.000534 (0.193) |
0.132 (1.00) |
1 (1.00) |
1 (1.00) |
1 (1.00) |
0.684 (1.00) |
| 16P LOSS MUTATION ANALYSIS | 3 (16%) | 16 |
0.719 (1.00) |
4.56e-06 (0.00166) |
0.412 (1.00) |
1 (1.00) |
1 (1.00) |
0.422 (1.00) |
|
| 16Q LOSS MUTATION ANALYSIS | 3 (16%) | 16 |
0.719 (1.00) |
4.56e-06 (0.00166) |
0.412 (1.00) |
1 (1.00) |
1 (1.00) |
0.422 (1.00) |
|
| 1P GAIN MUTATION ANALYSIS | 6 (32%) | 13 |
0.855 (1.00) |
0.00631 (1.00) |
0.34 (1.00) |
0.321 (1.00) |
1 (1.00) |
1 (1.00) |
0.426 (1.00) |
| 1Q GAIN MUTATION ANALYSIS | 8 (42%) | 11 |
0.998 (1.00) |
0.028 (1.00) |
0.383 (1.00) |
0.292 (1.00) |
1 (1.00) |
1 (1.00) |
0.934 (1.00) |
| 2P GAIN MUTATION ANALYSIS | 7 (37%) | 12 |
0.8 (1.00) |
0.436 (1.00) |
0.119 (1.00) |
0.0223 (1.00) |
1 (1.00) |
1 (1.00) |
0.128 (1.00) |
| 2Q GAIN MUTATION ANALYSIS | 3 (16%) | 16 |
0.492 (1.00) |
0.797 (1.00) |
0.183 (1.00) |
0.393 (1.00) |
1 (1.00) |
1 (1.00) |
|
| 3P GAIN MUTATION ANALYSIS | 4 (21%) | 15 |
0.266 (1.00) |
0.43 (1.00) |
0.0801 (1.00) |
0.0753 (1.00) |
0.117 (1.00) |
0.53 (1.00) |
0.691 (1.00) |
| 3Q GAIN MUTATION ANALYSIS | 11 (58%) | 8 |
0.192 (1.00) |
0.201 (1.00) |
0.688 (1.00) |
1 (1.00) |
0.633 (1.00) |
1 (1.00) |
0.896 (1.00) |
| 5P GAIN MUTATION ANALYSIS | 7 (37%) | 12 |
0.954 (1.00) |
0.801 (1.00) |
0.238 (1.00) |
0.844 (1.00) |
1 (1.00) |
0.523 (1.00) |
0.592 (1.00) |
| 6P GAIN MUTATION ANALYSIS | 4 (21%) | 15 |
0.589 (1.00) |
0.961 (1.00) |
0.495 (1.00) |
0.798 (1.00) |
1 (1.00) |
0.00413 (1.00) |
|
| 7P GAIN MUTATION ANALYSIS | 13 (68%) | 6 |
0.836 (1.00) |
0.141 (1.00) |
0.747 (1.00) |
1 (1.00) |
0.129 (1.00) |
1 (1.00) |
0.205 (1.00) |
| 7Q GAIN MUTATION ANALYSIS | 10 (53%) | 9 |
0.366 (1.00) |
0.881 (1.00) |
0.19 (1.00) |
0.607 (1.00) |
1 (1.00) |
1 (1.00) |
0.316 (1.00) |
| 8P GAIN MUTATION ANALYSIS | 6 (32%) | 13 |
0.237 (1.00) |
0.308 (1.00) |
0.18 (1.00) |
0.0986 (1.00) |
0.617 (1.00) |
0.222 (1.00) |
0.68 (1.00) |
| 8Q GAIN MUTATION ANALYSIS | 11 (58%) | 8 |
0.195 (1.00) |
0.236 (1.00) |
0.688 (1.00) |
0.844 (1.00) |
1 (1.00) |
1 (1.00) |
0.257 (1.00) |
| 9Q GAIN MUTATION ANALYSIS | 3 (16%) | 16 |
0.214 (1.00) |
0.496 (1.00) |
0.0157 (1.00) |
0.769 (1.00) |
0.523 (1.00) |
1 (1.00) |
0.176 (1.00) |
| 11P GAIN MUTATION ANALYSIS | 5 (26%) | 14 |
0.535 (1.00) |
0.365 (1.00) |
0.833 (1.00) |
0.663 (1.00) |
1 (1.00) |
1 (1.00) |
0.146 (1.00) |
| 11Q GAIN MUTATION ANALYSIS | 3 (16%) | 16 |
0.378 (1.00) |
0.277 (1.00) |
0.676 (1.00) |
1 (1.00) |
0.263 (1.00) |
1 (1.00) |
|
| 12P GAIN MUTATION ANALYSIS | 5 (26%) | 14 |
0.37 (1.00) |
0.623 (1.00) |
0.352 (1.00) |
0.798 (1.00) |
0.603 (1.00) |
1 (1.00) |
0.553 (1.00) |
| 12Q GAIN MUTATION ANALYSIS | 6 (32%) | 13 |
0.37 (1.00) |
0.405 (1.00) |
0.571 (1.00) |
1 (1.00) |
1 (1.00) |
1 (1.00) |
0.316 (1.00) |
| 14Q GAIN MUTATION ANALYSIS | 5 (26%) | 14 |
0.0515 (1.00) |
0.512 (1.00) |
0.638 (1.00) |
1 (1.00) |
0.0379 (1.00) |
0.53 (1.00) |
0.68 (1.00) |
| 16P GAIN MUTATION ANALYSIS | 4 (21%) | 15 |
0.214 (1.00) |
0.308 (1.00) |
0.0628 (1.00) |
0.473 (1.00) |
0.117 (1.00) |
1 (1.00) |
0.631 (1.00) |
| 16Q GAIN MUTATION ANALYSIS | 4 (21%) | 15 |
0.214 (1.00) |
0.308 (1.00) |
0.0628 (1.00) |
0.473 (1.00) |
0.117 (1.00) |
1 (1.00) |
0.631 (1.00) |
| 17Q GAIN MUTATION ANALYSIS | 5 (26%) | 14 |
0.378 (1.00) |
0.371 (1.00) |
0.454 (1.00) |
0.663 (1.00) |
0.603 (1.00) |
0.53 (1.00) |
0.684 (1.00) |
| 18P GAIN MUTATION ANALYSIS | 5 (26%) | 14 |
0.0427 (1.00) |
0.971 (1.00) |
0.17 (1.00) |
0.0151 (1.00) |
1 (1.00) |
0.155 (1.00) |
0.752 (1.00) |
| 19Q GAIN MUTATION ANALYSIS | 6 (32%) | 13 |
0.101 (1.00) |
0.0127 (1.00) |
0.0996 (1.00) |
0.552 (1.00) |
0.333 (1.00) |
0.517 (1.00) |
0.684 (1.00) |
| 20P GAIN MUTATION ANALYSIS | 15 (79%) | 4 |
0.266 (1.00) |
0.512 (1.00) |
0.718 (1.00) |
0.372 (1.00) |
0.603 (1.00) |
1 (1.00) |
|
| 20Q GAIN MUTATION ANALYSIS | 16 (84%) | 3 |
0.00626 (1.00) |
0.863 (1.00) |
0.567 (1.00) |
0.523 (1.00) |
1 (1.00) |
0.572 (1.00) |
|
| 22Q GAIN MUTATION ANALYSIS | 5 (26%) | 14 |
0.646 (1.00) |
0.046 (1.00) |
0.166 (1.00) |
0.798 (1.00) |
0.00181 (0.65) |
1 (1.00) |
0.195 (1.00) |
| XQ GAIN MUTATION ANALYSIS | 6 (32%) | 13 |
0.142 (1.00) |
0.769 (1.00) |
0.132 (1.00) |
0.465 (1.00) |
1 (1.00) |
0.517 (1.00) |
0.777 (1.00) |
| 3P LOSS MUTATION ANALYSIS | 9 (47%) | 10 |
0.395 (1.00) |
0.229 (1.00) |
0.489 (1.00) |
0.0611 (1.00) |
1 (1.00) |
1 (1.00) |
0.662 (1.00) |
| 4P LOSS MUTATION ANALYSIS | 10 (53%) | 9 |
0.147 (1.00) |
0.748 (1.00) |
0.634 (1.00) |
0.247 (1.00) |
1 (1.00) |
0.582 (1.00) |
0.631 (1.00) |
| 4Q LOSS MUTATION ANALYSIS | 7 (37%) | 12 |
0.147 (1.00) |
0.161 (1.00) |
0.187 (1.00) |
0.704 (1.00) |
0.656 (1.00) |
1 (1.00) |
0.649 (1.00) |
| 5P LOSS MUTATION ANALYSIS | 5 (26%) | 14 |
0.17 (1.00) |
0.159 (1.00) |
0.0708 (1.00) |
1 (1.00) |
0.106 (1.00) |
1 (1.00) |
|
| 5Q LOSS MUTATION ANALYSIS | 10 (53%) | 9 |
0.904 (1.00) |
0.868 (1.00) |
0.266 (1.00) |
0.714 (1.00) |
0.65 (1.00) |
0.211 (1.00) |
0.313 (1.00) |
| 8P LOSS MUTATION ANALYSIS | 8 (42%) | 11 |
0.813 (1.00) |
0.716 (1.00) |
0.278 (1.00) |
0.05 (1.00) |
0.633 (1.00) |
0.228 (1.00) |
0.948 (1.00) |
| 9P LOSS MUTATION ANALYSIS | 10 (53%) | 9 |
0.405 (1.00) |
0.144 (1.00) |
0.612 (1.00) |
0.714 (1.00) |
0.65 (1.00) |
0.211 (1.00) |
0.306 (1.00) |
| 9Q LOSS MUTATION ANALYSIS | 9 (47%) | 10 |
0.481 (1.00) |
0.135 (1.00) |
0.921 (1.00) |
1 (1.00) |
0.65 (1.00) |
0.0867 (1.00) |
0.0729 (1.00) |
| 10P LOSS MUTATION ANALYSIS | 5 (26%) | 14 |
0.763 (1.00) |
0.657 (1.00) |
0.454 (1.00) |
0.663 (1.00) |
1 (1.00) |
1 (1.00) |
0.89 (1.00) |
| 10Q LOSS MUTATION ANALYSIS | 6 (32%) | 13 |
0.763 (1.00) |
0.879 (1.00) |
0.415 (1.00) |
0.0583 (1.00) |
1 (1.00) |
1 (1.00) |
0.676 (1.00) |
| 11P LOSS MUTATION ANALYSIS | 5 (26%) | 14 |
0.266 (1.00) |
0.47 (1.00) |
0.166 (1.00) |
0.122 (1.00) |
0.305 (1.00) |
0.53 (1.00) |
|
| 11Q LOSS MUTATION ANALYSIS | 7 (37%) | 12 |
0.592 (1.00) |
0.885 (1.00) |
0.0754 (1.00) |
0.844 (1.00) |
0.326 (1.00) |
1 (1.00) |
0.357 (1.00) |
| 12P LOSS MUTATION ANALYSIS | 4 (21%) | 15 |
0.588 (1.00) |
0.355 (1.00) |
0.718 (1.00) |
0.285 (1.00) |
0.245 (1.00) |
0.097 (1.00) |
|
| 12Q LOSS MUTATION ANALYSIS | 3 (16%) | 16 |
0.709 (1.00) |
0.601 (1.00) |
0.48 (1.00) |
0.567 (1.00) |
0.263 (1.00) |
0.0506 (1.00) |
|
| 13Q LOSS MUTATION ANALYSIS | 10 (53%) | 9 |
0.475 (1.00) |
0.592 (1.00) |
0.253 (1.00) |
0.0399 (1.00) |
0.0573 (1.00) |
0.582 (1.00) |
0.0195 (1.00) |
| 14Q LOSS MUTATION ANALYSIS | 4 (21%) | 15 |
0.481 (1.00) |
0.524 (1.00) |
0.641 (1.00) |
1 (1.00) |
1 (1.00) |
0.53 (1.00) |
0.165 (1.00) |
| 15Q LOSS MUTATION ANALYSIS | 5 (26%) | 14 |
0.17 (1.00) |
0.919 (1.00) |
0.128 (1.00) |
0.798 (1.00) |
1 (1.00) |
1 (1.00) |
0.592 (1.00) |
| 17P LOSS MUTATION ANALYSIS | 7 (37%) | 12 |
0.681 (1.00) |
0.66 (1.00) |
0.0402 (1.00) |
1 (1.00) |
0.0174 (1.00) |
1 (1.00) |
0.504 (1.00) |
| 18P LOSS MUTATION ANALYSIS | 4 (21%) | 15 |
0.541 (1.00) |
0.439 (1.00) |
0.213 (1.00) |
1 (1.00) |
1 (1.00) |
||
| 18Q LOSS MUTATION ANALYSIS | 8 (42%) | 11 |
0.28 (1.00) |
0.163 (1.00) |
0.278 (1.00) |
0.05 (1.00) |
0.633 (1.00) |
0.228 (1.00) |
0.922 (1.00) |
| 19P LOSS MUTATION ANALYSIS | 8 (42%) | 11 |
0.359 (1.00) |
0.504 (1.00) |
0.842 (1.00) |
1 (1.00) |
0.633 (1.00) |
0.546 (1.00) |
|
| 19Q LOSS MUTATION ANALYSIS | 5 (26%) | 14 |
0.446 (1.00) |
0.574 (1.00) |
0.883 (1.00) |
1 (1.00) |
1 (1.00) |
0.155 (1.00) |
|
| 21Q LOSS MUTATION ANALYSIS | 11 (58%) | 8 |
0.582 (1.00) |
0.533 (1.00) |
0.4 (1.00) |
1 (1.00) |
0.633 (1.00) |
0.228 (1.00) |
0.0686 (1.00) |
| 22Q LOSS MUTATION ANALYSIS | 8 (42%) | 11 |
0.102 (1.00) |
0.511 (1.00) |
0.291 (1.00) |
0.844 (1.00) |
0.147 (1.00) |
0.546 (1.00) |
0.726 (1.00) |
P value = 0.000534 (t-test), Q value = 0.19
Table S1. Gene #23: '19P GAIN MUTATION STATUS' versus Clinical Feature #2: 'AGE'
| nPatients | Mean (Std.Dev) | |
|---|---|---|
| ALL | 19 | 66.4 (11.4) |
| 19P GAIN MUTATED | 4 | 78.5 (4.1) |
| 19P GAIN WILD-TYPE | 15 | 63.2 (10.5) |
Figure S1. Get High-res Image Gene #23: '19P GAIN MUTATION STATUS' versus Clinical Feature #2: 'AGE'
P value = 4.56e-06 (t-test), Q value = 0.0017
Table S2. Gene #46: '16P LOSS MUTATION STATUS' versus Clinical Feature #2: 'AGE'
| nPatients | Mean (Std.Dev) | |
|---|---|---|
| ALL | 19 | 66.4 (11.4) |
| 16P LOSS MUTATED | 3 | 83.3 (2.5) |
| 16P LOSS WILD-TYPE | 16 | 63.2 (9.3) |
Figure S2. Get High-res Image Gene #46: '16P LOSS MUTATION STATUS' versus Clinical Feature #2: 'AGE'
P value = 4.56e-06 (t-test), Q value = 0.0017
Table S3. Gene #47: '16Q LOSS MUTATION STATUS' versus Clinical Feature #2: 'AGE'
| nPatients | Mean (Std.Dev) | |
|---|---|---|
| ALL | 19 | 66.4 (11.4) |
| 16Q LOSS MUTATED | 3 | 83.3 (2.5) |
| 16Q LOSS WILD-TYPE | 16 | 63.2 (9.3) |
Figure S3. Get High-res Image Gene #47: '16Q LOSS MUTATION STATUS' versus Clinical Feature #2: 'AGE'

-
Copy number data file = transformed.cor.cli.txt
-
Clinical data file = ESCA-TP.clin.merged.picked.txt
-
Number of patients = 19
-
Number of significantly arm-level cnvs = 54
-
Number of selected clinical features = 7
-
Exclude regions that fewer than K tumors have mutations, K = 3
For survival clinical features, the Kaplan-Meier survival curves of tumors with and without gene mutations were plotted and the statistical significance P values were estimated by logrank test (Bland and Altman 2004) using the 'survdiff' function in R
For continuous numerical clinical features, two-tailed Student's t test with unequal variance (Lehmann and Romano 2005) was applied to compare the clinical values between tumors with and without gene mutations using 't.test' function in R
For multi-class clinical features (nominal or ordinal), Chi-square tests (Greenwood and Nikulin 1996) were used to estimate the P values using the 'chisq.test' function in R
For binary or multi-class clinical features (nominal or ordinal), two-tailed Fisher's exact tests (Fisher 1922) were used to estimate the P values using the 'fisher.test' function in R
For multiple hypothesis correction, Q value is the False Discovery Rate (FDR) analogue of the P value (Benjamini and Hochberg 1995), defined as the minimum FDR at which the test may be called significant. We used the 'Benjamini and Hochberg' method of 'p.adjust' function in R to convert P values into Q values.
In addition to the links below, the full results of the analysis summarized in this report can also be downloaded programmatically using firehose_get, or interactively from either the Broad GDAC website or TCGA Data Coordination Center Portal.