This pipeline computes the correlation between significant copy number variation (cnv focal) genes and molecular subtypes.
Testing the association between copy number variation 40 focal events and 6 molecular subtypes across 73 patients, 7 significant findings detected with P value < 0.05 and Q value < 0.25.
-
3p cnv correlated to 'MIRSEQ_CHIERARCHICAL' and 'MIRSEQ_MATURE_CHIERARCHICAL'.
-
3q cnv correlated to 'CN_CNMF', 'METHLYATION_CNMF', 'MIRSEQ_CNMF', 'MIRSEQ_CHIERARCHICAL', and 'MIRSEQ_MATURE_CHIERARCHICAL'.
Table 1. Get Full Table Overview of the association between significant copy number variation of 40 focal events and 6 molecular subtypes. Shown in the table are P values (Q values). Thresholded by P value < 0.05 and Q value < 0.25, 7 significant findings detected.
|
Clinical Features |
CN CNMF |
METHLYATION CNMF |
MIRSEQ CNMF |
MIRSEQ CHIERARCHICAL |
MIRSEQ MATURE CNMF |
MIRSEQ MATURE CHIERARCHICAL |
||
| nCNV (%) | nWild-Type | Fisher's exact test | Fisher's exact test | Fisher's exact test | Fisher's exact test | Fisher's exact test | Fisher's exact test | |
| 3q | 46 (63%) | 27 |
1.48e-06 (0.000354) |
8.06e-05 (0.0191) |
0.000616 (0.144) |
7.73e-05 (0.0185) |
0.0041 (0.948) |
7.73e-05 (0.0185) |
| 3p | 54 (74%) | 19 |
0.0297 (1.00) |
0.0134 (1.00) |
0.00183 (0.425) |
0.000202 (0.0477) |
0.0211 (1.00) |
0.000202 (0.0477) |
| 1p | 23 (32%) | 50 |
0.745 (1.00) |
0.927 (1.00) |
1 (1.00) |
1 (1.00) |
0.142 (1.00) |
1 (1.00) |
| 1q | 36 (49%) | 37 |
0.0298 (1.00) |
0.534 (1.00) |
0.272 (1.00) |
0.183 (1.00) |
0.061 (1.00) |
0.183 (1.00) |
| 2p | 32 (44%) | 41 |
0.206 (1.00) |
0.59 (1.00) |
0.181 (1.00) |
0.536 (1.00) |
0.0307 (1.00) |
0.536 (1.00) |
| 2q | 27 (37%) | 46 |
0.529 (1.00) |
0.605 (1.00) |
0.662 (1.00) |
0.634 (1.00) |
0.219 (1.00) |
0.634 (1.00) |
| 4p | 48 (66%) | 25 |
0.108 (1.00) |
0.615 (1.00) |
0.405 (1.00) |
0.0809 (1.00) |
0.658 (1.00) |
0.0809 (1.00) |
| 4q | 40 (55%) | 33 |
0.0166 (1.00) |
0.518 (1.00) |
0.722 (1.00) |
0.321 (1.00) |
0.915 (1.00) |
0.321 (1.00) |
| 5p | 51 (70%) | 22 |
0.872 (1.00) |
0.339 (1.00) |
0.0705 (1.00) |
0.258 (1.00) |
0.292 (1.00) |
0.258 (1.00) |
| 5q | 42 (58%) | 31 |
0.936 (1.00) |
0.253 (1.00) |
0.295 (1.00) |
0.184 (1.00) |
0.275 (1.00) |
0.184 (1.00) |
| 6p | 27 (37%) | 46 |
0.0918 (1.00) |
0.481 (1.00) |
0.717 (1.00) |
0.634 (1.00) |
0.377 (1.00) |
0.634 (1.00) |
| 6q | 24 (33%) | 49 |
0.0442 (1.00) |
0.373 (1.00) |
0.452 (1.00) |
0.362 (1.00) |
0.779 (1.00) |
0.362 (1.00) |
| 7p | 53 (73%) | 20 |
0.616 (1.00) |
0.467 (1.00) |
0.434 (1.00) |
0.187 (1.00) |
0.546 (1.00) |
0.187 (1.00) |
| 7q | 44 (60%) | 29 |
1 (1.00) |
1 (1.00) |
0.558 (1.00) |
0.244 (1.00) |
0.181 (1.00) |
0.244 (1.00) |
| 8p | 56 (77%) | 17 |
0.491 (1.00) |
0.152 (1.00) |
0.612 (1.00) |
0.128 (1.00) |
0.536 (1.00) |
0.128 (1.00) |
| 8q | 51 (70%) | 22 |
0.71 (1.00) |
0.267 (1.00) |
0.757 (1.00) |
0.329 (1.00) |
0.888 (1.00) |
0.329 (1.00) |
| 9p | 49 (67%) | 24 |
0.581 (1.00) |
0.373 (1.00) |
0.559 (1.00) |
0.186 (1.00) |
0.589 (1.00) |
0.186 (1.00) |
| 9q | 40 (55%) | 33 |
0.642 (1.00) |
0.114 (1.00) |
0.319 (1.00) |
0.0913 (1.00) |
0.251 (1.00) |
0.0913 (1.00) |
| 10p | 36 (49%) | 37 |
0.868 (1.00) |
0.234 (1.00) |
0.0916 (1.00) |
0.553 (1.00) |
0.319 (1.00) |
0.553 (1.00) |
| 10q | 35 (48%) | 38 |
0.112 (1.00) |
0.00141 (0.328) |
0.0292 (1.00) |
0.00932 (1.00) |
0.0494 (1.00) |
0.00932 (1.00) |
| 11p | 37 (51%) | 36 |
0.348 (1.00) |
0.431 (1.00) |
0.55 (1.00) |
0.553 (1.00) |
0.573 (1.00) |
0.553 (1.00) |
| 11q | 40 (55%) | 33 |
0.072 (1.00) |
0.801 (1.00) |
0.932 (1.00) |
0.747 (1.00) |
0.402 (1.00) |
0.747 (1.00) |
| 12p | 46 (63%) | 27 |
0.468 (1.00) |
0.529 (1.00) |
0.154 (1.00) |
0.428 (1.00) |
0.641 (1.00) |
0.428 (1.00) |
| 12q | 33 (45%) | 40 |
0.382 (1.00) |
0.921 (1.00) |
0.429 (1.00) |
0.719 (1.00) |
0.667 (1.00) |
0.719 (1.00) |
| 13q | 46 (63%) | 27 |
0.603 (1.00) |
0.511 (1.00) |
0.752 (1.00) |
0.397 (1.00) |
0.781 (1.00) |
0.397 (1.00) |
| 14q | 40 (55%) | 33 |
0.82 (1.00) |
0.619 (1.00) |
0.5 (1.00) |
0.615 (1.00) |
0.884 (1.00) |
0.615 (1.00) |
| 15q | 32 (44%) | 41 |
0.77 (1.00) |
0.0619 (1.00) |
0.0929 (1.00) |
0.116 (1.00) |
0.366 (1.00) |
0.116 (1.00) |
| 16p | 34 (47%) | 39 |
0.612 (1.00) |
1 (1.00) |
0.932 (1.00) |
1 (1.00) |
0.716 (1.00) |
1 (1.00) |
| 16q | 32 (44%) | 41 |
0.59 (1.00) |
0.848 (1.00) |
0.187 (1.00) |
0.819 (1.00) |
0.424 (1.00) |
0.819 (1.00) |
| 17p | 41 (56%) | 32 |
0.209 (1.00) |
0.0591 (1.00) |
0.0642 (1.00) |
0.0347 (1.00) |
0.0718 (1.00) |
0.0347 (1.00) |
| 17q | 29 (40%) | 44 |
0.691 (1.00) |
0.735 (1.00) |
0.283 (1.00) |
1 (1.00) |
0.325 (1.00) |
1 (1.00) |
| 18p | 49 (67%) | 24 |
0.0188 (1.00) |
0.462 (1.00) |
0.476 (1.00) |
0.492 (1.00) |
0.587 (1.00) |
0.492 (1.00) |
| 18q | 49 (67%) | 24 |
0.557 (1.00) |
0.104 (1.00) |
0.0929 (1.00) |
0.0973 (1.00) |
0.0457 (1.00) |
0.0973 (1.00) |
| 19p | 37 (51%) | 36 |
0.131 (1.00) |
0.0708 (1.00) |
0.018 (1.00) |
0.553 (1.00) |
0.014 (1.00) |
0.553 (1.00) |
| 19q | 36 (49%) | 37 |
0.573 (1.00) |
0.124 (1.00) |
0.0525 (1.00) |
0.681 (1.00) |
0.0368 (1.00) |
0.681 (1.00) |
| 20p | 48 (66%) | 25 |
0.668 (1.00) |
0.741 (1.00) |
0.11 (1.00) |
0.174 (1.00) |
0.779 (1.00) |
0.174 (1.00) |
| 20q | 45 (62%) | 28 |
0.138 (1.00) |
0.23 (1.00) |
0.0394 (1.00) |
0.0153 (1.00) |
0.18 (1.00) |
0.0153 (1.00) |
| 21q | 52 (71%) | 21 |
0.623 (1.00) |
0.0884 (1.00) |
0.228 (1.00) |
0.0665 (1.00) |
0.408 (1.00) |
0.0665 (1.00) |
| 22q | 43 (59%) | 30 |
0.355 (1.00) |
0.841 (1.00) |
0.418 (1.00) |
0.11 (1.00) |
0.662 (1.00) |
0.11 (1.00) |
| xq | 36 (49%) | 37 |
0.717 (1.00) |
0.415 (1.00) |
0.915 (1.00) |
1 (1.00) |
0.712 (1.00) |
1 (1.00) |
P value = 0.000202 (Fisher's exact test), Q value = 0.048
Table S1. Gene #5: '3p' versus Molecular Subtype #4: 'MIRSEQ_CHIERARCHICAL'
| nPatients | CLUS_1 | CLUS_2 | CLUS_3 |
|---|---|---|---|
| ALL | 1 | 28 | 43 |
| 3P MUTATED | 0 | 15 | 39 |
| 3P WILD-TYPE | 1 | 13 | 4 |
Figure S1. Get High-res Image Gene #5: '3p' versus Molecular Subtype #4: 'MIRSEQ_CHIERARCHICAL'

P value = 0.000202 (Fisher's exact test), Q value = 0.048
Table S2. Gene #5: '3p' versus Molecular Subtype #6: 'MIRSEQ_MATURE_CHIERARCHICAL'
| nPatients | CLUS_1 | CLUS_2 | CLUS_3 |
|---|---|---|---|
| ALL | 1 | 28 | 43 |
| 3P MUTATED | 0 | 15 | 39 |
| 3P WILD-TYPE | 1 | 13 | 4 |
Figure S2. Get High-res Image Gene #5: '3p' versus Molecular Subtype #6: 'MIRSEQ_MATURE_CHIERARCHICAL'

P value = 1.48e-06 (Fisher's exact test), Q value = 0.00035
Table S3. Gene #6: '3q' versus Molecular Subtype #1: 'CN_CNMF'
| nPatients | CLUS_1 | CLUS_2 | CLUS_3 |
|---|---|---|---|
| ALL | 15 | 34 | 24 |
| 3Q MUTATED | 13 | 11 | 22 |
| 3Q WILD-TYPE | 2 | 23 | 2 |
Figure S3. Get High-res Image Gene #6: '3q' versus Molecular Subtype #1: 'CN_CNMF'

P value = 8.06e-05 (Fisher's exact test), Q value = 0.019
Table S4. Gene #6: '3q' versus Molecular Subtype #2: 'METHLYATION_CNMF'
| nPatients | CLUS_1 | CLUS_2 | CLUS_3 |
|---|---|---|---|
| ALL | 34 | 15 | 24 |
| 3Q MUTATED | 30 | 7 | 9 |
| 3Q WILD-TYPE | 4 | 8 | 15 |
Figure S4. Get High-res Image Gene #6: '3q' versus Molecular Subtype #2: 'METHLYATION_CNMF'

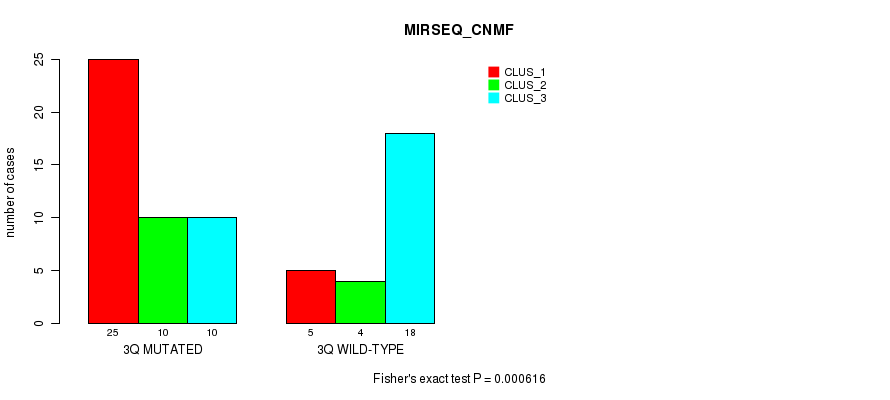
P value = 0.000616 (Fisher's exact test), Q value = 0.14
Table S5. Gene #6: '3q' versus Molecular Subtype #3: 'MIRSEQ_CNMF'
| nPatients | CLUS_1 | CLUS_2 | CLUS_3 |
|---|---|---|---|
| ALL | 30 | 14 | 28 |
| 3Q MUTATED | 25 | 10 | 10 |
| 3Q WILD-TYPE | 5 | 4 | 18 |
Figure S5. Get High-res Image Gene #6: '3q' versus Molecular Subtype #3: 'MIRSEQ_CNMF'
P value = 7.73e-05 (Fisher's exact test), Q value = 0.018
Table S6. Gene #6: '3q' versus Molecular Subtype #4: 'MIRSEQ_CHIERARCHICAL'
| nPatients | CLUS_1 | CLUS_2 | CLUS_3 |
|---|---|---|---|
| ALL | 1 | 28 | 43 |
| 3Q MUTATED | 0 | 10 | 35 |
| 3Q WILD-TYPE | 1 | 18 | 8 |
Figure S6. Get High-res Image Gene #6: '3q' versus Molecular Subtype #4: 'MIRSEQ_CHIERARCHICAL'

P value = 7.73e-05 (Fisher's exact test), Q value = 0.018
Table S7. Gene #6: '3q' versus Molecular Subtype #6: 'MIRSEQ_MATURE_CHIERARCHICAL'
| nPatients | CLUS_1 | CLUS_2 | CLUS_3 |
|---|---|---|---|
| ALL | 1 | 28 | 43 |
| 3Q MUTATED | 0 | 10 | 35 |
| 3Q WILD-TYPE | 1 | 18 | 8 |
Figure S7. Get High-res Image Gene #6: '3q' versus Molecular Subtype #6: 'MIRSEQ_MATURE_CHIERARCHICAL'

-
Copy number data file = transformed.cor.cli.txt
-
Molecular subtype file = ESCA-TP.transferedmergedcluster.txt
-
Number of patients = 73
-
Number of significantly focal cnvs = 40
-
Number of molecular subtypes = 6
-
Exclude genes that fewer than K tumors have alterations, K = 3
For binary or multi-class clinical features (nominal or ordinal), two-tailed Fisher's exact tests (Fisher 1922) were used to estimate the P values using the 'fisher.test' function in R
For multiple hypothesis correction, Q value is the False Discovery Rate (FDR) analogue of the P value (Benjamini and Hochberg 1995), defined as the minimum FDR at which the test may be called significant. We used the 'Benjamini and Hochberg' method of 'p.adjust' function in R to convert P values into Q values.
In addition to the links below, the full results of the analysis summarized in this report can also be downloaded programmatically using firehose_get, or interactively from either the Broad GDAC website or TCGA Data Coordination Center Portal.