This pipeline computes the correlation between significant copy number variation (cnv focal) genes and molecular subtypes.
Testing the association between copy number variation 40 focal events and 8 molecular subtypes across 165 patients, 23 significant findings detected with P value < 0.05 and Q value < 0.25.
-
1q cnv correlated to 'CN_CNMF'.
-
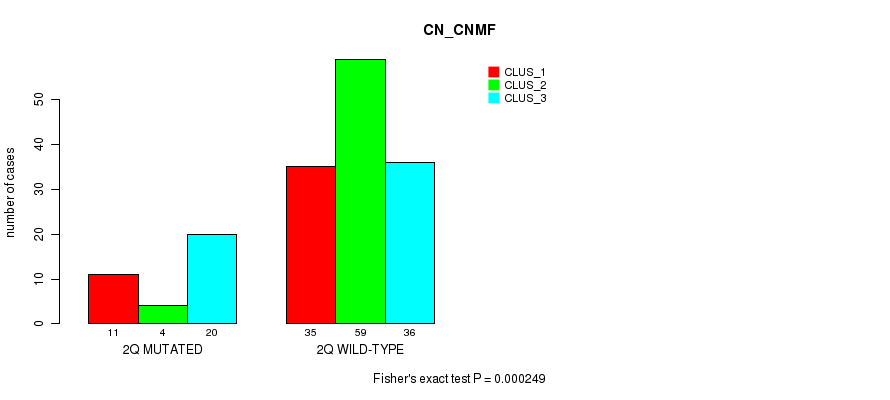
2q cnv correlated to 'CN_CNMF'.
-
3p cnv correlated to 'MRNASEQ_CNMF' and 'MRNASEQ_CHIERARCHICAL'.
-
4p cnv correlated to 'CN_CNMF'.
-
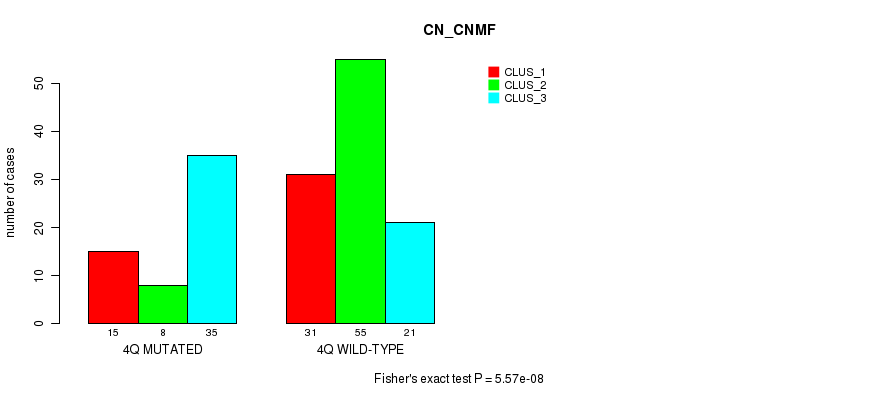
4q cnv correlated to 'CN_CNMF'.
-
6p cnv correlated to 'CN_CNMF'.
-
8p cnv correlated to 'CN_CNMF'.
-
8q cnv correlated to 'CN_CNMF'.
-
13q cnv correlated to 'CN_CNMF' and 'MRNASEQ_CNMF'.
-
14q cnv correlated to 'MRNASEQ_CNMF' and 'MRNASEQ_CHIERARCHICAL'.
-
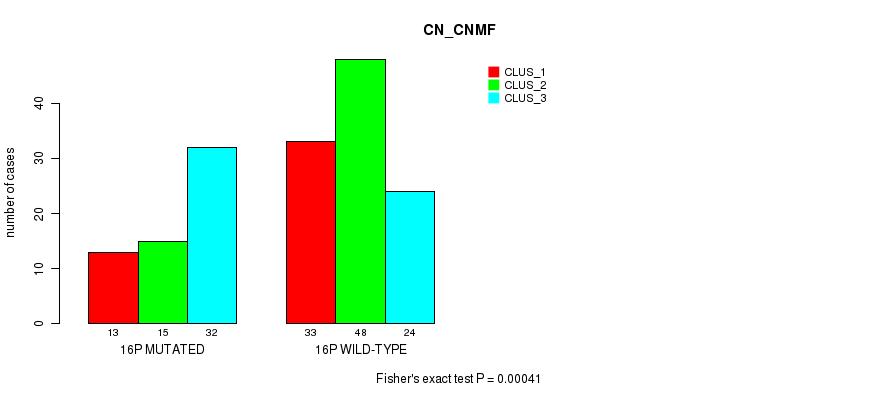
16p cnv correlated to 'CN_CNMF', 'MRNASEQ_CNMF', and 'MRNASEQ_CHIERARCHICAL'.
-
16q cnv correlated to 'MRNASEQ_CNMF' and 'MRNASEQ_CHIERARCHICAL'.
-
17p cnv correlated to 'CN_CNMF'.
-
18q cnv correlated to 'CN_CNMF'.
-
19p cnv correlated to 'METHLYATION_CNMF'.
-
20p cnv correlated to 'CN_CNMF' and 'MRNASEQ_CHIERARCHICAL'.
Table 1. Get Full Table Overview of the association between significant copy number variation of 40 focal events and 8 molecular subtypes. Shown in the table are P values (Q values). Thresholded by P value < 0.05 and Q value < 0.25, 23 significant findings detected.
|
Clinical Features |
CN CNMF |
METHLYATION CNMF |
MRNASEQ CNMF |
MRNASEQ CHIERARCHICAL |
MIRSEQ CNMF |
MIRSEQ CHIERARCHICAL |
MIRSEQ MATURE CNMF |
MIRSEQ MATURE CHIERARCHICAL |
||
| nCNV (%) | nWild-Type | Fisher's exact test | Fisher's exact test | Chi-square test | Fisher's exact test | Fisher's exact test | Fisher's exact test | Fisher's exact test | Fisher's exact test | |
| 16p | 60 (36%) | 105 |
0.00041 (0.125) |
0.126 (1.00) |
1.06e-07 (3.36e-05) |
0.000149 (0.0462) |
0.608 (1.00) |
0.0184 (1.00) |
0.0049 (1.00) |
0.00812 (1.00) |
| 3p | 35 (21%) | 130 |
0.0105 (1.00) |
0.0939 (1.00) |
0.000674 (0.202) |
0.00058 (0.174) |
0.914 (1.00) |
0.123 (1.00) |
0.126 (1.00) |
0.0362 (1.00) |
| 13q | 67 (41%) | 98 |
0.000236 (0.0725) |
0.0336 (1.00) |
1.41e-05 (0.00442) |
0.00215 (0.62) |
0.3 (1.00) |
0.0681 (1.00) |
0.0583 (1.00) |
0.0496 (1.00) |
| 14q | 57 (35%) | 108 |
0.0135 (1.00) |
0.225 (1.00) |
0.00018 (0.0555) |
0.000421 (0.128) |
0.246 (1.00) |
0.584 (1.00) |
0.287 (1.00) |
0.405 (1.00) |
| 16q | 66 (40%) | 99 |
0.00137 (0.399) |
0.0298 (1.00) |
1.01e-06 (0.000318) |
0.000222 (0.0683) |
0.121 (1.00) |
0.112 (1.00) |
0.293 (1.00) |
0.157 (1.00) |
| 20p | 57 (35%) | 108 |
0.000805 (0.241) |
0.00388 (1.00) |
0.00272 (0.772) |
0.000829 (0.247) |
0.929 (1.00) |
0.119 (1.00) |
0.188 (1.00) |
0.0976 (1.00) |
| 1q | 104 (63%) | 61 |
2.43e-07 (7.67e-05) |
0.000905 (0.269) |
0.00369 (1.00) |
0.0525 (1.00) |
0.0266 (1.00) |
0.851 (1.00) |
0.249 (1.00) |
0.436 (1.00) |
| 2q | 35 (21%) | 130 |
0.000249 (0.0761) |
0.791 (1.00) |
0.226 (1.00) |
0.607 (1.00) |
0.0211 (1.00) |
0.144 (1.00) |
0.565 (1.00) |
0.274 (1.00) |
| 4p | 49 (30%) | 116 |
4.4e-05 (0.0137) |
0.0961 (1.00) |
0.000955 (0.282) |
0.0648 (1.00) |
0.668 (1.00) |
0.945 (1.00) |
0.343 (1.00) |
0.69 (1.00) |
| 4q | 58 (35%) | 107 |
5.57e-08 (1.77e-05) |
0.0413 (1.00) |
0.00135 (0.394) |
0.395 (1.00) |
0.478 (1.00) |
1 (1.00) |
0.335 (1.00) |
0.815 (1.00) |
| 6p | 62 (38%) | 103 |
8.87e-05 (0.0276) |
0.0314 (1.00) |
0.0159 (1.00) |
0.116 (1.00) |
0.338 (1.00) |
0.901 (1.00) |
0.36 (1.00) |
0.934 (1.00) |
| 8p | 111 (67%) | 54 |
3.49e-08 (1.11e-05) |
0.0249 (1.00) |
0.00971 (1.00) |
0.0492 (1.00) |
0.0921 (1.00) |
0.102 (1.00) |
1 (1.00) |
0.157 (1.00) |
| 8q | 99 (60%) | 66 |
1.37e-13 (4.37e-11) |
0.498 (1.00) |
0.0369 (1.00) |
0.02 (1.00) |
0.0848 (1.00) |
0.554 (1.00) |
1 (1.00) |
0.712 (1.00) |
| 17p | 100 (61%) | 65 |
5.84e-06 (0.00183) |
0.859 (1.00) |
0.033 (1.00) |
0.0521 (1.00) |
0.0166 (1.00) |
0.00894 (1.00) |
0.403 (1.00) |
0.015 (1.00) |
| 18q | 45 (27%) | 120 |
0.000514 (0.156) |
0.00986 (1.00) |
0.00443 (1.00) |
0.0127 (1.00) |
0.94 (1.00) |
0.185 (1.00) |
0.319 (1.00) |
0.109 (1.00) |
| 19p | 54 (33%) | 111 |
0.000906 (0.269) |
0.000563 (0.17) |
0.0187 (1.00) |
0.0249 (1.00) |
0.79 (1.00) |
0.324 (1.00) |
0.134 (1.00) |
0.217 (1.00) |
| 1p | 63 (38%) | 102 |
0.00314 (0.888) |
0.0278 (1.00) |
0.0134 (1.00) |
0.0154 (1.00) |
0.15 (1.00) |
0.882 (1.00) |
0.325 (1.00) |
0.952 (1.00) |
| 2p | 38 (23%) | 127 |
0.00119 (0.349) |
0.968 (1.00) |
0.0674 (1.00) |
0.415 (1.00) |
0.0293 (1.00) |
0.295 (1.00) |
0.141 (1.00) |
0.519 (1.00) |
| 3q | 28 (17%) | 137 |
0.107 (1.00) |
0.31 (1.00) |
0.0524 (1.00) |
0.036 (1.00) |
0.832 (1.00) |
0.399 (1.00) |
0.497 (1.00) |
0.356 (1.00) |
| 5p | 73 (44%) | 92 |
0.00188 (0.543) |
0.0215 (1.00) |
0.395 (1.00) |
0.452 (1.00) |
0.799 (1.00) |
0.823 (1.00) |
0.559 (1.00) |
0.816 (1.00) |
| 5q | 62 (38%) | 103 |
0.00118 (0.347) |
0.0122 (1.00) |
0.369 (1.00) |
0.447 (1.00) |
0.915 (1.00) |
1 (1.00) |
0.656 (1.00) |
0.956 (1.00) |
| 6q | 75 (45%) | 90 |
0.0183 (1.00) |
0.223 (1.00) |
0.0209 (1.00) |
0.0333 (1.00) |
0.754 (1.00) |
0.602 (1.00) |
0.493 (1.00) |
0.778 (1.00) |
| 7p | 60 (36%) | 105 |
0.0297 (1.00) |
0.117 (1.00) |
0.046 (1.00) |
0.34 (1.00) |
0.114 (1.00) |
0.0758 (1.00) |
0.459 (1.00) |
0.447 (1.00) |
| 7q | 65 (39%) | 100 |
0.27 (1.00) |
0.0588 (1.00) |
0.0532 (1.00) |
0.313 (1.00) |
0.166 (1.00) |
0.127 (1.00) |
0.424 (1.00) |
0.673 (1.00) |
| 9p | 59 (36%) | 106 |
0.00641 (1.00) |
0.227 (1.00) |
0.0703 (1.00) |
0.0478 (1.00) |
0.344 (1.00) |
0.489 (1.00) |
0.884 (1.00) |
0.529 (1.00) |
| 9q | 59 (36%) | 106 |
0.0872 (1.00) |
0.471 (1.00) |
0.00609 (1.00) |
0.00228 (0.651) |
0.751 (1.00) |
0.661 (1.00) |
0.662 (1.00) |
0.303 (1.00) |
| 10p | 45 (27%) | 120 |
0.408 (1.00) |
0.259 (1.00) |
0.0861 (1.00) |
0.0412 (1.00) |
0.82 (1.00) |
0.701 (1.00) |
0.422 (1.00) |
0.594 (1.00) |
| 10q | 50 (30%) | 115 |
0.369 (1.00) |
0.354 (1.00) |
0.0105 (1.00) |
0.0412 (1.00) |
0.927 (1.00) |
0.499 (1.00) |
0.768 (1.00) |
0.42 (1.00) |
| 11p | 40 (24%) | 125 |
0.185 (1.00) |
0.484 (1.00) |
0.0509 (1.00) |
0.308 (1.00) |
0.544 (1.00) |
0.448 (1.00) |
0.226 (1.00) |
0.366 (1.00) |
| 11q | 44 (27%) | 121 |
0.478 (1.00) |
0.462 (1.00) |
0.114 (1.00) |
0.466 (1.00) |
0.626 (1.00) |
0.859 (1.00) |
0.791 (1.00) |
0.807 (1.00) |
| 12p | 50 (30%) | 115 |
0.0884 (1.00) |
0.519 (1.00) |
0.00322 (0.907) |
0.131 (1.00) |
0.211 (1.00) |
0.216 (1.00) |
0.754 (1.00) |
0.194 (1.00) |
| 12q | 40 (24%) | 125 |
0.11 (1.00) |
0.67 (1.00) |
0.018 (1.00) |
0.105 (1.00) |
0.876 (1.00) |
0.186 (1.00) |
0.878 (1.00) |
0.184 (1.00) |
| 15q | 46 (28%) | 119 |
0.00798 (1.00) |
0.348 (1.00) |
0.0586 (1.00) |
0.0283 (1.00) |
0.647 (1.00) |
0.857 (1.00) |
0.266 (1.00) |
0.834 (1.00) |
| 17q | 64 (39%) | 101 |
0.0033 (0.928) |
0.345 (1.00) |
0.123 (1.00) |
0.232 (1.00) |
1 (1.00) |
0.635 (1.00) |
0.168 (1.00) |
0.734 (1.00) |
| 18p | 43 (26%) | 122 |
0.00508 (1.00) |
0.0166 (1.00) |
0.0111 (1.00) |
0.0741 (1.00) |
0.965 (1.00) |
0.115 (1.00) |
0.388 (1.00) |
0.143 (1.00) |
| 19q | 52 (32%) | 113 |
0.00227 (0.65) |
0.00358 (0.999) |
0.0105 (1.00) |
0.00453 (1.00) |
0.671 (1.00) |
0.278 (1.00) |
0.109 (1.00) |
0.189 (1.00) |
| 20q | 55 (33%) | 110 |
0.00187 (0.542) |
0.0179 (1.00) |
0.00885 (1.00) |
0.00386 (1.00) |
0.91 (1.00) |
0.68 (1.00) |
0.221 (1.00) |
0.592 (1.00) |
| 21q | 60 (36%) | 105 |
0.00347 (0.972) |
0.227 (1.00) |
0.01 (1.00) |
0.186 (1.00) |
0.00694 (1.00) |
0.0928 (1.00) |
0.371 (1.00) |
0.0543 (1.00) |
| 22q | 59 (36%) | 106 |
0.0103 (1.00) |
0.0938 (1.00) |
0.00252 (0.717) |
0.00493 (1.00) |
0.957 (1.00) |
0.876 (1.00) |
0.385 (1.00) |
0.739 (1.00) |
| xq | 54 (33%) | 111 |
0.0105 (1.00) |
0.0289 (1.00) |
0.164 (1.00) |
0.0158 (1.00) |
0.23 (1.00) |
0.434 (1.00) |
0.126 (1.00) |
0.515 (1.00) |
P value = 2.43e-07 (Fisher's exact test), Q value = 7.7e-05
Table S1. Gene #2: '1q' versus Molecular Subtype #1: 'CN_CNMF'
| nPatients | CLUS_1 | CLUS_2 | CLUS_3 |
|---|---|---|---|
| ALL | 46 | 63 | 56 |
| 1Q MUTATED | 40 | 24 | 40 |
| 1Q WILD-TYPE | 6 | 39 | 16 |
Figure S1. Get High-res Image Gene #2: '1q' versus Molecular Subtype #1: 'CN_CNMF'

P value = 0.000249 (Fisher's exact test), Q value = 0.076
Table S2. Gene #4: '2q' versus Molecular Subtype #1: 'CN_CNMF'
| nPatients | CLUS_1 | CLUS_2 | CLUS_3 |
|---|---|---|---|
| ALL | 46 | 63 | 56 |
| 2Q MUTATED | 11 | 4 | 20 |
| 2Q WILD-TYPE | 35 | 59 | 36 |
Figure S2. Get High-res Image Gene #4: '2q' versus Molecular Subtype #1: 'CN_CNMF'
P value = 0.000674 (Chi-square test), Q value = 0.2
Table S3. Gene #5: '3p' versus Molecular Subtype #3: 'MRNASEQ_CNMF'
| nPatients | CLUS_1 | CLUS_2 | CLUS_3 | CLUS_4 | CLUS_5 | CLUS_6 | CLUS_7 | CLUS_8 | CLUS_9 |
|---|---|---|---|---|---|---|---|---|---|
| ALL | 17 | 14 | 14 | 29 | 21 | 6 | 17 | 16 | 9 |
| 3P MUTATED | 5 | 8 | 1 | 4 | 0 | 3 | 6 | 1 | 2 |
| 3P WILD-TYPE | 12 | 6 | 13 | 25 | 21 | 3 | 11 | 15 | 7 |
Figure S3. Get High-res Image Gene #5: '3p' versus Molecular Subtype #3: 'MRNASEQ_CNMF'

P value = 0.00058 (Fisher's exact test), Q value = 0.17
Table S4. Gene #5: '3p' versus Molecular Subtype #4: 'MRNASEQ_CHIERARCHICAL'
| nPatients | CLUS_1 | CLUS_2 | CLUS_3 | CLUS_4 |
|---|---|---|---|---|
| ALL | 22 | 27 | 37 | 57 |
| 3P MUTATED | 1 | 1 | 7 | 21 |
| 3P WILD-TYPE | 21 | 26 | 30 | 36 |
Figure S4. Get High-res Image Gene #5: '3p' versus Molecular Subtype #4: 'MRNASEQ_CHIERARCHICAL'

P value = 4.4e-05 (Fisher's exact test), Q value = 0.014
Table S5. Gene #7: '4p' versus Molecular Subtype #1: 'CN_CNMF'
| nPatients | CLUS_1 | CLUS_2 | CLUS_3 |
|---|---|---|---|
| ALL | 46 | 63 | 56 |
| 4P MUTATED | 13 | 8 | 28 |
| 4P WILD-TYPE | 33 | 55 | 28 |
Figure S5. Get High-res Image Gene #7: '4p' versus Molecular Subtype #1: 'CN_CNMF'

P value = 5.57e-08 (Fisher's exact test), Q value = 1.8e-05
Table S6. Gene #8: '4q' versus Molecular Subtype #1: 'CN_CNMF'
| nPatients | CLUS_1 | CLUS_2 | CLUS_3 |
|---|---|---|---|
| ALL | 46 | 63 | 56 |
| 4Q MUTATED | 15 | 8 | 35 |
| 4Q WILD-TYPE | 31 | 55 | 21 |
Figure S6. Get High-res Image Gene #8: '4q' versus Molecular Subtype #1: 'CN_CNMF'
P value = 8.87e-05 (Fisher's exact test), Q value = 0.028
Table S7. Gene #11: '6p' versus Molecular Subtype #1: 'CN_CNMF'
| nPatients | CLUS_1 | CLUS_2 | CLUS_3 |
|---|---|---|---|
| ALL | 46 | 63 | 56 |
| 6P MUTATED | 24 | 11 | 27 |
| 6P WILD-TYPE | 22 | 52 | 29 |
Figure S7. Get High-res Image Gene #11: '6p' versus Molecular Subtype #1: 'CN_CNMF'

P value = 3.49e-08 (Fisher's exact test), Q value = 1.1e-05
Table S8. Gene #15: '8p' versus Molecular Subtype #1: 'CN_CNMF'
| nPatients | CLUS_1 | CLUS_2 | CLUS_3 |
|---|---|---|---|
| ALL | 46 | 63 | 56 |
| 8P MUTATED | 43 | 27 | 41 |
| 8P WILD-TYPE | 3 | 36 | 15 |
Figure S8. Get High-res Image Gene #15: '8p' versus Molecular Subtype #1: 'CN_CNMF'

P value = 1.37e-13 (Fisher's exact test), Q value = 4.4e-11
Table S9. Gene #16: '8q' versus Molecular Subtype #1: 'CN_CNMF'
| nPatients | CLUS_1 | CLUS_2 | CLUS_3 |
|---|---|---|---|
| ALL | 46 | 63 | 56 |
| 8Q MUTATED | 45 | 19 | 35 |
| 8Q WILD-TYPE | 1 | 44 | 21 |
Figure S9. Get High-res Image Gene #16: '8q' versus Molecular Subtype #1: 'CN_CNMF'

P value = 0.000236 (Fisher's exact test), Q value = 0.072
Table S10. Gene #25: '13q' versus Molecular Subtype #1: 'CN_CNMF'
| nPatients | CLUS_1 | CLUS_2 | CLUS_3 |
|---|---|---|---|
| ALL | 46 | 63 | 56 |
| 13Q MUTATED | 14 | 18 | 35 |
| 13Q WILD-TYPE | 32 | 45 | 21 |
Figure S10. Get High-res Image Gene #25: '13q' versus Molecular Subtype #1: 'CN_CNMF'

P value = 1.41e-05 (Chi-square test), Q value = 0.0044
Table S11. Gene #25: '13q' versus Molecular Subtype #3: 'MRNASEQ_CNMF'
| nPatients | CLUS_1 | CLUS_2 | CLUS_3 | CLUS_4 | CLUS_5 | CLUS_6 | CLUS_7 | CLUS_8 | CLUS_9 |
|---|---|---|---|---|---|---|---|---|---|
| ALL | 17 | 14 | 14 | 29 | 21 | 6 | 17 | 16 | 9 |
| 13Q MUTATED | 7 | 11 | 1 | 10 | 2 | 6 | 11 | 7 | 4 |
| 13Q WILD-TYPE | 10 | 3 | 13 | 19 | 19 | 0 | 6 | 9 | 5 |
Figure S11. Get High-res Image Gene #25: '13q' versus Molecular Subtype #3: 'MRNASEQ_CNMF'

P value = 0.00018 (Chi-square test), Q value = 0.056
Table S12. Gene #26: '14q' versus Molecular Subtype #3: 'MRNASEQ_CNMF'
| nPatients | CLUS_1 | CLUS_2 | CLUS_3 | CLUS_4 | CLUS_5 | CLUS_6 | CLUS_7 | CLUS_8 | CLUS_9 |
|---|---|---|---|---|---|---|---|---|---|
| ALL | 17 | 14 | 14 | 29 | 21 | 6 | 17 | 16 | 9 |
| 14Q MUTATED | 9 | 9 | 1 | 9 | 2 | 5 | 7 | 6 | 7 |
| 14Q WILD-TYPE | 8 | 5 | 13 | 20 | 19 | 1 | 10 | 10 | 2 |
Figure S12. Get High-res Image Gene #26: '14q' versus Molecular Subtype #3: 'MRNASEQ_CNMF'

P value = 0.000421 (Fisher's exact test), Q value = 0.13
Table S13. Gene #26: '14q' versus Molecular Subtype #4: 'MRNASEQ_CHIERARCHICAL'
| nPatients | CLUS_1 | CLUS_2 | CLUS_3 | CLUS_4 |
|---|---|---|---|---|
| ALL | 22 | 27 | 37 | 57 |
| 14Q MUTATED | 3 | 6 | 13 | 33 |
| 14Q WILD-TYPE | 19 | 21 | 24 | 24 |
Figure S13. Get High-res Image Gene #26: '14q' versus Molecular Subtype #4: 'MRNASEQ_CHIERARCHICAL'

P value = 0.00041 (Fisher's exact test), Q value = 0.13
Table S14. Gene #28: '16p' versus Molecular Subtype #1: 'CN_CNMF'
| nPatients | CLUS_1 | CLUS_2 | CLUS_3 |
|---|---|---|---|
| ALL | 46 | 63 | 56 |
| 16P MUTATED | 13 | 15 | 32 |
| 16P WILD-TYPE | 33 | 48 | 24 |
Figure S14. Get High-res Image Gene #28: '16p' versus Molecular Subtype #1: 'CN_CNMF'
P value = 1.06e-07 (Chi-square test), Q value = 3.4e-05
Table S15. Gene #28: '16p' versus Molecular Subtype #3: 'MRNASEQ_CNMF'
| nPatients | CLUS_1 | CLUS_2 | CLUS_3 | CLUS_4 | CLUS_5 | CLUS_6 | CLUS_7 | CLUS_8 | CLUS_9 |
|---|---|---|---|---|---|---|---|---|---|
| ALL | 17 | 14 | 14 | 29 | 21 | 6 | 17 | 16 | 9 |
| 16P MUTATED | 7 | 8 | 1 | 7 | 2 | 4 | 17 | 5 | 3 |
| 16P WILD-TYPE | 10 | 6 | 13 | 22 | 19 | 2 | 0 | 11 | 6 |
Figure S15. Get High-res Image Gene #28: '16p' versus Molecular Subtype #3: 'MRNASEQ_CNMF'

P value = 0.000149 (Fisher's exact test), Q value = 0.046
Table S16. Gene #28: '16p' versus Molecular Subtype #4: 'MRNASEQ_CHIERARCHICAL'
| nPatients | CLUS_1 | CLUS_2 | CLUS_3 | CLUS_4 |
|---|---|---|---|---|
| ALL | 22 | 27 | 37 | 57 |
| 16P MUTATED | 3 | 7 | 10 | 34 |
| 16P WILD-TYPE | 19 | 20 | 27 | 23 |
Figure S16. Get High-res Image Gene #28: '16p' versus Molecular Subtype #4: 'MRNASEQ_CHIERARCHICAL'

P value = 1.01e-06 (Chi-square test), Q value = 0.00032
Table S17. Gene #29: '16q' versus Molecular Subtype #3: 'MRNASEQ_CNMF'
| nPatients | CLUS_1 | CLUS_2 | CLUS_3 | CLUS_4 | CLUS_5 | CLUS_6 | CLUS_7 | CLUS_8 | CLUS_9 |
|---|---|---|---|---|---|---|---|---|---|
| ALL | 17 | 14 | 14 | 29 | 21 | 6 | 17 | 16 | 9 |
| 16Q MUTATED | 9 | 7 | 2 | 8 | 4 | 5 | 17 | 4 | 3 |
| 16Q WILD-TYPE | 8 | 7 | 12 | 21 | 17 | 1 | 0 | 12 | 6 |
Figure S17. Get High-res Image Gene #29: '16q' versus Molecular Subtype #3: 'MRNASEQ_CNMF'

P value = 0.000222 (Fisher's exact test), Q value = 0.068
Table S18. Gene #29: '16q' versus Molecular Subtype #4: 'MRNASEQ_CHIERARCHICAL'
| nPatients | CLUS_1 | CLUS_2 | CLUS_3 | CLUS_4 |
|---|---|---|---|---|
| ALL | 22 | 27 | 37 | 57 |
| 16Q MUTATED | 5 | 6 | 12 | 36 |
| 16Q WILD-TYPE | 17 | 21 | 25 | 21 |
Figure S18. Get High-res Image Gene #29: '16q' versus Molecular Subtype #4: 'MRNASEQ_CHIERARCHICAL'

P value = 5.84e-06 (Fisher's exact test), Q value = 0.0018
Table S19. Gene #30: '17p' versus Molecular Subtype #1: 'CN_CNMF'
| nPatients | CLUS_1 | CLUS_2 | CLUS_3 |
|---|---|---|---|
| ALL | 46 | 63 | 56 |
| 17P MUTATED | 21 | 31 | 48 |
| 17P WILD-TYPE | 25 | 32 | 8 |
Figure S19. Get High-res Image Gene #30: '17p' versus Molecular Subtype #1: 'CN_CNMF'

P value = 0.000514 (Fisher's exact test), Q value = 0.16
Table S20. Gene #33: '18q' versus Molecular Subtype #1: 'CN_CNMF'
| nPatients | CLUS_1 | CLUS_2 | CLUS_3 |
|---|---|---|---|
| ALL | 46 | 63 | 56 |
| 18Q MUTATED | 15 | 7 | 23 |
| 18Q WILD-TYPE | 31 | 56 | 33 |
Figure S20. Get High-res Image Gene #33: '18q' versus Molecular Subtype #1: 'CN_CNMF'

P value = 0.000563 (Fisher's exact test), Q value = 0.17
Table S21. Gene #34: '19p' versus Molecular Subtype #2: 'METHLYATION_CNMF'
| nPatients | CLUS_1 | CLUS_2 | CLUS_3 |
|---|---|---|---|
| ALL | 49 | 42 | 73 |
| 19P MUTATED | 12 | 24 | 17 |
| 19P WILD-TYPE | 37 | 18 | 56 |
Figure S21. Get High-res Image Gene #34: '19p' versus Molecular Subtype #2: 'METHLYATION_CNMF'

P value = 0.000805 (Fisher's exact test), Q value = 0.24
Table S22. Gene #36: '20p' versus Molecular Subtype #1: 'CN_CNMF'
| nPatients | CLUS_1 | CLUS_2 | CLUS_3 |
|---|---|---|---|
| ALL | 46 | 63 | 56 |
| 20P MUTATED | 19 | 11 | 27 |
| 20P WILD-TYPE | 27 | 52 | 29 |
Figure S22. Get High-res Image Gene #36: '20p' versus Molecular Subtype #1: 'CN_CNMF'

P value = 0.000829 (Fisher's exact test), Q value = 0.25
Table S23. Gene #36: '20p' versus Molecular Subtype #4: 'MRNASEQ_CHIERARCHICAL'
| nPatients | CLUS_1 | CLUS_2 | CLUS_3 | CLUS_4 |
|---|---|---|---|---|
| ALL | 22 | 27 | 37 | 57 |
| 20P MUTATED | 2 | 7 | 14 | 31 |
| 20P WILD-TYPE | 20 | 20 | 23 | 26 |
Figure S23. Get High-res Image Gene #36: '20p' versus Molecular Subtype #4: 'MRNASEQ_CHIERARCHICAL'

-
Copy number data file = transformed.cor.cli.txt
-
Molecular subtype file = LIHC-TP.transferedmergedcluster.txt
-
Number of patients = 165
-
Number of significantly focal cnvs = 40
-
Number of molecular subtypes = 8
-
Exclude genes that fewer than K tumors have alterations, K = 3
For binary or multi-class clinical features (nominal or ordinal), two-tailed Fisher's exact tests (Fisher 1922) were used to estimate the P values using the 'fisher.test' function in R
For multi-class clinical features (nominal or ordinal), Chi-square tests (Greenwood and Nikulin 1996) were used to estimate the P values using the 'chisq.test' function in R
For multiple hypothesis correction, Q value is the False Discovery Rate (FDR) analogue of the P value (Benjamini and Hochberg 1995), defined as the minimum FDR at which the test may be called significant. We used the 'Benjamini and Hochberg' method of 'p.adjust' function in R to convert P values into Q values.
In addition to the links below, the full results of the analysis summarized in this report can also be downloaded programmatically using firehose_get, or interactively from either the Broad GDAC website or TCGA Data Coordination Center Portal.