This pipeline computes the correlation between significant arm-level copy number variations (cnvs) and selected clinical features.
Testing the association between copy number variation 57 arm-level events and 15 clinical features across 482 patients, 56 significant findings detected with Q value < 0.25.
-
1q gain cnv correlated to 'NEOPLASM.DISEASESTAGE' and 'PATHOLOGY.T.STAGE'.
-
3p gain cnv correlated to 'NEOPLASM.DISEASESTAGE'.
-
4p gain cnv correlated to 'NUMBER.OF.LYMPH.NODES'.
-
4q gain cnv correlated to 'NUMBER.OF.LYMPH.NODES'.
-
5p gain cnv correlated to 'NEOPLASM.DISEASESTAGE'.
-
5q gain cnv correlated to 'NEOPLASM.DISEASESTAGE', 'PATHOLOGY.M.STAGE', and 'NUMBER.OF.LYMPH.NODES'.
-
7p gain cnv correlated to 'NEOPLASM.DISEASESTAGE' and 'NUMBER.OF.LYMPH.NODES'.
-
7q gain cnv correlated to 'NEOPLASM.DISEASESTAGE' and 'NUMBER.OF.LYMPH.NODES'.
-
8q gain cnv correlated to 'NEOPLASM.DISEASESTAGE'.
-
9q gain cnv correlated to 'NUMBER.OF.LYMPH.NODES'.
-
11p gain cnv correlated to 'NUMBER.OF.LYMPH.NODES'.
-
11q gain cnv correlated to 'NUMBER.OF.LYMPH.NODES'.
-
12p gain cnv correlated to 'PATHOLOGY.M.STAGE' and 'NUMBER.OF.LYMPH.NODES'.
-
12q gain cnv correlated to 'PATHOLOGY.M.STAGE' and 'NUMBER.OF.LYMPH.NODES'.
-
13q gain cnv correlated to 'NUMBER.OF.LYMPH.NODES'.
-
16p gain cnv correlated to 'NUMBER.OF.LYMPH.NODES'.
-
16q gain cnv correlated to 'NEOPLASM.DISEASESTAGE' and 'NUMBER.OF.LYMPH.NODES'.
-
17p gain cnv correlated to 'NEOPLASM.DISEASESTAGE' and 'NUMBER.OF.LYMPH.NODES'.
-
17q gain cnv correlated to 'NEOPLASM.DISEASESTAGE' and 'NUMBER.OF.LYMPH.NODES'.
-
18p gain cnv correlated to 'NUMBER.OF.LYMPH.NODES'.
-
18q gain cnv correlated to 'NUMBER.OF.LYMPH.NODES'.
-
19p gain cnv correlated to 'NUMBER.OF.LYMPH.NODES'.
-
19q gain cnv correlated to 'NUMBER.OF.LYMPH.NODES'.
-
20p gain cnv correlated to 'NEOPLASM.DISEASESTAGE', 'PATHOLOGY.M.STAGE', and 'NUMBER.OF.LYMPH.NODES'.
-
20q gain cnv correlated to 'NEOPLASM.DISEASESTAGE', 'PATHOLOGY.M.STAGE', and 'NUMBER.OF.LYMPH.NODES'.
-
21q gain cnv correlated to 'NUMBER.OF.LYMPH.NODES'.
-
xq gain cnv correlated to 'NEOPLASM.DISEASESTAGE'.
-
2p loss cnv correlated to 'NUMBER.OF.LYMPH.NODES'.
-
2q loss cnv correlated to 'NUMBER.OF.LYMPH.NODES'.
-
3q loss cnv correlated to 'NUMBER.OF.LYMPH.NODES'.
-
8p loss cnv correlated to 'NUMBER.OF.LYMPH.NODES'.
-
8q loss cnv correlated to 'NUMBER.OF.LYMPH.NODES'.
-
9q loss cnv correlated to 'NEOPLASM.DISEASESTAGE'.
-
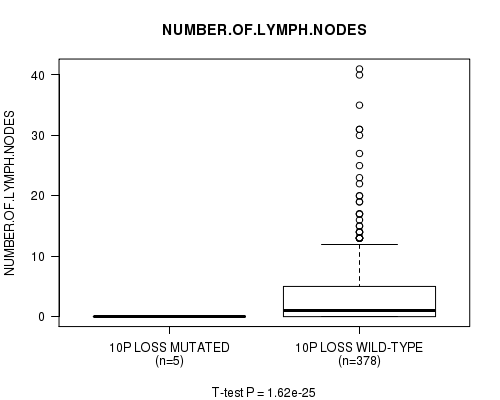
10p loss cnv correlated to 'NUMBER.OF.LYMPH.NODES'.
-
10q loss cnv correlated to 'NUMBER.OF.LYMPH.NODES'.
-
11p loss cnv correlated to 'NEOPLASM.DISEASESTAGE'.
-
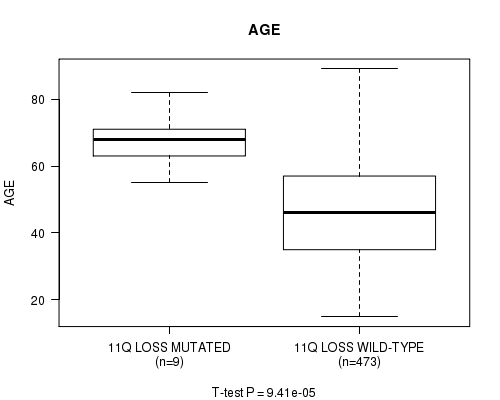
11q loss cnv correlated to 'AGE' and 'NEOPLASM.DISEASESTAGE'.
-
13q loss cnv correlated to 'NUMBER.OF.LYMPH.NODES'.
-
17q loss cnv correlated to 'NUMBER.OF.LYMPH.NODES'.
-
xq loss cnv correlated to 'NEOPLASM.DISEASESTAGE' and 'NUMBER.OF.LYMPH.NODES'.
Table 1. Get Full Table Overview of the association between significant copy number variation of 57 arm-level events and 15 clinical features. Shown in the table are P values (Q values). Thresholded by Q value < 0.25, 56 significant findings detected.
|
Clinical Features |
Time to Death |
AGE |
NEOPLASM DISEASESTAGE |
PATHOLOGY T STAGE |
PATHOLOGY N STAGE |
PATHOLOGY M STAGE |
GENDER |
HISTOLOGICAL TYPE |
RADIATIONS RADIATION REGIMENINDICATION |
RADIATIONEXPOSURE |
EXTRATHYROIDAL EXTENSION |
COMPLETENESS OF RESECTION |
NUMBER OF LYMPH NODES |
MULTIFOCALITY |
TUMOR SIZE |
||
| nCNV (%) | nWild-Type | logrank test | t-test | Chi-square test | Fisher's exact test | Fisher's exact test | Fisher's exact test | Fisher's exact test | Fisher's exact test | Fisher's exact test | Fisher's exact test | Fisher's exact test | Fisher's exact test | t-test | Fisher's exact test | t-test | |
| 5q gain | 15 (3%) | 467 |
0.0205 (1.00) |
0.0105 (1.00) |
5.04e-05 (0.0405) |
0.66 (1.00) |
0.0108 (1.00) |
1.13e-05 (0.00912) |
0.557 (1.00) |
0.0277 (1.00) |
0.362 (1.00) |
1 (1.00) |
0.0354 (1.00) |
0.539 (1.00) |
1.41e-25 (1.19e-22) |
0.608 (1.00) |
0.152 (1.00) |
| 20p gain | 12 (2%) | 470 |
0.34 (1.00) |
0.094 (1.00) |
5.17e-05 (0.0415) |
0.57 (1.00) |
0.0678 (1.00) |
0.000161 (0.128) |
0.528 (1.00) |
0.00457 (1.00) |
1 (1.00) |
1 (1.00) |
0.0245 (1.00) |
0.854 (1.00) |
1.51e-25 (1.27e-22) |
1 (1.00) |
0.133 (1.00) |
| 20q gain | 12 (2%) | 470 |
0.34 (1.00) |
0.094 (1.00) |
5.17e-05 (0.0415) |
0.57 (1.00) |
0.0678 (1.00) |
0.000161 (0.128) |
0.528 (1.00) |
0.00457 (1.00) |
1 (1.00) |
1 (1.00) |
0.0245 (1.00) |
0.854 (1.00) |
1.51e-25 (1.27e-22) |
1 (1.00) |
0.133 (1.00) |
| 1q gain | 23 (5%) | 459 |
0.165 (1.00) |
0.00069 (0.542) |
7.73e-06 (0.00626) |
0.000214 (0.169) |
0.002 (1.00) |
0.692 (1.00) |
0.343 (1.00) |
0.0261 (1.00) |
0.501 (1.00) |
0.586 (1.00) |
0.000325 (0.257) |
0.0237 (1.00) |
0.549 (1.00) |
0.0545 (1.00) |
0.0539 (1.00) |
| 7p gain | 16 (3%) | 466 |
0.362 (1.00) |
0.0441 (1.00) |
3.58e-05 (0.0289) |
0.851 (1.00) |
0.0057 (1.00) |
0.00153 (1.00) |
1 (1.00) |
0.0112 (1.00) |
1 (1.00) |
1 (1.00) |
0.0132 (1.00) |
0.539 (1.00) |
1.38e-25 (1.16e-22) |
0.803 (1.00) |
0.65 (1.00) |
| 7q gain | 18 (4%) | 464 |
0.376 (1.00) |
0.0306 (1.00) |
0.000194 (0.154) |
0.942 (1.00) |
0.0057 (1.00) |
0.00289 (1.00) |
0.791 (1.00) |
0.00773 (1.00) |
1 (1.00) |
1 (1.00) |
0.0253 (1.00) |
0.251 (1.00) |
1.38e-25 (1.16e-22) |
0.812 (1.00) |
0.6 (1.00) |
| 12p gain | 13 (3%) | 469 |
0.517 (1.00) |
0.16 (1.00) |
0.0308 (1.00) |
1 (1.00) |
0.00359 (1.00) |
7.1e-05 (0.0568) |
1 (1.00) |
0.00971 (1.00) |
1 (1.00) |
1 (1.00) |
0.268 (1.00) |
0.304 (1.00) |
1.44e-25 (1.22e-22) |
0.587 (1.00) |
0.919 (1.00) |
| 12q gain | 14 (3%) | 468 |
0.517 (1.00) |
0.136 (1.00) |
0.0535 (1.00) |
0.969 (1.00) |
0.00359 (1.00) |
2.71e-05 (0.0219) |
1 (1.00) |
0.00394 (1.00) |
1 (1.00) |
1 (1.00) |
0.244 (1.00) |
0.261 (1.00) |
1.44e-25 (1.22e-22) |
0.792 (1.00) |
0.919 (1.00) |
| 16q gain | 12 (2%) | 470 |
0.216 (1.00) |
0.106 (1.00) |
6.71e-05 (0.0537) |
0.757 (1.00) |
0.0678 (1.00) |
0.00297 (1.00) |
1 (1.00) |
0.0233 (1.00) |
1 (1.00) |
1 (1.00) |
0.0245 (1.00) |
0.359 (1.00) |
1.51e-25 (1.27e-22) |
1 (1.00) |
0.681 (1.00) |
| 17p gain | 16 (3%) | 466 |
0.418 (1.00) |
0.103 (1.00) |
3.58e-05 (0.0289) |
0.851 (1.00) |
0.036 (1.00) |
0.00789 (1.00) |
1 (1.00) |
0.0448 (1.00) |
1 (1.00) |
1 (1.00) |
0.767 (1.00) |
0.321 (1.00) |
1.42e-06 (0.00115) |
1 (1.00) |
0.41 (1.00) |
| 17q gain | 17 (4%) | 465 |
0.418 (1.00) |
0.168 (1.00) |
9.64e-05 (0.0768) |
0.864 (1.00) |
0.0206 (1.00) |
0.00594 (1.00) |
1 (1.00) |
0.0711 (1.00) |
1 (1.00) |
1 (1.00) |
0.695 (1.00) |
0.352 (1.00) |
1.97e-07 (0.000161) |
0.806 (1.00) |
0.587 (1.00) |
| 11q loss | 9 (2%) | 473 |
0.00286 (1.00) |
9.41e-05 (0.0751) |
5.89e-06 (0.00478) |
0.207 (1.00) |
0.503 (1.00) |
0.121 (1.00) |
0.00179 (1.00) |
1 (1.00) |
0.235 (1.00) |
1 (1.00) |
0.797 (1.00) |
0.507 (1.00) |
0.251 (1.00) |
1 (1.00) |
0.0135 (1.00) |
| xq loss | 3 (1%) | 479 |
0.752 (1.00) |
0.181 (1.00) |
9.08e-05 (0.0725) |
0.223 (1.00) |
0.248 (1.00) |
0.135 (1.00) |
0.174 (1.00) |
0.647 (1.00) |
1 (1.00) |
1 (1.00) |
0.609 (1.00) |
1 (1.00) |
1.69e-25 (1.39e-22) |
1 (1.00) |
|
| 3p gain | 3 (1%) | 479 |
0.0123 (1.00) |
0.0169 (1.00) |
4.31e-05 (0.0347) |
0.12 (1.00) |
1 (1.00) |
0.0114 (1.00) |
0.569 (1.00) |
0.234 (1.00) |
1 (1.00) |
1 (1.00) |
0.609 (1.00) |
0.0229 (1.00) |
1 (1.00) |
0.628 (1.00) |
|
| 4p gain | 5 (1%) | 477 |
0.0265 (1.00) |
0.0542 (1.00) |
0.36 (1.00) |
0.704 (1.00) |
0.0611 (1.00) |
0.0295 (1.00) |
1 (1.00) |
0.187 (1.00) |
0.138 (1.00) |
1 (1.00) |
1 (1.00) |
0.385 (1.00) |
1.62e-25 (1.35e-22) |
0.186 (1.00) |
0.304 (1.00) |
| 4q gain | 5 (1%) | 477 |
0.0265 (1.00) |
0.0542 (1.00) |
0.36 (1.00) |
0.704 (1.00) |
0.0611 (1.00) |
0.0295 (1.00) |
1 (1.00) |
0.187 (1.00) |
0.138 (1.00) |
1 (1.00) |
1 (1.00) |
0.385 (1.00) |
1.62e-25 (1.35e-22) |
0.186 (1.00) |
0.304 (1.00) |
| 5p gain | 18 (4%) | 464 |
0.0822 (1.00) |
0.000966 (0.757) |
0.00021 (0.166) |
0.509 (1.00) |
0.172 (1.00) |
0.000431 (0.34) |
0.586 (1.00) |
0.0934 (1.00) |
0.417 (1.00) |
1 (1.00) |
0.0342 (1.00) |
0.558 (1.00) |
0.012 (1.00) |
1 (1.00) |
0.106 (1.00) |
| 8q gain | 7 (1%) | 475 |
0.109 (1.00) |
0.37 (1.00) |
2.38e-06 (0.00193) |
0.41 (1.00) |
1 (1.00) |
0.0966 (1.00) |
0.681 (1.00) |
0.823 (1.00) |
1 (1.00) |
1 (1.00) |
0.00834 (1.00) |
0.38 (1.00) |
0.00203 (1.00) |
0.13 (1.00) |
0.281 (1.00) |
| 9q gain | 4 (1%) | 478 |
0.697 (1.00) |
0.0155 (1.00) |
0.0694 (1.00) |
0.629 (1.00) |
0.623 (1.00) |
1 (1.00) |
0.288 (1.00) |
0.465 (1.00) |
1 (1.00) |
1 (1.00) |
1 (1.00) |
1 (1.00) |
0.000162 (0.129) |
0.34 (1.00) |
0.00993 (1.00) |
| 11p gain | 6 (1%) | 476 |
0.558 (1.00) |
0.777 (1.00) |
0.938 (1.00) |
0.762 (1.00) |
0.123 (1.00) |
0.19 (1.00) |
0.194 (1.00) |
0.257 (1.00) |
1 (1.00) |
1 (1.00) |
0.354 (1.00) |
0.455 (1.00) |
1.66e-25 (1.37e-22) |
0.224 (1.00) |
0.563 (1.00) |
| 11q gain | 5 (1%) | 477 |
0.561 (1.00) |
0.808 (1.00) |
0.962 (1.00) |
0.892 (1.00) |
0.248 (1.00) |
0.249 (1.00) |
0.612 (1.00) |
0.571 (1.00) |
1 (1.00) |
1 (1.00) |
0.443 (1.00) |
0.385 (1.00) |
1.69e-25 (1.39e-22) |
0.0648 (1.00) |
0.829 (1.00) |
| 13q gain | 5 (1%) | 477 |
0.73 (1.00) |
0.166 (1.00) |
0.0178 (1.00) |
0.704 (1.00) |
0.123 (1.00) |
0.249 (1.00) |
1 (1.00) |
0.187 (1.00) |
1 (1.00) |
1 (1.00) |
1 (1.00) |
1 (1.00) |
1.66e-25 (1.37e-22) |
0.666 (1.00) |
0.655 (1.00) |
| 16p gain | 14 (3%) | 468 |
0.224 (1.00) |
0.158 (1.00) |
0.000481 (0.379) |
0.819 (1.00) |
0.0371 (1.00) |
0.00535 (1.00) |
1 (1.00) |
0.0825 (1.00) |
1 (1.00) |
1 (1.00) |
0.0366 (1.00) |
0.161 (1.00) |
1.48e-25 (1.24e-22) |
1 (1.00) |
0.69 (1.00) |
| 18p gain | 6 (1%) | 476 |
0.616 (1.00) |
0.743 (1.00) |
0.938 (1.00) |
0.762 (1.00) |
0.0611 (1.00) |
0.476 (1.00) |
0.659 (1.00) |
1 (1.00) |
1 (1.00) |
1 (1.00) |
1 (1.00) |
0.385 (1.00) |
1.66e-25 (1.37e-22) |
0.691 (1.00) |
0.61 (1.00) |
| 18q gain | 6 (1%) | 476 |
0.616 (1.00) |
0.743 (1.00) |
0.938 (1.00) |
0.762 (1.00) |
0.0611 (1.00) |
0.476 (1.00) |
0.659 (1.00) |
1 (1.00) |
1 (1.00) |
1 (1.00) |
1 (1.00) |
0.385 (1.00) |
1.66e-25 (1.37e-22) |
0.691 (1.00) |
0.61 (1.00) |
| 19p gain | 8 (2%) | 474 |
0.733 (1.00) |
0.0784 (1.00) |
0.871 (1.00) |
0.613 (1.00) |
0.0302 (1.00) |
0.00251 (1.00) |
0.218 (1.00) |
0.00911 (1.00) |
1 (1.00) |
1 (1.00) |
0.594 (1.00) |
0.448 (1.00) |
1.55e-25 (1.29e-22) |
0.152 (1.00) |
0.219 (1.00) |
| 19q gain | 10 (2%) | 472 |
0.0339 (1.00) |
0.0278 (1.00) |
0.753 (1.00) |
0.329 (1.00) |
0.0149 (1.00) |
0.00111 (0.867) |
0.139 (1.00) |
0.00576 (1.00) |
0.257 (1.00) |
1 (1.00) |
0.516 (1.00) |
0.681 (1.00) |
1.51e-25 (1.27e-22) |
0.524 (1.00) |
0.145 (1.00) |
| 21q gain | 5 (1%) | 477 |
0.616 (1.00) |
0.0433 (1.00) |
0.765 (1.00) |
0.561 (1.00) |
0.248 (1.00) |
0.689 (1.00) |
0.612 (1.00) |
1 (1.00) |
1 (1.00) |
1 (1.00) |
0.639 (1.00) |
0.31 (1.00) |
1.69e-25 (1.39e-22) |
0.0648 (1.00) |
0.314 (1.00) |
| xq gain | 8 (2%) | 474 |
0.0775 (1.00) |
0.0531 (1.00) |
7.36e-07 (0.000599) |
0.557 (1.00) |
0.449 (1.00) |
0.00251 (1.00) |
0.688 (1.00) |
0.255 (1.00) |
1 (1.00) |
0.281 (1.00) |
0.0205 (1.00) |
0.154 (1.00) |
0.805 (1.00) |
0.152 (1.00) |
0.472 (1.00) |
| 2p loss | 10 (2%) | 472 |
0.719 (1.00) |
0.281 (1.00) |
0.00344 (1.00) |
0.697 (1.00) |
0.00732 (1.00) |
0.0136 (1.00) |
0.73 (1.00) |
0.00576 (1.00) |
1 (1.00) |
1 (1.00) |
0.142 (1.00) |
0.551 (1.00) |
1.48e-25 (1.24e-22) |
1 (1.00) |
0.696 (1.00) |
| 2q loss | 10 (2%) | 472 |
0.575 (1.00) |
0.256 (1.00) |
0.00344 (1.00) |
0.823 (1.00) |
0.0149 (1.00) |
0.0136 (1.00) |
0.73 (1.00) |
0.00576 (1.00) |
1 (1.00) |
1 (1.00) |
0.142 (1.00) |
0.551 (1.00) |
1.51e-25 (1.27e-22) |
1 (1.00) |
0.48 (1.00) |
| 3q loss | 4 (1%) | 478 |
0.597 (1.00) |
0.645 (1.00) |
0.204 (1.00) |
0.629 (1.00) |
0.248 (1.00) |
0.107 (1.00) |
1 (1.00) |
0.465 (1.00) |
1 (1.00) |
1 (1.00) |
0.639 (1.00) |
1 (1.00) |
1.69e-25 (1.39e-22) |
1 (1.00) |
0.101 (1.00) |
| 8p loss | 4 (1%) | 478 |
0.871 (1.00) |
0.983 (1.00) |
0.191 (1.00) |
1 (1.00) |
0.248 (1.00) |
0.374 (1.00) |
0.0592 (1.00) |
0.465 (1.00) |
1 (1.00) |
1 (1.00) |
0.639 (1.00) |
1 (1.00) |
1.66e-25 (1.37e-22) |
1 (1.00) |
0.89 (1.00) |
| 8q loss | 4 (1%) | 478 |
0.871 (1.00) |
0.983 (1.00) |
0.191 (1.00) |
1 (1.00) |
0.248 (1.00) |
0.374 (1.00) |
0.0592 (1.00) |
0.465 (1.00) |
1 (1.00) |
1 (1.00) |
0.639 (1.00) |
1 (1.00) |
1.66e-25 (1.37e-22) |
1 (1.00) |
0.89 (1.00) |
| 9q loss | 22 (5%) | 460 |
0.0297 (1.00) |
0.0219 (1.00) |
1.38e-09 (1.13e-06) |
0.19 (1.00) |
0.64 (1.00) |
0.0152 (1.00) |
0.323 (1.00) |
0.712 (1.00) |
0.485 (1.00) |
0.586 (1.00) |
0.0674 (1.00) |
0.568 (1.00) |
0.235 (1.00) |
0.666 (1.00) |
0.112 (1.00) |
| 10p loss | 7 (1%) | 475 |
0.587 (1.00) |
0.332 (1.00) |
0.106 (1.00) |
0.261 (1.00) |
0.0302 (1.00) |
0.0966 (1.00) |
0.389 (1.00) |
0.396 (1.00) |
1 (1.00) |
1 (1.00) |
0.753 (1.00) |
1 (1.00) |
1.62e-25 (1.35e-22) |
0.709 (1.00) |
0.051 (1.00) |
| 10q loss | 6 (1%) | 476 |
0.648 (1.00) |
0.337 (1.00) |
0.46 (1.00) |
0.329 (1.00) |
0.0611 (1.00) |
0.19 (1.00) |
0.194 (1.00) |
0.786 (1.00) |
1 (1.00) |
1 (1.00) |
1 (1.00) |
1 (1.00) |
1.66e-25 (1.37e-22) |
0.422 (1.00) |
0.0462 (1.00) |
| 11p loss | 7 (1%) | 475 |
0.00137 (1.00) |
0.000519 (0.408) |
1.61e-07 (0.000131) |
0.229 (1.00) |
0.449 (1.00) |
0.0966 (1.00) |
0.0162 (1.00) |
0.823 (1.00) |
0.188 (1.00) |
1 (1.00) |
0.544 (1.00) |
0.52 (1.00) |
0.0801 (1.00) |
0.709 (1.00) |
0.0355 (1.00) |
| 13q loss | 14 (3%) | 468 |
0.383 (1.00) |
0.0466 (1.00) |
0.607 (1.00) |
0.592 (1.00) |
0.0108 (1.00) |
0.366 (1.00) |
0.538 (1.00) |
0.471 (1.00) |
0.342 (1.00) |
0.000726 (0.57) |
0.627 (1.00) |
0.671 (1.00) |
9.97e-15 (8.16e-12) |
0.792 (1.00) |
0.153 (1.00) |
| 17q loss | 4 (1%) | 478 |
0.805 (1.00) |
0.369 (1.00) |
0.795 (1.00) |
0.629 (1.00) |
0.123 (1.00) |
0.374 (1.00) |
1 (1.00) |
0.465 (1.00) |
0.112 (1.00) |
1 (1.00) |
1 (1.00) |
1 (1.00) |
1.69e-25 (1.39e-22) |
1 (1.00) |
0.485 (1.00) |
| 1p gain | 3 (1%) | 479 |
0.919 (1.00) |
0.304 (1.00) |
0.0193 (1.00) |
1 (1.00) |
0.623 (1.00) |
0.135 (1.00) |
1 (1.00) |
0.344 (1.00) |
1 (1.00) |
0.0787 (1.00) |
1 (1.00) |
0.232 (1.00) |
0.15 (1.00) |
1 (1.00) |
|
| 8p gain | 6 (1%) | 476 |
0.627 (1.00) |
0.634 (1.00) |
0.938 (1.00) |
0.906 (1.00) |
0.623 (1.00) |
0.19 (1.00) |
1 (1.00) |
0.786 (1.00) |
1 (1.00) |
1 (1.00) |
0.354 (1.00) |
0.455 (1.00) |
0.00203 (1.00) |
0.224 (1.00) |
0.425 (1.00) |
| 9p gain | 3 (1%) | 479 |
0.702 (1.00) |
0.0789 (1.00) |
0.0443 (1.00) |
0.806 (1.00) |
0.248 (1.00) |
0.608 (1.00) |
1 (1.00) |
0.234 (1.00) |
1 (1.00) |
1 (1.00) |
1 (1.00) |
1 (1.00) |
0.598 (1.00) |
0.0613 (1.00) |
|
| 14q gain | 11 (2%) | 471 |
0.535 (1.00) |
0.029 (1.00) |
0.00241 (1.00) |
0.38 (1.00) |
0.0678 (1.00) |
0.0348 (1.00) |
0.302 (1.00) |
0.0638 (1.00) |
1 (1.00) |
1 (1.00) |
0.825 (1.00) |
0.49 (1.00) |
0.0173 (1.00) |
0.123 (1.00) |
0.312 (1.00) |
| 1p loss | 4 (1%) | 478 |
0.601 (1.00) |
0.604 (1.00) |
0.204 (1.00) |
0.629 (1.00) |
0.248 (1.00) |
0.374 (1.00) |
0.578 (1.00) |
0.465 (1.00) |
1 (1.00) |
1 (1.00) |
0.639 (1.00) |
1 (1.00) |
0.628 (1.00) |
0.177 (1.00) |
|
| 1q loss | 3 (1%) | 479 |
0.604 (1.00) |
0.871 (1.00) |
0.805 (1.00) |
0.806 (1.00) |
0.499 (1.00) |
0.135 (1.00) |
0.569 (1.00) |
0.234 (1.00) |
1 (1.00) |
1 (1.00) |
0.609 (1.00) |
1 (1.00) |
1 (1.00) |
0.177 (1.00) |
|
| 3p loss | 3 (1%) | 479 |
0.661 (1.00) |
0.67 (1.00) |
0.805 (1.00) |
0.806 (1.00) |
0.499 (1.00) |
0.135 (1.00) |
1 (1.00) |
0.647 (1.00) |
1 (1.00) |
1 (1.00) |
0.609 (1.00) |
1 (1.00) |
0.598 (1.00) |
0.0828 (1.00) |
|
| 6p loss | 4 (1%) | 478 |
0.633 (1.00) |
0.42 (1.00) |
0.805 (1.00) |
1 (1.00) |
1 (1.00) |
0.107 (1.00) |
1 (1.00) |
1 (1.00) |
1 (1.00) |
1 (1.00) |
0.639 (1.00) |
0.543 (1.00) |
1 (1.00) |
0.0252 (1.00) |
|
| 6q loss | 7 (1%) | 475 |
0.00836 (1.00) |
0.123 (1.00) |
0.37 (1.00) |
0.79 (1.00) |
0.372 (1.00) |
0.00974 (1.00) |
0.389 (1.00) |
0.823 (1.00) |
0.188 (1.00) |
0.219 (1.00) |
0.384 (1.00) |
0.748 (1.00) |
0.00203 (1.00) |
0.459 (1.00) |
0.0166 (1.00) |
| 9p loss | 18 (4%) | 464 |
0.419 (1.00) |
0.203 (1.00) |
0.00279 (1.00) |
0.342 (1.00) |
1 (1.00) |
0.0259 (1.00) |
0.275 (1.00) |
0.719 (1.00) |
1 (1.00) |
1 (1.00) |
0.695 (1.00) |
0.65 (1.00) |
0.007 (1.00) |
0.633 (1.00) |
0.186 (1.00) |
| 15q loss | 8 (2%) | 474 |
0.559 (1.00) |
0.707 (1.00) |
0.221 (1.00) |
0.724 (1.00) |
0.122 (1.00) |
0.0622 (1.00) |
0.688 (1.00) |
0.054 (1.00) |
1 (1.00) |
1 (1.00) |
0.594 (1.00) |
0.786 (1.00) |
0.386 (1.00) |
0.731 (1.00) |
0.0858 (1.00) |
| 17p loss | 7 (1%) | 475 |
0.588 (1.00) |
0.682 (1.00) |
0.527 (1.00) |
0.14 (1.00) |
0.449 (1.00) |
0.343 (1.00) |
0.681 (1.00) |
0.155 (1.00) |
0.0152 (1.00) |
0.251 (1.00) |
0.246 (1.00) |
0.748 (1.00) |
0.929 (1.00) |
1 (1.00) |
0.0925 (1.00) |
| 18p loss | 4 (1%) | 478 |
0.758 (1.00) |
0.544 (1.00) |
0.191 (1.00) |
0.345 (1.00) |
1 (1.00) |
0.374 (1.00) |
1 (1.00) |
0.465 (1.00) |
1 (1.00) |
1 (1.00) |
0.639 (1.00) |
1 (1.00) |
0.00203 (1.00) |
0.628 (1.00) |
0.233 (1.00) |
| 18q loss | 4 (1%) | 478 |
0.758 (1.00) |
0.544 (1.00) |
0.191 (1.00) |
0.345 (1.00) |
1 (1.00) |
0.374 (1.00) |
1 (1.00) |
0.465 (1.00) |
1 (1.00) |
1 (1.00) |
0.639 (1.00) |
1 (1.00) |
0.00203 (1.00) |
0.628 (1.00) |
0.233 (1.00) |
| 19p loss | 5 (1%) | 477 |
0.13 (1.00) |
0.52 (1.00) |
0.315 (1.00) |
1 (1.00) |
1 (1.00) |
0.689 (1.00) |
0.612 (1.00) |
1 (1.00) |
1 (1.00) |
0.0141 (1.00) |
1 (1.00) |
0.625 (1.00) |
0.38 (1.00) |
0.0195 (1.00) |
|
| 21q loss | 8 (2%) | 474 |
0.847 (1.00) |
0.0972 (1.00) |
0.00902 (1.00) |
0.176 (1.00) |
0.724 (1.00) |
0.773 (1.00) |
0.443 (1.00) |
1 (1.00) |
1 (1.00) |
1 (1.00) |
0.215 (1.00) |
1 (1.00) |
0.98 (1.00) |
0.152 (1.00) |
0.671 (1.00) |
| 22q loss | 84 (17%) | 398 |
0.492 (1.00) |
0.898 (1.00) |
0.696 (1.00) |
0.526 (1.00) |
0.315 (1.00) |
0.578 (1.00) |
0.497 (1.00) |
0.273 (1.00) |
0.481 (1.00) |
0.333 (1.00) |
0.306 (1.00) |
0.492 (1.00) |
0.306 (1.00) |
0.225 (1.00) |
0.861 (1.00) |
P value = 7.73e-06 (Chi-square test), Q value = 0.0063
Table S1. Gene #2: '1q gain' versus Clinical Feature #3: 'NEOPLASM.DISEASESTAGE'
| nPatients | STAGE I | STAGE II | STAGE III | STAGE IV | STAGE IVA | STAGE IVC |
|---|---|---|---|---|---|---|
| ALL | 273 | 50 | 106 | 2 | 43 | 6 |
| 1Q GAIN MUTATED | 6 | 0 | 9 | 1 | 7 | 0 |
| 1Q GAIN WILD-TYPE | 267 | 50 | 97 | 1 | 36 | 6 |
Figure S1. Get High-res Image Gene #2: '1q gain' versus Clinical Feature #3: 'NEOPLASM.DISEASESTAGE'

P value = 0.000214 (Fisher's exact test), Q value = 0.17
Table S2. Gene #2: '1q gain' versus Clinical Feature #4: 'PATHOLOGY.T.STAGE'
| nPatients | T1 | T2 | T3 | T4 |
|---|---|---|---|---|
| ALL | 139 | 160 | 160 | 21 |
| 1Q GAIN MUTATED | 2 | 3 | 14 | 4 |
| 1Q GAIN WILD-TYPE | 137 | 157 | 146 | 17 |
Figure S2. Get High-res Image Gene #2: '1q gain' versus Clinical Feature #4: 'PATHOLOGY.T.STAGE'

P value = 4.31e-05 (Chi-square test), Q value = 0.035
Table S3. Gene #3: '3p gain' versus Clinical Feature #3: 'NEOPLASM.DISEASESTAGE'
| nPatients | STAGE I | STAGE II | STAGE III | STAGE IV | STAGE IVA | STAGE IVC |
|---|---|---|---|---|---|---|
| ALL | 273 | 50 | 106 | 2 | 43 | 6 |
| 3P GAIN MUTATED | 1 | 1 | 0 | 0 | 0 | 1 |
| 3P GAIN WILD-TYPE | 272 | 49 | 106 | 2 | 43 | 5 |
Figure S3. Get High-res Image Gene #3: '3p gain' versus Clinical Feature #3: 'NEOPLASM.DISEASESTAGE'

P value = 1.62e-25 (t-test), Q value = 1.3e-22
Table S4. Gene #4: '4p gain' versus Clinical Feature #13: 'NUMBER.OF.LYMPH.NODES'
| nPatients | Mean (Std.Dev) | |
|---|---|---|
| ALL | 383 | 3.6 (6.2) |
| 4P GAIN MUTATED | 5 | 0.0 (0.0) |
| 4P GAIN WILD-TYPE | 378 | 3.6 (6.2) |
Figure S4. Get High-res Image Gene #4: '4p gain' versus Clinical Feature #13: 'NUMBER.OF.LYMPH.NODES'

P value = 1.62e-25 (t-test), Q value = 1.3e-22
Table S5. Gene #5: '4q gain' versus Clinical Feature #13: 'NUMBER.OF.LYMPH.NODES'
| nPatients | Mean (Std.Dev) | |
|---|---|---|
| ALL | 383 | 3.6 (6.2) |
| 4Q GAIN MUTATED | 5 | 0.0 (0.0) |
| 4Q GAIN WILD-TYPE | 378 | 3.6 (6.2) |
Figure S5. Get High-res Image Gene #5: '4q gain' versus Clinical Feature #13: 'NUMBER.OF.LYMPH.NODES'

P value = 0.00021 (Chi-square test), Q value = 0.17
Table S6. Gene #6: '5p gain' versus Clinical Feature #3: 'NEOPLASM.DISEASESTAGE'
| nPatients | STAGE I | STAGE II | STAGE III | STAGE IV | STAGE IVA | STAGE IVC |
|---|---|---|---|---|---|---|
| ALL | 273 | 50 | 106 | 2 | 43 | 6 |
| 5P GAIN MUTATED | 4 | 5 | 7 | 1 | 1 | 0 |
| 5P GAIN WILD-TYPE | 269 | 45 | 99 | 1 | 42 | 6 |
Figure S6. Get High-res Image Gene #6: '5p gain' versus Clinical Feature #3: 'NEOPLASM.DISEASESTAGE'

P value = 5.04e-05 (Chi-square test), Q value = 0.041
Table S7. Gene #7: '5q gain' versus Clinical Feature #3: 'NEOPLASM.DISEASESTAGE'
| nPatients | STAGE I | STAGE II | STAGE III | STAGE IV | STAGE IVA | STAGE IVC |
|---|---|---|---|---|---|---|
| ALL | 273 | 50 | 106 | 2 | 43 | 6 |
| 5Q GAIN MUTATED | 4 | 5 | 5 | 1 | 0 | 0 |
| 5Q GAIN WILD-TYPE | 269 | 45 | 101 | 1 | 43 | 6 |
Figure S7. Get High-res Image Gene #7: '5q gain' versus Clinical Feature #3: 'NEOPLASM.DISEASESTAGE'

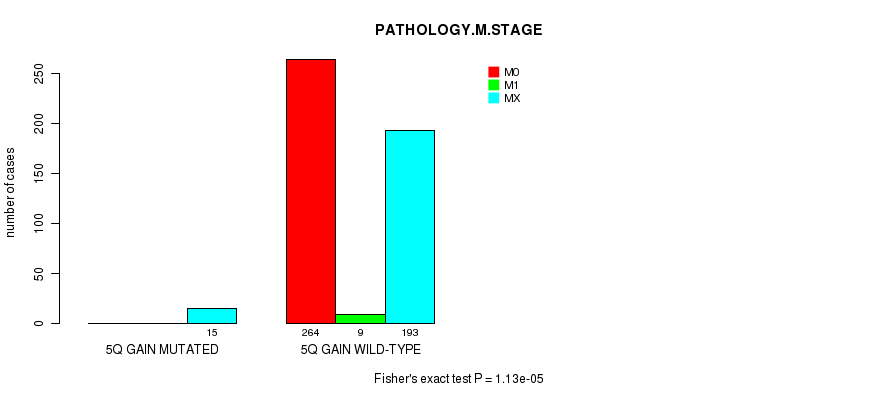
P value = 1.13e-05 (Fisher's exact test), Q value = 0.0091
Table S8. Gene #7: '5q gain' versus Clinical Feature #6: 'PATHOLOGY.M.STAGE'
| nPatients | M0 | M1 | MX |
|---|---|---|---|
| ALL | 264 | 9 | 208 |
| 5Q GAIN MUTATED | 0 | 0 | 15 |
| 5Q GAIN WILD-TYPE | 264 | 9 | 193 |
Figure S8. Get High-res Image Gene #7: '5q gain' versus Clinical Feature #6: 'PATHOLOGY.M.STAGE'
P value = 1.41e-25 (t-test), Q value = 1.2e-22
Table S9. Gene #7: '5q gain' versus Clinical Feature #13: 'NUMBER.OF.LYMPH.NODES'
| nPatients | Mean (Std.Dev) | |
|---|---|---|
| ALL | 383 | 3.6 (6.2) |
| 5Q GAIN MUTATED | 11 | 0.0 (0.0) |
| 5Q GAIN WILD-TYPE | 372 | 3.7 (6.3) |
Figure S9. Get High-res Image Gene #7: '5q gain' versus Clinical Feature #13: 'NUMBER.OF.LYMPH.NODES'

P value = 3.58e-05 (Chi-square test), Q value = 0.029
Table S10. Gene #8: '7p gain' versus Clinical Feature #3: 'NEOPLASM.DISEASESTAGE'
| nPatients | STAGE I | STAGE II | STAGE III | STAGE IV | STAGE IVA | STAGE IVC |
|---|---|---|---|---|---|---|
| ALL | 273 | 50 | 106 | 2 | 43 | 6 |
| 7P GAIN MUTATED | 6 | 6 | 3 | 1 | 0 | 0 |
| 7P GAIN WILD-TYPE | 267 | 44 | 103 | 1 | 43 | 6 |
Figure S10. Get High-res Image Gene #8: '7p gain' versus Clinical Feature #3: 'NEOPLASM.DISEASESTAGE'

P value = 1.38e-25 (t-test), Q value = 1.2e-22
Table S11. Gene #8: '7p gain' versus Clinical Feature #13: 'NUMBER.OF.LYMPH.NODES'
| nPatients | Mean (Std.Dev) | |
|---|---|---|
| ALL | 383 | 3.6 (6.2) |
| 7P GAIN MUTATED | 12 | 0.0 (0.0) |
| 7P GAIN WILD-TYPE | 371 | 3.7 (6.3) |
Figure S11. Get High-res Image Gene #8: '7p gain' versus Clinical Feature #13: 'NUMBER.OF.LYMPH.NODES'

P value = 0.000194 (Chi-square test), Q value = 0.15
Table S12. Gene #9: '7q gain' versus Clinical Feature #3: 'NEOPLASM.DISEASESTAGE'
| nPatients | STAGE I | STAGE II | STAGE III | STAGE IV | STAGE IVA | STAGE IVC |
|---|---|---|---|---|---|---|
| ALL | 273 | 50 | 106 | 2 | 43 | 6 |
| 7Q GAIN MUTATED | 7 | 6 | 4 | 1 | 0 | 0 |
| 7Q GAIN WILD-TYPE | 266 | 44 | 102 | 1 | 43 | 6 |
Figure S12. Get High-res Image Gene #9: '7q gain' versus Clinical Feature #3: 'NEOPLASM.DISEASESTAGE'

P value = 1.38e-25 (t-test), Q value = 1.2e-22
Table S13. Gene #9: '7q gain' versus Clinical Feature #13: 'NUMBER.OF.LYMPH.NODES'
| nPatients | Mean (Std.Dev) | |
|---|---|---|
| ALL | 383 | 3.6 (6.2) |
| 7Q GAIN MUTATED | 12 | 0.0 (0.0) |
| 7Q GAIN WILD-TYPE | 371 | 3.7 (6.3) |
Figure S13. Get High-res Image Gene #9: '7q gain' versus Clinical Feature #13: 'NUMBER.OF.LYMPH.NODES'

P value = 2.38e-06 (Chi-square test), Q value = 0.0019
Table S14. Gene #11: '8q gain' versus Clinical Feature #3: 'NEOPLASM.DISEASESTAGE'
| nPatients | STAGE I | STAGE II | STAGE III | STAGE IV | STAGE IVA | STAGE IVC |
|---|---|---|---|---|---|---|
| ALL | 273 | 50 | 106 | 2 | 43 | 6 |
| 8Q GAIN MUTATED | 3 | 1 | 2 | 1 | 0 | 0 |
| 8Q GAIN WILD-TYPE | 270 | 49 | 104 | 1 | 43 | 6 |
Figure S14. Get High-res Image Gene #11: '8q gain' versus Clinical Feature #3: 'NEOPLASM.DISEASESTAGE'

P value = 0.000162 (t-test), Q value = 0.13
Table S15. Gene #13: '9q gain' versus Clinical Feature #13: 'NUMBER.OF.LYMPH.NODES'
| nPatients | Mean (Std.Dev) | |
|---|---|---|
| ALL | 383 | 3.6 (6.2) |
| 9Q GAIN MUTATED | 3 | 0.3 (0.6) |
| 9Q GAIN WILD-TYPE | 380 | 3.6 (6.2) |
Figure S15. Get High-res Image Gene #13: '9q gain' versus Clinical Feature #13: 'NUMBER.OF.LYMPH.NODES'

P value = 1.66e-25 (t-test), Q value = 1.4e-22
Table S16. Gene #14: '11p gain' versus Clinical Feature #13: 'NUMBER.OF.LYMPH.NODES'
| nPatients | Mean (Std.Dev) | |
|---|---|---|
| ALL | 383 | 3.6 (6.2) |
| 11P GAIN MUTATED | 4 | 0.0 (0.0) |
| 11P GAIN WILD-TYPE | 379 | 3.6 (6.2) |
Figure S16. Get High-res Image Gene #14: '11p gain' versus Clinical Feature #13: 'NUMBER.OF.LYMPH.NODES'

P value = 1.69e-25 (t-test), Q value = 1.4e-22
Table S17. Gene #15: '11q gain' versus Clinical Feature #13: 'NUMBER.OF.LYMPH.NODES'
| nPatients | Mean (Std.Dev) | |
|---|---|---|
| ALL | 383 | 3.6 (6.2) |
| 11Q GAIN MUTATED | 3 | 0.0 (0.0) |
| 11Q GAIN WILD-TYPE | 380 | 3.6 (6.2) |
Figure S17. Get High-res Image Gene #15: '11q gain' versus Clinical Feature #13: 'NUMBER.OF.LYMPH.NODES'

P value = 7.1e-05 (Fisher's exact test), Q value = 0.057
Table S18. Gene #16: '12p gain' versus Clinical Feature #6: 'PATHOLOGY.M.STAGE'
| nPatients | M0 | M1 | MX |
|---|---|---|---|
| ALL | 264 | 9 | 208 |
| 12P GAIN MUTATED | 0 | 0 | 13 |
| 12P GAIN WILD-TYPE | 264 | 9 | 195 |
Figure S18. Get High-res Image Gene #16: '12p gain' versus Clinical Feature #6: 'PATHOLOGY.M.STAGE'

P value = 1.44e-25 (t-test), Q value = 1.2e-22
Table S19. Gene #16: '12p gain' versus Clinical Feature #13: 'NUMBER.OF.LYMPH.NODES'
| nPatients | Mean (Std.Dev) | |
|---|---|---|
| ALL | 383 | 3.6 (6.2) |
| 12P GAIN MUTATED | 10 | 0.0 (0.0) |
| 12P GAIN WILD-TYPE | 373 | 3.7 (6.3) |
Figure S19. Get High-res Image Gene #16: '12p gain' versus Clinical Feature #13: 'NUMBER.OF.LYMPH.NODES'

P value = 2.71e-05 (Fisher's exact test), Q value = 0.022
Table S20. Gene #17: '12q gain' versus Clinical Feature #6: 'PATHOLOGY.M.STAGE'
| nPatients | M0 | M1 | MX |
|---|---|---|---|
| ALL | 264 | 9 | 208 |
| 12Q GAIN MUTATED | 0 | 0 | 14 |
| 12Q GAIN WILD-TYPE | 264 | 9 | 194 |
Figure S20. Get High-res Image Gene #17: '12q gain' versus Clinical Feature #6: 'PATHOLOGY.M.STAGE'

P value = 1.44e-25 (t-test), Q value = 1.2e-22
Table S21. Gene #17: '12q gain' versus Clinical Feature #13: 'NUMBER.OF.LYMPH.NODES'
| nPatients | Mean (Std.Dev) | |
|---|---|---|
| ALL | 383 | 3.6 (6.2) |
| 12Q GAIN MUTATED | 10 | 0.0 (0.0) |
| 12Q GAIN WILD-TYPE | 373 | 3.7 (6.3) |
Figure S21. Get High-res Image Gene #17: '12q gain' versus Clinical Feature #13: 'NUMBER.OF.LYMPH.NODES'

P value = 1.66e-25 (t-test), Q value = 1.4e-22
Table S22. Gene #18: '13q gain' versus Clinical Feature #13: 'NUMBER.OF.LYMPH.NODES'
| nPatients | Mean (Std.Dev) | |
|---|---|---|
| ALL | 383 | 3.6 (6.2) |
| 13Q GAIN MUTATED | 4 | 0.0 (0.0) |
| 13Q GAIN WILD-TYPE | 379 | 3.6 (6.2) |
Figure S22. Get High-res Image Gene #18: '13q gain' versus Clinical Feature #13: 'NUMBER.OF.LYMPH.NODES'

P value = 1.48e-25 (t-test), Q value = 1.2e-22
Table S23. Gene #20: '16p gain' versus Clinical Feature #13: 'NUMBER.OF.LYMPH.NODES'
| nPatients | Mean (Std.Dev) | |
|---|---|---|
| ALL | 383 | 3.6 (6.2) |
| 16P GAIN MUTATED | 9 | 0.0 (0.0) |
| 16P GAIN WILD-TYPE | 374 | 3.6 (6.3) |
Figure S23. Get High-res Image Gene #20: '16p gain' versus Clinical Feature #13: 'NUMBER.OF.LYMPH.NODES'

P value = 6.71e-05 (Chi-square test), Q value = 0.054
Table S24. Gene #21: '16q gain' versus Clinical Feature #3: 'NEOPLASM.DISEASESTAGE'
| nPatients | STAGE I | STAGE II | STAGE III | STAGE IV | STAGE IVA | STAGE IVC |
|---|---|---|---|---|---|---|
| ALL | 273 | 50 | 106 | 2 | 43 | 6 |
| 16Q GAIN MUTATED | 5 | 4 | 2 | 1 | 0 | 0 |
| 16Q GAIN WILD-TYPE | 268 | 46 | 104 | 1 | 43 | 6 |
Figure S24. Get High-res Image Gene #21: '16q gain' versus Clinical Feature #3: 'NEOPLASM.DISEASESTAGE'

P value = 1.51e-25 (t-test), Q value = 1.3e-22
Table S25. Gene #21: '16q gain' versus Clinical Feature #13: 'NUMBER.OF.LYMPH.NODES'
| nPatients | Mean (Std.Dev) | |
|---|---|---|
| ALL | 383 | 3.6 (6.2) |
| 16Q GAIN MUTATED | 8 | 0.0 (0.0) |
| 16Q GAIN WILD-TYPE | 375 | 3.6 (6.3) |
Figure S25. Get High-res Image Gene #21: '16q gain' versus Clinical Feature #13: 'NUMBER.OF.LYMPH.NODES'

P value = 3.58e-05 (Chi-square test), Q value = 0.029
Table S26. Gene #22: '17p gain' versus Clinical Feature #3: 'NEOPLASM.DISEASESTAGE'
| nPatients | STAGE I | STAGE II | STAGE III | STAGE IV | STAGE IVA | STAGE IVC |
|---|---|---|---|---|---|---|
| ALL | 273 | 50 | 106 | 2 | 43 | 6 |
| 17P GAIN MUTATED | 6 | 6 | 3 | 1 | 0 | 0 |
| 17P GAIN WILD-TYPE | 267 | 44 | 103 | 1 | 43 | 6 |
Figure S26. Get High-res Image Gene #22: '17p gain' versus Clinical Feature #3: 'NEOPLASM.DISEASESTAGE'

P value = 1.42e-06 (t-test), Q value = 0.0012
Table S27. Gene #22: '17p gain' versus Clinical Feature #13: 'NUMBER.OF.LYMPH.NODES'
| nPatients | Mean (Std.Dev) | |
|---|---|---|
| ALL | 383 | 3.6 (6.2) |
| 17P GAIN MUTATED | 12 | 0.6 (1.4) |
| 17P GAIN WILD-TYPE | 371 | 3.7 (6.3) |
Figure S27. Get High-res Image Gene #22: '17p gain' versus Clinical Feature #13: 'NUMBER.OF.LYMPH.NODES'

P value = 9.64e-05 (Chi-square test), Q value = 0.077
Table S28. Gene #23: '17q gain' versus Clinical Feature #3: 'NEOPLASM.DISEASESTAGE'
| nPatients | STAGE I | STAGE II | STAGE III | STAGE IV | STAGE IVA | STAGE IVC |
|---|---|---|---|---|---|---|
| ALL | 273 | 50 | 106 | 2 | 43 | 6 |
| 17Q GAIN MUTATED | 7 | 6 | 3 | 1 | 0 | 0 |
| 17Q GAIN WILD-TYPE | 266 | 44 | 103 | 1 | 43 | 6 |
Figure S28. Get High-res Image Gene #23: '17q gain' versus Clinical Feature #3: 'NEOPLASM.DISEASESTAGE'

P value = 1.97e-07 (t-test), Q value = 0.00016
Table S29. Gene #23: '17q gain' versus Clinical Feature #13: 'NUMBER.OF.LYMPH.NODES'
| nPatients | Mean (Std.Dev) | |
|---|---|---|
| ALL | 383 | 3.6 (6.2) |
| 17Q GAIN MUTATED | 13 | 0.5 (1.3) |
| 17Q GAIN WILD-TYPE | 370 | 3.7 (6.3) |
Figure S29. Get High-res Image Gene #23: '17q gain' versus Clinical Feature #13: 'NUMBER.OF.LYMPH.NODES'

P value = 1.66e-25 (t-test), Q value = 1.4e-22
Table S30. Gene #24: '18p gain' versus Clinical Feature #13: 'NUMBER.OF.LYMPH.NODES'
| nPatients | Mean (Std.Dev) | |
|---|---|---|
| ALL | 383 | 3.6 (6.2) |
| 18P GAIN MUTATED | 4 | 0.0 (0.0) |
| 18P GAIN WILD-TYPE | 379 | 3.6 (6.2) |
Figure S30. Get High-res Image Gene #24: '18p gain' versus Clinical Feature #13: 'NUMBER.OF.LYMPH.NODES'

P value = 1.66e-25 (t-test), Q value = 1.4e-22
Table S31. Gene #25: '18q gain' versus Clinical Feature #13: 'NUMBER.OF.LYMPH.NODES'
| nPatients | Mean (Std.Dev) | |
|---|---|---|
| ALL | 383 | 3.6 (6.2) |
| 18Q GAIN MUTATED | 4 | 0.0 (0.0) |
| 18Q GAIN WILD-TYPE | 379 | 3.6 (6.2) |
Figure S31. Get High-res Image Gene #25: '18q gain' versus Clinical Feature #13: 'NUMBER.OF.LYMPH.NODES'

P value = 1.55e-25 (t-test), Q value = 1.3e-22
Table S32. Gene #26: '19p gain' versus Clinical Feature #13: 'NUMBER.OF.LYMPH.NODES'
| nPatients | Mean (Std.Dev) | |
|---|---|---|
| ALL | 383 | 3.6 (6.2) |
| 19P GAIN MUTATED | 7 | 0.0 (0.0) |
| 19P GAIN WILD-TYPE | 376 | 3.6 (6.3) |
Figure S32. Get High-res Image Gene #26: '19p gain' versus Clinical Feature #13: 'NUMBER.OF.LYMPH.NODES'

P value = 1.51e-25 (t-test), Q value = 1.3e-22
Table S33. Gene #27: '19q gain' versus Clinical Feature #13: 'NUMBER.OF.LYMPH.NODES'
| nPatients | Mean (Std.Dev) | |
|---|---|---|
| ALL | 383 | 3.6 (6.2) |
| 19Q GAIN MUTATED | 8 | 0.0 (0.0) |
| 19Q GAIN WILD-TYPE | 375 | 3.6 (6.3) |
Figure S33. Get High-res Image Gene #27: '19q gain' versus Clinical Feature #13: 'NUMBER.OF.LYMPH.NODES'

P value = 5.17e-05 (Chi-square test), Q value = 0.041
Table S34. Gene #28: '20p gain' versus Clinical Feature #3: 'NEOPLASM.DISEASESTAGE'
| nPatients | STAGE I | STAGE II | STAGE III | STAGE IV | STAGE IVA | STAGE IVC |
|---|---|---|---|---|---|---|
| ALL | 273 | 50 | 106 | 2 | 43 | 6 |
| 20P GAIN MUTATED | 4 | 4 | 3 | 1 | 0 | 0 |
| 20P GAIN WILD-TYPE | 269 | 46 | 103 | 1 | 43 | 6 |
Figure S34. Get High-res Image Gene #28: '20p gain' versus Clinical Feature #3: 'NEOPLASM.DISEASESTAGE'

P value = 0.000161 (Fisher's exact test), Q value = 0.13
Table S35. Gene #28: '20p gain' versus Clinical Feature #6: 'PATHOLOGY.M.STAGE'
| nPatients | M0 | M1 | MX |
|---|---|---|---|
| ALL | 264 | 9 | 208 |
| 20P GAIN MUTATED | 0 | 0 | 12 |
| 20P GAIN WILD-TYPE | 264 | 9 | 196 |
Figure S35. Get High-res Image Gene #28: '20p gain' versus Clinical Feature #6: 'PATHOLOGY.M.STAGE'

P value = 1.51e-25 (t-test), Q value = 1.3e-22
Table S36. Gene #28: '20p gain' versus Clinical Feature #13: 'NUMBER.OF.LYMPH.NODES'
| nPatients | Mean (Std.Dev) | |
|---|---|---|
| ALL | 383 | 3.6 (6.2) |
| 20P GAIN MUTATED | 8 | 0.0 (0.0) |
| 20P GAIN WILD-TYPE | 375 | 3.6 (6.3) |
Figure S36. Get High-res Image Gene #28: '20p gain' versus Clinical Feature #13: 'NUMBER.OF.LYMPH.NODES'

P value = 5.17e-05 (Chi-square test), Q value = 0.041
Table S37. Gene #29: '20q gain' versus Clinical Feature #3: 'NEOPLASM.DISEASESTAGE'
| nPatients | STAGE I | STAGE II | STAGE III | STAGE IV | STAGE IVA | STAGE IVC |
|---|---|---|---|---|---|---|
| ALL | 273 | 50 | 106 | 2 | 43 | 6 |
| 20Q GAIN MUTATED | 4 | 4 | 3 | 1 | 0 | 0 |
| 20Q GAIN WILD-TYPE | 269 | 46 | 103 | 1 | 43 | 6 |
Figure S37. Get High-res Image Gene #29: '20q gain' versus Clinical Feature #3: 'NEOPLASM.DISEASESTAGE'

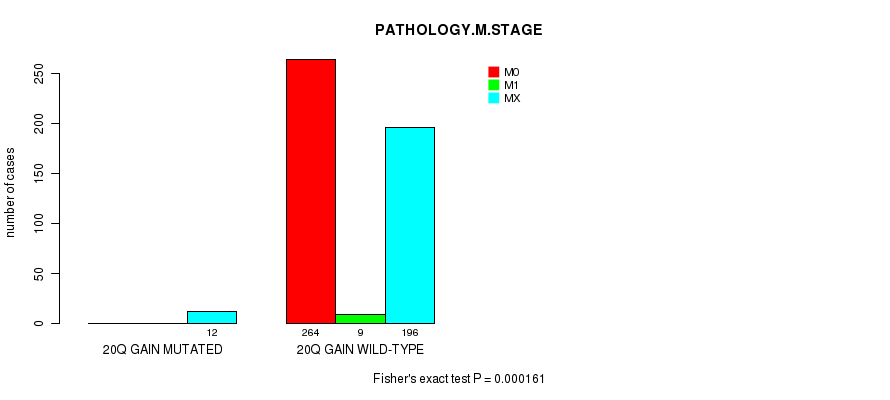
P value = 0.000161 (Fisher's exact test), Q value = 0.13
Table S38. Gene #29: '20q gain' versus Clinical Feature #6: 'PATHOLOGY.M.STAGE'
| nPatients | M0 | M1 | MX |
|---|---|---|---|
| ALL | 264 | 9 | 208 |
| 20Q GAIN MUTATED | 0 | 0 | 12 |
| 20Q GAIN WILD-TYPE | 264 | 9 | 196 |
Figure S38. Get High-res Image Gene #29: '20q gain' versus Clinical Feature #6: 'PATHOLOGY.M.STAGE'
P value = 1.51e-25 (t-test), Q value = 1.3e-22
Table S39. Gene #29: '20q gain' versus Clinical Feature #13: 'NUMBER.OF.LYMPH.NODES'
| nPatients | Mean (Std.Dev) | |
|---|---|---|
| ALL | 383 | 3.6 (6.2) |
| 20Q GAIN MUTATED | 8 | 0.0 (0.0) |
| 20Q GAIN WILD-TYPE | 375 | 3.6 (6.3) |
Figure S39. Get High-res Image Gene #29: '20q gain' versus Clinical Feature #13: 'NUMBER.OF.LYMPH.NODES'

P value = 1.69e-25 (t-test), Q value = 1.4e-22
Table S40. Gene #30: '21q gain' versus Clinical Feature #13: 'NUMBER.OF.LYMPH.NODES'
| nPatients | Mean (Std.Dev) | |
|---|---|---|
| ALL | 383 | 3.6 (6.2) |
| 21Q GAIN MUTATED | 3 | 0.0 (0.0) |
| 21Q GAIN WILD-TYPE | 380 | 3.6 (6.2) |
Figure S40. Get High-res Image Gene #30: '21q gain' versus Clinical Feature #13: 'NUMBER.OF.LYMPH.NODES'

P value = 7.36e-07 (Chi-square test), Q value = 6e-04
Table S41. Gene #31: 'xq gain' versus Clinical Feature #3: 'NEOPLASM.DISEASESTAGE'
| nPatients | STAGE I | STAGE II | STAGE III | STAGE IV | STAGE IVA | STAGE IVC |
|---|---|---|---|---|---|---|
| ALL | 273 | 50 | 106 | 2 | 43 | 6 |
| XQ GAIN MUTATED | 2 | 3 | 2 | 1 | 0 | 0 |
| XQ GAIN WILD-TYPE | 271 | 47 | 104 | 1 | 43 | 6 |
Figure S41. Get High-res Image Gene #31: 'xq gain' versus Clinical Feature #3: 'NEOPLASM.DISEASESTAGE'

P value = 1.48e-25 (t-test), Q value = 1.2e-22
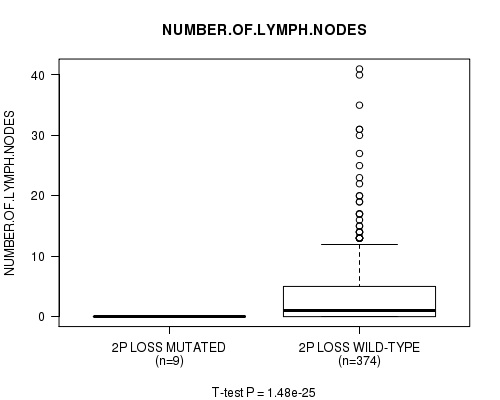
Table S42. Gene #34: '2p loss' versus Clinical Feature #13: 'NUMBER.OF.LYMPH.NODES'
| nPatients | Mean (Std.Dev) | |
|---|---|---|
| ALL | 383 | 3.6 (6.2) |
| 2P LOSS MUTATED | 9 | 0.0 (0.0) |
| 2P LOSS WILD-TYPE | 374 | 3.6 (6.3) |
Figure S42. Get High-res Image Gene #34: '2p loss' versus Clinical Feature #13: 'NUMBER.OF.LYMPH.NODES'
P value = 1.51e-25 (t-test), Q value = 1.3e-22
Table S43. Gene #35: '2q loss' versus Clinical Feature #13: 'NUMBER.OF.LYMPH.NODES'
| nPatients | Mean (Std.Dev) | |
|---|---|---|
| ALL | 383 | 3.6 (6.2) |
| 2Q LOSS MUTATED | 8 | 0.0 (0.0) |
| 2Q LOSS WILD-TYPE | 375 | 3.6 (6.3) |
Figure S43. Get High-res Image Gene #35: '2q loss' versus Clinical Feature #13: 'NUMBER.OF.LYMPH.NODES'

P value = 1.69e-25 (t-test), Q value = 1.4e-22
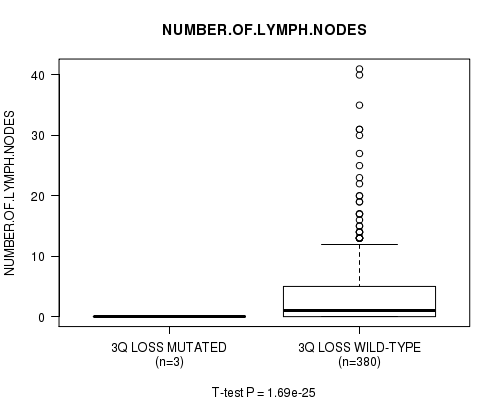
Table S44. Gene #37: '3q loss' versus Clinical Feature #13: 'NUMBER.OF.LYMPH.NODES'
| nPatients | Mean (Std.Dev) | |
|---|---|---|
| ALL | 383 | 3.6 (6.2) |
| 3Q LOSS MUTATED | 3 | 0.0 (0.0) |
| 3Q LOSS WILD-TYPE | 380 | 3.6 (6.2) |
Figure S44. Get High-res Image Gene #37: '3q loss' versus Clinical Feature #13: 'NUMBER.OF.LYMPH.NODES'
P value = 1.66e-25 (t-test), Q value = 1.4e-22
Table S45. Gene #40: '8p loss' versus Clinical Feature #13: 'NUMBER.OF.LYMPH.NODES'
| nPatients | Mean (Std.Dev) | |
|---|---|---|
| ALL | 383 | 3.6 (6.2) |
| 8P LOSS MUTATED | 4 | 0.0 (0.0) |
| 8P LOSS WILD-TYPE | 379 | 3.6 (6.2) |
Figure S45. Get High-res Image Gene #40: '8p loss' versus Clinical Feature #13: 'NUMBER.OF.LYMPH.NODES'

P value = 1.66e-25 (t-test), Q value = 1.4e-22
Table S46. Gene #41: '8q loss' versus Clinical Feature #13: 'NUMBER.OF.LYMPH.NODES'
| nPatients | Mean (Std.Dev) | |
|---|---|---|
| ALL | 383 | 3.6 (6.2) |
| 8Q LOSS MUTATED | 4 | 0.0 (0.0) |
| 8Q LOSS WILD-TYPE | 379 | 3.6 (6.2) |
Figure S46. Get High-res Image Gene #41: '8q loss' versus Clinical Feature #13: 'NUMBER.OF.LYMPH.NODES'

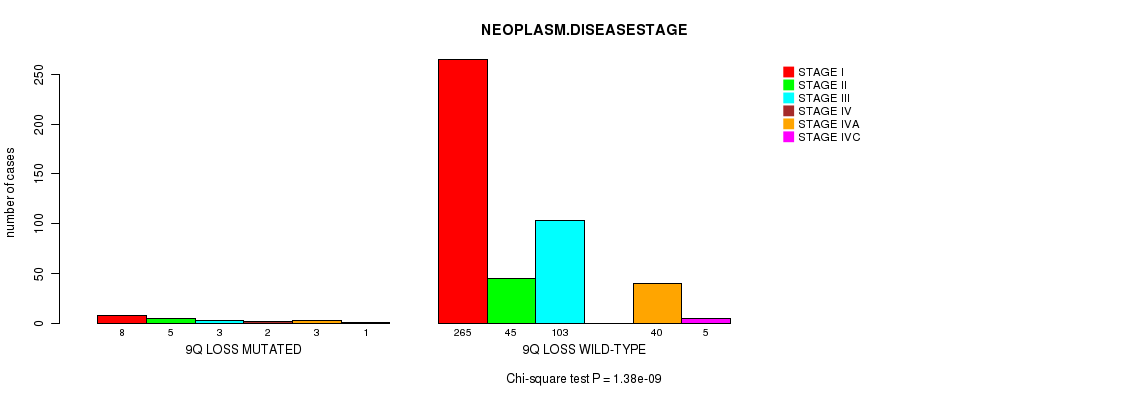
P value = 1.38e-09 (Chi-square test), Q value = 1.1e-06
Table S47. Gene #43: '9q loss' versus Clinical Feature #3: 'NEOPLASM.DISEASESTAGE'
| nPatients | STAGE I | STAGE II | STAGE III | STAGE IV | STAGE IVA | STAGE IVC |
|---|---|---|---|---|---|---|
| ALL | 273 | 50 | 106 | 2 | 43 | 6 |
| 9Q LOSS MUTATED | 8 | 5 | 3 | 2 | 3 | 1 |
| 9Q LOSS WILD-TYPE | 265 | 45 | 103 | 0 | 40 | 5 |
Figure S47. Get High-res Image Gene #43: '9q loss' versus Clinical Feature #3: 'NEOPLASM.DISEASESTAGE'
P value = 1.62e-25 (t-test), Q value = 1.3e-22
Table S48. Gene #44: '10p loss' versus Clinical Feature #13: 'NUMBER.OF.LYMPH.NODES'
| nPatients | Mean (Std.Dev) | |
|---|---|---|
| ALL | 383 | 3.6 (6.2) |
| 10P LOSS MUTATED | 5 | 0.0 (0.0) |
| 10P LOSS WILD-TYPE | 378 | 3.6 (6.2) |
Figure S48. Get High-res Image Gene #44: '10p loss' versus Clinical Feature #13: 'NUMBER.OF.LYMPH.NODES'
P value = 1.66e-25 (t-test), Q value = 1.4e-22
Table S49. Gene #45: '10q loss' versus Clinical Feature #13: 'NUMBER.OF.LYMPH.NODES'
| nPatients | Mean (Std.Dev) | |
|---|---|---|
| ALL | 383 | 3.6 (6.2) |
| 10Q LOSS MUTATED | 4 | 0.0 (0.0) |
| 10Q LOSS WILD-TYPE | 379 | 3.6 (6.2) |
Figure S49. Get High-res Image Gene #45: '10q loss' versus Clinical Feature #13: 'NUMBER.OF.LYMPH.NODES'

P value = 1.61e-07 (Chi-square test), Q value = 0.00013
Table S50. Gene #46: '11p loss' versus Clinical Feature #3: 'NEOPLASM.DISEASESTAGE'
| nPatients | STAGE I | STAGE II | STAGE III | STAGE IV | STAGE IVA | STAGE IVC |
|---|---|---|---|---|---|---|
| ALL | 273 | 50 | 106 | 2 | 43 | 6 |
| 11P LOSS MUTATED | 1 | 1 | 4 | 1 | 0 | 0 |
| 11P LOSS WILD-TYPE | 272 | 49 | 102 | 1 | 43 | 6 |
Figure S50. Get High-res Image Gene #46: '11p loss' versus Clinical Feature #3: 'NEOPLASM.DISEASESTAGE'

P value = 9.41e-05 (t-test), Q value = 0.075
Table S51. Gene #47: '11q loss' versus Clinical Feature #2: 'AGE'
| nPatients | Mean (Std.Dev) | |
|---|---|---|
| ALL | 482 | 47.1 (15.6) |
| 11Q LOSS MUTATED | 9 | 67.0 (8.9) |
| 11Q LOSS WILD-TYPE | 473 | 46.7 (15.5) |
Figure S51. Get High-res Image Gene #47: '11q loss' versus Clinical Feature #2: 'AGE'
P value = 5.89e-06 (Chi-square test), Q value = 0.0048
Table S52. Gene #47: '11q loss' versus Clinical Feature #3: 'NEOPLASM.DISEASESTAGE'
| nPatients | STAGE I | STAGE II | STAGE III | STAGE IV | STAGE IVA | STAGE IVC |
|---|---|---|---|---|---|---|
| ALL | 273 | 50 | 106 | 2 | 43 | 6 |
| 11Q LOSS MUTATED | 1 | 2 | 4 | 1 | 1 | 0 |
| 11Q LOSS WILD-TYPE | 272 | 48 | 102 | 1 | 42 | 6 |
Figure S52. Get High-res Image Gene #47: '11q loss' versus Clinical Feature #3: 'NEOPLASM.DISEASESTAGE'

P value = 9.97e-15 (t-test), Q value = 8.2e-12
Table S53. Gene #48: '13q loss' versus Clinical Feature #13: 'NUMBER.OF.LYMPH.NODES'
| nPatients | Mean (Std.Dev) | |
|---|---|---|
| ALL | 383 | 3.6 (6.2) |
| 13Q LOSS MUTATED | 10 | 0.2 (0.6) |
| 13Q LOSS WILD-TYPE | 373 | 3.7 (6.3) |
Figure S53. Get High-res Image Gene #48: '13q loss' versus Clinical Feature #13: 'NUMBER.OF.LYMPH.NODES'

P value = 1.69e-25 (t-test), Q value = 1.4e-22
Table S54. Gene #51: '17q loss' versus Clinical Feature #13: 'NUMBER.OF.LYMPH.NODES'
| nPatients | Mean (Std.Dev) | |
|---|---|---|
| ALL | 383 | 3.6 (6.2) |
| 17Q LOSS MUTATED | 3 | 0.0 (0.0) |
| 17Q LOSS WILD-TYPE | 380 | 3.6 (6.2) |
Figure S54. Get High-res Image Gene #51: '17q loss' versus Clinical Feature #13: 'NUMBER.OF.LYMPH.NODES'

P value = 9.08e-05 (Chi-square test), Q value = 0.073
Table S55. Gene #57: 'xq loss' versus Clinical Feature #3: 'NEOPLASM.DISEASESTAGE'
| nPatients | STAGE I | STAGE II | STAGE III | STAGE IV | STAGE IVA | STAGE IVC |
|---|---|---|---|---|---|---|
| ALL | 273 | 50 | 106 | 2 | 43 | 6 |
| XQ LOSS MUTATED | 0 | 3 | 0 | 0 | 0 | 0 |
| XQ LOSS WILD-TYPE | 273 | 47 | 106 | 2 | 43 | 6 |
Figure S55. Get High-res Image Gene #57: 'xq loss' versus Clinical Feature #3: 'NEOPLASM.DISEASESTAGE'

P value = 1.69e-25 (t-test), Q value = 1.4e-22
Table S56. Gene #57: 'xq loss' versus Clinical Feature #13: 'NUMBER.OF.LYMPH.NODES'
| nPatients | Mean (Std.Dev) | |
|---|---|---|
| ALL | 383 | 3.6 (6.2) |
| XQ LOSS MUTATED | 3 | 0.0 (0.0) |
| XQ LOSS WILD-TYPE | 380 | 3.6 (6.2) |
Figure S56. Get High-res Image Gene #57: 'xq loss' versus Clinical Feature #13: 'NUMBER.OF.LYMPH.NODES'

-
Copy number data file = transformed.cor.cli.txt
-
Clinical data file = THCA-TP.merged_data.txt
-
Number of patients = 482
-
Number of significantly arm-level cnvs = 57
-
Number of selected clinical features = 15
-
Exclude regions that fewer than K tumors have mutations, K = 3
For survival clinical features, the Kaplan-Meier survival curves of tumors with and without gene mutations were plotted and the statistical significance P values were estimated by logrank test (Bland and Altman 2004) using the 'survdiff' function in R
For continuous numerical clinical features, two-tailed Student's t test with unequal variance (Lehmann and Romano 2005) was applied to compare the clinical values between tumors with and without gene mutations using 't.test' function in R
For multi-class clinical features (nominal or ordinal), Chi-square tests (Greenwood and Nikulin 1996) were used to estimate the P values using the 'chisq.test' function in R
For binary or multi-class clinical features (nominal or ordinal), two-tailed Fisher's exact tests (Fisher 1922) were used to estimate the P values using the 'fisher.test' function in R
For multiple hypothesis correction, Q value is the False Discovery Rate (FDR) analogue of the P value (Benjamini and Hochberg 1995), defined as the minimum FDR at which the test may be called significant. We used the 'Benjamini and Hochberg' method of 'p.adjust' function in R to convert P values into Q values.
In addition to the links below, the full results of the analysis summarized in this report can also be downloaded programmatically using firehose_get, or interactively from either the Broad GDAC website or TCGA Data Coordination Center Portal.