This pipeline computes the correlation between significantly recurrent gene mutations and selected clinical features.
Testing the association between mutation status of 6 genes and 15 clinical features across 392 patients, 8 significant findings detected with Q value < 0.25.
-
NRAS mutation correlated to 'PATHOLOGY.N.STAGE', 'HISTOLOGICAL.TYPE', and 'NUMBER.OF.LYMPH.NODES'.
-
BRAF mutation correlated to 'NEOPLASM.DISEASESTAGE', 'PATHOLOGY.T.STAGE', 'PATHOLOGY.N.STAGE', 'HISTOLOGICAL.TYPE', and 'EXTRATHYROIDAL.EXTENSION'.
Table 1. Get Full Table Overview of the association between mutation status of 6 genes and 15 clinical features. Shown in the table are P values (Q values). Thresholded by Q value < 0.25, 8 significant findings detected.
|
Clinical Features |
Time to Death |
AGE |
NEOPLASM DISEASESTAGE |
PATHOLOGY T STAGE |
PATHOLOGY N STAGE |
PATHOLOGY M STAGE |
GENDER |
HISTOLOGICAL TYPE |
RADIATIONS RADIATION REGIMENINDICATION |
RADIATIONEXPOSURE |
EXTRATHYROIDAL EXTENSION |
COMPLETENESS OF RESECTION |
NUMBER OF LYMPH NODES |
MULTIFOCALITY |
TUMOR SIZE |
||
| nMutated (%) | nWild-Type | logrank test | t-test | Chi-square test | Fisher's exact test | Fisher's exact test | Fisher's exact test | Fisher's exact test | Fisher's exact test | Fisher's exact test | Fisher's exact test | Fisher's exact test | Fisher's exact test | t-test | Fisher's exact test | t-test | |
| BRAF | 236 (60%) | 156 |
0.91 (1.00) |
0.661 (1.00) |
0.00202 (0.166) |
0.000607 (0.0504) |
0.00043 (0.0362) |
0.0835 (1.00) |
0.408 (1.00) |
1.94e-19 (1.73e-17) |
0.0323 (1.00) |
0.592 (1.00) |
3.75e-07 (3.3e-05) |
0.365 (1.00) |
0.567 (1.00) |
0.753 (1.00) |
0.349 (1.00) |
| NRAS | 34 (9%) | 358 |
0.469 (1.00) |
0.448 (1.00) |
0.0493 (1.00) |
0.149 (1.00) |
0.000138 (0.0117) |
0.492 (1.00) |
0.84 (1.00) |
4.97e-05 (0.00432) |
0.611 (1.00) |
1 (1.00) |
0.192 (1.00) |
0.654 (1.00) |
5.23e-05 (0.0045) |
0.369 (1.00) |
0.651 (1.00) |
| HRAS | 13 (3%) | 379 |
0.507 (1.00) |
0.595 (1.00) |
0.464 (1.00) |
0.439 (1.00) |
0.549 (1.00) |
0.286 (1.00) |
0.746 (1.00) |
0.0128 (1.00) |
1 (1.00) |
1 (1.00) |
0.691 (1.00) |
0.171 (1.00) |
0.507 (1.00) |
0.779 (1.00) |
0.954 (1.00) |
| EIF1AX | 6 (2%) | 386 |
0.0961 (1.00) |
0.137 (1.00) |
0.967 (1.00) |
1 (1.00) |
0.625 (1.00) |
0.473 (1.00) |
0.176 (1.00) |
0.0737 (1.00) |
1 (1.00) |
1 (1.00) |
1 (1.00) |
0.275 (1.00) |
0.769 (1.00) |
0.668 (1.00) |
0.69 (1.00) |
| NUP93 | 4 (1%) | 388 |
0.909 (1.00) |
0.408 (1.00) |
0.781 (1.00) |
0.736 (1.00) |
0.348 (1.00) |
0.659 (1.00) |
1 (1.00) |
0.0148 (1.00) |
1 (1.00) |
1 (1.00) |
1 (1.00) |
0.512 (1.00) |
0.61 (1.00) |
0.343 (1.00) |
0.985 (1.00) |
| NLRP6 | 3 (1%) | 389 |
0.644 (1.00) |
0.0328 (1.00) |
0.812 (1.00) |
0.17 (1.00) |
0.605 (1.00) |
0.134 (1.00) |
1 (1.00) |
0.66 (1.00) |
1 (1.00) |
1 (1.00) |
1 (1.00) |
1 (1.00) |
0.525 (1.00) |
0.601 (1.00) |
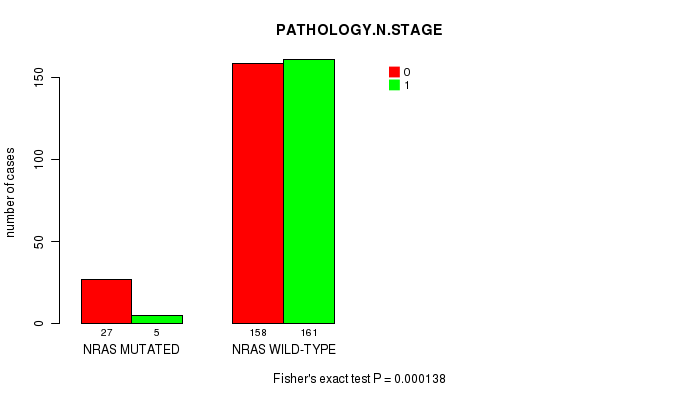
P value = 0.000138 (Fisher's exact test), Q value = 0.012
Table S1. Gene #1: 'NRAS MUTATION STATUS' versus Clinical Feature #5: 'PATHOLOGY.N.STAGE'
| nPatients | 0 | 1 |
|---|---|---|
| ALL | 185 | 166 |
| NRAS MUTATED | 27 | 5 |
| NRAS WILD-TYPE | 158 | 161 |
Figure S1. Get High-res Image Gene #1: 'NRAS MUTATION STATUS' versus Clinical Feature #5: 'PATHOLOGY.N.STAGE'
P value = 4.97e-05 (Fisher's exact test), Q value = 0.0043
Table S2. Gene #1: 'NRAS MUTATION STATUS' versus Clinical Feature #8: 'HISTOLOGICAL.TYPE'
| nPatients | OTHER SPECIFY | THYROID PAPILLARY CARCINOMA - CLASSICAL/USUAL | THYROID PAPILLARY CARCINOMA - FOLLICULAR (>= 99% FOLLICULAR PATTERNED) | THYROID PAPILLARY CARCINOMA - TALL CELL (>= 50% TALL CELL FEATURES) |
|---|---|---|---|---|
| ALL | 6 | 274 | 83 | 29 |
| NRAS MUTATED | 0 | 15 | 19 | 0 |
| NRAS WILD-TYPE | 6 | 259 | 64 | 29 |
Figure S2. Get High-res Image Gene #1: 'NRAS MUTATION STATUS' versus Clinical Feature #8: 'HISTOLOGICAL.TYPE'

P value = 5.23e-05 (t-test), Q value = 0.0045
Table S3. Gene #1: 'NRAS MUTATION STATUS' versus Clinical Feature #13: 'NUMBER.OF.LYMPH.NODES'
| nPatients | Mean (Std.Dev) | |
|---|---|---|
| ALL | 306 | 3.3 (6.0) |
| NRAS MUTATED | 26 | 0.9 (2.4) |
| NRAS WILD-TYPE | 280 | 3.5 (6.2) |
Figure S3. Get High-res Image Gene #1: 'NRAS MUTATION STATUS' versus Clinical Feature #13: 'NUMBER.OF.LYMPH.NODES'

P value = 0.00202 (Chi-square test), Q value = 0.17
Table S4. Gene #2: 'BRAF MUTATION STATUS' versus Clinical Feature #3: 'NEOPLASM.DISEASESTAGE'
| nPatients | STAGE I | STAGE II | STAGE III | STAGE IV | STAGE IVA | STAGE IVC |
|---|---|---|---|---|---|---|
| ALL | 223 | 44 | 83 | 2 | 32 | 6 |
| BRAF MUTATED | 129 | 18 | 59 | 0 | 25 | 4 |
| BRAF WILD-TYPE | 94 | 26 | 24 | 2 | 7 | 2 |
Figure S4. Get High-res Image Gene #2: 'BRAF MUTATION STATUS' versus Clinical Feature #3: 'NEOPLASM.DISEASESTAGE'

P value = 0.000607 (Fisher's exact test), Q value = 0.05
Table S5. Gene #2: 'BRAF MUTATION STATUS' versus Clinical Feature #4: 'PATHOLOGY.T.STAGE'
| nPatients | T1 | T2 | T3 | T4 |
|---|---|---|---|---|
| ALL | 115 | 134 | 126 | 15 |
| BRAF MUTATED | 67 | 66 | 89 | 13 |
| BRAF WILD-TYPE | 48 | 68 | 37 | 2 |
Figure S5. Get High-res Image Gene #2: 'BRAF MUTATION STATUS' versus Clinical Feature #4: 'PATHOLOGY.T.STAGE'

P value = 0.00043 (Fisher's exact test), Q value = 0.036
Table S6. Gene #2: 'BRAF MUTATION STATUS' versus Clinical Feature #5: 'PATHOLOGY.N.STAGE'
| nPatients | 0 | 1 |
|---|---|---|
| ALL | 185 | 166 |
| BRAF MUTATED | 97 | 118 |
| BRAF WILD-TYPE | 88 | 48 |
Figure S6. Get High-res Image Gene #2: 'BRAF MUTATION STATUS' versus Clinical Feature #5: 'PATHOLOGY.N.STAGE'

P value = 1.94e-19 (Fisher's exact test), Q value = 1.7e-17
Table S7. Gene #2: 'BRAF MUTATION STATUS' versus Clinical Feature #8: 'HISTOLOGICAL.TYPE'
| nPatients | OTHER SPECIFY | THYROID PAPILLARY CARCINOMA - CLASSICAL/USUAL | THYROID PAPILLARY CARCINOMA - FOLLICULAR (>= 99% FOLLICULAR PATTERNED) | THYROID PAPILLARY CARCINOMA - TALL CELL (>= 50% TALL CELL FEATURES) |
|---|---|---|---|---|
| ALL | 6 | 274 | 83 | 29 |
| BRAF MUTATED | 3 | 191 | 15 | 27 |
| BRAF WILD-TYPE | 3 | 83 | 68 | 2 |
Figure S7. Get High-res Image Gene #2: 'BRAF MUTATION STATUS' versus Clinical Feature #8: 'HISTOLOGICAL.TYPE'

P value = 3.75e-07 (Fisher's exact test), Q value = 3.3e-05
Table S8. Gene #2: 'BRAF MUTATION STATUS' versus Clinical Feature #11: 'EXTRATHYROIDAL.EXTENSION'
| nPatients | MINIMAL (T3) | MODERATE/ADVANCED (T4A) | NONE | VERY ADVANCED (T4B) |
|---|---|---|---|---|
| ALL | 101 | 11 | 266 | 1 |
| BRAF MUTATED | 79 | 11 | 140 | 0 |
| BRAF WILD-TYPE | 22 | 0 | 126 | 1 |
Figure S8. Get High-res Image Gene #2: 'BRAF MUTATION STATUS' versus Clinical Feature #11: 'EXTRATHYROIDAL.EXTENSION'

-
Mutation data file = transformed.cor.cli.txt
-
Clinical data file = THCA-TP.merged_data.txt
-
Number of patients = 392
-
Number of significantly mutated genes = 6
-
Number of selected clinical features = 15
-
Exclude genes that fewer than K tumors have mutations, K = 3
For survival clinical features, the Kaplan-Meier survival curves of tumors with and without gene mutations were plotted and the statistical significance P values were estimated by logrank test (Bland and Altman 2004) using the 'survdiff' function in R
For continuous numerical clinical features, two-tailed Student's t test with unequal variance (Lehmann and Romano 2005) was applied to compare the clinical values between tumors with and without gene mutations using 't.test' function in R
For multi-class clinical features (nominal or ordinal), Chi-square tests (Greenwood and Nikulin 1996) were used to estimate the P values using the 'chisq.test' function in R
For binary or multi-class clinical features (nominal or ordinal), two-tailed Fisher's exact tests (Fisher 1922) were used to estimate the P values using the 'fisher.test' function in R
For multiple hypothesis correction, Q value is the False Discovery Rate (FDR) analogue of the P value (Benjamini and Hochberg 1995), defined as the minimum FDR at which the test may be called significant. We used the 'Benjamini and Hochberg' method of 'p.adjust' function in R to convert P values into Q values.
In addition to the links below, the full results of the analysis summarized in this report can also be downloaded programmatically using firehose_get, or interactively from either the Broad GDAC website or TCGA Data Coordination Center Portal.