This pipeline computes the correlation between significant arm-level copy number variations (cnvs) and selected clinical features.
Testing the association between copy number variation 82 arm-level events and 11 clinical features across 357 patients, 20 significant findings detected with Q value < 0.25.
-
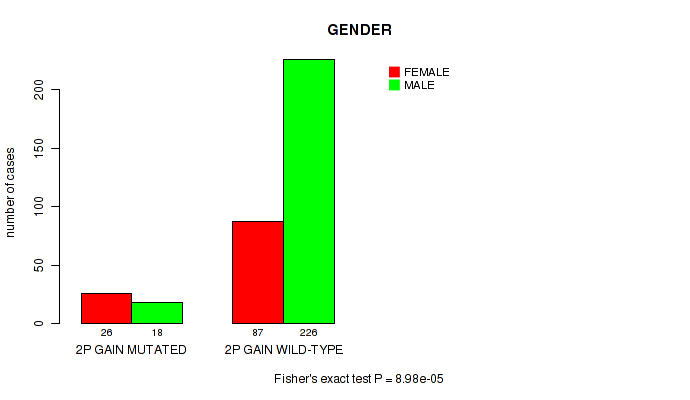
2p gain cnv correlated to 'GENDER'.
-
2q gain cnv correlated to 'GENDER'.
-
8q gain cnv correlated to 'GENDER'.
-
10p gain cnv correlated to 'YEARS_TO_BIRTH'.
-
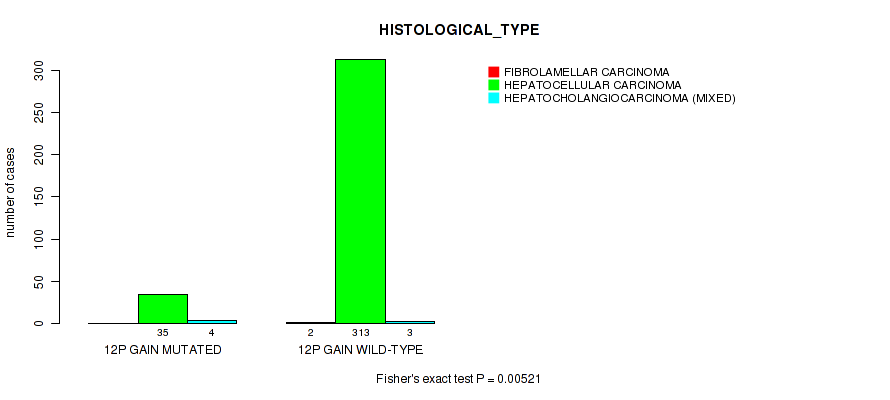
12p gain cnv correlated to 'HISTOLOGICAL_TYPE'.
-
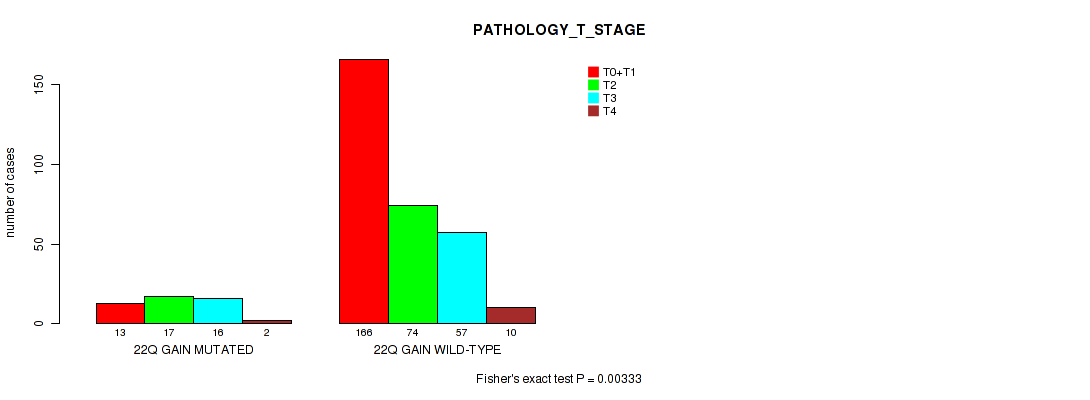
22q gain cnv correlated to 'PATHOLOGY_T_STAGE'.
-
3p loss cnv correlated to 'PATHOLOGY_T_STAGE' and 'HISTOLOGICAL_TYPE'.
-
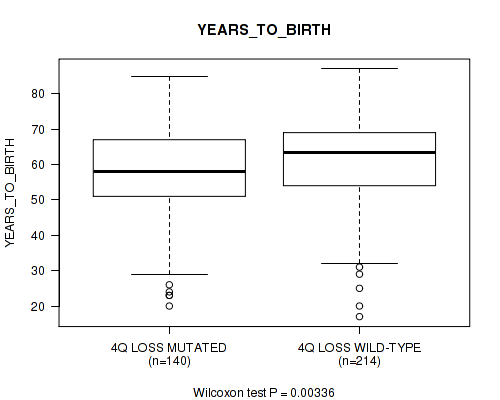
4q loss cnv correlated to 'YEARS_TO_BIRTH' and 'RACE'.
-
7q loss cnv correlated to 'Time to Death'.
-
10q loss cnv correlated to 'RACE'.
-
12q loss cnv correlated to 'NEOPLASM_DISEASESTAGE'.
-
13q loss cnv correlated to 'PATHOLOGY_T_STAGE'.
-
16p loss cnv correlated to 'YEARS_TO_BIRTH' and 'RACE'.
-
16q loss cnv correlated to 'YEARS_TO_BIRTH' and 'RACE'.
-
17p loss cnv correlated to 'NEOPLASM_DISEASESTAGE'.
-
xp loss cnv correlated to 'GENDER'.
Table 1. Get Full Table Overview of the association between significant copy number variation of 82 arm-level events and 11 clinical features. Shown in the table are P values (Q values). Thresholded by Q value < 0.25, 20 significant findings detected.
|
Clinical Features |
Time to Death |
YEARS TO BIRTH |
NEOPLASM DISEASESTAGE |
PATHOLOGY T STAGE |
PATHOLOGY N STAGE |
PATHOLOGY M STAGE |
GENDER |
HISTOLOGICAL TYPE |
COMPLETENESS OF RESECTION |
RACE | ETHNICITY | ||
| nCNV (%) | nWild-Type | logrank test | Wilcoxon-test | Fisher's exact test | Fisher's exact test | Fisher's exact test | Fisher's exact test | Fisher's exact test | Fisher's exact test | Fisher's exact test | Fisher's exact test | Fisher's exact test | |
| 3p loss | 50 (14%) | 307 |
0.473 (0.873) |
0.159 (0.664) |
0.0139 (0.331) |
0.00277 (0.214) |
0.363 (0.787) |
0.446 (0.857) |
0.326 (0.768) |
0.00353 (0.214) |
0.395 (0.814) |
0.971 (1.00) |
1 (1.00) |
| 4q loss | 142 (40%) | 215 |
0.612 (0.941) |
0.00336 (0.214) |
0.268 (0.731) |
0.417 (0.826) |
0.569 (0.927) |
0.323 (0.768) |
0.296 (0.75) |
0.732 (1.00) |
0.327 (0.768) |
0.00091 (0.125) |
0.763 (1.00) |
| 16p loss | 108 (30%) | 249 |
0.298 (0.75) |
0.00212 (0.191) |
0.263 (0.731) |
0.345 (0.781) |
0.253 (0.721) |
0.607 (0.938) |
0.265 (0.731) |
1 (1.00) |
0.0642 (0.553) |
0.00389 (0.214) |
0.325 (0.768) |
| 16q loss | 143 (40%) | 214 |
0.523 (0.892) |
0.000119 (0.0359) |
0.0872 (0.554) |
0.0708 (0.554) |
0.58 (0.927) |
1 (1.00) |
0.297 (0.75) |
0.733 (1.00) |
0.361 (0.787) |
1e-05 (0.00902) |
0.367 (0.788) |
| 2p gain | 44 (12%) | 313 |
0.176 (0.69) |
0.111 (0.586) |
0.0949 (0.559) |
0.0922 (0.557) |
0.0433 (0.465) |
0.0732 (0.554) |
8.98e-05 (0.0359) |
0.395 (0.814) |
0.0934 (0.557) |
0.268 (0.731) |
0.64 (0.95) |
| 2q gain | 40 (11%) | 317 |
0.131 (0.619) |
0.448 (0.859) |
0.159 (0.664) |
0.144 (0.635) |
0.336 (0.777) |
0.0732 (0.554) |
0.000449 (0.081) |
0.355 (0.785) |
0.226 (0.703) |
0.715 (1.00) |
0.625 (0.944) |
| 8q gain | 182 (51%) | 175 |
0.724 (1.00) |
0.133 (0.623) |
0.212 (0.698) |
0.359 (0.785) |
0.596 (0.93) |
1 (1.00) |
0.000969 (0.125) |
0.638 (0.95) |
0.98 (1.00) |
0.0363 (0.42) |
1 (1.00) |
| 10p gain | 60 (17%) | 297 |
0.845 (1.00) |
0.00497 (0.235) |
0.072 (0.554) |
0.0644 (0.553) |
1 (1.00) |
0.141 (0.634) |
1 (1.00) |
0.375 (0.795) |
0.758 (1.00) |
0.335 (0.776) |
0.413 (0.826) |
| 12p gain | 39 (11%) | 318 |
0.21 (0.698) |
0.588 (0.927) |
0.197 (0.695) |
0.0629 (0.553) |
1 (1.00) |
1 (1.00) |
0.203 (0.698) |
0.00521 (0.235) |
0.692 (0.992) |
0.894 (1.00) |
0.617 (0.941) |
| 22q gain | 48 (13%) | 309 |
0.661 (0.962) |
0.916 (1.00) |
0.0242 (0.394) |
0.00333 (0.214) |
0.327 (0.768) |
1 (1.00) |
0.243 (0.721) |
0.432 (0.846) |
0.267 (0.731) |
0.939 (1.00) |
1 (1.00) |
| 7q loss | 20 (6%) | 337 |
0.00427 (0.214) |
0.369 (0.791) |
0.916 (1.00) |
0.792 (1.00) |
1 (1.00) |
1 (1.00) |
0.0266 (0.394) |
1 (1.00) |
0.21 (0.698) |
0.12 (0.596) |
1 (1.00) |
| 10q loss | 74 (21%) | 283 |
0.273 (0.731) |
0.957 (1.00) |
0.364 (0.788) |
0.211 (0.698) |
0.486 (0.873) |
0.583 (0.927) |
0.575 (0.927) |
0.03 (0.394) |
0.35 (0.785) |
0.00026 (0.0586) |
1 (1.00) |
| 12q loss | 33 (9%) | 324 |
0.57 (0.927) |
0.0857 (0.554) |
0.00425 (0.214) |
0.508 (0.89) |
1 (1.00) |
0.057 (0.527) |
0.696 (0.993) |
0.587 (0.927) |
0.0928 (0.557) |
0.238 (0.717) |
0.277 (0.731) |
| 13q loss | 115 (32%) | 242 |
0.454 (0.865) |
0.626 (0.944) |
0.0697 (0.554) |
0.00129 (0.145) |
1 (1.00) |
0.598 (0.93) |
0.0688 (0.554) |
0.244 (0.721) |
0.0809 (0.554) |
0.914 (1.00) |
1 (1.00) |
| 17p loss | 177 (50%) | 180 |
0.0377 (0.43) |
0.576 (0.927) |
0.00145 (0.145) |
0.015 (0.346) |
0.247 (0.721) |
0.622 (0.943) |
0.909 (1.00) |
0.639 (0.95) |
0.274 (0.731) |
0.366 (0.788) |
0.138 (0.627) |
| xp loss | 92 (26%) | 265 |
0.0865 (0.554) |
0.0731 (0.554) |
0.798 (1.00) |
0.462 (0.868) |
1 (1.00) |
1 (1.00) |
0.00407 (0.214) |
0.419 (0.827) |
0.227 (0.703) |
0.559 (0.921) |
1 (1.00) |
| 1p gain | 54 (15%) | 303 |
0.879 (1.00) |
0.155 (0.664) |
0.406 (0.822) |
0.109 (0.585) |
1 (1.00) |
1 (1.00) |
0.208 (0.698) |
1 (1.00) |
0.25 (0.721) |
0.0844 (0.554) |
0.227 (0.703) |
| 1q gain | 215 (60%) | 142 |
0.676 (0.976) |
0.53 (0.896) |
0.487 (0.873) |
0.586 (0.927) |
0.561 (0.921) |
0.3 (0.75) |
0.488 (0.873) |
0.133 (0.623) |
0.457 (0.865) |
0.105 (0.585) |
0.758 (1.00) |
| 3p gain | 35 (10%) | 322 |
0.515 (0.89) |
0.53 (0.896) |
0.334 (0.776) |
0.789 (1.00) |
0.25 (0.721) |
0.352 (0.785) |
0.13 (0.619) |
1 (1.00) |
0.195 (0.695) |
0.807 (1.00) |
0.303 (0.75) |
| 3q gain | 38 (11%) | 319 |
0.115 (0.586) |
0.739 (1.00) |
0.343 (0.781) |
0.775 (1.00) |
0.27 (0.731) |
0.363 (0.787) |
0.196 (0.695) |
0.641 (0.95) |
0.262 (0.731) |
0.652 (0.957) |
0.106 (0.585) |
| 4p gain | 26 (7%) | 331 |
0.0263 (0.394) |
0.697 (0.993) |
0.638 (0.95) |
0.592 (0.93) |
1 (1.00) |
1 (1.00) |
0.124 (0.61) |
1 (1.00) |
0.774 (1.00) |
1 (1.00) |
1 (1.00) |
| 4q gain | 7 (2%) | 350 |
0.698 (0.993) |
0.237 (0.717) |
0.762 (1.00) |
0.684 (0.986) |
1 (1.00) |
1 (1.00) |
1 (1.00) |
1 (1.00) |
0.161 (0.664) |
0.582 (0.927) |
0.207 (0.698) |
| 5p gain | 132 (37%) | 225 |
0.137 (0.626) |
0.101 (0.578) |
0.414 (0.826) |
0.0973 (0.566) |
0.554 (0.917) |
1 (1.00) |
0.724 (1.00) |
0.62 (0.941) |
0.924 (1.00) |
0.923 (1.00) |
1 (1.00) |
| 5q gain | 104 (29%) | 253 |
0.337 (0.777) |
0.0551 (0.527) |
0.934 (1.00) |
0.428 (0.841) |
0.564 (0.925) |
1 (1.00) |
0.103 (0.585) |
1 (1.00) |
0.856 (1.00) |
0.795 (1.00) |
0.737 (1.00) |
| 6p gain | 111 (31%) | 246 |
0.393 (0.814) |
0.203 (0.698) |
0.501 (0.887) |
0.201 (0.698) |
0.555 (0.917) |
0.594 (0.93) |
0.328 (0.768) |
0.713 (1.00) |
0.581 (0.927) |
0.278 (0.731) |
0.748 (1.00) |
| 6q gain | 62 (17%) | 295 |
0.187 (0.695) |
0.747 (1.00) |
0.178 (0.691) |
0.216 (0.698) |
1 (1.00) |
0.136 (0.626) |
0.179 (0.691) |
1 (1.00) |
0.3 (0.75) |
0.354 (0.785) |
0.11 (0.585) |
| 7p gain | 107 (30%) | 250 |
0.617 (0.941) |
0.0209 (0.385) |
0.377 (0.795) |
0.76 (1.00) |
0.192 (0.695) |
1 (1.00) |
0.216 (0.698) |
0.708 (0.997) |
0.747 (1.00) |
0.221 (0.701) |
0.742 (1.00) |
| 7q gain | 107 (30%) | 250 |
0.48 (0.873) |
0.00962 (0.31) |
0.376 (0.795) |
0.489 (0.873) |
0.197 (0.695) |
1 (1.00) |
0.804 (1.00) |
0.709 (0.997) |
0.939 (1.00) |
0.0879 (0.554) |
0.325 (0.768) |
| 8p gain | 75 (21%) | 282 |
0.719 (1.00) |
0.0935 (0.557) |
0.971 (1.00) |
0.817 (1.00) |
1 (1.00) |
1 (1.00) |
0.0359 (0.42) |
0.359 (0.785) |
0.248 (0.721) |
0.15 (0.656) |
0.705 (0.996) |
| 9p gain | 18 (5%) | 339 |
0.733 (1.00) |
0.238 (0.717) |
0.0669 (0.554) |
0.11 (0.585) |
1 (1.00) |
0.21 (0.698) |
0.297 (0.75) |
0.0696 (0.554) |
0.171 (0.679) |
0.435 (0.847) |
0.416 (0.826) |
| 9q gain | 20 (6%) | 337 |
0.657 (0.959) |
0.168 (0.677) |
0.13 (0.619) |
0.113 (0.586) |
1 (1.00) |
0.222 (0.701) |
0.0266 (0.394) |
0.408 (0.822) |
0.18 (0.692) |
0.871 (1.00) |
0.474 (0.873) |
| 10q gain | 36 (10%) | 321 |
0.38 (0.799) |
0.0783 (0.554) |
0.0707 (0.554) |
0.0569 (0.527) |
1 (1.00) |
0.0609 (0.544) |
0.347 (0.783) |
0.619 (0.941) |
0.828 (1.00) |
0.96 (1.00) |
0.315 (0.76) |
| 11p gain | 17 (5%) | 340 |
0.523 (0.892) |
0.813 (1.00) |
0.392 (0.814) |
0.251 (0.721) |
1 (1.00) |
0.197 (0.695) |
0.426 (0.84) |
1 (1.00) |
0.0135 (0.331) |
0.922 (1.00) |
1 (1.00) |
| 11q gain | 18 (5%) | 339 |
0.402 (0.819) |
0.64 (0.95) |
0.237 (0.717) |
0.086 (0.554) |
1 (1.00) |
0.222 (0.701) |
0.297 (0.75) |
1 (1.00) |
0.0162 (0.358) |
0.789 (1.00) |
1 (1.00) |
| 12q gain | 44 (12%) | 313 |
0.765 (1.00) |
0.479 (0.873) |
0.0361 (0.42) |
0.0349 (0.42) |
0.345 (0.781) |
1 (1.00) |
0.169 (0.677) |
0.0566 (0.527) |
0.402 (0.819) |
1 (1.00) |
1 (1.00) |
| 13q gain | 22 (6%) | 335 |
0.173 (0.682) |
0.994 (1.00) |
0.12 (0.596) |
0.616 (0.941) |
0.21 (0.698) |
0.247 (0.721) |
0.161 (0.664) |
1 (1.00) |
0.514 (0.89) |
0.494 (0.879) |
0.492 (0.877) |
| 14q gain | 23 (6%) | 334 |
0.483 (0.873) |
0.468 (0.872) |
0.506 (0.89) |
0.543 (0.909) |
1 (1.00) |
0.197 (0.695) |
0.247 (0.721) |
0.106 (0.585) |
0.109 (0.585) |
0.193 (0.695) |
0.509 (0.89) |
| 15q gain | 33 (9%) | 324 |
0.28 (0.731) |
0.993 (1.00) |
0.457 (0.865) |
0.357 (0.785) |
1 (1.00) |
1 (1.00) |
0.696 (0.993) |
0.192 (0.695) |
1 (1.00) |
0.605 (0.938) |
0.277 (0.731) |
| 16p gain | 28 (8%) | 329 |
0.648 (0.954) |
0.162 (0.664) |
0.377 (0.795) |
0.314 (0.76) |
1 (1.00) |
1 (1.00) |
1 (1.00) |
0.0782 (0.554) |
0.489 (0.873) |
0.339 (0.777) |
1 (1.00) |
| 16q gain | 14 (4%) | 343 |
0.926 (1.00) |
0.0575 (0.527) |
0.201 (0.698) |
0.115 (0.586) |
1 (1.00) |
1 (1.00) |
1 (1.00) |
0.0203 (0.385) |
0.305 (0.753) |
0.28 (0.731) |
0.331 (0.772) |
| 17p gain | 30 (8%) | 327 |
0.484 (0.873) |
0.56 (0.921) |
0.213 (0.698) |
0.163 (0.665) |
1 (1.00) |
1 (1.00) |
1 (1.00) |
0.552 (0.917) |
0.0845 (0.554) |
0.293 (0.75) |
0.609 (0.938) |
| 17q gain | 92 (26%) | 265 |
0.845 (1.00) |
0.519 (0.892) |
0.433 (0.846) |
0.189 (0.695) |
1 (1.00) |
0.261 (0.731) |
0.12 (0.596) |
0.825 (1.00) |
0.0427 (0.464) |
0.129 (0.619) |
1 (1.00) |
| 18p gain | 35 (10%) | 322 |
0.859 (1.00) |
0.415 (0.826) |
0.118 (0.593) |
0.162 (0.664) |
1 (1.00) |
0.341 (0.779) |
0.848 (1.00) |
1 (1.00) |
0.0878 (0.554) |
0.0783 (0.554) |
1 (1.00) |
| 18q gain | 27 (8%) | 330 |
0.822 (1.00) |
0.151 (0.656) |
0.0602 (0.543) |
0.162 (0.664) |
1 (1.00) |
0.272 (0.731) |
0.668 (0.966) |
1 (1.00) |
0.031 (0.394) |
0.199 (0.697) |
0.603 (0.937) |
| 19p gain | 53 (15%) | 304 |
0.784 (1.00) |
0.509 (0.89) |
0.0756 (0.554) |
0.877 (1.00) |
0.397 (0.815) |
0.0125 (0.331) |
0.0251 (0.394) |
0.478 (0.873) |
0.139 (0.628) |
0.293 (0.75) |
0.219 (0.7) |
| 19q gain | 68 (19%) | 289 |
0.843 (1.00) |
0.301 (0.75) |
0.179 (0.691) |
0.84 (1.00) |
0.463 (0.868) |
0.0237 (0.394) |
0.196 (0.695) |
0.752 (1.00) |
0.187 (0.695) |
0.658 (0.959) |
0.237 (0.717) |
| 20p gain | 105 (29%) | 252 |
0.00689 (0.286) |
0.0354 (0.42) |
0.0784 (0.554) |
0.109 (0.585) |
1 (1.00) |
0.0903 (0.557) |
0.17 (0.678) |
1 (1.00) |
0.346 (0.781) |
0.793 (1.00) |
1 (1.00) |
| 20q gain | 109 (31%) | 248 |
0.0555 (0.527) |
0.0497 (0.515) |
0.16 (0.664) |
0.0916 (0.557) |
1 (1.00) |
0.596 (0.93) |
0.39 (0.813) |
1 (1.00) |
0.376 (0.795) |
0.886 (1.00) |
0.516 (0.89) |
| 21q gain | 26 (7%) | 331 |
0.916 (1.00) |
0.651 (0.957) |
0.0181 (0.378) |
0.0112 (0.331) |
1 (1.00) |
1 (1.00) |
0.827 (1.00) |
0.5 (0.887) |
0.0114 (0.331) |
0.308 (0.753) |
0.574 (0.927) |
| xp gain | 39 (11%) | 318 |
0.704 (0.996) |
0.228 (0.704) |
0.983 (1.00) |
0.927 (1.00) |
1 (1.00) |
1 (1.00) |
1 (1.00) |
1 (1.00) |
0.464 (0.868) |
0.185 (0.695) |
1 (1.00) |
| xq gain | 61 (17%) | 296 |
0.259 (0.731) |
0.473 (0.873) |
0.994 (1.00) |
1 (1.00) |
1 (1.00) |
1 (1.00) |
0.131 (0.619) |
0.733 (1.00) |
0.761 (1.00) |
0.227 (0.703) |
0.698 (0.993) |
| 1p loss | 81 (23%) | 276 |
0.932 (1.00) |
0.325 (0.768) |
0.522 (0.892) |
0.355 (0.785) |
0.545 (0.909) |
0.056 (0.527) |
0.277 (0.731) |
0.295 (0.75) |
0.282 (0.734) |
0.807 (1.00) |
0.719 (1.00) |
| 1q loss | 22 (6%) | 335 |
0.122 (0.604) |
0.518 (0.891) |
0.484 (0.873) |
0.338 (0.777) |
0.169 (0.677) |
1 (1.00) |
0.64 (0.95) |
0.438 (0.851) |
0.253 (0.721) |
0.655 (0.959) |
1 (1.00) |
| 2p loss | 31 (9%) | 326 |
0.546 (0.909) |
0.782 (1.00) |
0.726 (1.00) |
0.638 (0.95) |
1 (1.00) |
1 (1.00) |
0.315 (0.76) |
0.565 (0.925) |
0.22 (0.7) |
0.752 (1.00) |
0.609 (0.938) |
| 2q loss | 36 (10%) | 321 |
0.808 (1.00) |
0.245 (0.721) |
0.954 (1.00) |
0.959 (1.00) |
1 (1.00) |
1 (1.00) |
0.707 (0.997) |
0.62 (0.941) |
0.0774 (0.554) |
0.749 (1.00) |
1 (1.00) |
| 3q loss | 38 (11%) | 319 |
0.26 (0.731) |
0.143 (0.635) |
0.115 (0.586) |
0.0527 (0.527) |
0.289 (0.748) |
1 (1.00) |
0.466 (0.869) |
0.0653 (0.554) |
0.586 (0.927) |
0.928 (1.00) |
1 (1.00) |
| 4p loss | 102 (29%) | 255 |
0.545 (0.909) |
0.0578 (0.527) |
0.0228 (0.394) |
0.0886 (0.554) |
0.188 (0.695) |
0.0844 (0.554) |
0.131 (0.619) |
1 (1.00) |
0.453 (0.865) |
0.0309 (0.394) |
0.309 (0.753) |
| 5p loss | 27 (8%) | 330 |
0.873 (1.00) |
0.0403 (0.449) |
0.359 (0.785) |
0.191 (0.695) |
0.25 (0.721) |
1 (1.00) |
0.389 (0.813) |
0.0275 (0.394) |
1 (1.00) |
0.205 (0.698) |
1 (1.00) |
| 5q loss | 38 (11%) | 319 |
0.353 (0.785) |
0.0495 (0.515) |
0.188 (0.695) |
0.0127 (0.331) |
0.299 (0.75) |
1 (1.00) |
1 (1.00) |
0.0139 (0.331) |
0.764 (1.00) |
0.527 (0.895) |
0.619 (0.941) |
| 6p loss | 27 (8%) | 330 |
0.885 (1.00) |
0.614 (0.941) |
0.183 (0.695) |
0.322 (0.768) |
0.231 (0.71) |
0.295 (0.75) |
0.0294 (0.394) |
1 (1.00) |
1 (1.00) |
0.184 (0.695) |
0.574 (0.927) |
| 6q loss | 90 (25%) | 267 |
0.598 (0.93) |
0.0186 (0.378) |
0.286 (0.74) |
0.658 (0.959) |
0.169 (0.677) |
0.307 (0.753) |
0.018 (0.378) |
0.412 (0.826) |
1 (1.00) |
0.648 (0.954) |
0.737 (1.00) |
| 7p loss | 15 (4%) | 342 |
0.511 (0.89) |
0.444 (0.857) |
0.944 (1.00) |
0.815 (1.00) |
1 (1.00) |
1 (1.00) |
0.256 (0.726) |
1 (1.00) |
0.8 (1.00) |
0.598 (0.93) |
1 (1.00) |
| 8p loss | 185 (52%) | 172 |
0.667 (0.966) |
0.138 (0.627) |
0.215 (0.698) |
0.504 (0.89) |
0.118 (0.593) |
1 (1.00) |
1 (1.00) |
0.0258 (0.394) |
0.744 (1.00) |
0.0955 (0.56) |
0.546 (0.909) |
| 8q loss | 42 (12%) | 315 |
0.833 (1.00) |
0.929 (1.00) |
0.44 (0.853) |
0.637 (0.95) |
0.28 (0.731) |
0.405 (0.822) |
0.0523 (0.527) |
0.68 (0.981) |
0.433 (0.846) |
0.642 (0.95) |
1 (1.00) |
| 9p loss | 115 (32%) | 242 |
0.372 (0.795) |
0.0268 (0.394) |
0.279 (0.731) |
0.813 (1.00) |
0.248 (0.721) |
0.106 (0.585) |
0.088 (0.554) |
1 (1.00) |
0.446 (0.857) |
0.234 (0.715) |
0.351 (0.785) |
| 9q loss | 105 (29%) | 252 |
0.202 (0.698) |
0.782 (1.00) |
0.08 (0.554) |
0.582 (0.927) |
0.0208 (0.385) |
0.0681 (0.554) |
0.213 (0.698) |
1 (1.00) |
0.218 (0.698) |
0.768 (1.00) |
0.514 (0.89) |
| 10p loss | 44 (12%) | 313 |
0.232 (0.712) |
0.172 (0.679) |
0.16 (0.664) |
0.316 (0.76) |
0.28 (0.731) |
1 (1.00) |
0.863 (1.00) |
0.057 (0.527) |
0.514 (0.89) |
0.205 (0.698) |
1 (1.00) |
| 11p loss | 61 (17%) | 296 |
0.821 (1.00) |
0.688 (0.989) |
0.00883 (0.295) |
0.0132 (0.331) |
0.0763 (0.554) |
0.546 (0.909) |
0.764 (1.00) |
0.0692 (0.554) |
0.688 (0.989) |
0.825 (1.00) |
0.0938 (0.557) |
| 11q loss | 70 (20%) | 287 |
0.876 (1.00) |
0.445 (0.857) |
0.0358 (0.42) |
0.0891 (0.554) |
0.113 (0.586) |
1 (1.00) |
1 (1.00) |
0.101 (0.578) |
0.482 (0.873) |
0.938 (1.00) |
0.0422 (0.464) |
| 12p loss | 60 (17%) | 297 |
0.664 (0.964) |
0.478 (0.873) |
0.0202 (0.385) |
0.514 (0.89) |
0.073 (0.554) |
0.152 (0.657) |
0.648 (0.954) |
1 (1.00) |
0.21 (0.698) |
0.515 (0.89) |
0.403 (0.819) |
| 14q loss | 104 (29%) | 253 |
0.41 (0.826) |
0.113 (0.586) |
0.0454 (0.482) |
0.00697 (0.286) |
1 (1.00) |
0.596 (0.93) |
0.26 (0.731) |
0.357 (0.785) |
0.754 (1.00) |
0.0853 (0.554) |
0.521 (0.892) |
| 15q loss | 63 (18%) | 294 |
0.0189 (0.378) |
0.874 (1.00) |
0.0271 (0.394) |
0.00843 (0.295) |
0.0831 (0.554) |
0.585 (0.927) |
1 (1.00) |
0.567 (0.927) |
0.853 (1.00) |
0.217 (0.698) |
0.418 (0.826) |
| 17q loss | 37 (10%) | 320 |
0.0224 (0.394) |
0.136 (0.626) |
0.00766 (0.295) |
0.142 (0.635) |
0.0246 (0.394) |
0.374 (0.795) |
0.262 (0.731) |
0.0124 (0.331) |
1 (1.00) |
0.128 (0.619) |
0.303 (0.75) |
| 18p loss | 70 (20%) | 287 |
0.967 (1.00) |
0.584 (0.927) |
0.772 (1.00) |
0.769 (1.00) |
0.502 (0.887) |
1 (1.00) |
0.316 (0.76) |
0.00879 (0.295) |
0.721 (1.00) |
0.798 (1.00) |
0.459 (0.865) |
| 18q loss | 73 (20%) | 284 |
0.732 (1.00) |
0.855 (1.00) |
0.713 (1.00) |
1 (1.00) |
0.524 (0.892) |
0.223 (0.701) |
0.481 (0.873) |
0.0403 (0.449) |
0.477 (0.873) |
0.98 (1.00) |
0.243 (0.721) |
| 19p loss | 53 (15%) | 304 |
0.331 (0.772) |
0.0242 (0.394) |
0.546 (0.909) |
0.4 (0.819) |
0.397 (0.815) |
1 (1.00) |
0.15 (0.656) |
0.48 (0.873) |
0.355 (0.785) |
0.089 (0.554) |
0.384 (0.804) |
| 19q loss | 38 (11%) | 319 |
0.924 (1.00) |
0.0299 (0.394) |
0.253 (0.721) |
0.395 (0.814) |
0.308 (0.753) |
1 (1.00) |
0.196 (0.695) |
0.638 (0.95) |
0.276 (0.731) |
0.0738 (0.554) |
0.341 (0.779) |
| 20p loss | 24 (7%) | 333 |
0.766 (1.00) |
0.144 (0.635) |
0.191 (0.695) |
0.455 (0.865) |
1 (1.00) |
0.272 (0.731) |
0.824 (1.00) |
0.0578 (0.527) |
0.572 (0.927) |
0.7 (0.993) |
0.543 (0.909) |
| 20q loss | 12 (3%) | 345 |
0.486 (0.873) |
0.414 (0.826) |
0.272 (0.731) |
0.7 (0.993) |
1 (1.00) |
1 (1.00) |
0.53 (0.896) |
0.0839 (0.554) |
0.243 (0.721) |
0.451 (0.864) |
0.307 (0.753) |
| 21q loss | 106 (30%) | 251 |
0.0163 (0.358) |
0.323 (0.768) |
0.367 (0.788) |
0.877 (1.00) |
0.217 (0.698) |
0.0996 (0.576) |
0.107 (0.585) |
0.113 (0.586) |
0.555 (0.917) |
0.717 (1.00) |
0.736 (1.00) |
| 22q loss | 66 (18%) | 291 |
0.646 (0.954) |
0.267 (0.731) |
0.135 (0.626) |
0.0349 (0.42) |
1 (1.00) |
0.579 (0.927) |
0.381 (0.799) |
0.0303 (0.394) |
0.0124 (0.331) |
0.00841 (0.295) |
0.0306 (0.394) |
| xq loss | 68 (19%) | 289 |
0.458 (0.865) |
0.0635 (0.553) |
0.846 (1.00) |
0.47 (0.873) |
0.463 (0.868) |
0.583 (0.927) |
0.0302 (0.394) |
0.161 (0.664) |
0.624 (0.944) |
0.178 (0.691) |
1 (1.00) |
P value = 8.98e-05 (Fisher's exact test), Q value = 0.036
Table S1. Gene #3: '2p gain' versus Clinical Feature #7: 'GENDER'
| nPatients | FEMALE | MALE |
|---|---|---|
| ALL | 113 | 244 |
| 2P GAIN MUTATED | 26 | 18 |
| 2P GAIN WILD-TYPE | 87 | 226 |
Figure S1. Get High-res Image Gene #3: '2p gain' versus Clinical Feature #7: 'GENDER'
P value = 0.000449 (Fisher's exact test), Q value = 0.081
Table S2. Gene #4: '2q gain' versus Clinical Feature #7: 'GENDER'
| nPatients | FEMALE | MALE |
|---|---|---|
| ALL | 113 | 244 |
| 2Q GAIN MUTATED | 23 | 17 |
| 2Q GAIN WILD-TYPE | 90 | 227 |
Figure S2. Get High-res Image Gene #4: '2q gain' versus Clinical Feature #7: 'GENDER'

P value = 0.000969 (Fisher's exact test), Q value = 0.12
Table S3. Gene #16: '8q gain' versus Clinical Feature #7: 'GENDER'
| nPatients | FEMALE | MALE |
|---|---|---|
| ALL | 113 | 244 |
| 8Q GAIN MUTATED | 43 | 139 |
| 8Q GAIN WILD-TYPE | 70 | 105 |
Figure S3. Get High-res Image Gene #16: '8q gain' versus Clinical Feature #7: 'GENDER'

P value = 0.00497 (Wilcoxon-test), Q value = 0.23
Table S4. Gene #19: '10p gain' versus Clinical Feature #2: 'YEARS_TO_BIRTH'
| nPatients | Mean (Std.Dev) | |
|---|---|---|
| ALL | 354 | 59.8 (12.7) |
| 10P GAIN MUTATED | 60 | 55.9 (12.1) |
| 10P GAIN WILD-TYPE | 294 | 60.5 (12.7) |
Figure S4. Get High-res Image Gene #19: '10p gain' versus Clinical Feature #2: 'YEARS_TO_BIRTH'

P value = 0.00521 (Fisher's exact test), Q value = 0.23
Table S5. Gene #23: '12p gain' versus Clinical Feature #8: 'HISTOLOGICAL_TYPE'
| nPatients | FIBROLAMELLAR CARCINOMA | HEPATOCELLULAR CARCINOMA | HEPATOCHOLANGIOCARCINOMA (MIXED) |
|---|---|---|---|
| ALL | 2 | 348 | 7 |
| 12P GAIN MUTATED | 0 | 35 | 4 |
| 12P GAIN WILD-TYPE | 2 | 313 | 3 |
Figure S5. Get High-res Image Gene #23: '12p gain' versus Clinical Feature #8: 'HISTOLOGICAL_TYPE'
P value = 0.00333 (Fisher's exact test), Q value = 0.21
Table S6. Gene #39: '22q gain' versus Clinical Feature #4: 'PATHOLOGY_T_STAGE'
| nPatients | T0+T1 | T2 | T3 | T4 |
|---|---|---|---|---|
| ALL | 179 | 91 | 73 | 12 |
| 22Q GAIN MUTATED | 13 | 17 | 16 | 2 |
| 22Q GAIN WILD-TYPE | 166 | 74 | 57 | 10 |
Figure S6. Get High-res Image Gene #39: '22q gain' versus Clinical Feature #4: 'PATHOLOGY_T_STAGE'
P value = 0.00277 (Fisher's exact test), Q value = 0.21
Table S7. Gene #46: '3p loss' versus Clinical Feature #4: 'PATHOLOGY_T_STAGE'
| nPatients | T0+T1 | T2 | T3 | T4 |
|---|---|---|---|---|
| ALL | 179 | 91 | 73 | 12 |
| 3P LOSS MUTATED | 14 | 16 | 17 | 3 |
| 3P LOSS WILD-TYPE | 165 | 75 | 56 | 9 |
Figure S7. Get High-res Image Gene #46: '3p loss' versus Clinical Feature #4: 'PATHOLOGY_T_STAGE'

P value = 0.00353 (Fisher's exact test), Q value = 0.21
Table S8. Gene #46: '3p loss' versus Clinical Feature #8: 'HISTOLOGICAL_TYPE'
| nPatients | FIBROLAMELLAR CARCINOMA | HEPATOCELLULAR CARCINOMA | HEPATOCHOLANGIOCARCINOMA (MIXED) |
|---|---|---|---|
| ALL | 2 | 348 | 7 |
| 3P LOSS MUTATED | 1 | 45 | 4 |
| 3P LOSS WILD-TYPE | 1 | 303 | 3 |
Figure S8. Get High-res Image Gene #46: '3p loss' versus Clinical Feature #8: 'HISTOLOGICAL_TYPE'

P value = 0.00336 (Wilcoxon-test), Q value = 0.21
Table S9. Gene #49: '4q loss' versus Clinical Feature #2: 'YEARS_TO_BIRTH'
| nPatients | Mean (Std.Dev) | |
|---|---|---|
| ALL | 354 | 59.8 (12.7) |
| 4Q LOSS MUTATED | 140 | 57.4 (13.4) |
| 4Q LOSS WILD-TYPE | 214 | 61.3 (12.0) |
Figure S9. Get High-res Image Gene #49: '4q loss' versus Clinical Feature #2: 'YEARS_TO_BIRTH'
P value = 0.00091 (Fisher's exact test), Q value = 0.12
Table S10. Gene #49: '4q loss' versus Clinical Feature #10: 'RACE'
| nPatients | AMERICAN INDIAN OR ALASKA NATIVE | ASIAN | BLACK OR AFRICAN AMERICAN | WHITE |
|---|---|---|---|---|
| ALL | 1 | 156 | 17 | 173 |
| 4Q LOSS MUTATED | 0 | 79 | 9 | 54 |
| 4Q LOSS WILD-TYPE | 1 | 77 | 8 | 119 |
Figure S10. Get High-res Image Gene #49: '4q loss' versus Clinical Feature #10: 'RACE'

P value = 0.00427 (logrank test), Q value = 0.21
Table S11. Gene #55: '7q loss' versus Clinical Feature #1: 'Time to Death'
| nPatients | nDeath | Duration Range (Median), Month | |
|---|---|---|---|
| ALL | 334 | 109 | 0.0 - 120.8 (19.3) |
| 7Q LOSS MUTATED | 17 | 10 | 0.2 - 76.4 (13.7) |
| 7Q LOSS WILD-TYPE | 317 | 99 | 0.0 - 120.8 (19.5) |
Figure S11. Get High-res Image Gene #55: '7q loss' versus Clinical Feature #1: 'Time to Death'

P value = 0.00026 (Fisher's exact test), Q value = 0.059
Table S12. Gene #61: '10q loss' versus Clinical Feature #10: 'RACE'
| nPatients | AMERICAN INDIAN OR ALASKA NATIVE | ASIAN | BLACK OR AFRICAN AMERICAN | WHITE |
|---|---|---|---|---|
| ALL | 1 | 156 | 17 | 173 |
| 10Q LOSS MUTATED | 0 | 38 | 10 | 26 |
| 10Q LOSS WILD-TYPE | 1 | 118 | 7 | 147 |
Figure S12. Get High-res Image Gene #61: '10q loss' versus Clinical Feature #10: 'RACE'

P value = 0.00425 (Fisher's exact test), Q value = 0.21
Table S13. Gene #65: '12q loss' versus Clinical Feature #3: 'NEOPLASM_DISEASESTAGE'
| nPatients | STAGE I | STAGE II | STAGE III | STAGE IIIA | STAGE IIIB | STAGE IIIC | STAGE IV | STAGE IVA | STAGE IVB |
|---|---|---|---|---|---|---|---|---|---|
| ALL | 168 | 84 | 3 | 59 | 8 | 7 | 3 | 1 | 2 |
| 12Q LOSS MUTATED | 12 | 9 | 1 | 5 | 2 | 0 | 3 | 0 | 0 |
| 12Q LOSS WILD-TYPE | 156 | 75 | 2 | 54 | 6 | 7 | 0 | 1 | 2 |
Figure S13. Get High-res Image Gene #65: '12q loss' versus Clinical Feature #3: 'NEOPLASM_DISEASESTAGE'

P value = 0.00129 (Fisher's exact test), Q value = 0.15
Table S14. Gene #66: '13q loss' versus Clinical Feature #4: 'PATHOLOGY_T_STAGE'
| nPatients | T0+T1 | T2 | T3 | T4 |
|---|---|---|---|---|
| ALL | 179 | 91 | 73 | 12 |
| 13Q LOSS MUTATED | 47 | 37 | 22 | 9 |
| 13Q LOSS WILD-TYPE | 132 | 54 | 51 | 3 |
Figure S14. Get High-res Image Gene #66: '13q loss' versus Clinical Feature #4: 'PATHOLOGY_T_STAGE'

P value = 0.00212 (Wilcoxon-test), Q value = 0.19
Table S15. Gene #69: '16p loss' versus Clinical Feature #2: 'YEARS_TO_BIRTH'
| nPatients | Mean (Std.Dev) | |
|---|---|---|
| ALL | 354 | 59.8 (12.7) |
| 16P LOSS MUTATED | 107 | 56.9 (12.8) |
| 16P LOSS WILD-TYPE | 247 | 61.0 (12.5) |
Figure S15. Get High-res Image Gene #69: '16p loss' versus Clinical Feature #2: 'YEARS_TO_BIRTH'

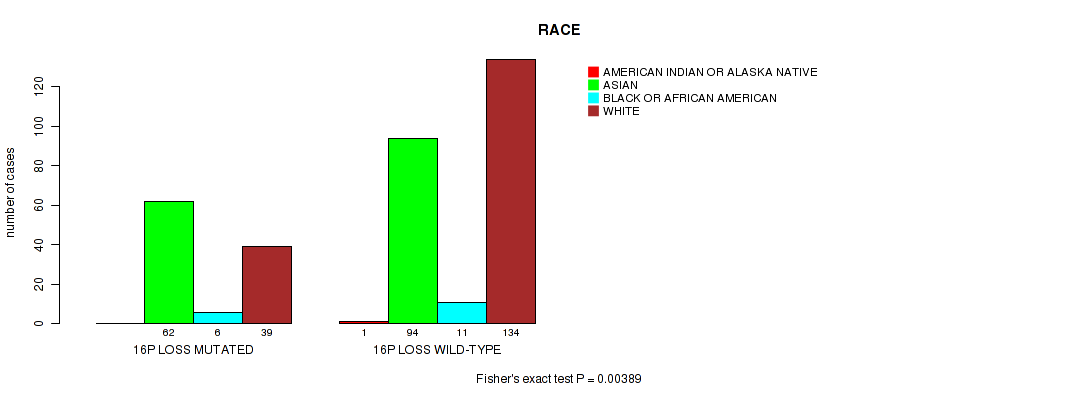
P value = 0.00389 (Fisher's exact test), Q value = 0.21
Table S16. Gene #69: '16p loss' versus Clinical Feature #10: 'RACE'
| nPatients | AMERICAN INDIAN OR ALASKA NATIVE | ASIAN | BLACK OR AFRICAN AMERICAN | WHITE |
|---|---|---|---|---|
| ALL | 1 | 156 | 17 | 173 |
| 16P LOSS MUTATED | 0 | 62 | 6 | 39 |
| 16P LOSS WILD-TYPE | 1 | 94 | 11 | 134 |
Figure S16. Get High-res Image Gene #69: '16p loss' versus Clinical Feature #10: 'RACE'
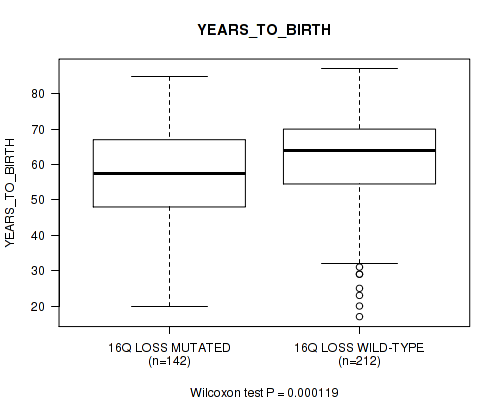
P value = 0.000119 (Wilcoxon-test), Q value = 0.036
Table S17. Gene #70: '16q loss' versus Clinical Feature #2: 'YEARS_TO_BIRTH'
| nPatients | Mean (Std.Dev) | |
|---|---|---|
| ALL | 354 | 59.8 (12.7) |
| 16Q LOSS MUTATED | 142 | 56.8 (12.9) |
| 16Q LOSS WILD-TYPE | 212 | 61.7 (12.2) |
Figure S17. Get High-res Image Gene #70: '16q loss' versus Clinical Feature #2: 'YEARS_TO_BIRTH'
P value = 1e-05 (Fisher's exact test), Q value = 0.009
Table S18. Gene #70: '16q loss' versus Clinical Feature #10: 'RACE'
| nPatients | AMERICAN INDIAN OR ALASKA NATIVE | ASIAN | BLACK OR AFRICAN AMERICAN | WHITE |
|---|---|---|---|---|
| ALL | 1 | 156 | 17 | 173 |
| 16Q LOSS MUTATED | 0 | 84 | 7 | 49 |
| 16Q LOSS WILD-TYPE | 1 | 72 | 10 | 124 |
Figure S18. Get High-res Image Gene #70: '16q loss' versus Clinical Feature #10: 'RACE'

P value = 0.00145 (Fisher's exact test), Q value = 0.15
Table S19. Gene #71: '17p loss' versus Clinical Feature #3: 'NEOPLASM_DISEASESTAGE'
| nPatients | STAGE I | STAGE II | STAGE III | STAGE IIIA | STAGE IIIB | STAGE IIIC | STAGE IV | STAGE IVA | STAGE IVB |
|---|---|---|---|---|---|---|---|---|---|
| ALL | 168 | 84 | 3 | 59 | 8 | 7 | 3 | 1 | 2 |
| 17P LOSS MUTATED | 67 | 48 | 2 | 33 | 3 | 7 | 3 | 1 | 1 |
| 17P LOSS WILD-TYPE | 101 | 36 | 1 | 26 | 5 | 0 | 0 | 0 | 1 |
Figure S19. Get High-res Image Gene #71: '17p loss' versus Clinical Feature #3: 'NEOPLASM_DISEASESTAGE'

P value = 0.00407 (Fisher's exact test), Q value = 0.21
Table S20. Gene #81: 'xp loss' versus Clinical Feature #7: 'GENDER'
| nPatients | FEMALE | MALE |
|---|---|---|
| ALL | 113 | 244 |
| XP LOSS MUTATED | 18 | 74 |
| XP LOSS WILD-TYPE | 95 | 170 |
Figure S20. Get High-res Image Gene #81: 'xp loss' versus Clinical Feature #7: 'GENDER'

-
Copy number data file = broad_values_by_arm.txt from GISTIC pipeline
-
Processed Copy number data file = /xchip/cga/gdac-prod/tcga-gdac/jobResults/GDAC_Correlate_Genomic_Events_Preprocess/LIHC-TP/15089886/transformed.cor.cli.txt
-
Clinical data file = /xchip/cga/gdac-prod/tcga-gdac/jobResults/Append_Data/LIHC-TP/15082975/LIHC-TP.merged_data.txt
-
Number of patients = 357
-
Number of significantly arm-level cnvs = 82
-
Number of selected clinical features = 11
-
Exclude regions that fewer than K tumors have mutations, K = 3
For survival clinical features, the Kaplan-Meier survival curves of tumors with and without gene mutations were plotted and the statistical significance P values were estimated by logrank test (Bland and Altman 2004) using the 'survdiff' function in R
For binary or multi-class clinical features (nominal or ordinal), two-tailed Fisher's exact tests (Fisher 1922) were used to estimate the P values using the 'fisher.test' function in R
For multiple hypothesis correction, Q value is the False Discovery Rate (FDR) analogue of the P value (Benjamini and Hochberg 1995), defined as the minimum FDR at which the test may be called significant. We used the 'Benjamini and Hochberg' method of 'p.adjust' function in R to convert P values into Q values.
In addition to the links below, the full results of the analysis summarized in this report can also be downloaded programmatically using firehose_get, or interactively from either the Broad GDAC website or TCGA Data Coordination Center Portal.