This report serves to describe the mutational landscape and properties of a given individual set, as well as rank genes and genesets according to mutational significance. MutSig 2CV v3.1 was used to generate the results found in this report.
-
Working with individual set: PAAD-TP
-
Number of patients in set: 146
The input for this pipeline is a set of individuals with the following files associated for each:
-
An annotated .maf file describing the mutations called for the respective individual, and their properties.
-
A .wig file that contains information about the coverage of the sample.
-
MAF used for this analysis:PAAD-TP.final_analysis_set.maf
-
Blacklist used for this analysis: pancan_mutation_blacklist.v14.hg19.txt
-
Significantly mutated genes (q ≤ 0.1): 155
The mutation spectrum is depicted in the lego plots below in which the 96 possible mutation types are subdivided into six large blocks, color-coded to reflect the base substitution type. Each large block is further subdivided into the 16 possible pairs of 5' and 3' neighbors, as listed in the 4x4 trinucleotide context legend. The height of each block corresponds to the mutation frequency for that kind of mutation (counts of mutations normalized by the base coverage in a given bin). The shape of the spectrum is a signature for dominant mutational mechanisms in different tumor types.
Figure 1. Get High-res Image SNV Mutation rate lego plot for entire set. Each bin is normalized by base coverage for that bin. Colors represent the six SNV types on the upper right. The three-base context for each mutation is labeled in the 4x4 legend on the lower right. The fractional breakdown of SNV counts is shown in the pie chart on the upper left. If this figure is blank, not enough information was provided in the MAF to generate it.
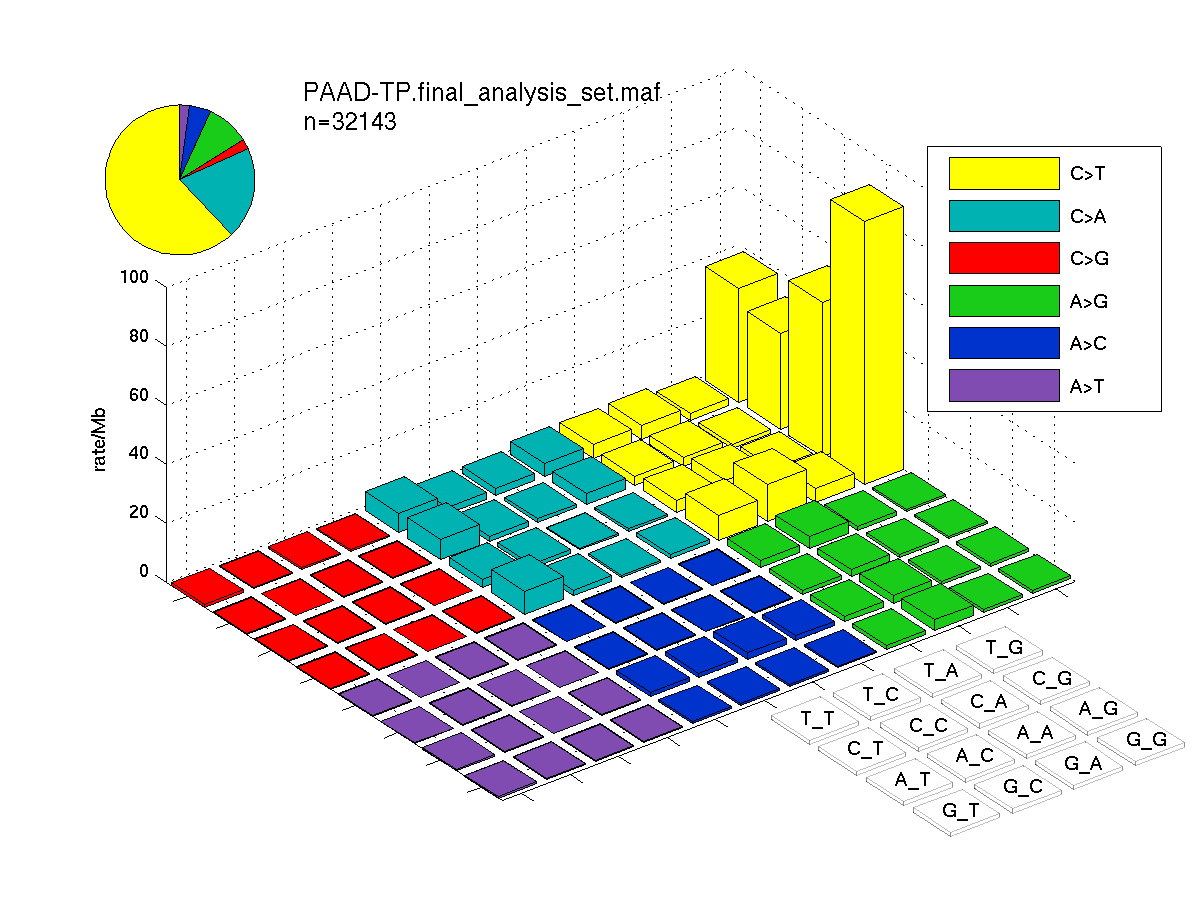
Figure 2. Get High-res Image SNV Mutation rate lego plots for 4 slices of mutation allele fraction (0<=AF<0.1, 0.1<=AF<0.25, 0.25<=AF<0.5, & 0.5<=AF) . The color code and three-base context legends are the same as the previous figure. If this figure is blank, not enough information was provided in the MAF to generate it.

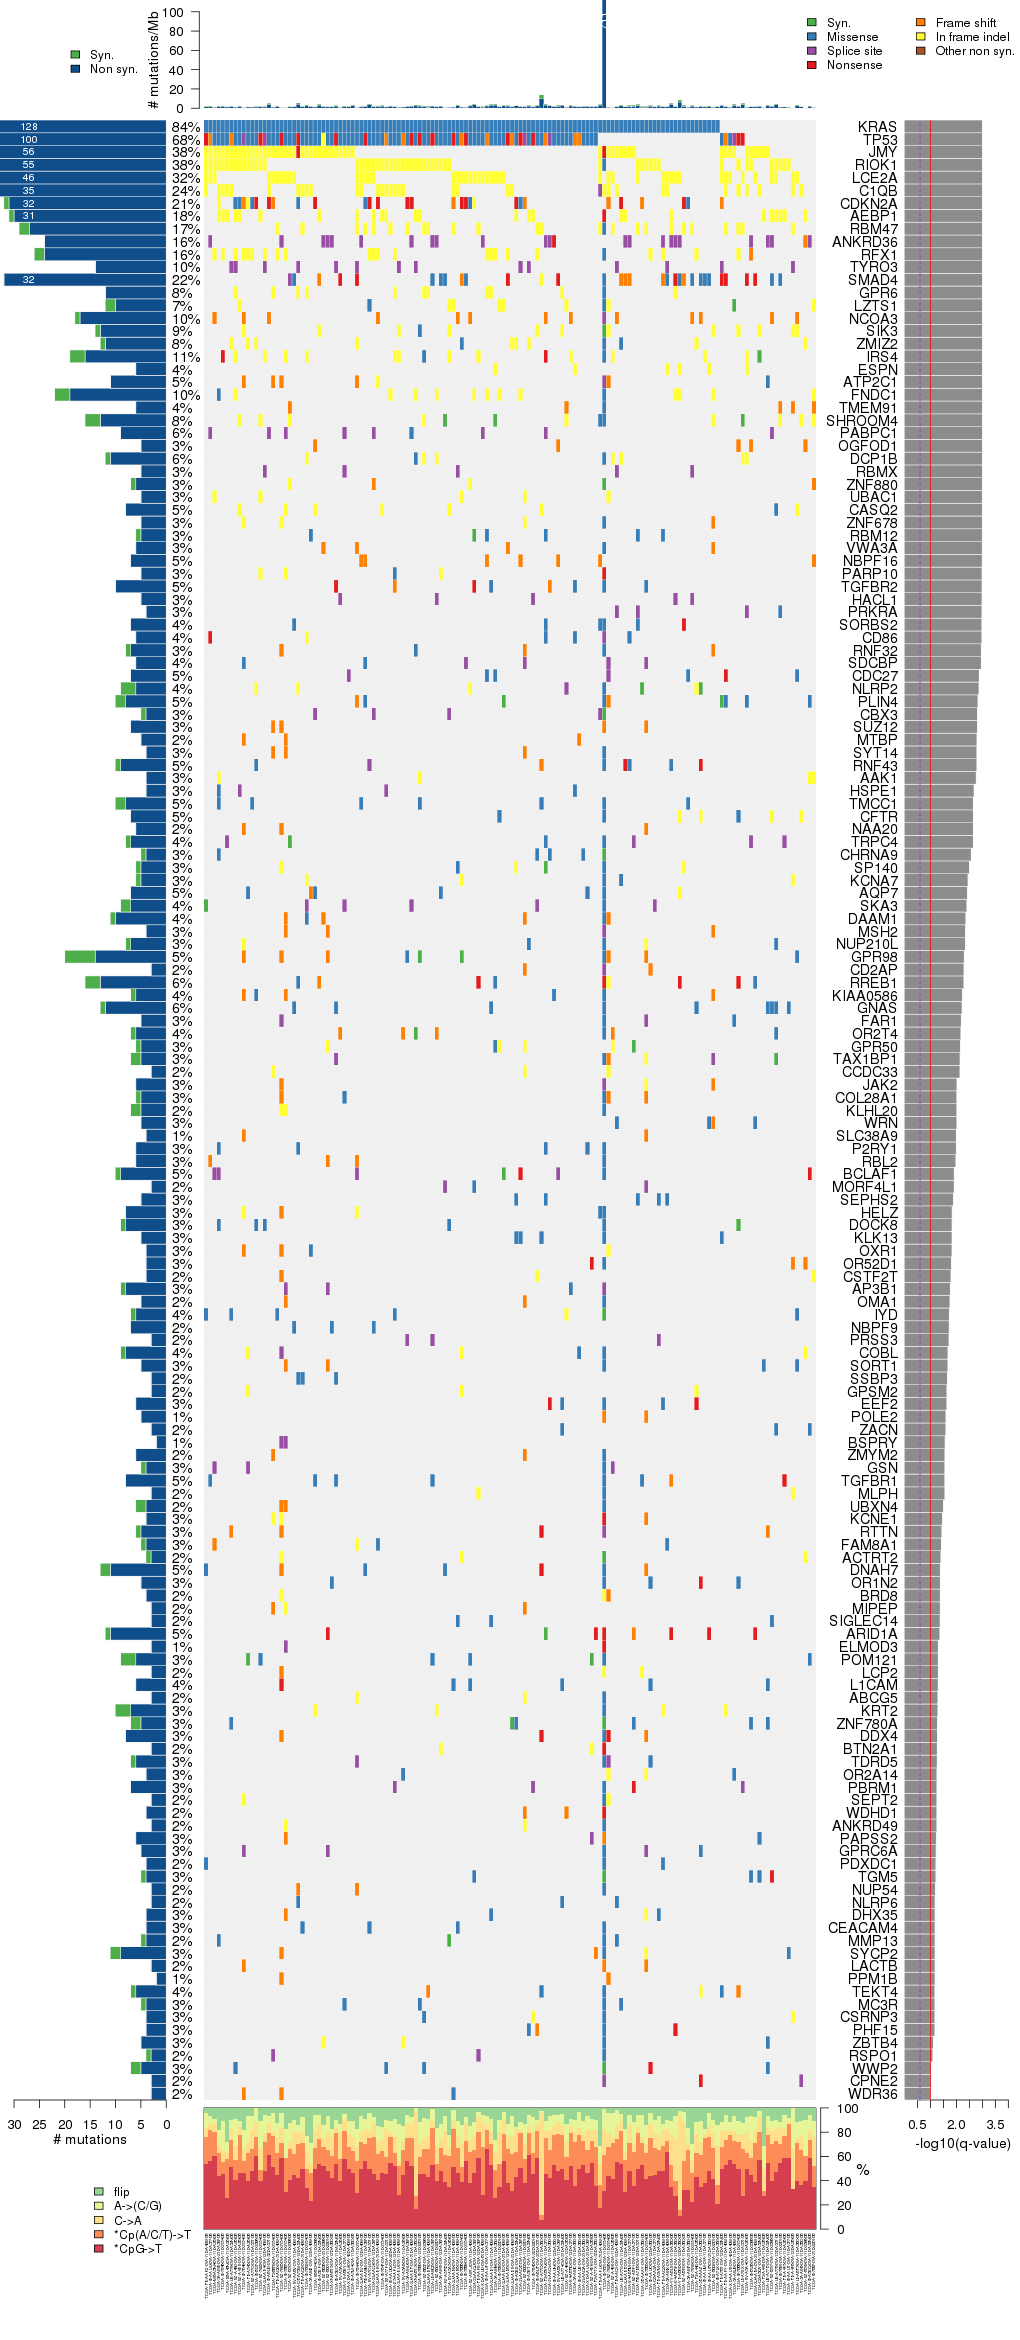
Figure 3. Get High-res Image The matrix in the center of the figure represents individual mutations in patient samples, color-coded by type of mutation, for the significantly mutated genes. The rate of synonymous and non-synonymous mutations is displayed at the top of the matrix. The barplot on the left of the matrix shows the number of mutations in each gene. The percentages represent the fraction of tumors with at least one mutation in the specified gene. The barplot to the right of the matrix displays the q-values for the most significantly mutated genes. The purple boxplots below the matrix (only displayed if required columns are present in the provided MAF) represent the distributions of allelic fractions observed in each sample. The plot at the bottom represents the base substitution distribution of individual samples, using the same categories that were used to calculate significance.
Column Descriptions:
-
nnon = number of (nonsilent) mutations in this gene across the individual set
-
npat = number of patients (individuals) with at least one nonsilent mutation
-
nsite = number of unique sites having a non-silent mutation
-
nsil = number of silent mutations in this gene across the individual set
-
p = p-value (overall)
-
q = q-value, False Discovery Rate (Benjamini-Hochberg procedure)
Table 1. Get Full Table A Ranked List of Significantly Mutated Genes. Number of significant genes found: 155. Number of genes displayed: 35. Click on a gene name to display its stick figure depicting the distribution of mutations and mutation types across the chosen gene (this feature may not be available for all significant genes).
| rank | gene | longname | codelen | nnei | nncd | nsil | nmis | nstp | nspl | nind | nnon | npat | nsite | pCV | pCL | pFN | p | q |
|---|---|---|---|---|---|---|---|---|---|---|---|---|---|---|---|---|---|---|
| 1 | KRAS | v-Ki-ras2 Kirsten rat sarcoma viral oncogene homolog | 709 | 10 | 0 | 1 | 127 | 0 | 0 | 0 | 127 | 123 | 5 | 1e-16 | 1e-05 | 1e-05 | 1e-16 | 1.5e-13 |
| 2 | TP53 | tumor protein p53 | 1890 | 122 | 0 | 0 | 67 | 16 | 5 | 12 | 100 | 100 | 72 | 1.2e-15 | 0.003 | 1e-05 | 1e-16 | 1.5e-13 |
| 3 | JMY | junction mediating and regulatory protein, p53 cofactor | 3007 | 2 | 0 | 0 | 0 | 2 | 0 | 54 | 56 | 55 | 3 | 1e-16 | 1e-05 | 0.97 | 1e-16 | 1.5e-13 |
| 4 | RIOK1 | RIO kinase 1 (yeast) | 1771 | 22 | 0 | 0 | 1 | 0 | 0 | 54 | 55 | 55 | 2 | 1e-16 | 1e-05 | 1 | 1e-16 | 1.5e-13 |
| 5 | LCE2A | late cornified envelope 2A | 325 | 155 | 0 | 0 | 0 | 0 | 0 | 46 | 46 | 46 | 1 | 1e-16 | 1e-05 | 1 | 1e-16 | 1.5e-13 |
| 6 | C1QB | complement component 1, q subcomponent, B chain | 770 | 74 | 0 | 0 | 0 | 0 | 1 | 34 | 35 | 35 | 2 | 1e-16 | 1e-05 | 1e-05 | 1e-16 | 1.5e-13 |
| 7 | CDKN2A | cyclin-dependent kinase inhibitor 2A (melanoma, p16, inhibits CDK4) | 1002 | 1 | 0 | 1 | 9 | 12 | 0 | 10 | 31 | 30 | 19 | 1e-16 | 0.00074 | 1e-05 | 1e-16 | 1.5e-13 |
| 8 | AEBP1 | AE binding protein 1 | 3557 | 25 | 0 | 1 | 2 | 2 | 0 | 26 | 30 | 26 | 5 | 1e-16 | 1e-05 | 1 | 1e-16 | 1.5e-13 |
| 9 | RBM47 | RNA binding motif protein 47 | 1798 | 8 | 0 | 2 | 2 | 0 | 0 | 25 | 27 | 25 | 3 | 1e-16 | 1e-05 | 0.97 | 1e-16 | 1.5e-13 |
| 10 | ANKRD36 | ankyrin repeat domain 36 | 6126 | 112 | 0 | 0 | 0 | 1 | 0 | 23 | 24 | 24 | 3 | 1e-16 | 1e-05 | 0.0042 | 1e-16 | 1.5e-13 |
| 11 | RFX1 | regulatory factor X, 1 (influences HLA class II expression) | 3020 | 61 | 0 | 2 | 1 | 0 | 0 | 23 | 24 | 24 | 3 | 1e-16 | 1e-05 | 1 | 1e-16 | 1.5e-13 |
| 12 | TYRO3 | TYRO3 protein tyrosine kinase | 2745 | 3 | 0 | 0 | 0 | 0 | 0 | 14 | 14 | 14 | 5 | 1e-16 | 1e-05 | 0.034 | 1e-16 | 1.5e-13 |
| 13 | SMAD4 | SMAD family member 4 | 1699 | 35 | 0 | 0 | 14 | 9 | 0 | 9 | 32 | 32 | 29 | 1.4e-16 | 0.0073 | 0.11 | 1.1e-16 | 1.6e-13 |
| 14 | GPR6 | G protein-coupled receptor 6 | 1091 | 93 | 0 | 0 | 1 | 0 | 0 | 11 | 12 | 12 | 3 | 3.8e-12 | 1e-05 | 0.88 | 1.4e-15 | 1.8e-12 |
| 15 | LZTS1 | leucine zipper, putative tumor suppressor 1 | 1799 | 2 | 0 | 2 | 2 | 0 | 0 | 8 | 10 | 10 | 3 | 3.7e-12 | 1e-05 | 0.94 | 1.4e-15 | 1.8e-12 |
| 16 | NCOA3 | nuclear receptor coactivator 3 | 4389 | 65 | 0 | 1 | 2 | 0 | 2 | 13 | 17 | 14 | 7 | 7e-12 | 1e-05 | 1 | 2.7e-15 | 3.1e-12 |
| 17 | SIK3 | SIK family kinase 3 | 3886 | 19 | 0 | 1 | 1 | 0 | 0 | 12 | 13 | 13 | 3 | 2.3e-10 | 1e-05 | 1 | 8.1e-14 | 8.8e-11 |
| 18 | ZMIZ2 | zinc finger, MIZ-type containing 2 | 2835 | 66 | 0 | 1 | 3 | 0 | 0 | 9 | 12 | 12 | 4 | 3.8e-10 | 1e-05 | 0.51 | 1.3e-13 | 1.3e-10 |
| 19 | IRS4 | insulin receptor substrate 4 | 3778 | 7 | 0 | 3 | 2 | 2 | 0 | 12 | 16 | 16 | 5 | 3.6e-09 | 1e-05 | 1 | 1.2e-12 | 1.1e-09 |
| 20 | ESPN | espin | 2613 | 0 | 0 | 0 | 0 | 0 | 0 | 6 | 6 | 6 | 1 | 2.5e-08 | 1e-05 | 0.84 | 7.4e-12 | 6.8e-09 |
| 21 | ATP2C1 | ATPase, Ca++ transporting, type 2C, member 1 | 3395 | 7 | 0 | 0 | 3 | 0 | 1 | 7 | 11 | 8 | 8 | 6.7e-08 | 1e-05 | 0.97 | 1.9e-11 | 1.7e-08 |
| 22 | FNDC1 | fibronectin type III domain containing 1 | 5773 | 21 | 0 | 3 | 6 | 0 | 0 | 13 | 19 | 14 | 7 | 1.3e-07 | 1e-05 | 0.98 | 3.6e-11 | 3e-08 |
| 23 | TMEM91 | transmembrane protein 91 | 699 | 21 | 0 | 0 | 1 | 0 | 0 | 5 | 6 | 6 | 2 | 1.5e-10 | NaN | NaN | 1.5e-10 | 1.2e-07 |
| 24 | SHROOM4 | shroom family member 4 | 4516 | 19 | 0 | 3 | 4 | 0 | 0 | 9 | 13 | 11 | 5 | 1.1e-06 | 1e-05 | 0.18 | 3e-10 | 2.3e-07 |
| 25 | PABPC1 | poly(A) binding protein, cytoplasmic 1 | 1966 | 23 | 0 | 0 | 1 | 0 | 0 | 8 | 9 | 9 | 4 | 1.6e-06 | 1e-05 | 0.8 | 4.1e-10 | 3e-07 |
| 26 | OGFOD1 | 2-oxoglutarate and iron-dependent oxygenase domain containing 1 | 1793 | 231 | 0 | 0 | 0 | 0 | 0 | 5 | 5 | 5 | 1 | 0.000011 | 1e-05 | 4e-05 | 2.6e-09 | 1.9e-06 |
| 27 | DCP1B | DCP1 decapping enzyme homolog B (S. cerevisiae) | 1888 | 61 | 0 | 1 | 4 | 0 | 0 | 7 | 11 | 9 | 5 | 3e-05 | 1e-05 | 1 | 6.8e-09 | 4.5e-06 |
| 28 | RBMX | RNA binding motif protein, X-linked | 1265 | 540 | 0 | 0 | 0 | 0 | 0 | 5 | 5 | 5 | 1 | 3e-05 | 1e-05 | 0.27 | 6.9e-09 | 4.5e-06 |
| 29 | ZNF880 | zinc finger protein 880 | 1748 | 15 | 0 | 1 | 0 | 0 | 0 | 6 | 6 | 4 | 2 | 0.000033 | 1e-05 | 0.0001 | 7.6e-09 | 4.8e-06 |
| 30 | UBAC1 | UBA domain containing 1 | 1254 | 78 | 0 | 0 | 0 | 0 | 0 | 5 | 5 | 5 | 1 | 0.000056 | 1e-05 | 0.99 | 1.2e-08 | 7.6e-06 |
| 31 | CASQ2 | calsequestrin 2 (cardiac muscle) | 1240 | 79 | 0 | 0 | 1 | 0 | 0 | 7 | 8 | 8 | 2 | 0.000062 | 1e-05 | 0.01 | 1.4e-08 | 8.1e-06 |
| 32 | ZNF678 | zinc finger protein 678 | 1755 | 6 | 0 | 0 | 1 | 0 | 0 | 4 | 5 | 5 | 3 | 3.3e-06 | 0.00015 | 0.92 | 1.6e-08 | 9.1e-06 |
| 33 | RBM12 | RNA binding motif protein 12 | 2803 | 102 | 0 | 1 | 5 | 0 | 0 | 0 | 5 | 5 | 1 | 0.000074 | 1e-05 | 0.082 | 1.6e-08 | 9.1e-06 |
| 34 | VWA3A | von Willebrand factor A domain containing 3A | 3689 | 15 | 0 | 0 | 2 | 0 | 0 | 4 | 6 | 5 | 3 | 0.000035 | 9e-05 | 0.082 | 2.3e-08 | 0.000012 |
| 35 | NBPF16 | neuroblastoma breakpoint family, member 16 | 4146 | 54 | 0 | 0 | 0 | 0 | 0 | 7 | 7 | 7 | 1 | 0.00017 | 1e-05 | 0.15 | 3.6e-08 | 0.000019 |
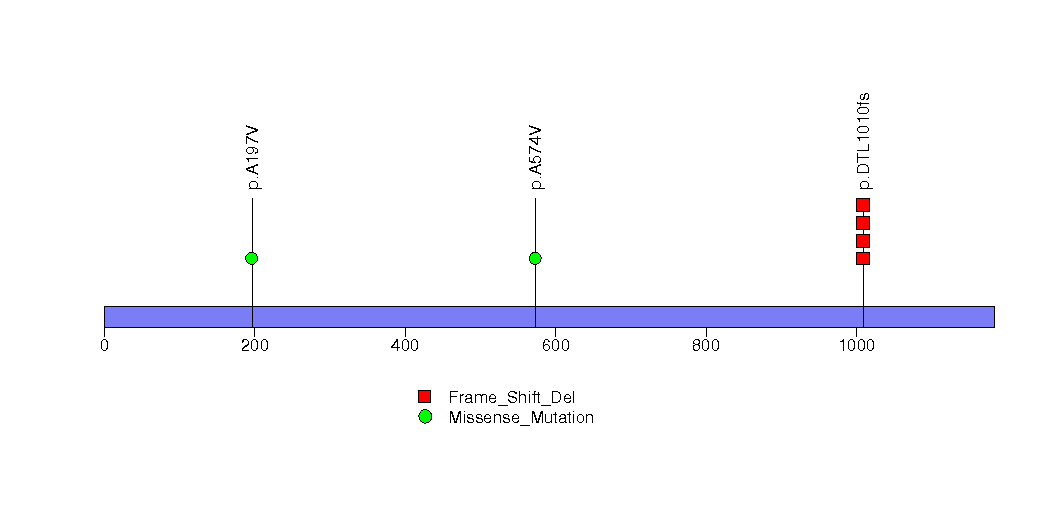
Figure S1. This figure depicts the distribution of mutations and mutation types across the KRAS significant gene.
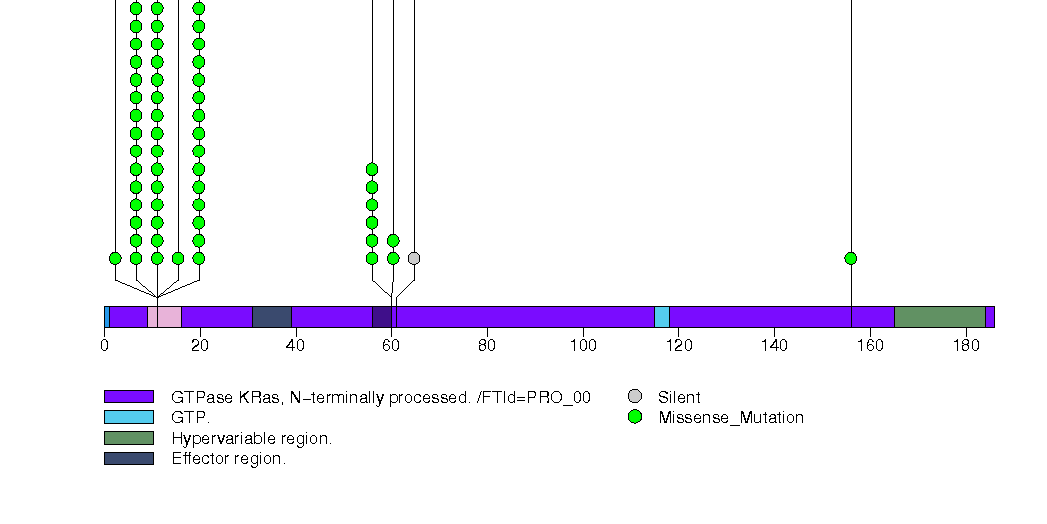
Figure S2. This figure depicts the distribution of mutations and mutation types across the TP53 significant gene.
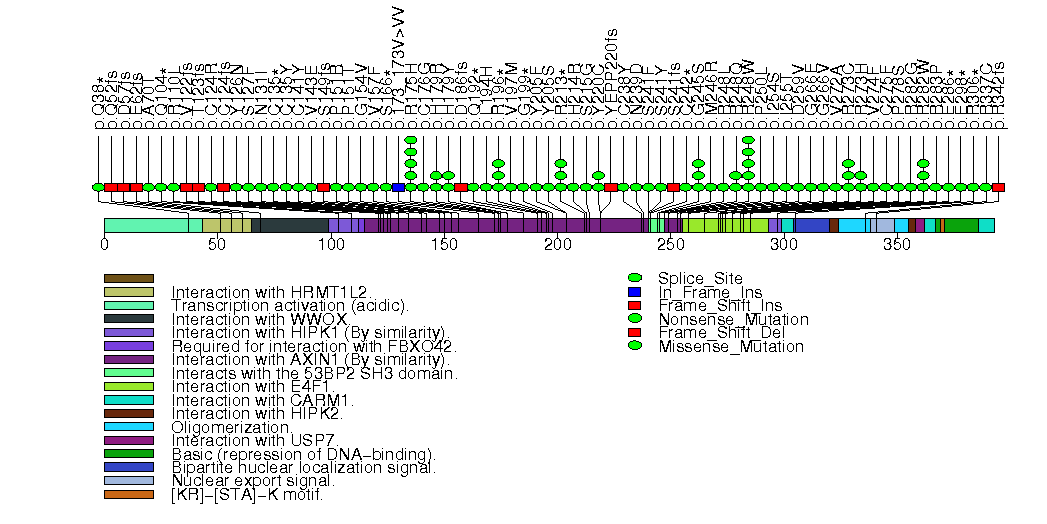
Figure S3. This figure depicts the distribution of mutations and mutation types across the JMY significant gene.
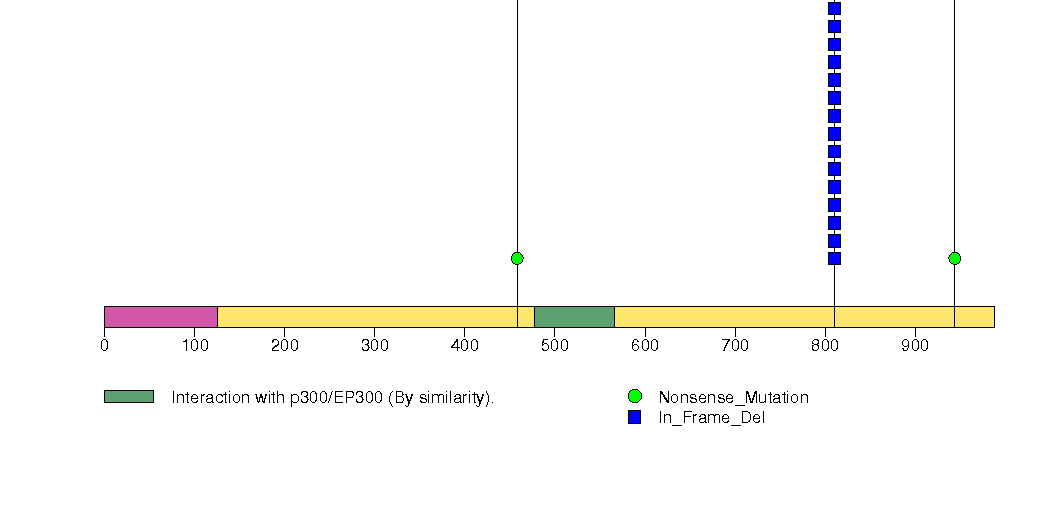
Figure S4. This figure depicts the distribution of mutations and mutation types across the RIOK1 significant gene.
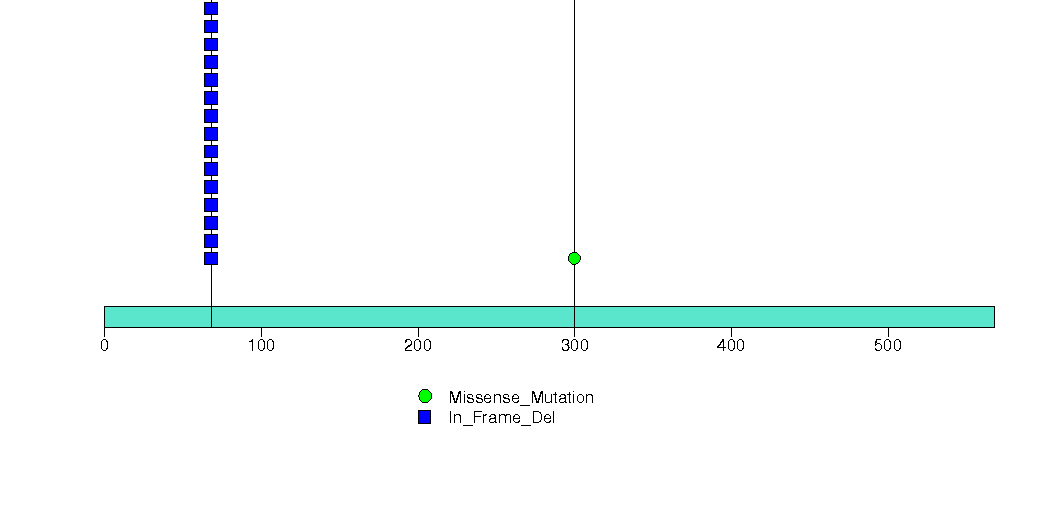
Figure S5. This figure depicts the distribution of mutations and mutation types across the LCE2A significant gene.
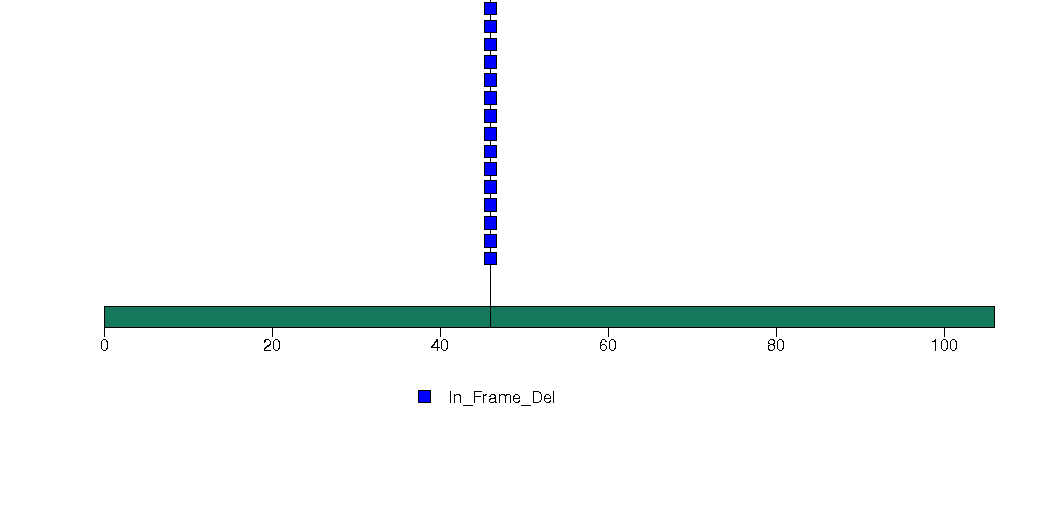
Figure S6. This figure depicts the distribution of mutations and mutation types across the C1QB significant gene.
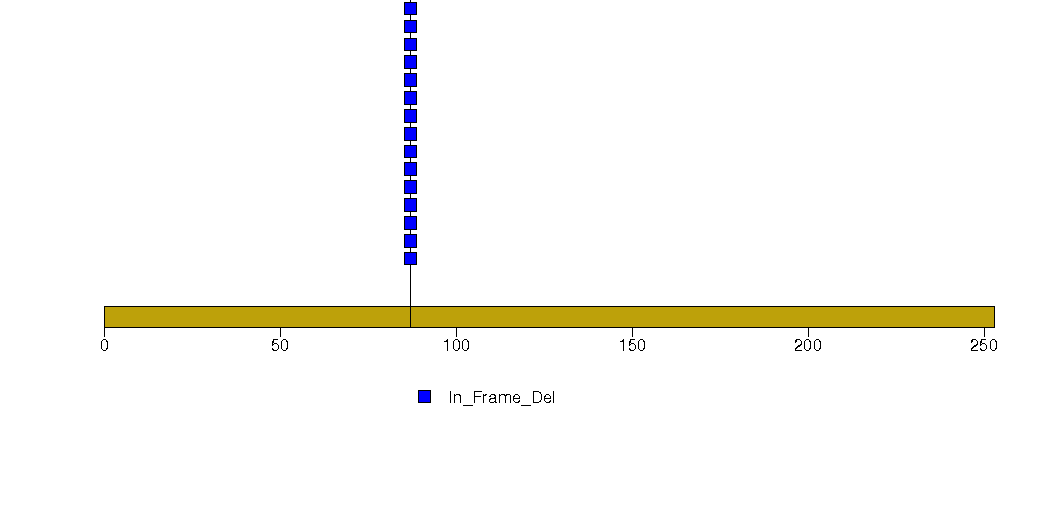
Figure S7. This figure depicts the distribution of mutations and mutation types across the CDKN2A significant gene.
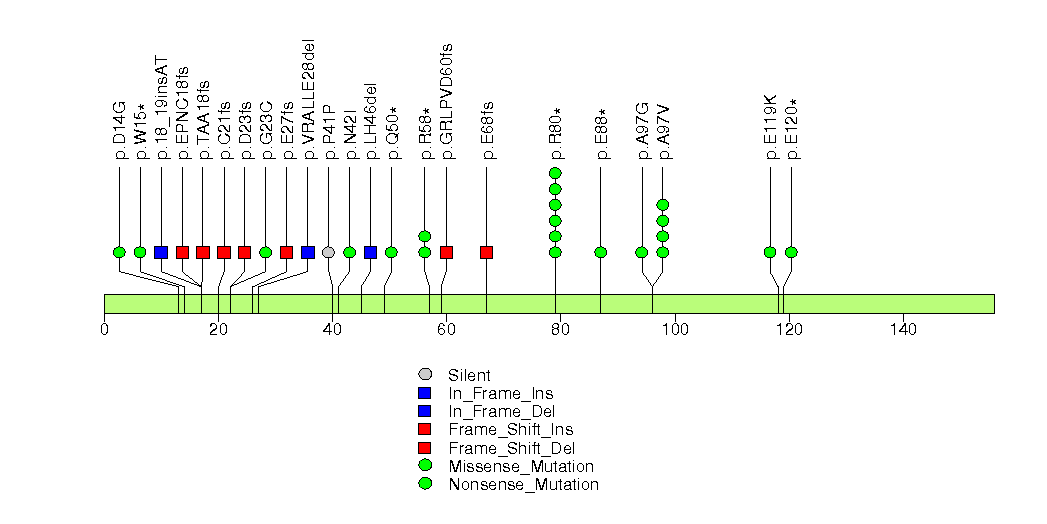
Figure S8. This figure depicts the distribution of mutations and mutation types across the AEBP1 significant gene.
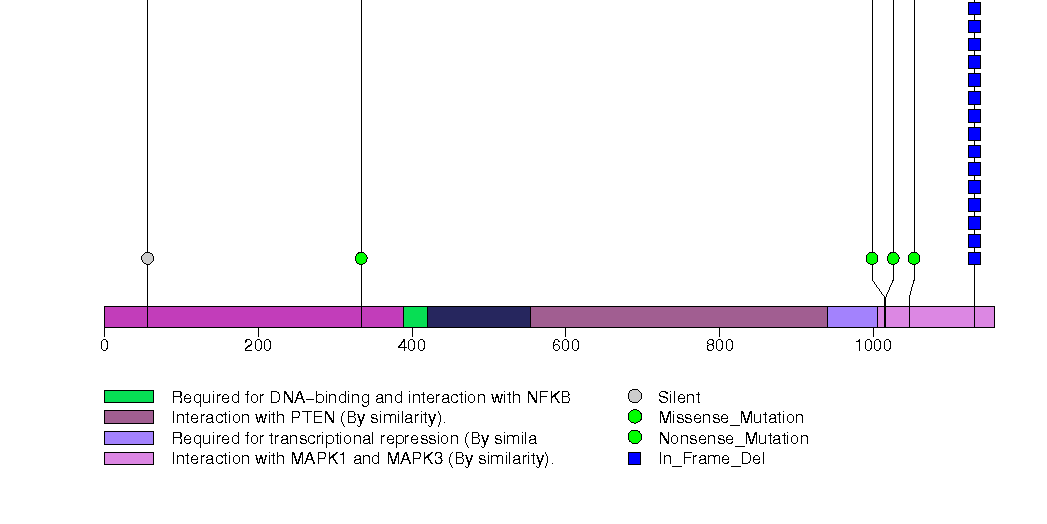
Figure S9. This figure depicts the distribution of mutations and mutation types across the RBM47 significant gene.
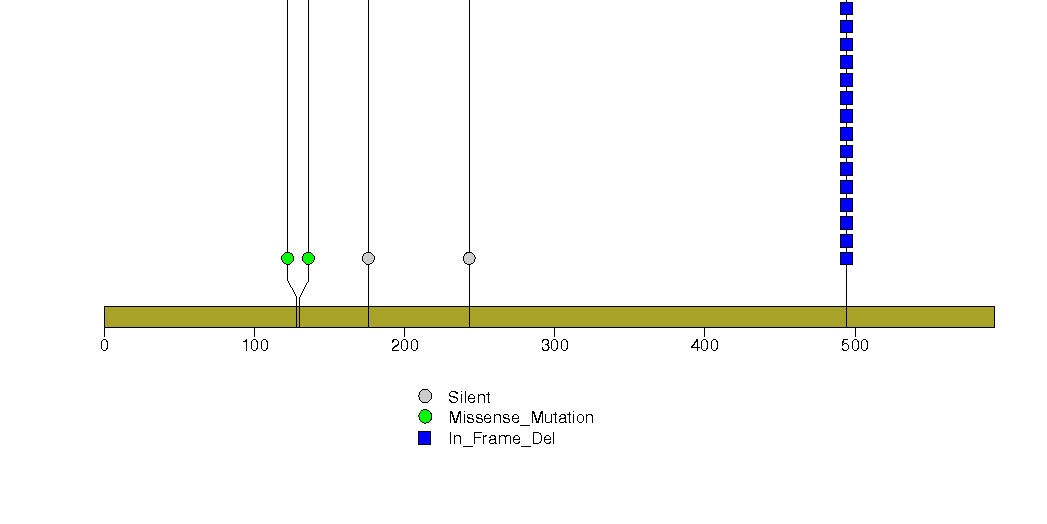
Figure S10. This figure depicts the distribution of mutations and mutation types across the ANKRD36 significant gene.
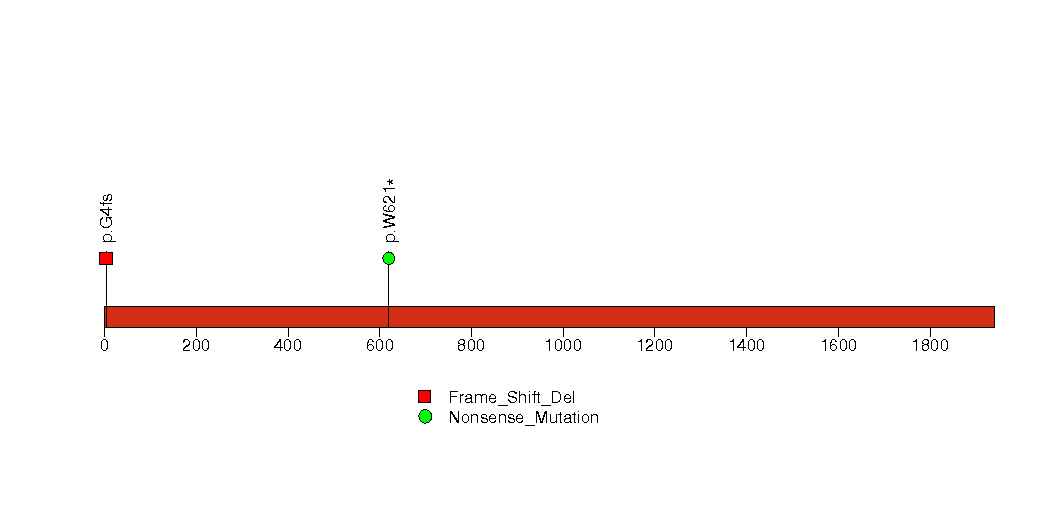
Figure S11. This figure depicts the distribution of mutations and mutation types across the RFX1 significant gene.
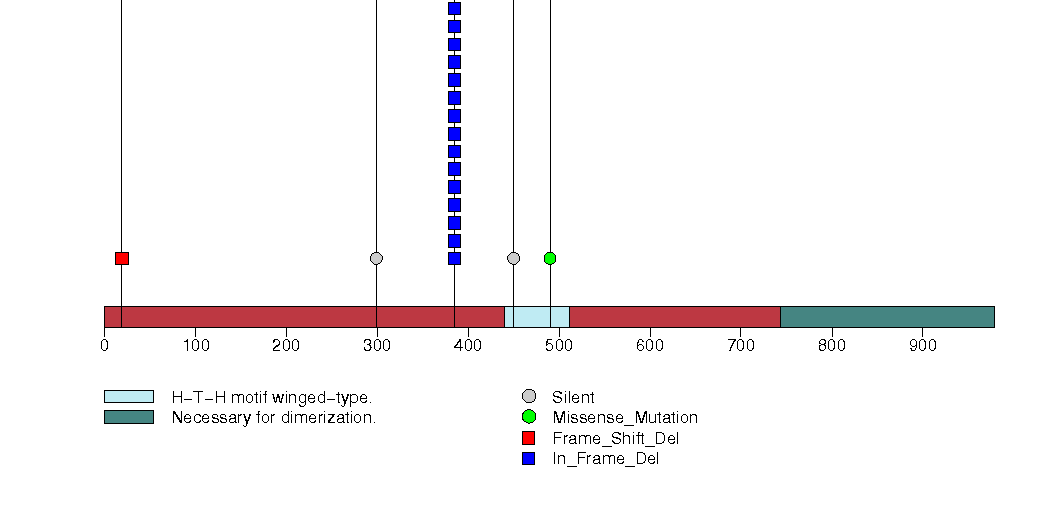
Figure S12. This figure depicts the distribution of mutations and mutation types across the TYRO3 significant gene.
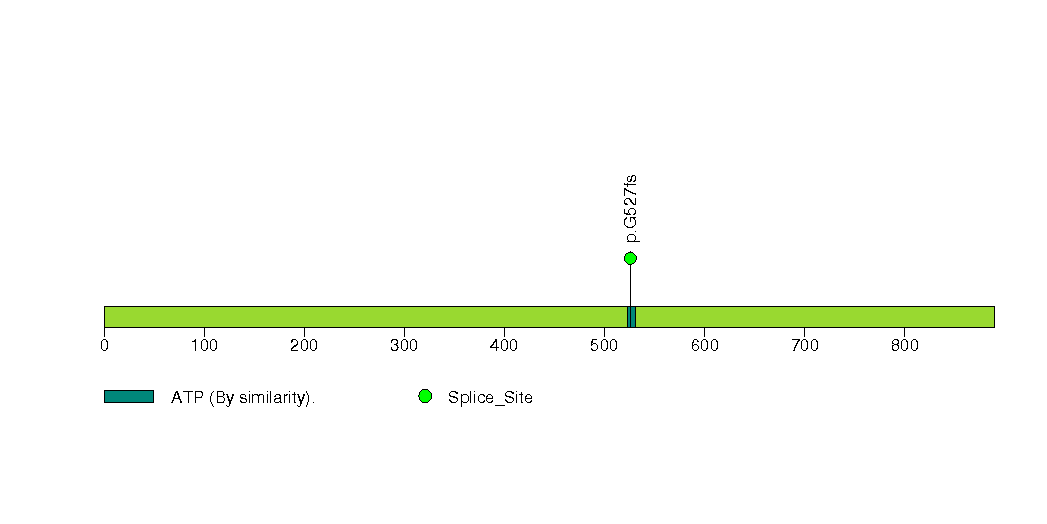
Figure S13. This figure depicts the distribution of mutations and mutation types across the SMAD4 significant gene.
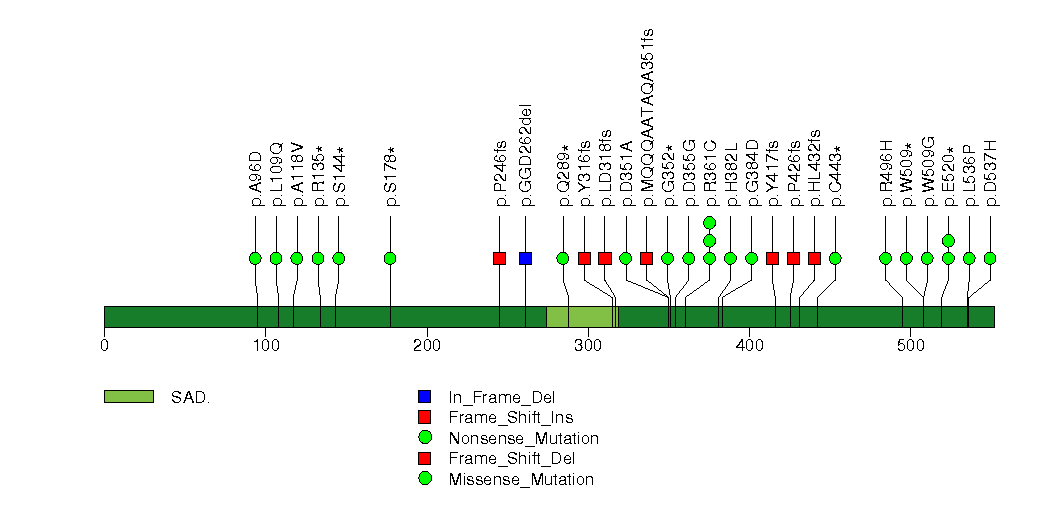
Figure S14. This figure depicts the distribution of mutations and mutation types across the GPR6 significant gene.
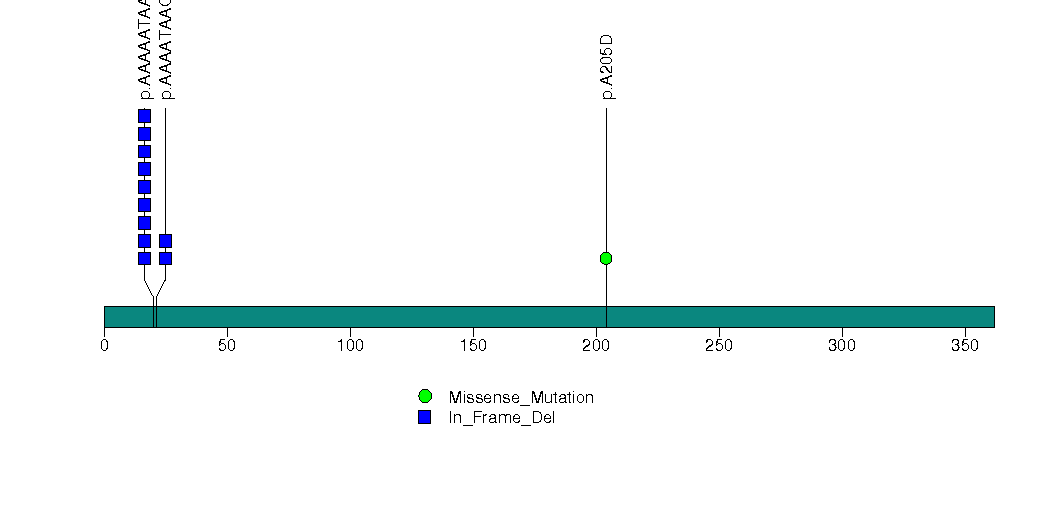
Figure S15. This figure depicts the distribution of mutations and mutation types across the LZTS1 significant gene.
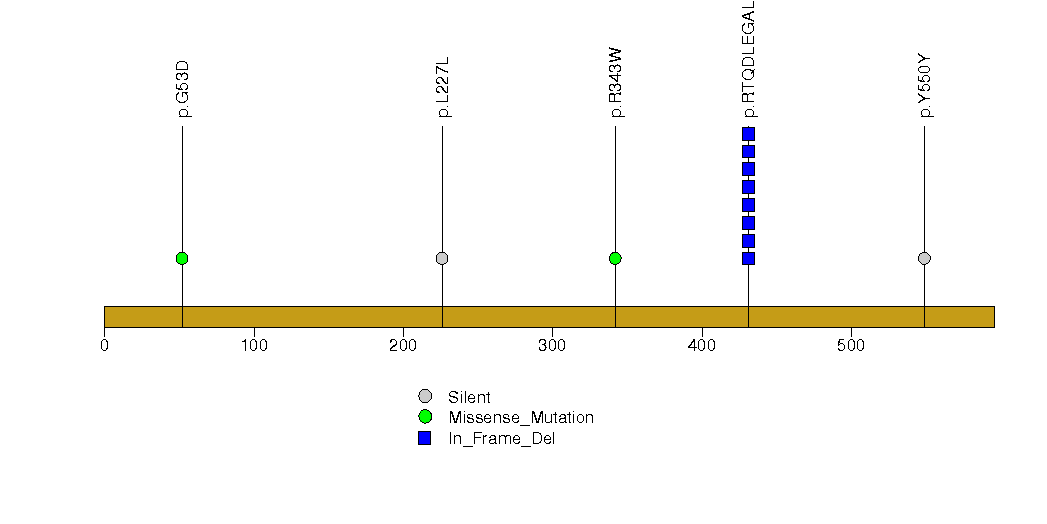
Figure S16. This figure depicts the distribution of mutations and mutation types across the NCOA3 significant gene.
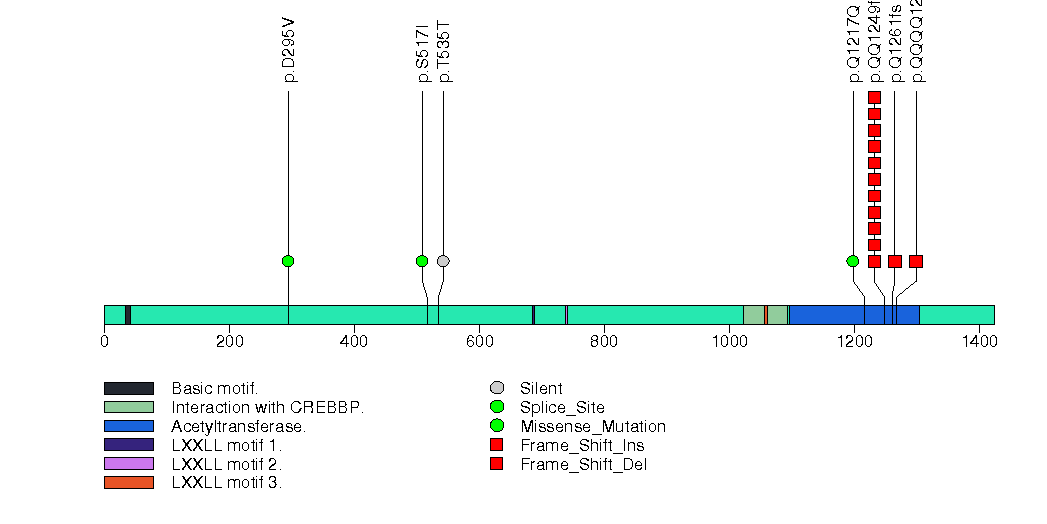
Figure S17. This figure depicts the distribution of mutations and mutation types across the SIK3 significant gene.
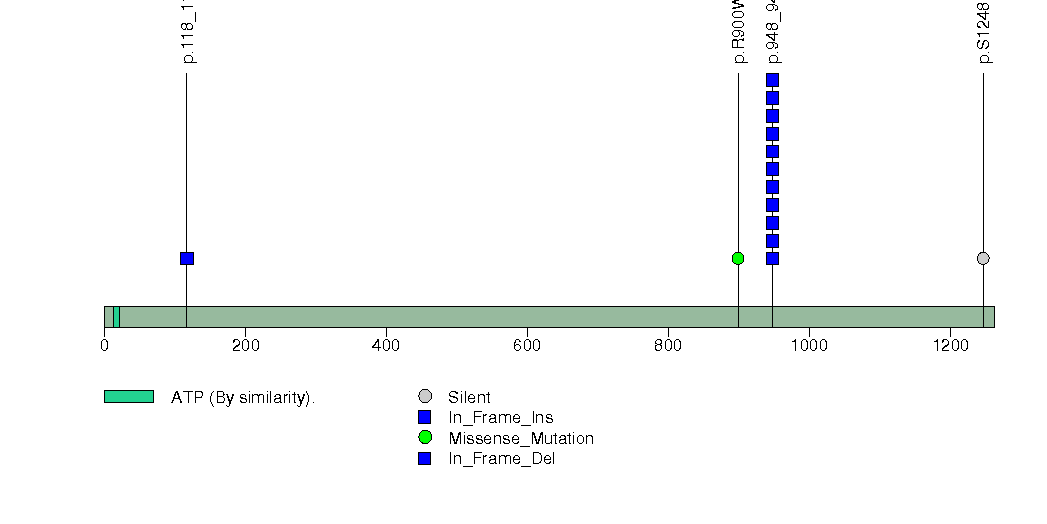
Figure S18. This figure depicts the distribution of mutations and mutation types across the ZMIZ2 significant gene.
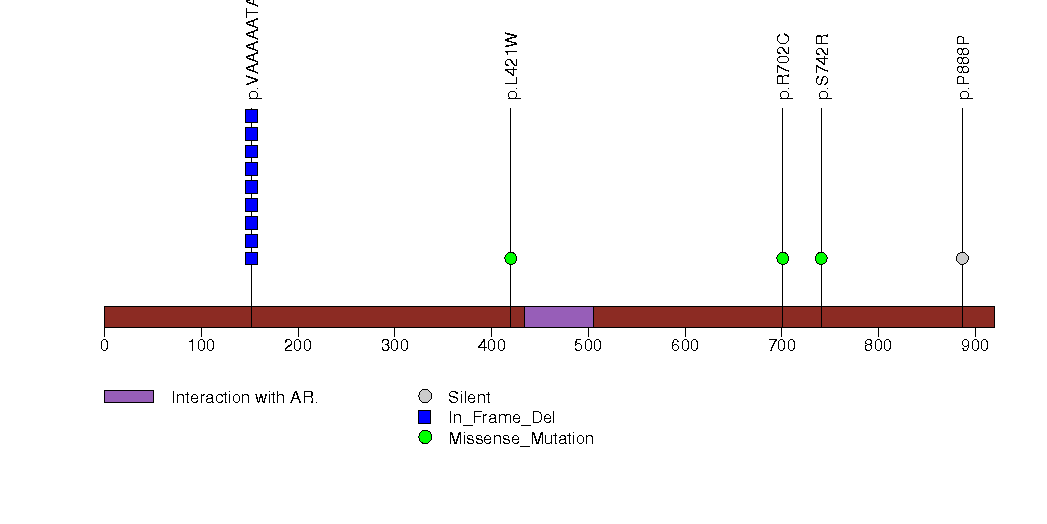
Figure S19. This figure depicts the distribution of mutations and mutation types across the IRS4 significant gene.
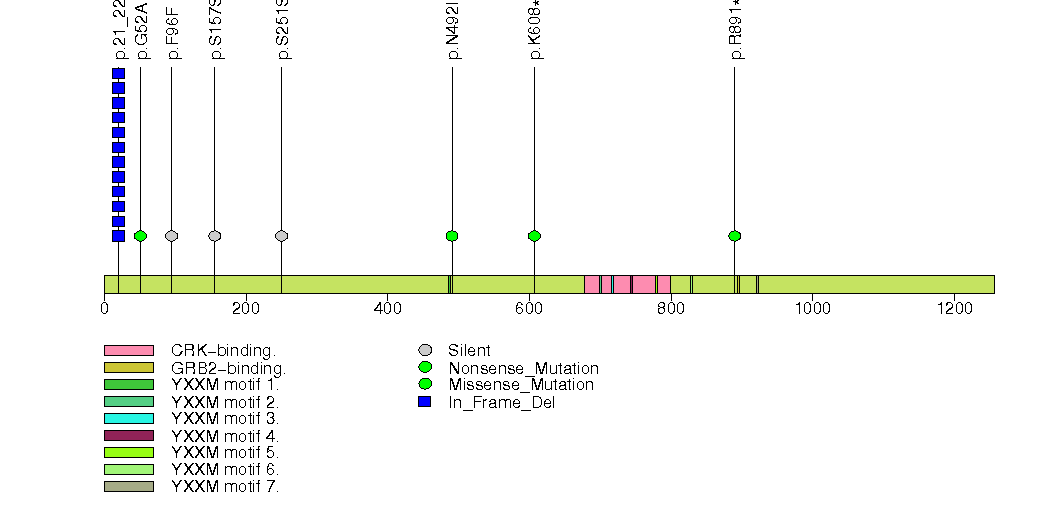
Figure S20. This figure depicts the distribution of mutations and mutation types across the ESPN significant gene.
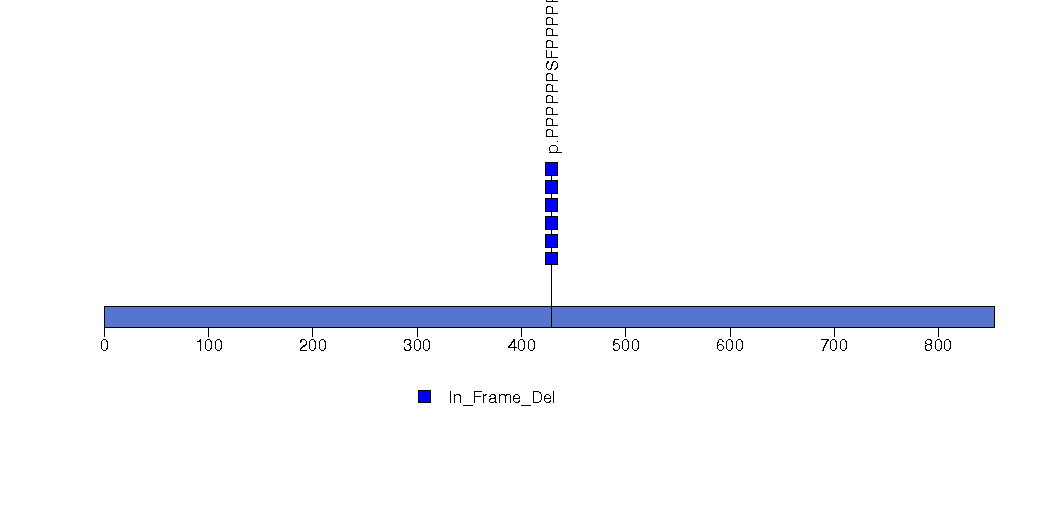
Figure S21. This figure depicts the distribution of mutations and mutation types across the ATP2C1 significant gene.
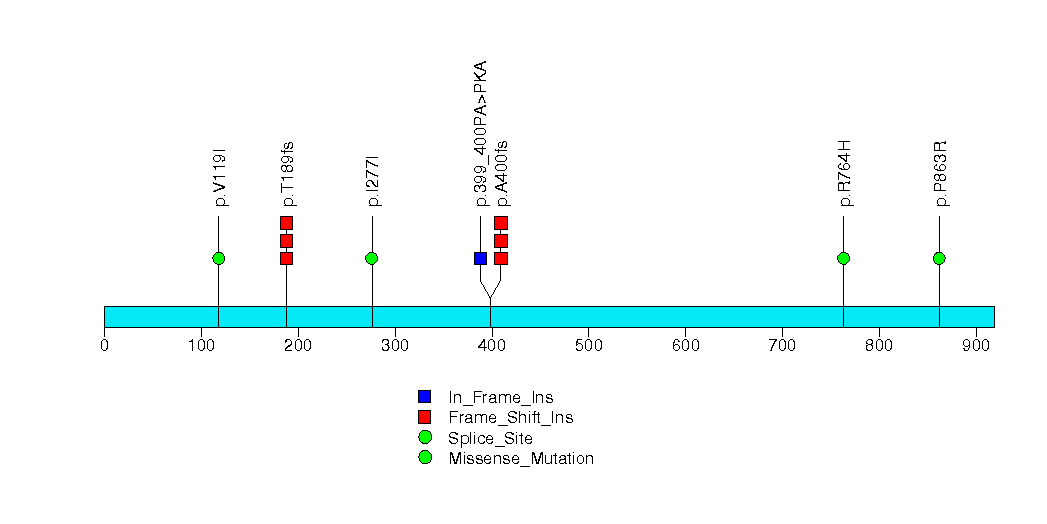
Figure S22. This figure depicts the distribution of mutations and mutation types across the FNDC1 significant gene.
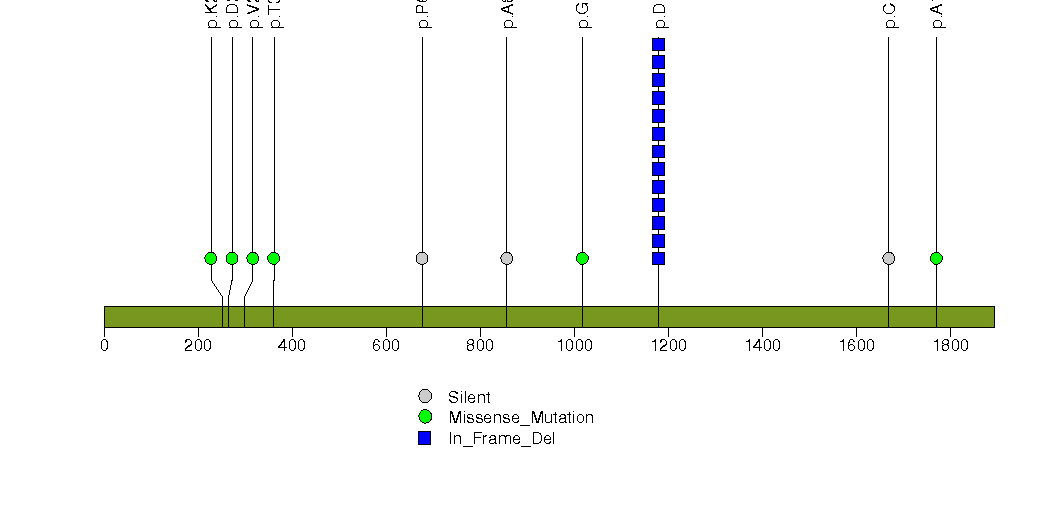
Figure S23. This figure depicts the distribution of mutations and mutation types across the SHROOM4 significant gene.
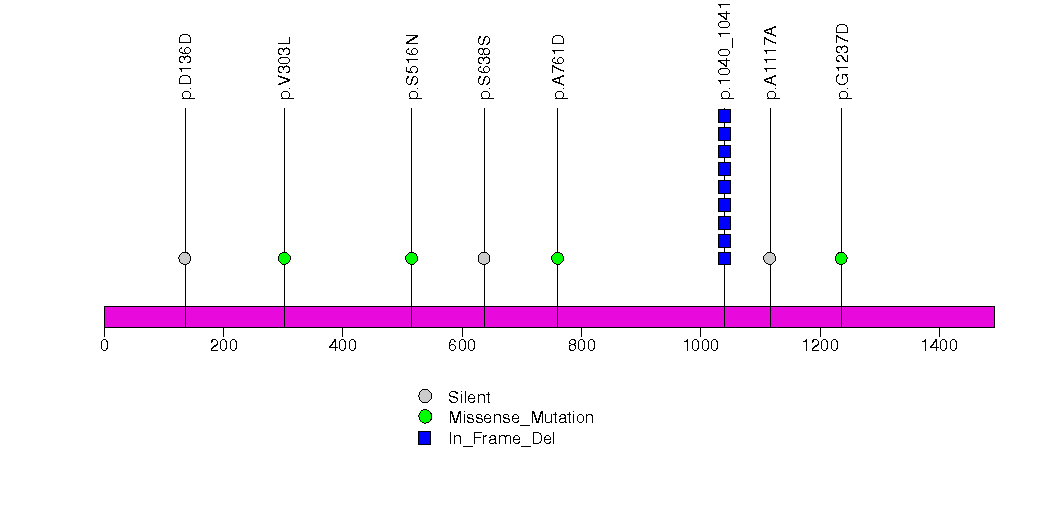
Figure S24. This figure depicts the distribution of mutations and mutation types across the PABPC1 significant gene.
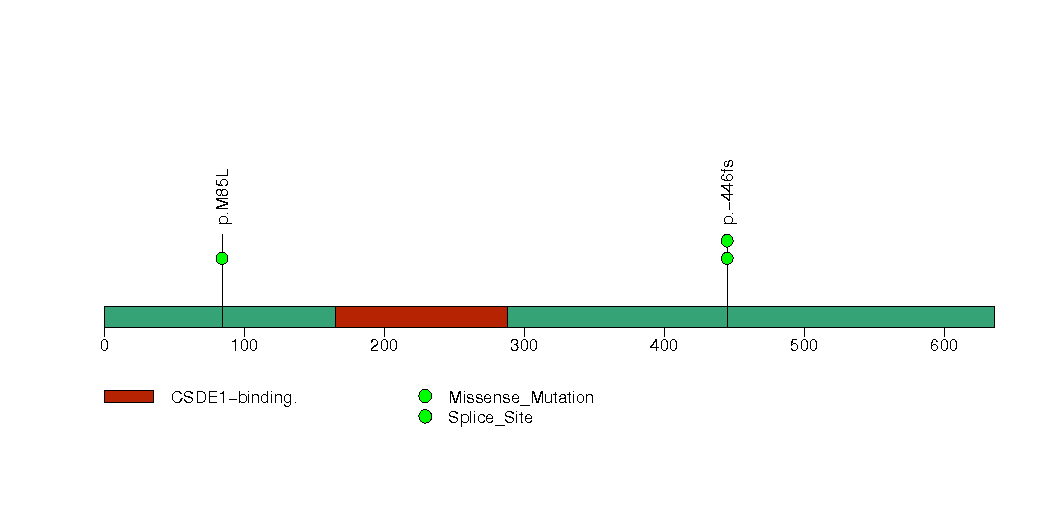
Figure S25. This figure depicts the distribution of mutations and mutation types across the OGFOD1 significant gene.
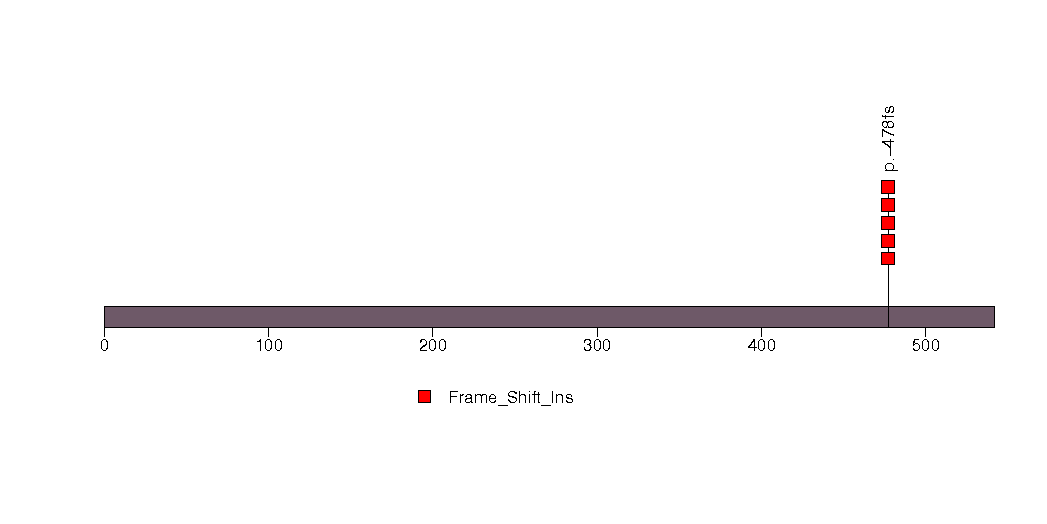
Figure S26. This figure depicts the distribution of mutations and mutation types across the DCP1B significant gene.
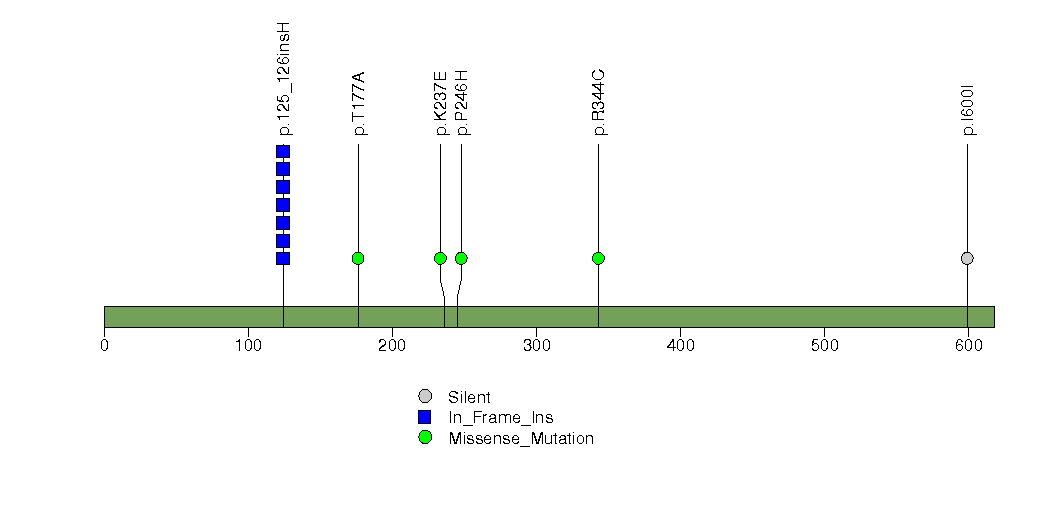
Figure S27. This figure depicts the distribution of mutations and mutation types across the ZNF880 significant gene.
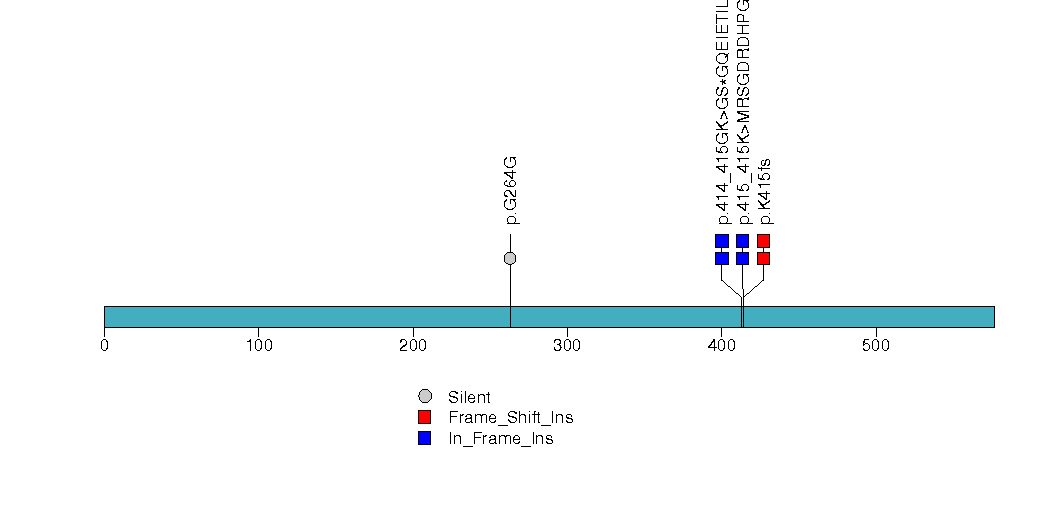
Figure S28. This figure depicts the distribution of mutations and mutation types across the UBAC1 significant gene.
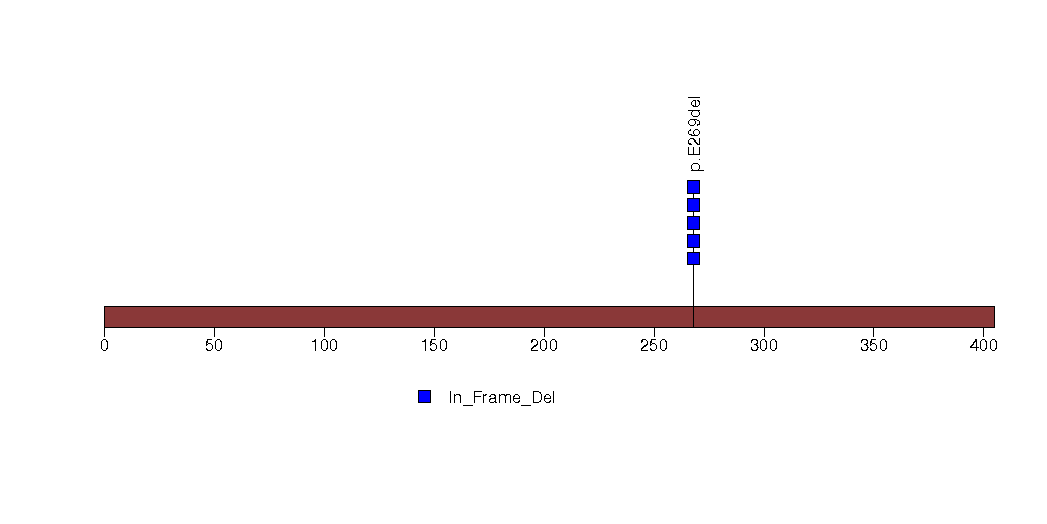
Figure S29. This figure depicts the distribution of mutations and mutation types across the CASQ2 significant gene.
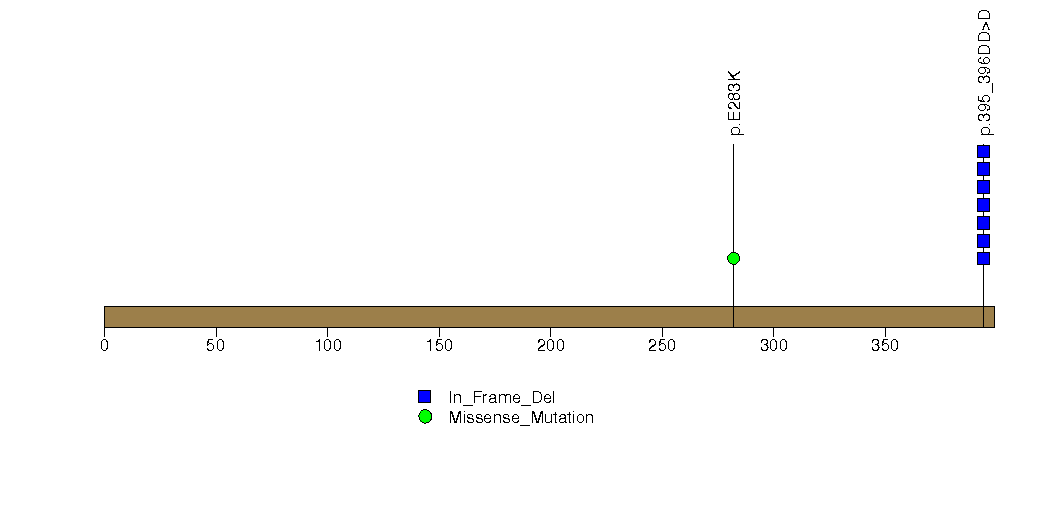
Figure S30. This figure depicts the distribution of mutations and mutation types across the RBM12 significant gene.
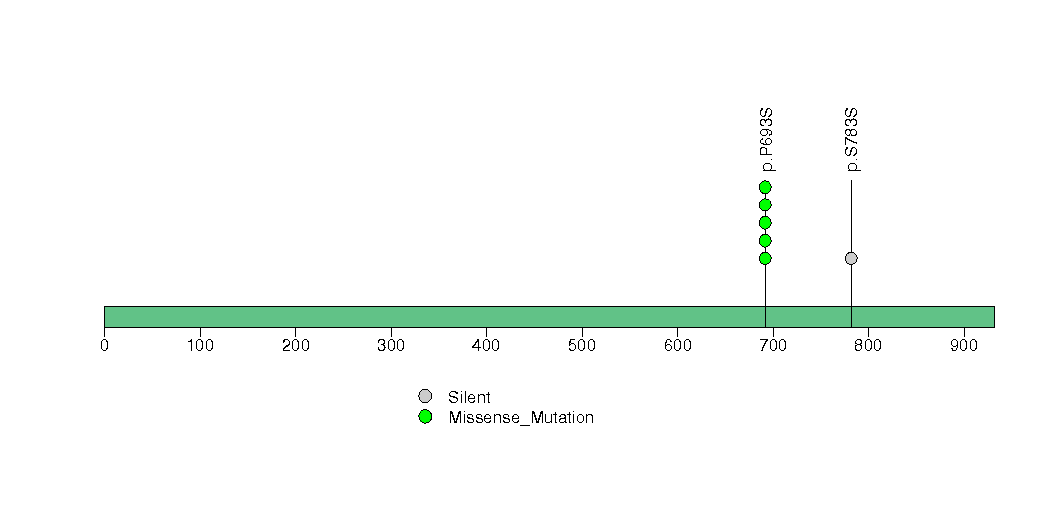
Figure S31. This figure depicts the distribution of mutations and mutation types across the VWA3A significant gene.
In brief, we tabulate the number of mutations and the number of covered bases for each gene. The counts are broken down by mutation context category: four context categories that are discovered by MutSig, and one for indel and 'null' mutations, which include indels, nonsense mutations, splice-site mutations, and non-stop (read-through) mutations. For each gene, we calculate the probability of seeing the observed constellation of mutations, i.e. the product P1 x P2 x ... x Pm, or a more extreme one, given the background mutation rates calculated across the dataset. [1]
In addition to the links below, the full results of the analysis summarized in this report can also be downloaded programmatically using firehose_get, or interactively from either the Broad GDAC website or TCGA Data Coordination Center Portal.