This report serves to describe the mutational landscape and properties of a given individual set, as well as rank genes and genesets according to mutational significance. MutSig v2.0 was used to generate the results found in this report.
-
Working with individual set: PRAD-TP
-
Number of patients in set: 425
The input for this pipeline is a set of individuals with the following files associated for each:
-
An annotated .maf file describing the mutations called for the respective individual, and their properties.
-
A .wig file that contains information about the coverage of the sample.
-
MAF used for this analysis:PRAD-TP.final_analysis_set.maf
-
Blacklist used for this analysis: pancan_mutation_blacklist.v14.hg19.txt
-
Significantly mutated genes (q ≤ 0.1): 31
-
Mutations seen in COSMIC: 141
-
Significantly mutated genes in COSMIC territory: 10
-
Significantly mutated genesets: 28
-
Significantly mutated genesets: (excluding sig. mutated genes):0
-
Read 425 MAFs of type "Broad"
-
Total number of mutations in input MAFs: 27263
-
After removing 32 mutations outside chr1-24: 27231
-
After removing 2679 blacklisted mutations: 24552
-
After removing 1514 noncoding mutations: 23038
-
After collapsing adjacent/redundant mutations: 20845
-
Number of mutations before filtering: 20845
-
After removing 1098 mutations outside gene set: 19747
-
After removing 14 mutations outside category set: 19733
Table 1. Get Full Table Table representing breakdown of mutations by type.
| type | count |
|---|---|
| Frame_Shift_Del | 893 |
| Frame_Shift_Ins | 263 |
| In_Frame_Del | 241 |
| In_Frame_Ins | 26 |
| Missense_Mutation | 12036 |
| Nonsense_Mutation | 737 |
| Nonstop_Mutation | 17 |
| Silent | 4761 |
| Splice_Site | 680 |
| Translation_Start_Site | 79 |
| Total | 19733 |
Table 2. Get Full Table A breakdown of mutation rates per category discovered for this individual set.
| category | n | N | rate | rate_per_mb | relative_rate | exp_ns_s_ratio |
|---|---|---|---|---|---|---|
| *CpG->T | 4236 | 685631561 | 6.2e-06 | 6.2 | 5.1 | 2.1 |
| *Cp(A/C/T)->T | 2049 | 5637152276 | 3.6e-07 | 0.36 | 0.3 | 1.7 |
| A->G | 1674 | 6093491283 | 2.7e-07 | 0.27 | 0.23 | 2.3 |
| transver | 4152 | 12416275120 | 3.3e-07 | 0.33 | 0.28 | 5 |
| indel+null | 2848 | 12416275120 | 2.3e-07 | 0.23 | 0.19 | NaN |
| double_null | 13 | 12416275120 | 1e-09 | 0.001 | 0.00087 | NaN |
| Total | 14972 | 12416275120 | 1.2e-06 | 1.2 | 1 | 3.5 |
The x axis represents the samples. The y axis represents the exons, one row per exon, and they are sorted by average coverage across samples. For exons with exactly the same average coverage, they are sorted next by the %GC of the exon. (The secondary sort is especially useful for the zero-coverage exons at the bottom). If the figure is unpopulated, then full coverage is assumed (e.g. MutSig CV doesn't use WIGs and assumes full coverage).
Figure 1.
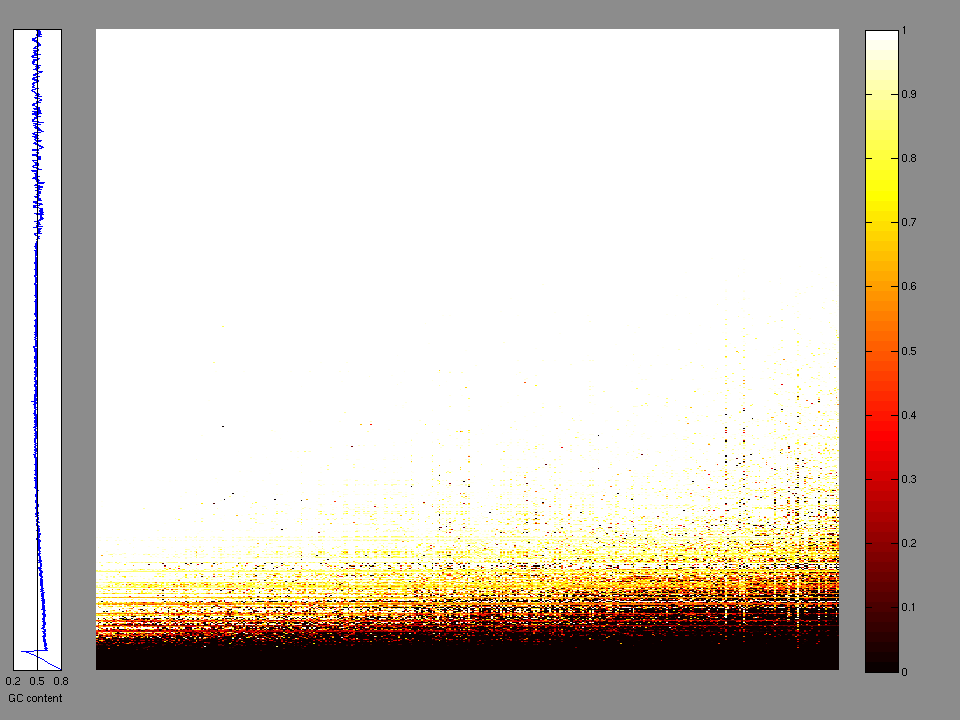
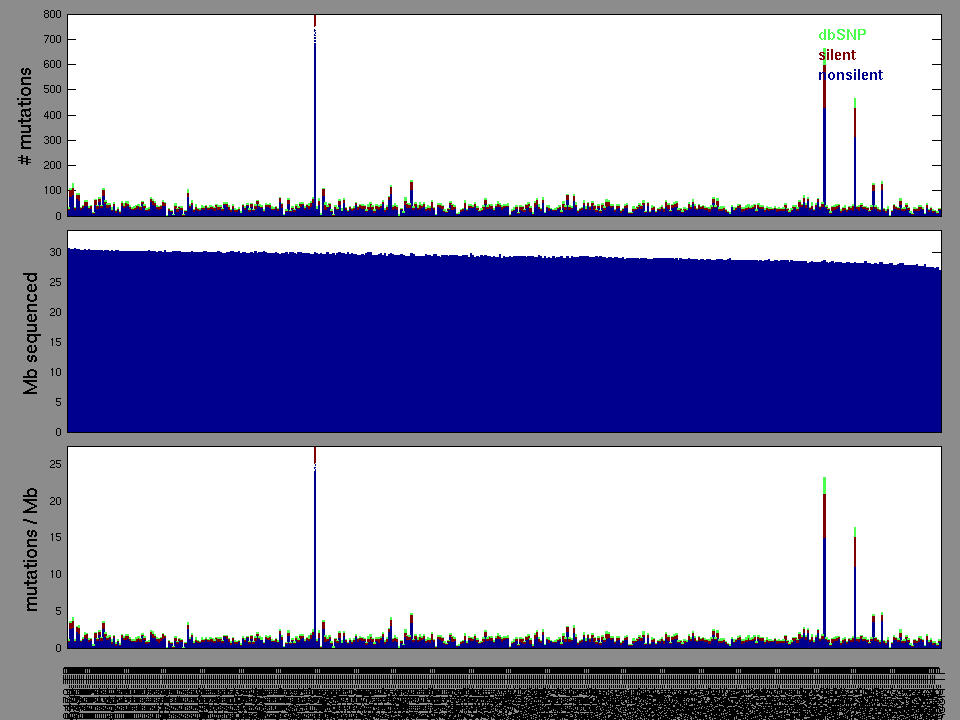
Figure 2. Patients counts and rates file used to generate this plot: PRAD-TP.patients.counts_and_rates.txt
The mutation spectrum is depicted in the lego plots below in which the 96 possible mutation types are subdivided into six large blocks, color-coded to reflect the base substitution type. Each large block is further subdivided into the 16 possible pairs of 5' and 3' neighbors, as listed in the 4x4 trinucleotide context legend. The height of each block corresponds to the mutation frequency for that kind of mutation (counts of mutations normalized by the base coverage in a given bin). The shape of the spectrum is a signature for dominant mutational mechanisms in different tumor types.
Figure 3. Get High-res Image SNV Mutation rate lego plot for entire set. Each bin is normalized by base coverage for that bin. Colors represent the six SNV types on the upper right. The three-base context for each mutation is labeled in the 4x4 legend on the lower right. The fractional breakdown of SNV counts is shown in the pie chart on the upper left. If this figure is blank, not enough information was provided in the MAF to generate it.
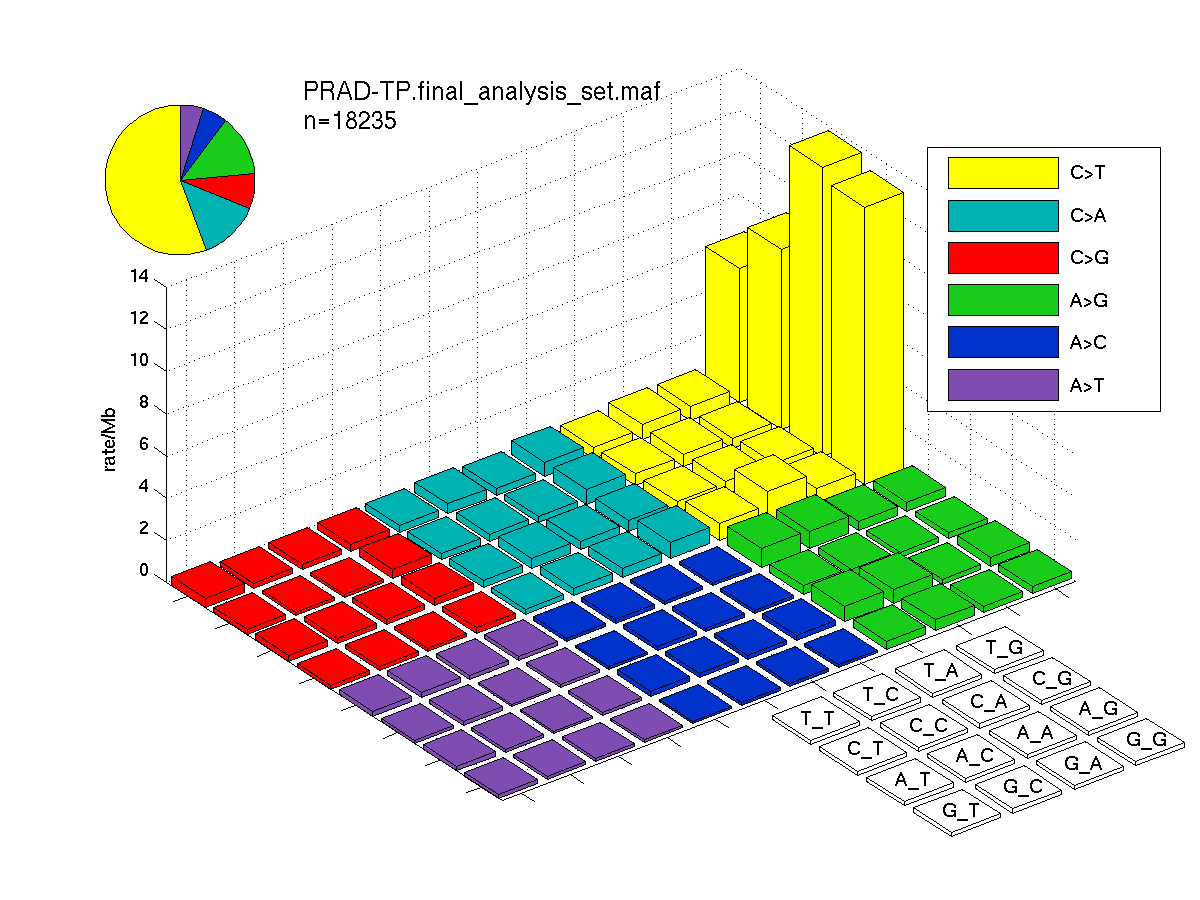
Figure 4. Get High-res Image SNV Mutation rate lego plots for 4 slices of mutation allele fraction (0<=AF<0.1, 0.1<=AF<0.25, 0.25<=AF<0.5, & 0.5<=AF) . The color code and three-base context legends are the same as the previous figure. If this figure is blank, not enough information was provided in the MAF to generate it.
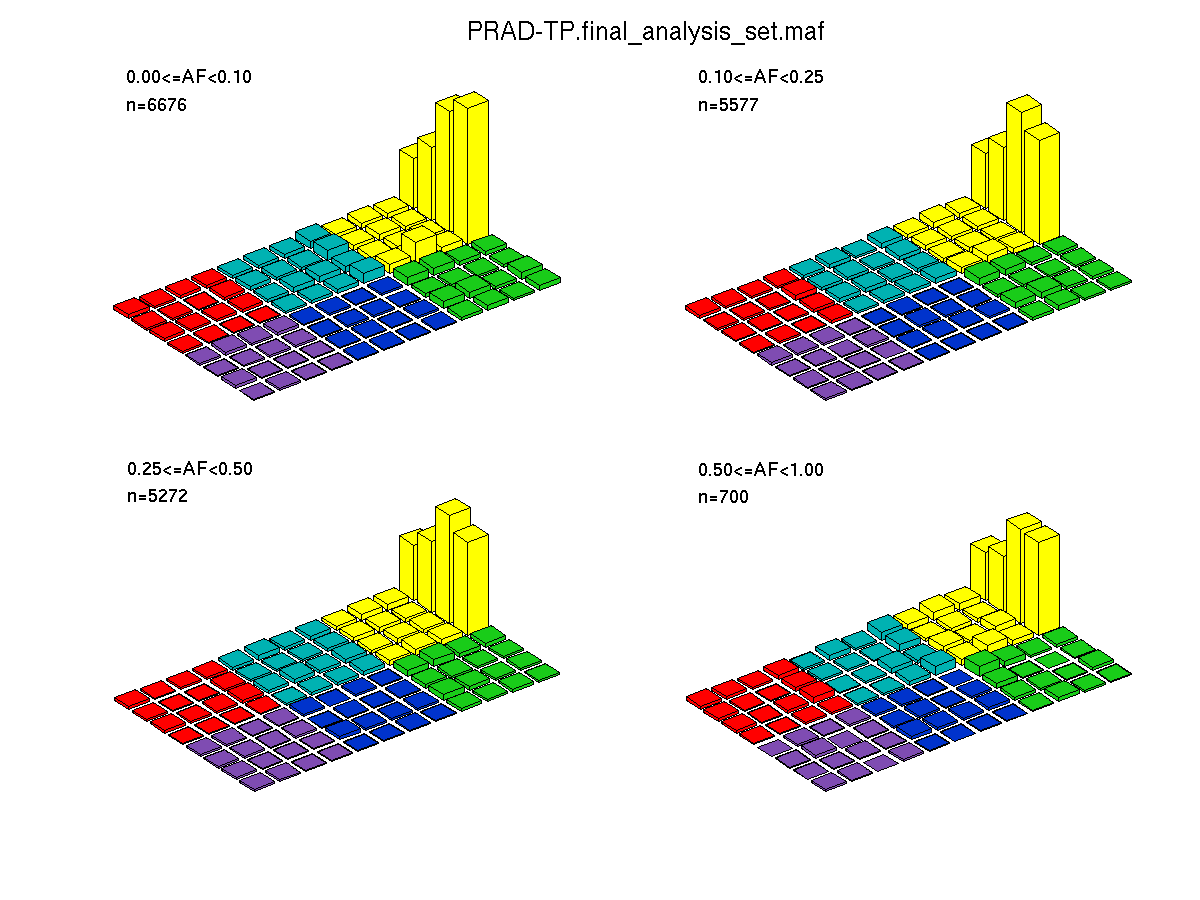
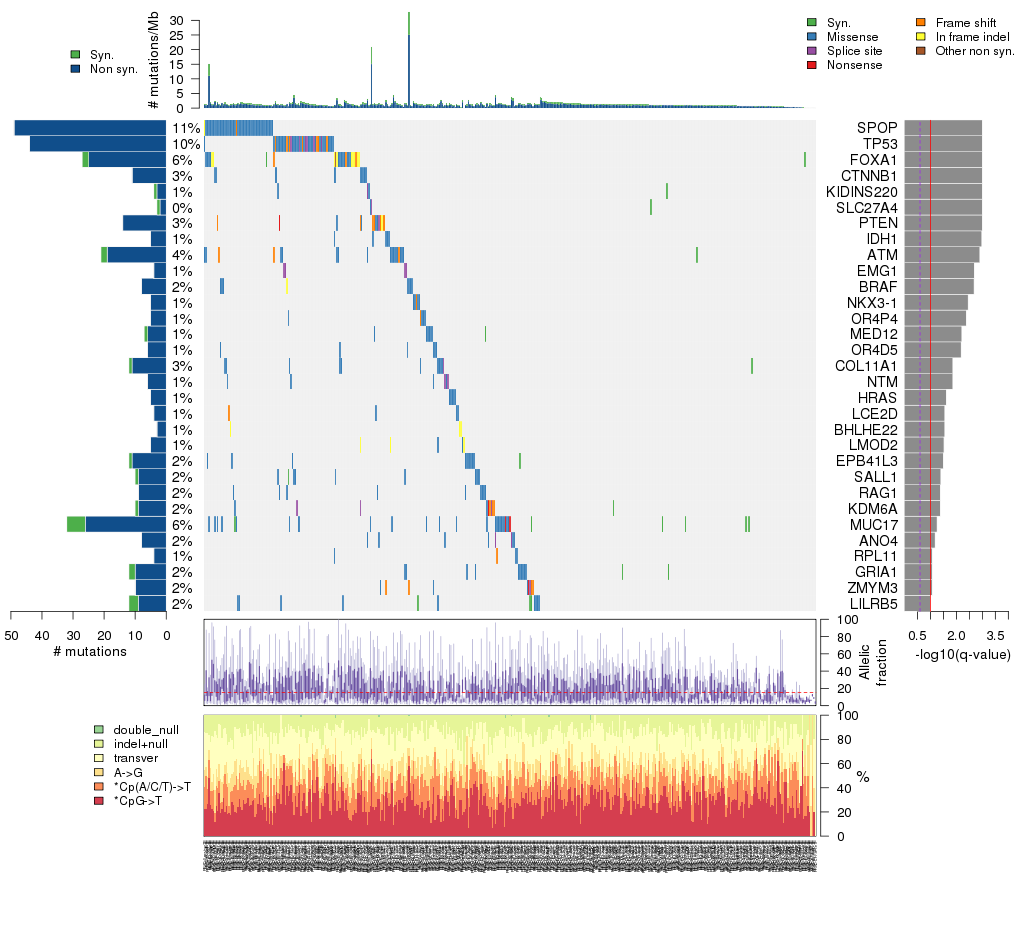
Figure 5. Get High-res Image The matrix in the center of the figure represents individual mutations in patient samples, color-coded by type of mutation, for the significantly mutated genes. The rate of synonymous and non-synonymous mutations is displayed at the top of the matrix. The barplot on the left of the matrix shows the number of mutations in each gene. The percentages represent the fraction of tumors with at least one mutation in the specified gene. The barplot to the right of the matrix displays the q-values for the most significantly mutated genes. The purple boxplots below the matrix (only displayed if required columns are present in the provided MAF) represent the distributions of allelic fractions observed in each sample. The plot at the bottom represents the base substitution distribution of individual samples, using the same categories that were used to calculate significance.
Column Descriptions:
-
N = number of sequenced bases in this gene across the individual set
-
n = number of (nonsilent) mutations in this gene across the individual set
-
npat = number of patients (individuals) with at least one nonsilent mutation
-
nsite = number of unique sites having a non-silent mutation
-
nsil = number of silent mutations in this gene across the individual set
-
n1 = number of nonsilent mutations of type: *CpG->T
-
n2 = number of nonsilent mutations of type: *Cp(A/C/T)->T
-
n3 = number of nonsilent mutations of type: A->G
-
n4 = number of nonsilent mutations of type: transver
-
n5 = number of nonsilent mutations of type: indel+null
-
n6 = number of nonsilent mutations of type: double_null
-
p_classic = p-value for the observed amount of nonsilent mutations being elevated in this gene
-
p_ns_s = p-value for the observed nonsilent/silent ratio being elevated in this gene
-
p_cons = p-value for enrichment of mutations at evolutionarily most-conserved sites in gene
-
p_joint = p-value for clustering + conservation
-
p = p-value (overall)
-
q = q-value, False Discovery Rate (Benjamini-Hochberg procedure)
Table 3. Get Full Table A Ranked List of Significantly Mutated Genes. Number of significant genes found: 31. Number of genes displayed: 35. Click on a gene name to display its stick figure depicting the distribution of mutations and mutation types across the chosen gene (this feature may not be available for all significant genes).
| rank | gene | description | N | n | npat | nsite | nsil | n1 | n2 | n3 | n4 | n5 | n6 | p_classic | p_ns_s | p_clust | p_cons | p_joint | p | q |
|---|---|---|---|---|---|---|---|---|---|---|---|---|---|---|---|---|---|---|---|---|
| 1 | SPOP | speckle-type POZ protein | 493289 | 49 | 48 | 15 | 0 | 1 | 0 | 8 | 38 | 2 | 0 | <1.00e-15 | 0.000091 | 0 | 0.15 | 0 | <1.00e-15 | <3.02e-12 |
| 2 | TP53 | tumor protein p53 | 513678 | 44 | 43 | 34 | 0 | 13 | 6 | 5 | 7 | 13 | 0 | 5.11e-15 | 0.000016 | 6e-07 | 0.000013 | 0 | <1.00e-15 | <3.02e-12 |
| 3 | FOXA1 | forkhead box A1 | 450201 | 25 | 25 | 17 | 2 | 1 | 2 | 3 | 6 | 12 | 1 | 7.33e-15 | 0.21 | 0 | 0.026 | 0 | <1.00e-15 | <3.02e-12 |
| 4 | CTNNB1 | catenin (cadherin-associated protein), beta 1, 88kDa | 1019744 | 11 | 11 | 8 | 0 | 0 | 1 | 3 | 7 | 0 | 0 | 1.08e-08 | 0.042 | 0 | 0.012 | 0 | <1.00e-15 | <3.02e-12 |
| 5 | KIDINS220 | kinase D-interacting substrate, 220kDa | 2304669 | 3 | 3 | 3 | 1 | 0 | 0 | 0 | 2 | 1 | 0 | 0.380 | 0.75 | 0.15 | 0 | 0 | <1.00e-15 | <3.02e-12 |
| 6 | SLC27A4 | solute carrier family 27 (fatty acid transporter), member 4 | 821905 | 2 | 2 | 2 | 1 | 0 | 0 | 1 | 0 | 1 | 0 | 0.219 | 0.88 | 0.18 | 0 | 0 | <1.00e-15 | <3.02e-12 |
| 7 | PTEN | phosphatase and tensin homolog (mutated in multiple advanced cancers 1) | 496516 | 14 | 14 | 14 | 0 | 0 | 0 | 1 | 3 | 10 | 0 | 1.35e-14 | 0.21 | 0.14 | 0.86 | 0.21 | 9.93e-14 | 2.57e-10 |
| 8 | IDH1 | isocitrate dehydrogenase 1 (NADP+), soluble | 538265 | 5 | 5 | 2 | 0 | 4 | 0 | 0 | 1 | 0 | 0 | 0.000101 | 0.2 | 1.8e-06 | 0.79 | 0.000014 | 2.95e-08 | 6.67e-05 |
| 9 | ATM | ataxia telangiectasia mutated | 3973837 | 19 | 19 | 19 | 2 | 1 | 6 | 2 | 7 | 3 | 0 | 3.99e-07 | 0.17 | 0.29 | 0.0064 | 0.017 | 1.33e-07 | 0.000268 |
| 10 | EMG1 | EMG1 nucleolar protein homolog (S. cerevisiae) | 276669 | 4 | 4 | 2 | 0 | 0 | 0 | 0 | 0 | 4 | 0 | 5.66e-05 | 1 | 0.00024 | 0.89 | 0.00056 | 5.77e-07 | 0.00104 |
| 11 | BRAF | v-raf murine sarcoma viral oncogene homolog B1 | 947390 | 8 | 8 | 7 | 0 | 0 | 0 | 2 | 5 | 1 | 0 | 7.05e-06 | 0.16 | 0.012 | 0.014 | 0.0052 | 6.58e-07 | 0.00108 |
| 12 | NKX3-1 | NK3 homeobox 1 | 218518 | 5 | 5 | 5 | 0 | 0 | 0 | 2 | 2 | 1 | 0 | 3.16e-06 | 0.42 | 0.14 | 0.0072 | 0.031 | 1.66e-06 | 0.00250 |
| 13 | OR4P4 | olfactory receptor, family 4, subfamily P, member 4 | 370433 | 5 | 5 | 4 | 0 | 3 | 0 | 0 | 1 | 1 | 0 | 1.77e-06 | 0.22 | 0.11 | 0.086 | 0.076 | 2.26e-06 | 0.00314 |
| 14 | MED12 | mediator complex subunit 12 | 2261211 | 6 | 6 | 3 | 1 | 0 | 3 | 0 | 3 | 0 | 0 | 0.0268 | 0.39 | 1.2e-06 | 0.15 | 9.4e-06 | 4.08e-06 | 0.00527 |
| 15 | OR4D5 | olfactory receptor, family 4, subfamily D, member 5 | 408397 | 6 | 6 | 6 | 0 | 3 | 2 | 0 | 1 | 0 | 0 | 2.85e-07 | 0.11 | 0.91 | 0.36 | 1 | 4.59e-06 | 0.00553 |
| 16 | COL11A1 | collagen, type XI, alpha 1 | 2401276 | 11 | 11 | 11 | 1 | 3 | 1 | 2 | 4 | 1 | 0 | 6.12e-06 | 0.1 | 0.07 | 0.4 | 0.13 | 1.17e-05 | 0.0130 |
| 17 | NTM | neurotrimin | 495453 | 6 | 6 | 6 | 0 | 2 | 1 | 0 | 1 | 2 | 0 | 1.23e-05 | 0.082 | NaN | NaN | NaN | 1.23e-05 | 0.0130 |
| 18 | HRAS | v-Ha-ras Harvey rat sarcoma viral oncogene homolog | 274530 | 5 | 5 | 3 | 0 | 2 | 0 | 3 | 0 | 0 | 0 | 6.22e-06 | 0.28 | 0.2 | 0.68 | 0.26 | 2.33e-05 | 0.0234 |
| 19 | LCE2D | late cornified envelope 2D | 143225 | 4 | 4 | 4 | 0 | 2 | 0 | 0 | 1 | 1 | 0 | 2.37e-06 | 0.68 | 0.96 | 0.21 | 0.89 | 2.96e-05 | 0.0276 |
| 20 | BHLHE22 | basic helix-loop-helix family, member e22 | 169103 | 3 | 3 | 2 | 0 | 0 | 0 | 0 | 0 | 3 | 0 | 0.000472 | 1 | 0.00088 | 0.97 | 0.0046 | 3.05e-05 | 0.0276 |
| 21 | LMOD2 | leiomodin 2 (cardiac) | 421319 | 5 | 5 | 3 | 0 | 0 | 0 | 0 | 2 | 3 | 0 | 2.71e-05 | 0.7 | 0.43 | 0.043 | 0.089 | 3.38e-05 | 0.0291 |
| 22 | EPB41L3 | erythrocyte membrane protein band 4.1-like 3 | 1416948 | 11 | 10 | 11 | 1 | 6 | 2 | 1 | 2 | 0 | 0 | 9.07e-06 | 0.06 | 0.18 | 0.46 | 0.29 | 3.69e-05 | 0.0303 |
| 23 | SALL1 | sal-like 1 (Drosophila) | 1674558 | 9 | 9 | 9 | 1 | 3 | 2 | 2 | 2 | 0 | 0 | 0.000111 | 0.094 | 0.025 | 0.24 | 0.033 | 4.96e-05 | 0.0391 |
| 24 | RAG1 | recombination activating gene 1 | 1331690 | 9 | 9 | 9 | 0 | 6 | 1 | 1 | 1 | 0 | 0 | 4.42e-06 | 0.09 | 0.75 | 0.43 | 0.9 | 5.35e-05 | 0.0398 |
| 25 | KDM6A | lysine (K)-specific demethylase 6A | 1583487 | 9 | 9 | 9 | 1 | 0 | 0 | 1 | 1 | 7 | 0 | 1.92e-05 | 0.49 | 0.82 | 0.042 | 0.21 | 5.50e-05 | 0.0398 |
| 26 | MUC17 | mucin 17, cell surface associated | 5750471 | 26 | 25 | 26 | 6 | 1 | 14 | 2 | 7 | 2 | 0 | 7.32e-05 | 0.17 | 0.036 | 0.79 | 0.082 | 7.80e-05 | 0.0543 |
| 27 | ANO4 | anoctamin 4 | 1214742 | 8 | 8 | 8 | 0 | 2 | 0 | 0 | 4 | 2 | 0 | 5.36e-05 | 0.13 | 0.31 | 0.053 | 0.14 | 9.64e-05 | 0.0646 |
| 28 | RPL11 | ribosomal protein L11 | 199370 | 4 | 4 | 4 | 0 | 0 | 1 | 2 | 0 | 1 | 0 | 1.09e-05 | 0.3 | 0.82 | 0.81 | 1 | 0.000136 | 0.0838 |
| 29 | GRIA1 | glutamate receptor, ionotropic, AMPA 1 | 1231367 | 10 | 10 | 8 | 2 | 7 | 0 | 0 | 3 | 0 | 0 | 9.68e-05 | 0.31 | 0.071 | 0.71 | 0.11 | 0.000137 | 0.0838 |
| 30 | ZMYM3 | zinc finger, MYM-type 3 | 1185165 | 10 | 9 | 10 | 0 | 0 | 0 | 0 | 4 | 6 | 0 | 1.65e-05 | 0.31 | 0.5 | 0.69 | 0.68 | 0.000139 | 0.0838 |
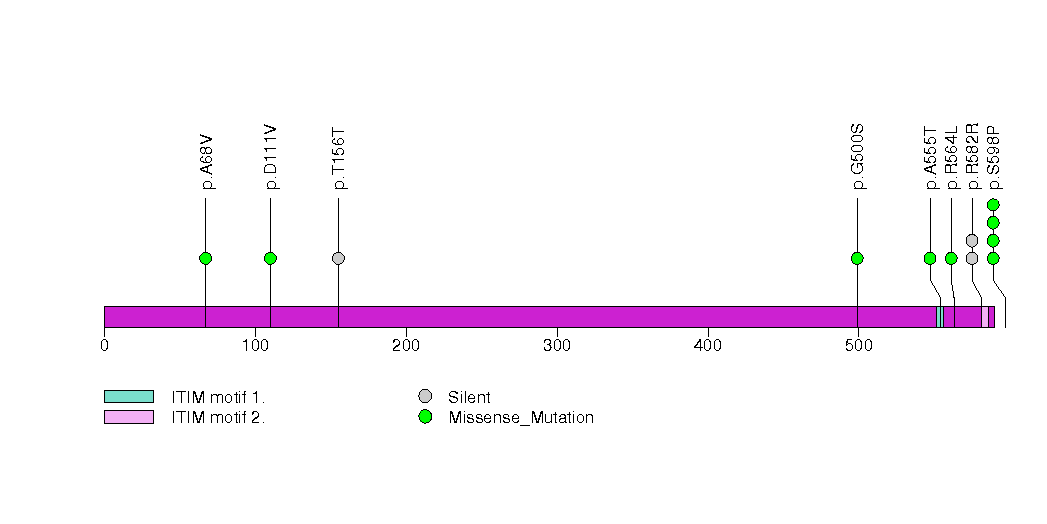
| 31 | LILRB5 | leukocyte immunoglobulin-like receptor, subfamily B (with TM and ITIM domains), member 5 | 739094 | 9 | 9 | 6 | 3 | 1 | 2 | 4 | 2 | 0 | 0 | 2.63e-05 | 0.59 | 0.36 | 0.48 | 0.53 | 0.000169 | 0.0988 |
| 32 | PLCB4 | phospholipase C, beta 4 | 1569155 | 8 | 8 | 8 | 0 | 0 | 3 | 0 | 4 | 1 | 0 | 0.000204 | 0.16 | 0.061 | 0.12 | 0.073 | 0.000179 | 0.101 |
| 33 | APC | adenomatous polyposis coli | 3641798 | 9 | 9 | 9 | 0 | 1 | 1 | 0 | 0 | 7 | 0 | 0.00782 | 0.23 | 0.00087 | 0.96 | 0.0021 | 0.000194 | 0.106 |
| 34 | OR5D18 | olfactory receptor, family 5, subfamily D, member 18 | 401533 | 5 | 5 | 5 | 0 | 2 | 1 | 1 | 1 | 0 | 0 | 2.25e-05 | 0.14 | 0.54 | 0.88 | 0.75 | 0.000202 | 0.107 |
| 35 | GIGYF2 | GRB10 interacting GYF protein 2 | 1563667 | 8 | 8 | 8 | 0 | 1 | 0 | 2 | 2 | 3 | 0 | 0.000266 | 0.16 | 0.38 | 0.037 | 0.071 | 0.000225 | 0.116 |
Figure S1. This figure depicts the distribution of mutations and mutation types across the SPOP significant gene.
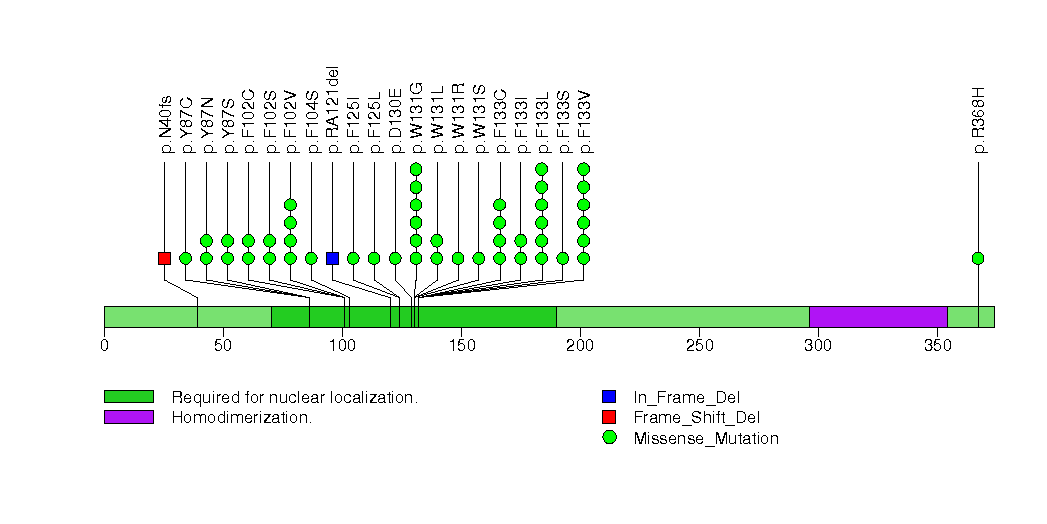
Figure S2. This figure depicts the distribution of mutations and mutation types across the TP53 significant gene.

Figure S3. This figure depicts the distribution of mutations and mutation types across the FOXA1 significant gene.
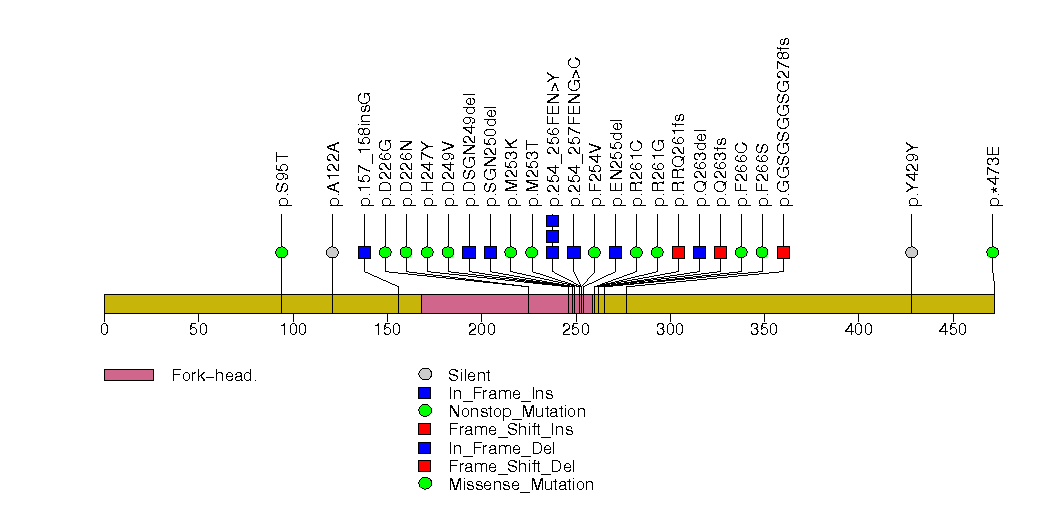
Figure S4. This figure depicts the distribution of mutations and mutation types across the CTNNB1 significant gene.

Figure S5. This figure depicts the distribution of mutations and mutation types across the KIDINS220 significant gene.

Figure S6. This figure depicts the distribution of mutations and mutation types across the SLC27A4 significant gene.
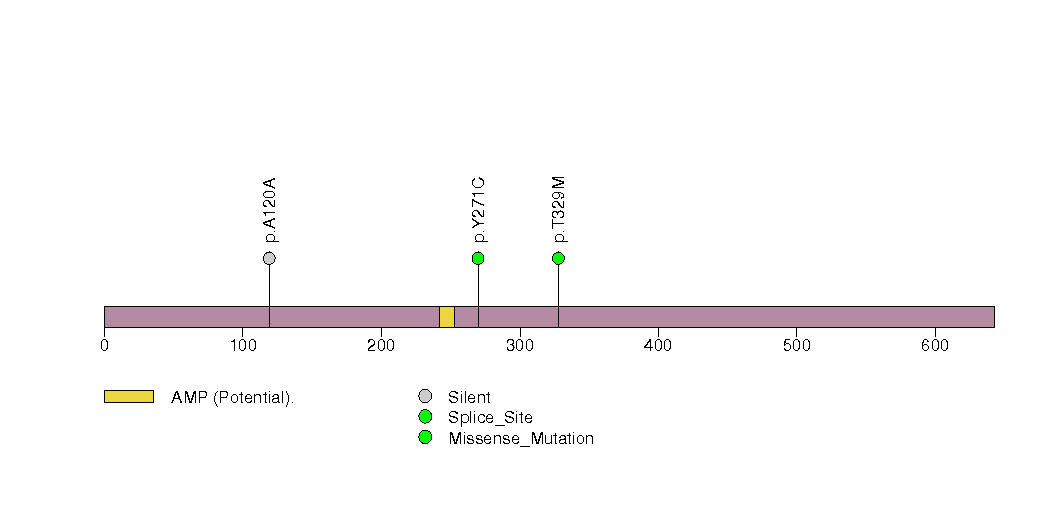
Figure S7. This figure depicts the distribution of mutations and mutation types across the PTEN significant gene.
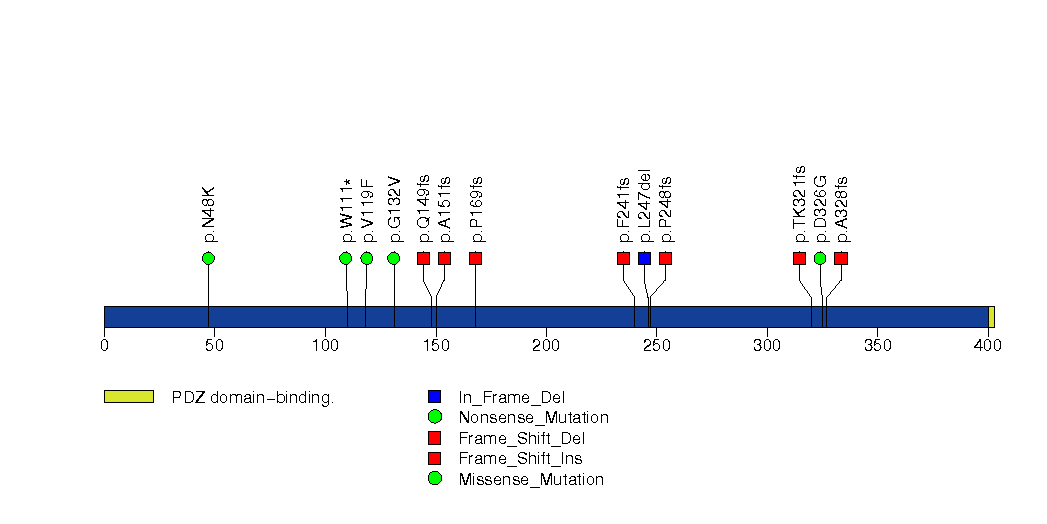
Figure S8. This figure depicts the distribution of mutations and mutation types across the IDH1 significant gene.

Figure S9. This figure depicts the distribution of mutations and mutation types across the ATM significant gene.
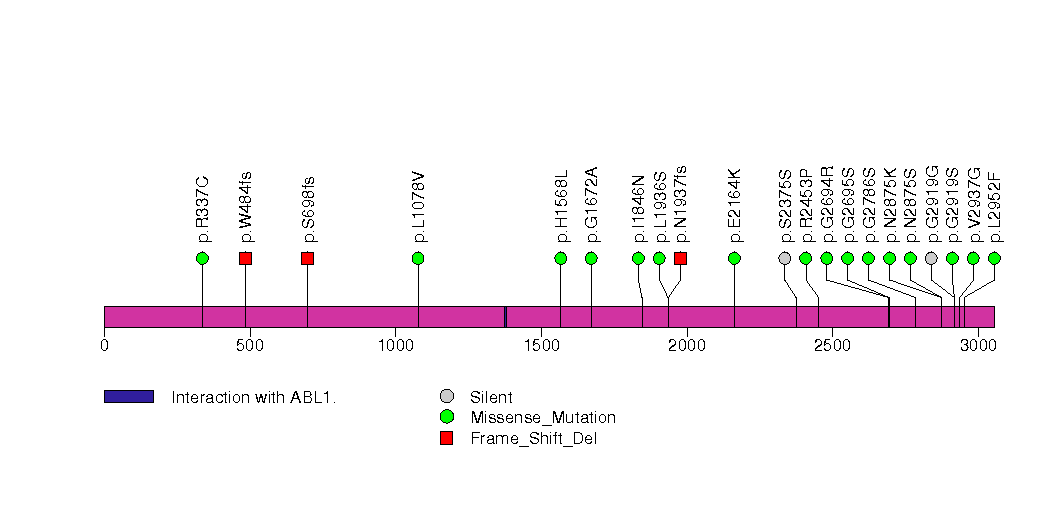
Figure S10. This figure depicts the distribution of mutations and mutation types across the EMG1 significant gene.
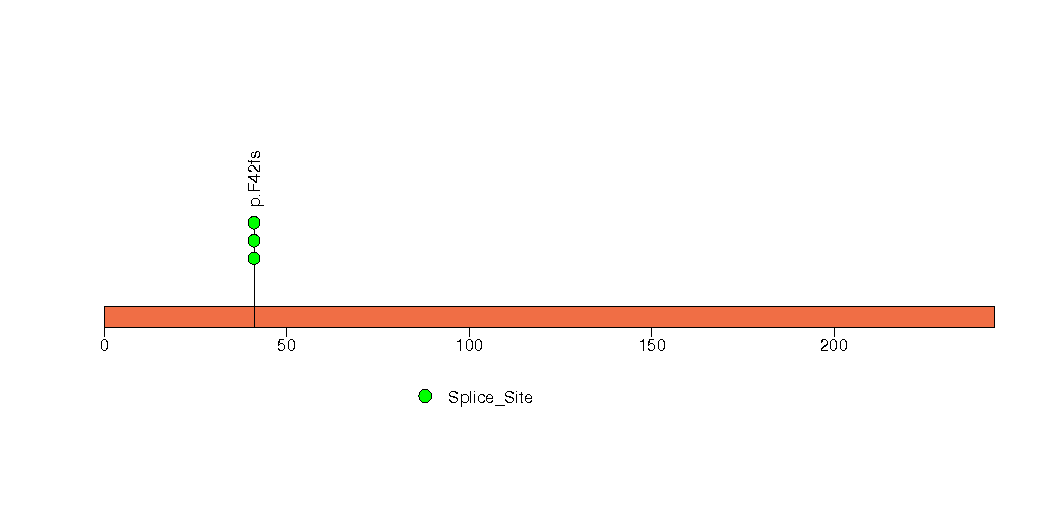
Figure S11. This figure depicts the distribution of mutations and mutation types across the BRAF significant gene.
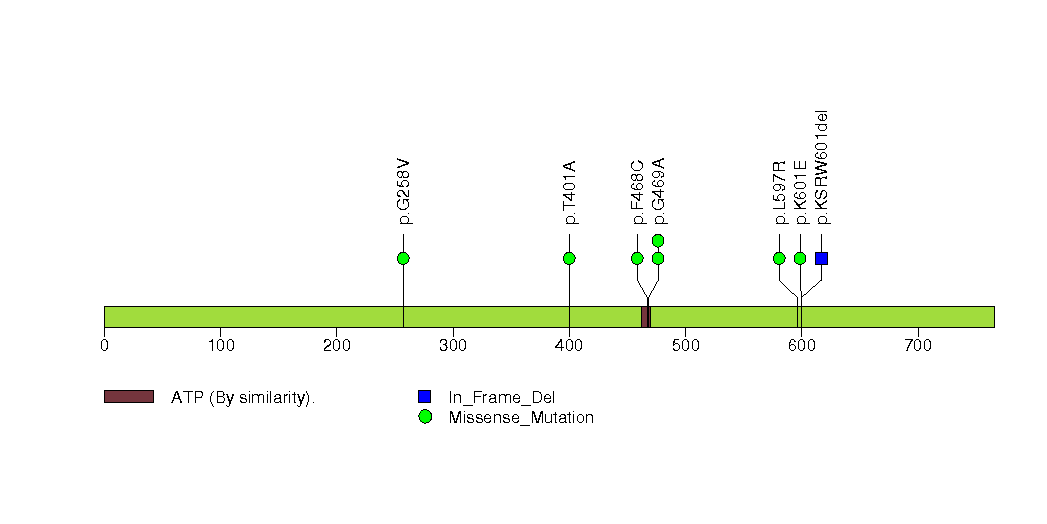
Figure S12. This figure depicts the distribution of mutations and mutation types across the NKX3-1 significant gene.
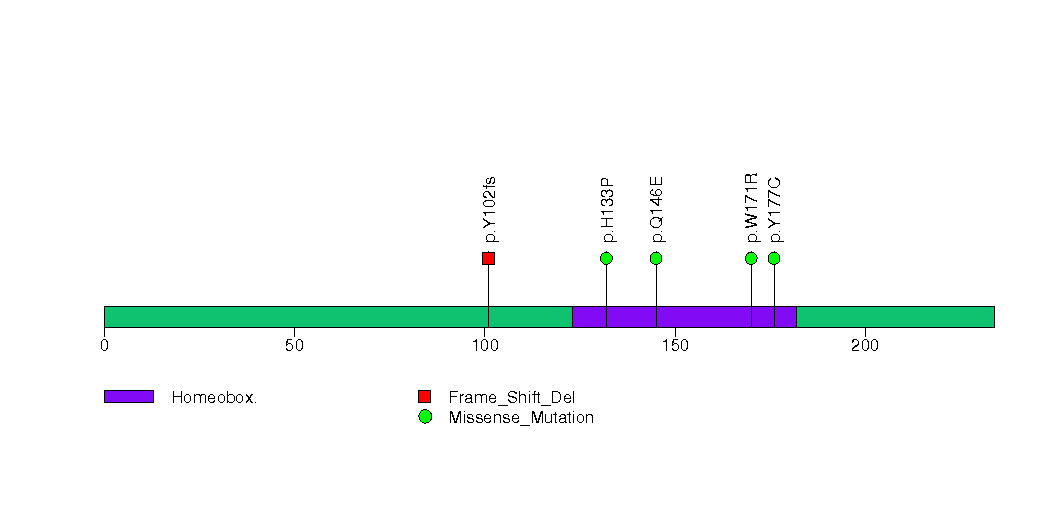
Figure S13. This figure depicts the distribution of mutations and mutation types across the OR4P4 significant gene.
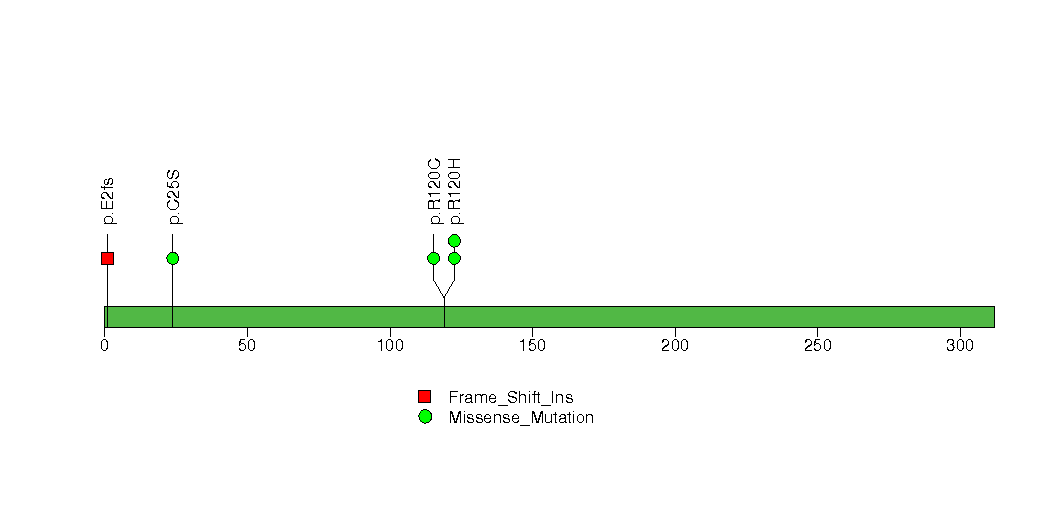
Figure S14. This figure depicts the distribution of mutations and mutation types across the MED12 significant gene.
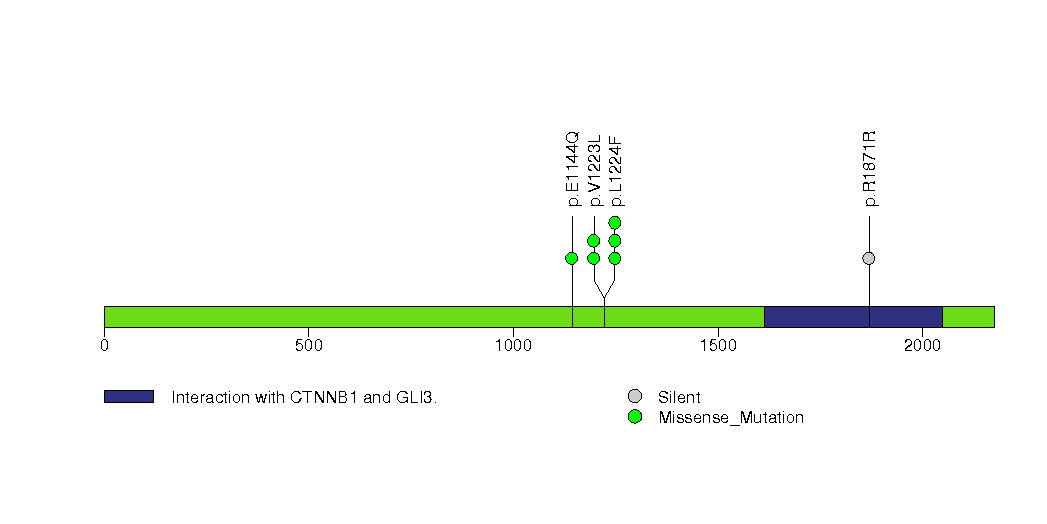
Figure S15. This figure depicts the distribution of mutations and mutation types across the OR4D5 significant gene.
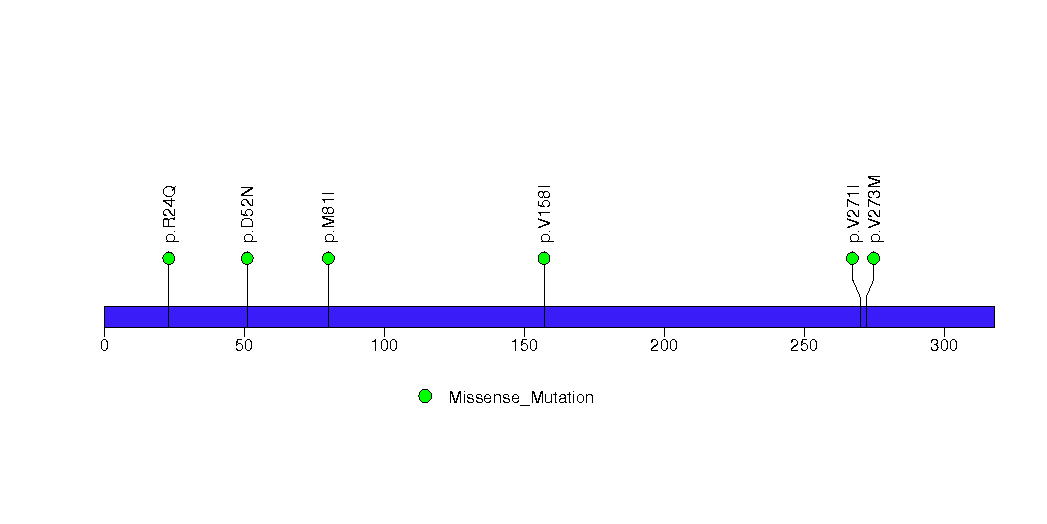
Figure S16. This figure depicts the distribution of mutations and mutation types across the COL11A1 significant gene.
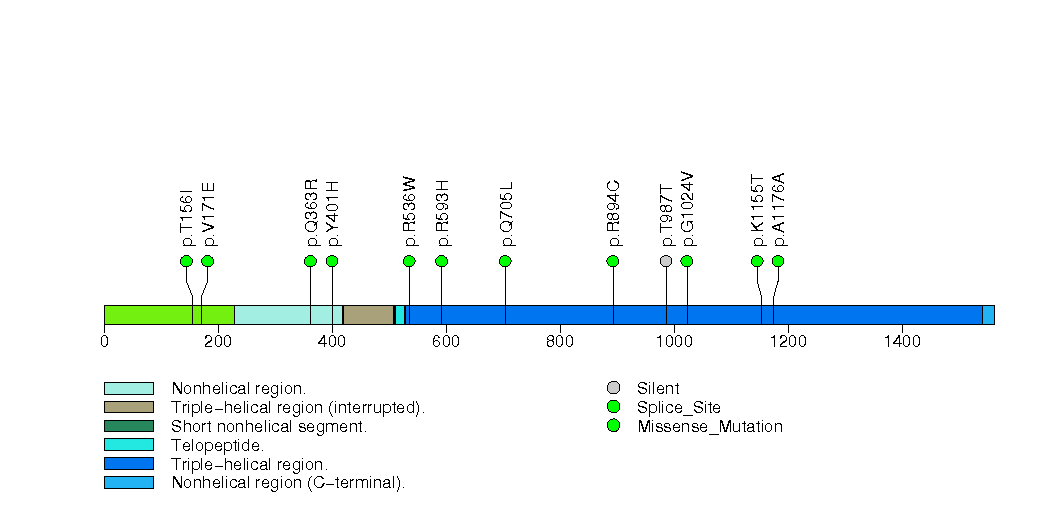
Figure S17. This figure depicts the distribution of mutations and mutation types across the NTM significant gene.
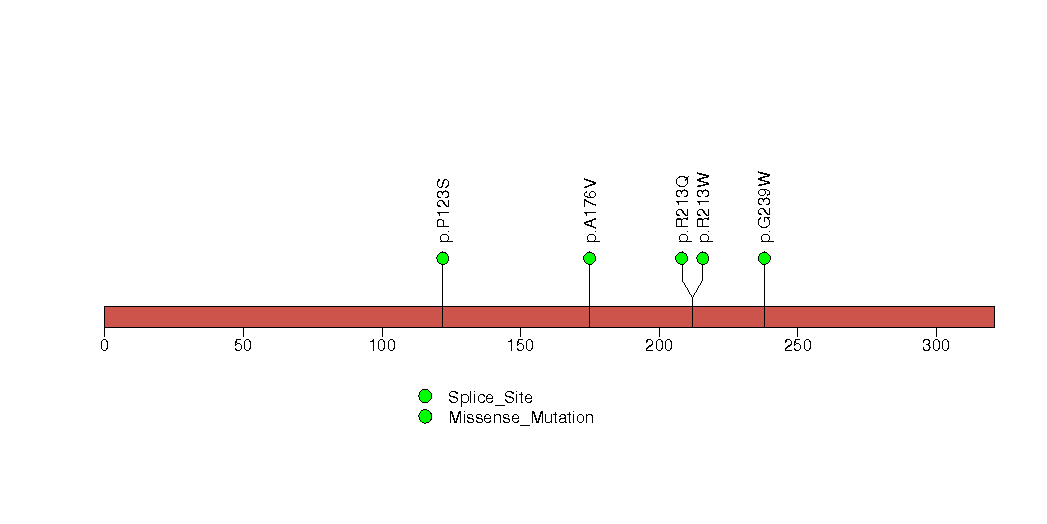
Figure S18. This figure depicts the distribution of mutations and mutation types across the HRAS significant gene.
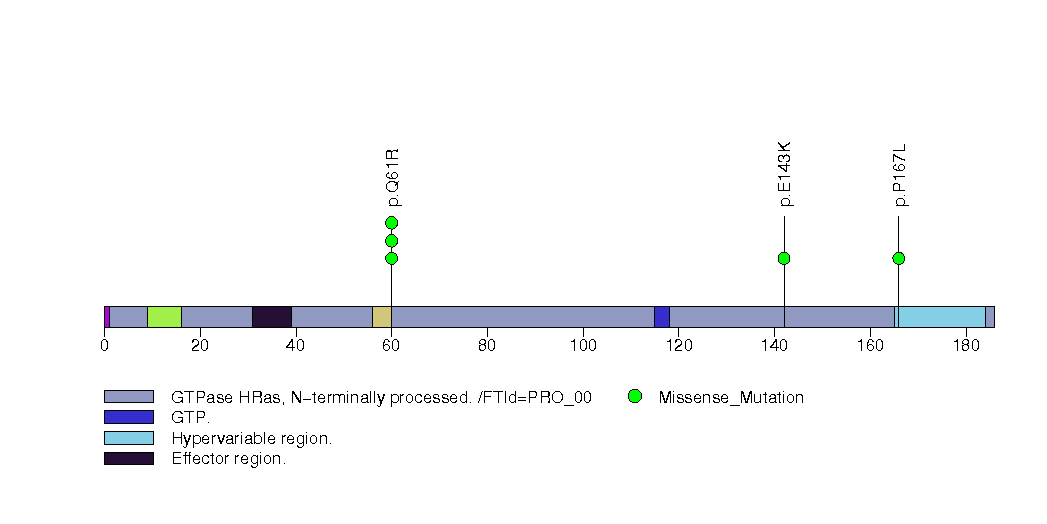
Figure S19. This figure depicts the distribution of mutations and mutation types across the LCE2D significant gene.

Figure S20. This figure depicts the distribution of mutations and mutation types across the BHLHE22 significant gene.
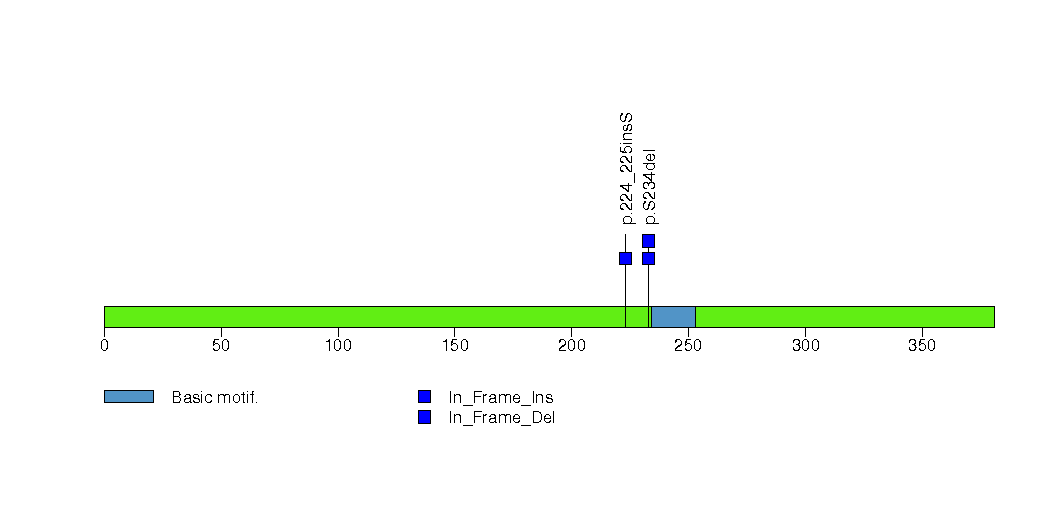
Figure S21. This figure depicts the distribution of mutations and mutation types across the LMOD2 significant gene.
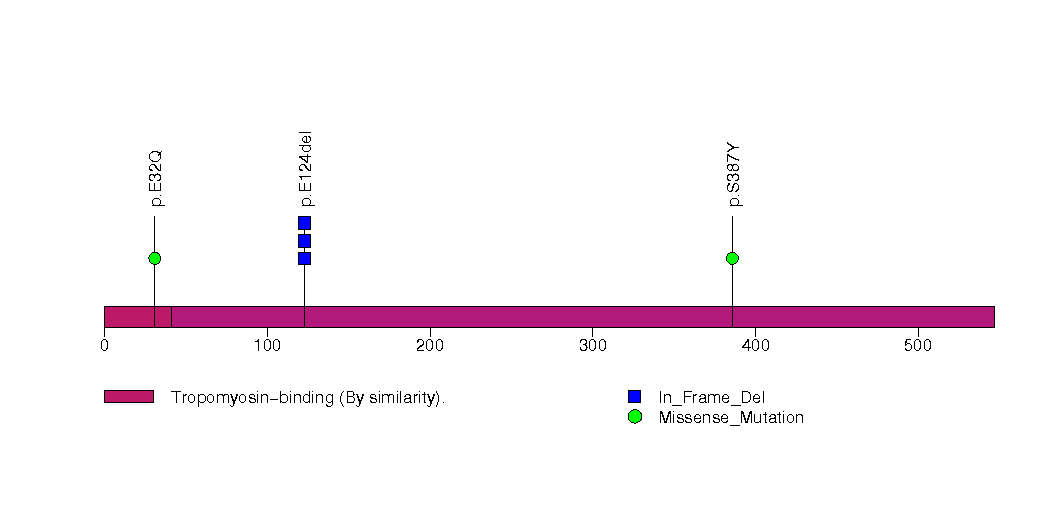
Figure S22. This figure depicts the distribution of mutations and mutation types across the EPB41L3 significant gene.
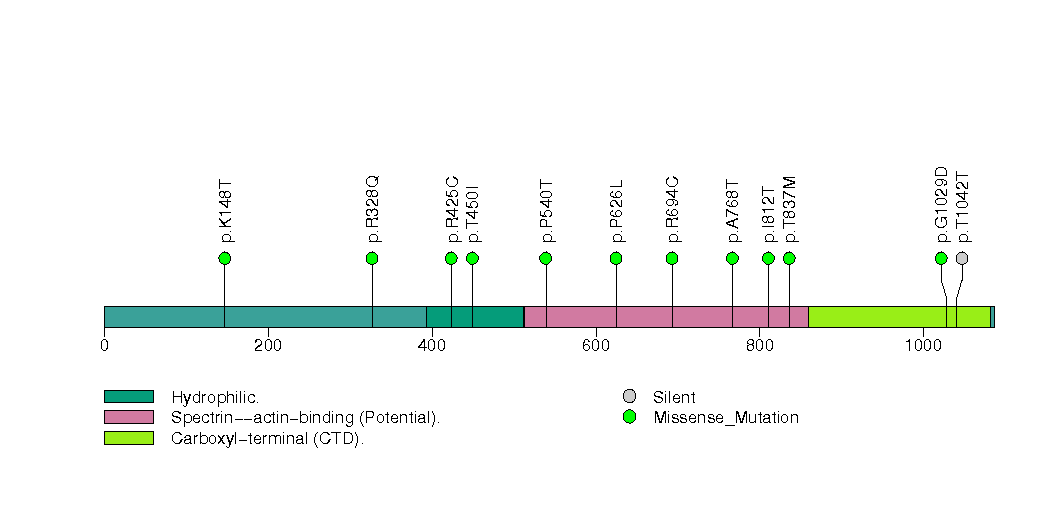
Figure S23. This figure depicts the distribution of mutations and mutation types across the SALL1 significant gene.
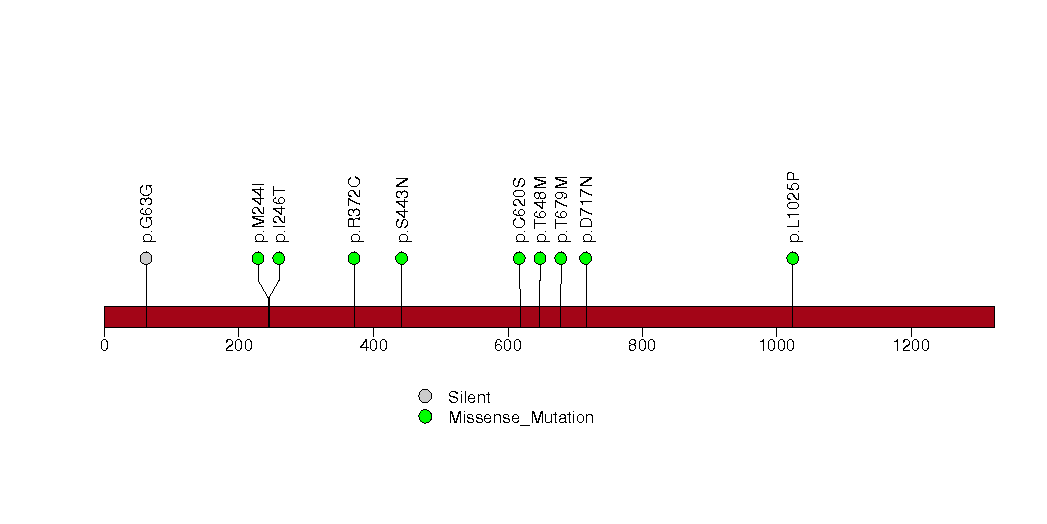
Figure S24. This figure depicts the distribution of mutations and mutation types across the RAG1 significant gene.
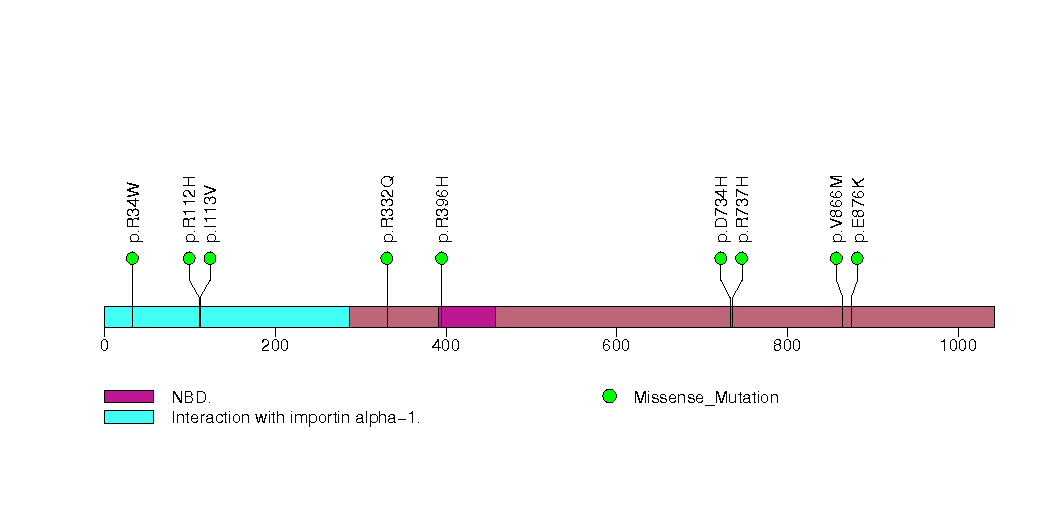
Figure S25. This figure depicts the distribution of mutations and mutation types across the KDM6A significant gene.
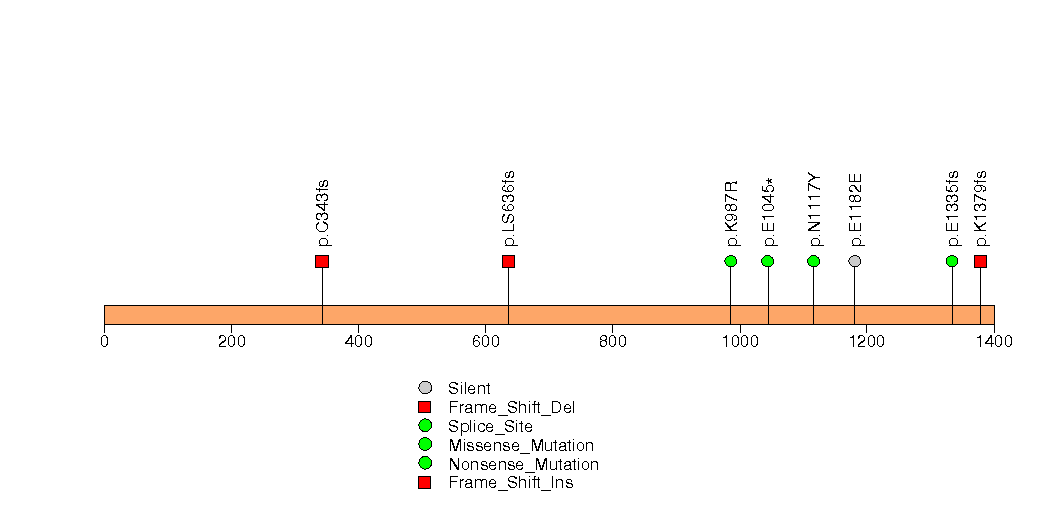
Figure S26. This figure depicts the distribution of mutations and mutation types across the MUC17 significant gene.
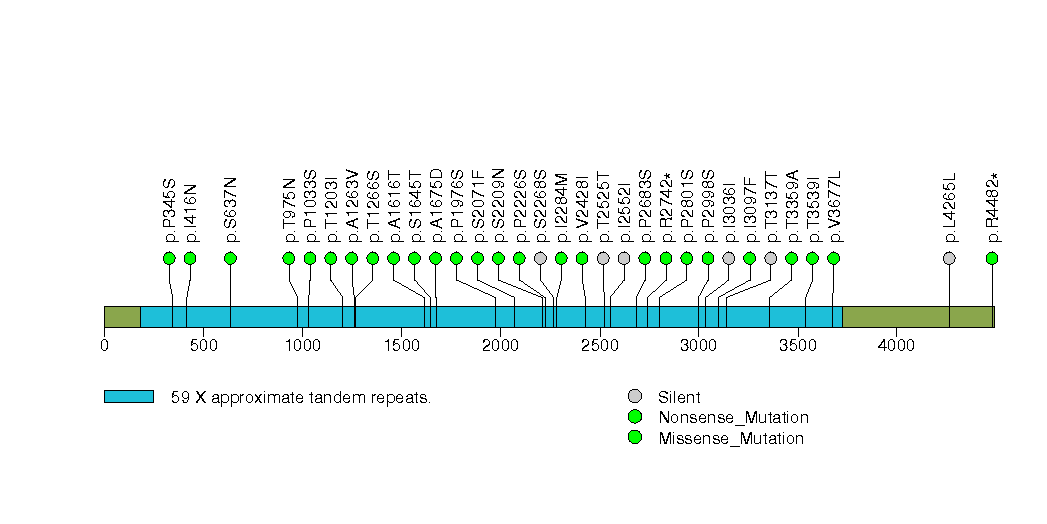
Figure S27. This figure depicts the distribution of mutations and mutation types across the ANO4 significant gene.
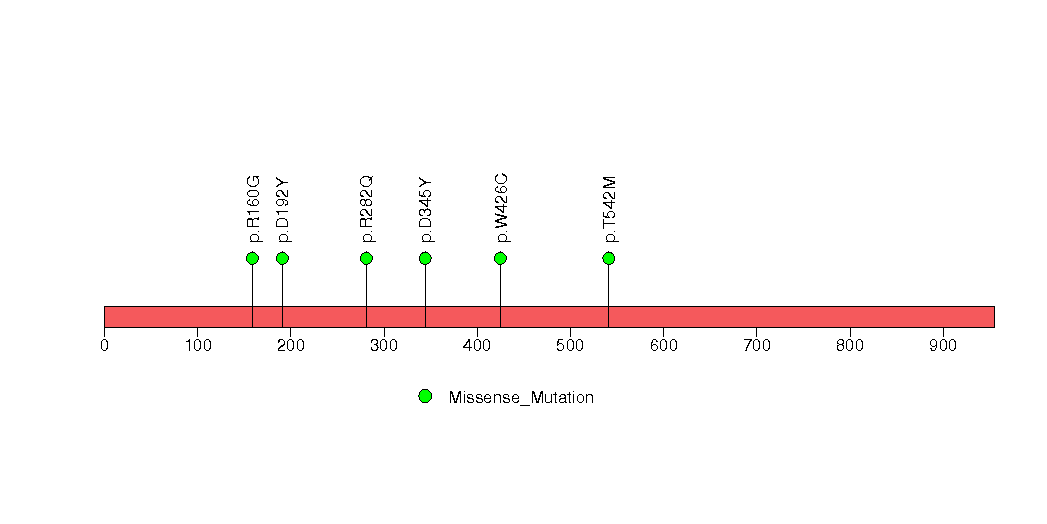
Figure S28. This figure depicts the distribution of mutations and mutation types across the RPL11 significant gene.
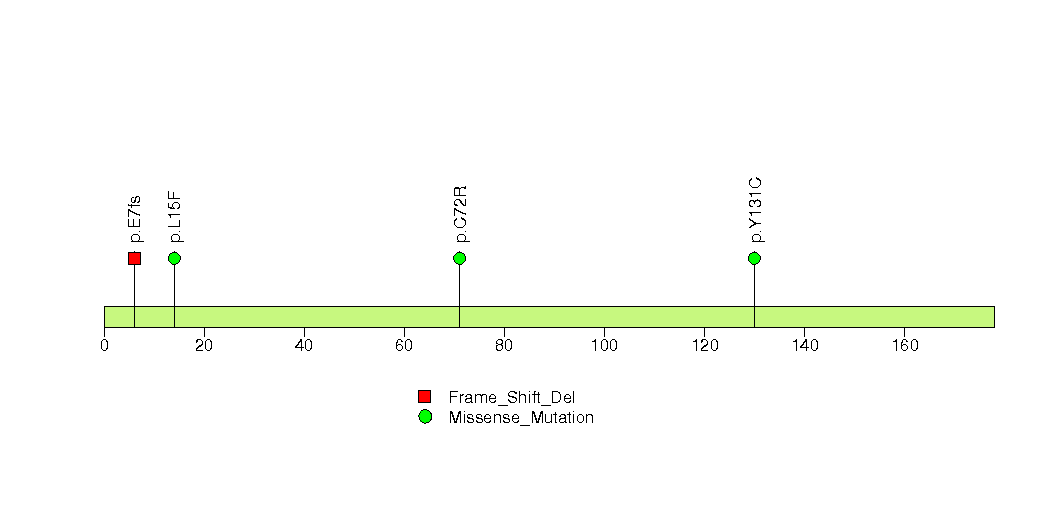
Figure S29. This figure depicts the distribution of mutations and mutation types across the GRIA1 significant gene.
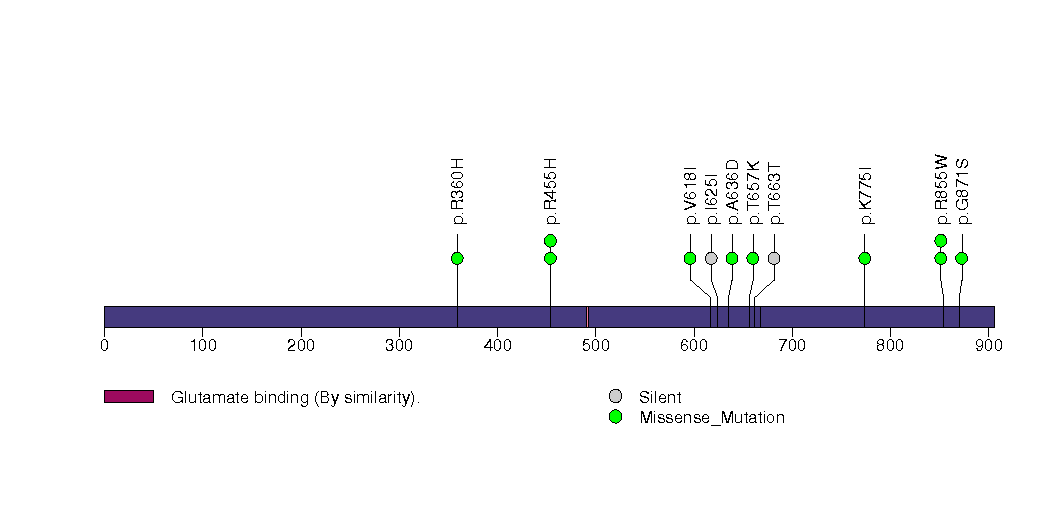
Figure S30. This figure depicts the distribution of mutations and mutation types across the ZMYM3 significant gene.
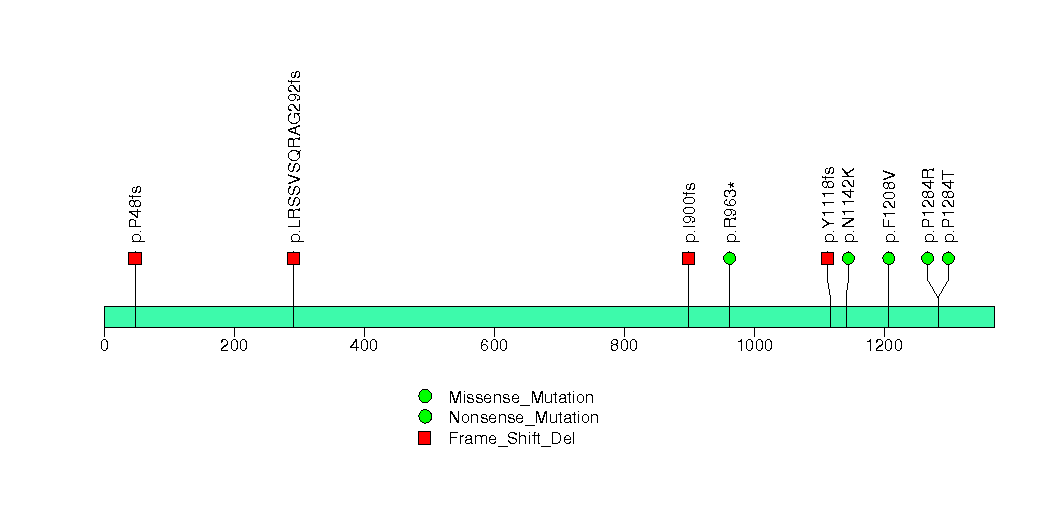
Figure S31. This figure depicts the distribution of mutations and mutation types across the LILRB5 significant gene.
In this analysis, COSMIC is used as a filter to increase power by restricting the territory of each gene. Cosmic version: v48.
Table 4. Get Full Table Significantly mutated genes (COSMIC territory only). To access the database please go to: COSMIC. Number of significant genes found: 10. Number of genes displayed: 10
| rank | gene | description | n | cos | n_cos | N_cos | cos_ev | p | q |
|---|---|---|---|---|---|---|---|---|---|
| 1 | IDH1 | isocitrate dehydrogenase 1 (NADP+), soluble | 5 | 5 | 5 | 2125 | 7460 | 0 | 0 |
| 2 | TP53 | tumor protein p53 | 44 | 356 | 42 | 151300 | 10513 | 0 | 0 |
| 3 | CTNNB1 | catenin (cadherin-associated protein), beta 1, 88kDa | 11 | 138 | 10 | 58650 | 3980 | 0 | 0 |
| 4 | PIK3CA | phosphoinositide-3-kinase, catalytic, alpha polypeptide | 12 | 220 | 11 | 93500 | 2941 | 0 | 0 |
| 5 | PTEN | phosphatase and tensin homolog (mutated in multiple advanced cancers 1) | 14 | 767 | 14 | 325975 | 201 | 0 | 0 |
| 6 | BRAF | v-raf murine sarcoma viral oncogene homolog B1 | 8 | 89 | 6 | 37825 | 14422 | 1.1e-11 | 8.6e-09 |
| 7 | SMAD4 | SMAD family member 4 | 5 | 159 | 5 | 67575 | 21 | 2.8e-08 | 0.000018 |
| 8 | HRAS | v-Ha-ras Harvey rat sarcoma viral oncogene homolog | 5 | 19 | 3 | 8075 | 624 | 1.5e-07 | 0.000086 |
| 9 | APC | adenomatous polyposis coli | 9 | 839 | 7 | 356575 | 82 | 3.7e-07 | 0.00019 |
| 10 | ATM | ataxia telangiectasia mutated | 19 | 245 | 4 | 104125 | 9 | 9.4e-06 | 0.0042 |
Note:
n - number of (nonsilent) mutations in this gene across the individual set.
cos = number of unique mutated sites in this gene in COSMIC
n_cos = overlap between n and cos.
N_cos = number of individuals times cos.
cos_ev = total evidence: number of reports in COSMIC for mutations seen in this gene.
p = p-value for seeing the observed amount of overlap in this gene)
q = q-value, False Discovery Rate (Benjamini-Hochberg procedure)
Table 5. Get Full Table A Ranked List of Significantly Mutated Genesets. (Source: MSigDB GSEA Cannonical Pathway Set).Number of significant genesets found: 28. Number of genesets displayed: 10
| rank | geneset | description | genes | N_genes | mut_tally | N | n | npat | nsite | nsil | n1 | n2 | n3 | n4 | n5 | n6 | p_ns_s | p | q |
|---|---|---|---|---|---|---|---|---|---|---|---|---|---|---|---|---|---|---|---|
| 1 | ARFPATHWAY | Cyclin-dependent kinase inhibitor 2A is a tumor suppressor that induces G1 arrest and can activate the p53 pathway, leading to G2/M arrest. | ABL1, CDKN2A, E2F1, MDM2, MYC, PIK3CA, PIK3R1, POLR1A, POLR1B, POLR1C, POLR1D, RAC1, RB1, TBX2, TP53, TWIST1 | 16 | ABL1(4), CDKN2A(1), MDM2(1), MYC(1), PIK3CA(12), PIK3R1(1), POLR1A(3), POLR1B(2), POLR1C(2), RAC1(1), RB1(2), TP53(44) | 12835679 | 74 | 64 | 63 | 3 | 18 | 9 | 10 | 18 | 18 | 1 | 4.5e-06 | <1.00e-15 | <3.42e-13 |
| 2 | CHEMICALPATHWAY | DNA damage promotes Bid cleavage, which stimulates mitochondrial cytochrome c release and consequent caspase activation, resulting in apoptosis. | ADPRT, AKT1, APAF1, ATM, BAD, BAX, BCL2, BCL2L1, BID, CASP3, CASP6, CASP7, CASP9, CYCS, EIF2S1, PRKCA, PRKCB1, PTK2, PXN, STAT1, TLN1, TP53 | 20 | AKT1(3), APAF1(1), ATM(19), PRKCA(2), PTK2(2), PXN(2), STAT1(1), TLN1(2), TP53(44) | 17314480 | 76 | 69 | 65 | 3 | 17 | 16 | 7 | 18 | 18 | 0 | 2e-06 | 2.89e-15 | 3.42e-13 |
| 3 | ATMPATHWAY | The tumor-suppressing protein kinase ATM responds to radiation-induced DNA damage by blocking cell-cycle progression and activating DNA repair. | ABL1, ATM, BRCA1, CDKN1A, CHEK1, CHEK2, GADD45A, JUN, MAPK8, MDM2, MRE11A, NBS1, NFKB1, NFKBIA, RAD50, RAD51, RBBP8, RELA, TP53, TP73 | 19 | ABL1(4), ATM(19), BRCA1(1), CDKN1A(2), MDM2(1), RAD51(1), RELA(2), TP53(44) | 18857861 | 74 | 63 | 64 | 2 | 17 | 13 | 9 | 16 | 19 | 0 | 1.9e-06 | 3.00e-15 | 3.42e-13 |
| 4 | PLK3PATHWAY | Active Plk3 phosphorylates CDC25c, blocking the G2/M transition, and phosphorylates p53 to induce apoptosis. | ATM, ATR, CDC25C, CHEK1, CHEK2, CNK, TP53, YWHAH | 7 | ATM(19), ATR(2), TP53(44), YWHAH(1) | 10128130 | 66 | 59 | 56 | 3 | 15 | 13 | 7 | 15 | 16 | 0 | 0.00016 | 3.44e-15 | 3.42e-13 |
| 5 | P53PATHWAY | p53 induces cell cycle arrest or apoptosis under conditions of DNA damage. | APAF1, ATM, BAX, BCL2, CCND1, CCNE1, CDK2, CDK4, CDKN1A, E2F1, GADD45A, MDM2, PCNA, RB1, TIMP3, TP53 | 16 | APAF1(1), ATM(19), CDKN1A(2), MDM2(1), PCNA(1), RB1(2), TP53(44) | 11449972 | 70 | 63 | 60 | 4 | 16 | 13 | 8 | 14 | 18 | 1 | 0.000045 | 3.55e-15 | 3.42e-13 |
| 6 | SA_G1_AND_S_PHASES | Cdk2, 4, and 6 bind cyclin D in G1, while cdk2/cyclin E promotes the G1/S transition. | ARF1, ARF3, CCND1, CDK2, CDK4, CDKN1A, CDKN1B, CDKN2A, CFL1, E2F1, E2F2, MDM2, NXT1, PRB1, TP53 | 15 | CDKN1A(2), CDKN1B(5), CDKN2A(1), CFL1(1), MDM2(1), TP53(44) | 5318254 | 54 | 51 | 44 | 2 | 15 | 6 | 5 | 7 | 21 | 0 | 0.00015 | 4.00e-15 | 3.42e-13 |
| 7 | RNAPATHWAY | dsRNA-activated protein kinase phosphorylates elF2a, which generally inhibits translation, and activates NF-kB to provoke inflammation. | CHUK, DNAJC3, EIF2S1, EIF2S2, MAP3K14, NFKB1, NFKBIA, PRKR, RELA, TP53 | 9 | RELA(2), TP53(44) | 6125460 | 46 | 43 | 36 | 1 | 13 | 7 | 6 | 7 | 13 | 0 | 0.000067 | 4.00e-15 | 3.42e-13 |
| 8 | P53HYPOXIAPATHWAY | Hypoxia induces p53 accumulation and consequent apoptosis with p53-mediated cell cycle arrest, which is present under conditions of DNA damage. | ABCB1, AKT1, ATM, BAX, CDKN1A, CPB2, CSNK1A1, CSNK1D, FHL2, GADD45A, HIC1, HIF1A, HSPA1A, HSPCA, IGFBP3, MAPK8, MDM2, NFKBIB, NQO1, TP53 | 19 | ABCB1(4), AKT1(3), ATM(19), CDKN1A(2), CPB2(1), HIC1(3), MDM2(1), NFKBIB(1), NQO1(1), TP53(44) | 13113380 | 79 | 71 | 68 | 3 | 21 | 15 | 8 | 16 | 19 | 0 | 9.8e-07 | 4.44e-15 | 3.42e-13 |
| 9 | TERTPATHWAY | hTERC, the RNA subunit of telomerase, and hTERT, the catalytic protein subunit, are required for telomerase activity and are overexpressed in many cancers. | HDAC1, MAX, MYC, SP1, SP3, TP53, WT1, ZNF42 | 7 | MYC(1), SP1(2), SP3(3), TP53(44) | 4446201 | 50 | 47 | 40 | 1 | 13 | 7 | 5 | 10 | 15 | 0 | 0.000012 | 5.11e-15 | 3.50e-13 |
| 10 | PMLPATHWAY | Ring-shaped PML nuclear bodies regulate transcription and are required co-activators in p53- and DAXX-mediated apoptosis. | CREBBP, DAXX, HRAS, PAX3, PML, PRAM-1, RARA, RB1, SIRT1, SP100, TNF, TNFRSF1A, TNFRSF1B, TNFRSF6, TNFSF6, TP53, UBL1 | 13 | CREBBP(5), DAXX(1), HRAS(5), PAX3(3), PML(3), RB1(2), SIRT1(2), SP100(2), TNF(1), TP53(44) | 11978829 | 68 | 64 | 56 | 6 | 22 | 8 | 13 | 10 | 14 | 1 | 0.00012 | 6.55e-15 | 4.03e-13 |
Table 6. Get Full Table A Ranked List of Significantly Mutated Genesets (Excluding Significantly Mutated Genes). Number of significant genesets found: 0. Number of genesets displayed: 10
| rank | geneset | description | genes | N_genes | mut_tally | N | n | npat | nsite | nsil | n1 | n2 | n3 | n4 | n5 | n6 | p_ns_s | p | q |
|---|---|---|---|---|---|---|---|---|---|---|---|---|---|---|---|---|---|---|---|
| 1 | LONGEVITYPATHWAY | Caloric restriction in animals often increases lifespan, which may occur via decreased IGF receptor expression and consequent expression of stress-resistance proteins. | AKT1, CAT, FOXO3A, GH1, GHR, HRAS, IGF1, IGF1R, PIK3CA, PIK3R1, SHC1, SOD1, SOD2, SOD3 | 12 | AKT1(3), CAT(2), GH1(2), GHR(1), IGF1R(2), PIK3CA(12), PIK3R1(1), SHC1(2), SOD2(1), SOD3(1) | 8140334 | 27 | 26 | 25 | 3 | 6 | 6 | 4 | 9 | 2 | 0 | 0.038 | 0.00061 | 0.38 |
| 2 | HSA00902_MONOTERPENOID_BIOSYNTHESIS | Genes involved in monoterpenoid biosynthesis | CYP2C19, CYP2C9 | 2 | CYP2C19(3), CYP2C9(2) | 1280663 | 5 | 5 | 5 | 0 | 3 | 1 | 0 | 1 | 0 | 0 | 0.25 | 0.0024 | 0.76 |
| 3 | PTENPATHWAY | PTEN suppresses AKT-induced cell proliferation and antagonizes the action of PI3K. | AKT1, BCAR1, CDKN1B, FOXO3A, GRB2, ILK, ITGB1, MAPK1, MAPK3, PDK2, PDPK1, PIK3CA, PIK3R1, PTEN, PTK2, SHC1, SOS1, TNFSF6 | 15 | AKT1(3), BCAR1(1), CDKN1B(5), GRB2(1), MAPK1(1), PDK2(1), PDPK1(1), PIK3CA(12), PIK3R1(1), PTK2(2), SHC1(2), SOS1(1) | 11641639 | 31 | 27 | 29 | 3 | 8 | 8 | 2 | 7 | 6 | 0 | 0.027 | 0.0077 | 1 |
| 4 | AKTPATHWAY | Second messenger PIP3 promotes cell survival by activating the anti-apoptotic kinase AKT. | AKT1, BAD, CASP9, CHUK, FOXO1A, FOXO3A, GH1, GHR, HSPCA, MLLT7, NFKB1, NFKBIA, PDPK1, PIK3CA, PIK3R1, PPP2CA, RELA, TNFSF6, YWHAH | 14 | AKT1(3), GH1(2), GHR(1), PDPK1(1), PIK3CA(12), PIK3R1(1), PPP2CA(1), RELA(2), YWHAH(1) | 8894992 | 24 | 23 | 22 | 3 | 4 | 8 | 3 | 8 | 1 | 0 | 0.059 | 0.0086 | 1 |
| 5 | NEUROTRANSMITTERSPATHWAY | Biosynthesis of neurotransmitters | DBH, GAD1, HDC, PNMT, TH, TPH1 | 6 | DBH(5), GAD1(2), HDC(1), PNMT(1), TPH1(1) | 3802340 | 10 | 10 | 10 | 0 | 5 | 1 | 2 | 2 | 0 | 0 | 0.03 | 0.025 | 1 |
| 6 | ACETAMINOPHENPATHWAY | Acetaminophen selectively inhibits Cox-3, which is localized to the brain, and yields the toxic metabolite NAPQI when processed by CAR in the liver. | CYP1A2, CYP2E1, CYP3A, NR1I3, PTGS1, PTGS2 | 5 | CYP1A2(1), NR1I3(2), PTGS1(2), PTGS2(3) | 3380190 | 8 | 8 | 8 | 1 | 2 | 3 | 0 | 2 | 1 | 0 | 0.2 | 0.029 | 1 |
| 7 | TRKAPATHWAY | Nerve growth factor (NGF) promotes neuronal survival and proliferation by binding its receptor TrkA, which activates PI3K/AKT, Ras, and the MAP kinase pathway. | AKT1, DPM2, GRB2, HRAS, KLK2, NGFB, NTRK1, PIK3CA, PIK3R1, PLCG1, PRKCA, PRKCB1, SHC1, SOS1 | 11 | AKT1(3), GRB2(1), KLK2(1), NTRK1(4), PIK3CA(12), PIK3R1(1), PLCG1(1), PRKCA(2), SHC1(2), SOS1(1) | 9556750 | 28 | 24 | 26 | 4 | 8 | 9 | 2 | 7 | 2 | 0 | 0.055 | 0.034 | 1 |
| 8 | GSK3PATHWAY | Bacterial lipopolysaccharide activates AKT to promote the survival and activation of macrophages and inhibits Gsk3-beta to promote beta-catenin accumulation in the nucleus. | AKT1, APC, AXIN1, CCND1, CD14, CTNNB1, DVL1, FZD1, GJA1, GNAI1, GSK3B, IRAK1, LBP, LEF1, LY96, MYD88, NFKB1, PDPK1, PIK3CA, PIK3R1, PPP2CA, PRKR, RELA, TIRAP, TLR4, TOLLIP, WNT1 | 25 | AKT1(3), APC(9), CD14(1), FZD1(2), GJA1(1), GNAI1(1), GSK3B(1), IRAK1(1), LEF1(2), LY96(1), PDPK1(1), PIK3CA(12), PIK3R1(1), PPP2CA(1), RELA(2), TLR4(1) | 18339151 | 40 | 38 | 38 | 5 | 9 | 9 | 5 | 8 | 9 | 0 | 0.0084 | 0.041 | 1 |
| 9 | ARFPATHWAY | Cyclin-dependent kinase inhibitor 2A is a tumor suppressor that induces G1 arrest and can activate the p53 pathway, leading to G2/M arrest. | ABL1, CDKN2A, E2F1, MDM2, MYC, PIK3CA, PIK3R1, POLR1A, POLR1B, POLR1C, POLR1D, RAC1, RB1, TBX2, TP53, TWIST1 | 15 | ABL1(4), CDKN2A(1), MDM2(1), MYC(1), PIK3CA(12), PIK3R1(1), POLR1A(3), POLR1B(2), POLR1C(2), RAC1(1), RB1(2) | 12322001 | 30 | 24 | 29 | 3 | 5 | 3 | 5 | 11 | 5 | 1 | 0.045 | 0.058 | 1 |
| 10 | FATTY_ACID_BIOSYNTHESIS_PATH_2 | ACAA1, ACAA2, ACAT1, ACAT2, ECHS1, EHHADH, HADHA, HADHB, SDS | 9 | ACAA1(2), ACAA2(1), ACAT1(1), EHHADH(5), HADHB(1) | 5278494 | 10 | 10 | 10 | 0 | 3 | 1 | 1 | 3 | 2 | 0 | 0.073 | 0.067 | 1 |
In brief, we tabulate the number of mutations and the number of covered bases for each gene. The counts are broken down by mutation context category: four context categories that are discovered by MutSig, and one for indel and 'null' mutations, which include indels, nonsense mutations, splice-site mutations, and non-stop (read-through) mutations. For each gene, we calculate the probability of seeing the observed constellation of mutations, i.e. the product P1 x P2 x ... x Pm, or a more extreme one, given the background mutation rates calculated across the dataset. [1]
In addition to the links below, the full results of the analysis summarized in this report can also be downloaded programmatically using firehose_get, or interactively from either the Broad GDAC website or TCGA Data Coordination Center Portal.