This pipeline computes the correlation between significantly recurrent gene mutations and selected clinical features.
Testing the association between mutation status of 22 genes and 11 clinical features across 332 patients, 3 significant findings detected with Q value < 0.25.
-
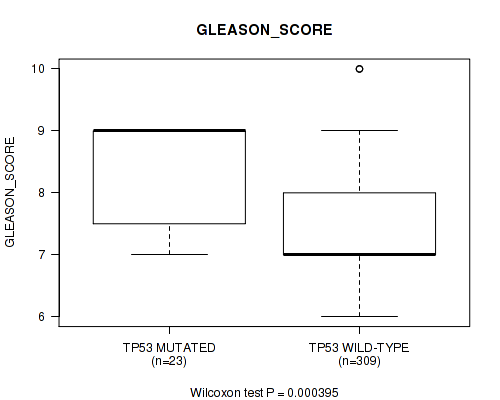
TP53 mutation correlated to 'GLEASON_SCORE'.
-
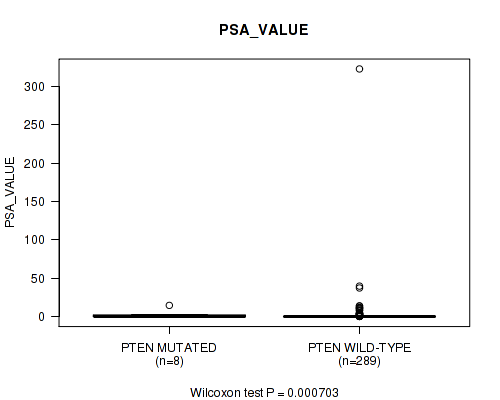
PTEN mutation correlated to 'PSA_VALUE'.
-
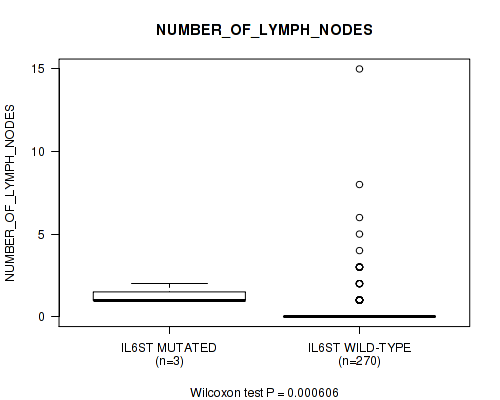
IL6ST mutation correlated to 'NUMBER_OF_LYMPH_NODES'.
Table 1. Get Full Table Overview of the association between mutation status of 22 genes and 11 clinical features. Shown in the table are P values (Q values). Thresholded by Q value < 0.25, 3 significant findings detected.
|
Clinical Features |
Time to Death |
YEARS TO BIRTH |
PATHOLOGY T STAGE |
PATHOLOGY N STAGE |
RADIATION THERAPY |
HISTOLOGICAL TYPE |
RESIDUAL TUMOR |
NUMBER OF LYMPH NODES |
GLEASON SCORE |
PSA VALUE |
RACE | ||
| nMutated (%) | nWild-Type | logrank test | Wilcoxon-test | Fisher's exact test | Fisher's exact test | Fisher's exact test | Fisher's exact test | Fisher's exact test | Wilcoxon-test | Wilcoxon-test | Wilcoxon-test | Fisher's exact test | |
| TP53 | 23 (7%) | 309 |
0.0582 (1.00) |
0.387 (1.00) |
0.186 (1.00) |
0.255 (1.00) |
0.17 (1.00) |
0.517 (1.00) |
0.751 (1.00) |
0.183 (1.00) |
0.000395 (0.0567) |
0.298 (1.00) |
1 (1.00) |
| PTEN | 9 (3%) | 323 |
0.775 (1.00) |
0.509 (1.00) |
0.568 (1.00) |
0.373 (1.00) |
1 (1.00) |
1 (1.00) |
0.761 (1.00) |
0.143 (1.00) |
0.659 (1.00) |
0.000703 (0.0567) |
1 (1.00) |
| IL6ST | 3 (1%) | 329 |
0.735 (1.00) |
0.188 (1.00) |
1 (1.00) |
0.00579 (0.32) |
0.331 (1.00) |
1 (1.00) |
0.284 (1.00) |
0.000606 (0.0567) |
0.0473 (1.00) |
||
| SPOP | 37 (11%) | 295 |
0.948 (1.00) |
0.161 (1.00) |
1 (1.00) |
0.352 (1.00) |
0.411 (1.00) |
1 (1.00) |
0.193 (1.00) |
0.34 (1.00) |
0.562 (1.00) |
0.999 (1.00) |
0.524 (1.00) |
| FOXA1 | 13 (4%) | 319 |
0.631 (1.00) |
0.1 (1.00) |
0.67 (1.00) |
0.701 (1.00) |
1 (1.00) |
1 (1.00) |
0.727 (1.00) |
0.588 (1.00) |
0.82 (1.00) |
0.89 (1.00) |
0.047 (1.00) |
| BRAF | 8 (2%) | 324 |
0.691 (1.00) |
0.522 (1.00) |
1 (1.00) |
0.641 (1.00) |
0.602 (1.00) |
0.219 (1.00) |
0.257 (1.00) |
0.773 (1.00) |
0.336 (1.00) |
0.201 (1.00) |
1 (1.00) |
| ATM | 13 (4%) | 319 |
0.139 (1.00) |
0.819 (1.00) |
0.0154 (0.534) |
1 (1.00) |
1 (1.00) |
1 (1.00) |
0.177 (1.00) |
0.728 (1.00) |
0.18 (1.00) |
0.708 (1.00) |
0.33 (1.00) |
| CTNNB1 | 8 (2%) | 324 |
0.528 (1.00) |
0.988 (1.00) |
0.758 (1.00) |
0.358 (1.00) |
1 (1.00) |
1 (1.00) |
0.144 (1.00) |
0.168 (1.00) |
0.53 (1.00) |
0.918 (1.00) |
1 (1.00) |
| MED12 | 6 (2%) | 326 |
0.723 (1.00) |
0.304 (1.00) |
0.302 (1.00) |
1 (1.00) |
1 (1.00) |
1 (1.00) |
0.108 (1.00) |
0.977 (1.00) |
0.151 (1.00) |
0.878 (1.00) |
1 (1.00) |
| KDM6A | 6 (2%) | 326 |
0.786 (1.00) |
0.21 (1.00) |
0.00865 (0.349) |
0.596 (1.00) |
1 (1.00) |
1 (1.00) |
0.0559 (1.00) |
0.235 (1.00) |
0.151 (1.00) |
0.996 (1.00) |
1 (1.00) |
| MLL2 | 11 (3%) | 321 |
0.609 (1.00) |
0.944 (1.00) |
0.62 (1.00) |
1 (1.00) |
1 (1.00) |
1 (1.00) |
0.833 (1.00) |
0.936 (1.00) |
0.726 (1.00) |
0.77 (1.00) |
1 (1.00) |
| AKT1 | 3 (1%) | 329 |
0.822 (1.00) |
0.941 (1.00) |
0.588 (1.00) |
0.455 (1.00) |
1 (1.00) |
1 (1.00) |
1 (1.00) |
0.61 (1.00) |
0.902 (1.00) |
0.917 (1.00) |
|
| HRAS | 4 (1%) | 328 |
0.762 (1.00) |
0.951 (1.00) |
0.674 (1.00) |
1 (1.00) |
1 (1.00) |
1 (1.00) |
1 (1.00) |
0.334 (1.00) |
0.66 (1.00) |
0.993 (1.00) |
|
| XPO5 | 3 (1%) | 329 |
0.786 (1.00) |
0.254 (1.00) |
1 (1.00) |
1 (1.00) |
1 (1.00) |
1 (1.00) |
0.613 (1.00) |
0.405 (1.00) |
0.902 (1.00) |
0.349 (1.00) |
|
| KLHL2 | 4 (1%) | 328 |
0.779 (1.00) |
0.0909 (1.00) |
1 (1.00) |
1 (1.00) |
0.331 (1.00) |
0.116 (1.00) |
0.646 (1.00) |
0.334 (1.00) |
0.856 (1.00) |
0.0736 (1.00) |
1 (1.00) |
| ZMYM3 | 6 (2%) | 326 |
0.85 (1.00) |
0.275 (1.00) |
0.47 (1.00) |
0.226 (1.00) |
0.0776 (1.00) |
1 (1.00) |
0.169 (1.00) |
0.239 (1.00) |
0.188 (1.00) |
0.152 (1.00) |
1 (1.00) |
| AMFR | 3 (1%) | 329 |
0.13 (1.00) |
0.588 (1.00) |
1 (1.00) |
0.235 (1.00) |
1 (1.00) |
1 (1.00) |
0.0925 (1.00) |
0.642 (1.00) |
0.179 (1.00) |
||
| CDK12 | 6 (2%) | 326 |
0.721 (1.00) |
0.112 (1.00) |
0.469 (1.00) |
0.301 (1.00) |
0.165 (1.00) |
0.169 (1.00) |
0.498 (1.00) |
0.304 (1.00) |
0.229 (1.00) |
0.951 (1.00) |
|
| NKX3-1 | 4 (1%) | 328 |
0.754 (1.00) |
0.801 (1.00) |
0.063 (1.00) |
1 (1.00) |
1 (1.00) |
1 (1.00) |
0.643 (1.00) |
0.334 (1.00) |
0.0797 (1.00) |
0.453 (1.00) |
1 (1.00) |
| IRF4 | 4 (1%) | 328 |
0.715 (1.00) |
0.164 (1.00) |
1 (1.00) |
0.332 (1.00) |
0.00662 (0.32) |
1 (1.00) |
0.0247 (0.747) |
0.423 (1.00) |
1 (1.00) |
||
| ASH1L | 7 (2%) | 325 |
0.74 (1.00) |
0.489 (1.00) |
0.74 (1.00) |
1 (1.00) |
1 (1.00) |
1 (1.00) |
0.4 (1.00) |
0.694 (1.00) |
0.546 (1.00) |
0.669 (1.00) |
1 (1.00) |
| MLL3 | 13 (4%) | 319 |
0.0342 (0.92) |
0.914 (1.00) |
1 (1.00) |
1 (1.00) |
0.146 (1.00) |
0.333 (1.00) |
0.54 (1.00) |
0.913 (1.00) |
0.649 (1.00) |
0.92 (1.00) |
1 (1.00) |
P value = 0.000395 (Wilcoxon-test), Q value = 0.057
Table S1. Gene #2: 'TP53 MUTATION STATUS' versus Clinical Feature #9: 'GLEASON_SCORE'
| nPatients | Mean (Std.Dev) | |
|---|---|---|
| ALL | 332 | 7.6 (1.0) |
| TP53 MUTATED | 23 | 8.3 (0.9) |
| TP53 WILD-TYPE | 309 | 7.5 (1.0) |
Figure S1. Get High-res Image Gene #2: 'TP53 MUTATION STATUS' versus Clinical Feature #9: 'GLEASON_SCORE'
P value = 0.000703 (Wilcoxon-test), Q value = 0.057
Table S2. Gene #5: 'PTEN MUTATION STATUS' versus Clinical Feature #10: 'PSA_VALUE'
| nPatients | Mean (Std.Dev) | |
|---|---|---|
| ALL | 297 | 2.0 (19.1) |
| PTEN MUTATED | 8 | 2.6 (5.0) |
| PTEN WILD-TYPE | 289 | 2.0 (19.3) |
Figure S2. Get High-res Image Gene #5: 'PTEN MUTATION STATUS' versus Clinical Feature #10: 'PSA_VALUE'
P value = 0.000606 (Wilcoxon-test), Q value = 0.057
Table S3. Gene #17: 'IL6ST MUTATION STATUS' versus Clinical Feature #8: 'NUMBER_OF_LYMPH_NODES'
| nPatients | Mean (Std.Dev) | |
|---|---|---|
| ALL | 273 | 0.4 (1.3) |
| IL6ST MUTATED | 3 | 1.3 (0.6) |
| IL6ST WILD-TYPE | 270 | 0.4 (1.3) |
Figure S3. Get High-res Image Gene #17: 'IL6ST MUTATION STATUS' versus Clinical Feature #8: 'NUMBER_OF_LYMPH_NODES'
-
Mutation data file = sample_sig_gene_table.txt from Mutsig_2CV pipeline
-
Processed Mutation data file = /xchip/cga/gdac-prod/tcga-gdac/jobResults/GDAC_Correlate_Genomic_Events_Preprocess/PRAD-TP/20064819/transformed.cor.cli.txt
-
Clinical data file = /xchip/cga/gdac-prod/tcga-gdac/jobResults/Append_Data/PRAD-TP/19775467/PRAD-TP.merged_data.txt
-
Number of patients = 332
-
Number of significantly mutated genes = 22
-
Number of selected clinical features = 11
-
Exclude genes that fewer than K tumors have mutations, K = 3
For survival clinical features, the Kaplan-Meier survival curves of tumors with and without gene mutations were plotted and the statistical significance P values were estimated by logrank test (Bland and Altman 2004) using the 'survdiff' function in R
For binary or multi-class clinical features (nominal or ordinal), two-tailed Fisher's exact tests (Fisher 1922) were used to estimate the P values using the 'fisher.test' function in R
For multiple hypothesis correction, Q value is the False Discovery Rate (FDR) analogue of the P value (Benjamini and Hochberg 1995), defined as the minimum FDR at which the test may be called significant. We used the 'Benjamini and Hochberg' method of 'p.adjust' function in R to convert P values into Q values.
In addition to the links below, the full results of the analysis summarized in this report can also be downloaded programmatically using firehose_get, or interactively from either the Broad GDAC website or TCGA Data Coordination Center Portal.