This report serves to describe the mutational landscape and properties of a given individual set, as well as rank genes and genesets according to mutational significance. MutSig v2.0 was used to generate the results found in this report.
-
Working with individual set: SARC-TP
-
Number of patients in set: 245
The input for this pipeline is a set of individuals with the following files associated for each:
-
An annotated .maf file describing the mutations called for the respective individual, and their properties.
-
A .wig file that contains information about the coverage of the sample.
-
MAF used for this analysis:SARC-TP.final_analysis_set.maf
-
Blacklist used for this analysis: pancan_mutation_blacklist.v14.hg19.txt
-
Significantly mutated genes (q ≤ 0.1): 36
-
Mutations seen in COSMIC: 149
-
Significantly mutated genes in COSMIC territory: 6
-
Significantly mutated genesets: 33
-
Significantly mutated genesets: (excluding sig. mutated genes):0
-
Read 245 MAFs of type "maf1"
-
Total number of mutations in input MAFs: 26359
-
After removing 65 mutations outside chr1-24: 26294
-
After removing 792 blacklisted mutations: 25502
-
After removing 5238 noncoding mutations: 20264
-
After collapsing adjacent/redundant mutations: 20262
-
Number of mutations before filtering: 20262
-
After removing 1431 mutations outside gene set: 18831
-
After removing 48 mutations outside category set: 18783
Table 1. Get Full Table Table representing breakdown of mutations by type.
| type | count |
|---|---|
| De_novo_Start_InFrame | 3 |
| De_novo_Start_OutOfFrame | 6 |
| Frame_Shift_Del | 660 |
| Frame_Shift_Ins | 159 |
| In_Frame_Del | 252 |
| In_Frame_Ins | 81 |
| Missense_Mutation | 11514 |
| Nonsense_Mutation | 795 |
| Nonstop_Mutation | 19 |
| Silent | 4565 |
| Splice_Site | 699 |
| Start_Codon_Del | 6 |
| Start_Codon_Ins | 2 |
| Start_Codon_SNP | 17 |
| Stop_Codon_Del | 5 |
| Total | 18783 |
Table 2. Get Full Table A breakdown of mutation rates per category discovered for this individual set.
| category | n | N | rate | rate_per_mb | relative_rate | exp_ns_s_ratio |
|---|---|---|---|---|---|---|
| *CpG->T | 2084 | 421585855 | 4.9e-06 | 4.9 | 2.6 | 2.1 |
| *Cp(A/C/T)->T | 3701 | 3420700969 | 1.1e-06 | 1.1 | 0.57 | 1.7 |
| C->(G/A) | 3497 | 3842286824 | 9.1e-07 | 0.91 | 0.48 | 4.7 |
| A->mut | 2249 | 3666407405 | 6.1e-07 | 0.61 | 0.32 | 3.9 |
| indel+null | 2643 | 7508694229 | 3.5e-07 | 0.35 | 0.19 | NaN |
| double_null | 44 | 7508694229 | 5.9e-09 | 0.0059 | 0.0031 | NaN |
| Total | 14218 | 7508694229 | 1.9e-06 | 1.9 | 1 | 3.5 |
The x axis represents the samples. The y axis represents the exons, one row per exon, and they are sorted by average coverage across samples. For exons with exactly the same average coverage, they are sorted next by the %GC of the exon. (The secondary sort is especially useful for the zero-coverage exons at the bottom). If the figure is unpopulated, then full coverage is assumed (e.g. MutSig CV doesn't use WIGs and assumes full coverage).
Figure 1.
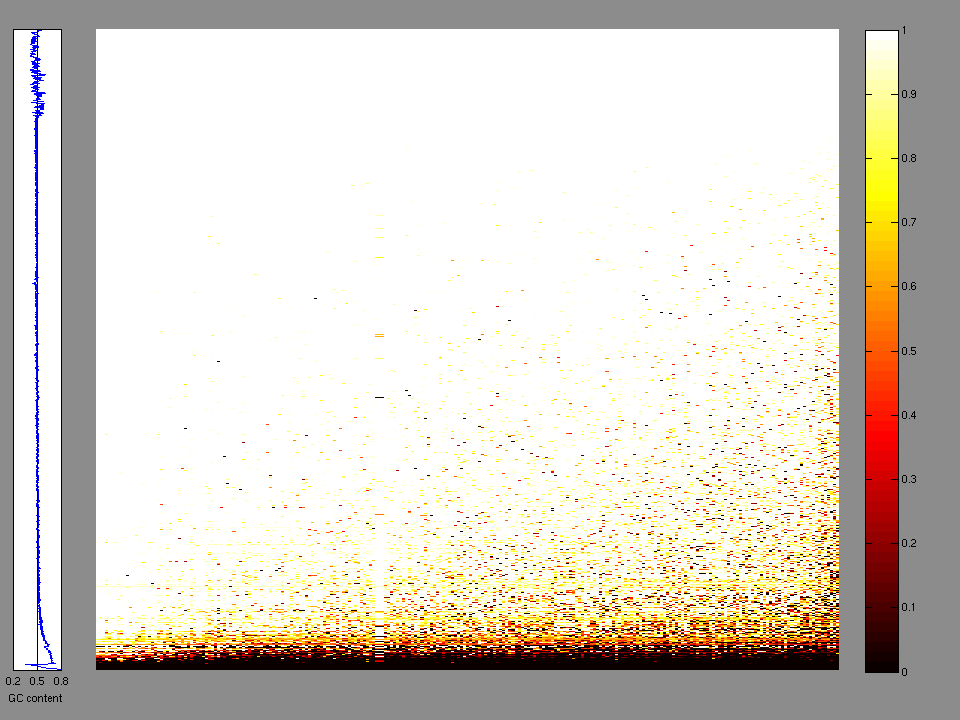
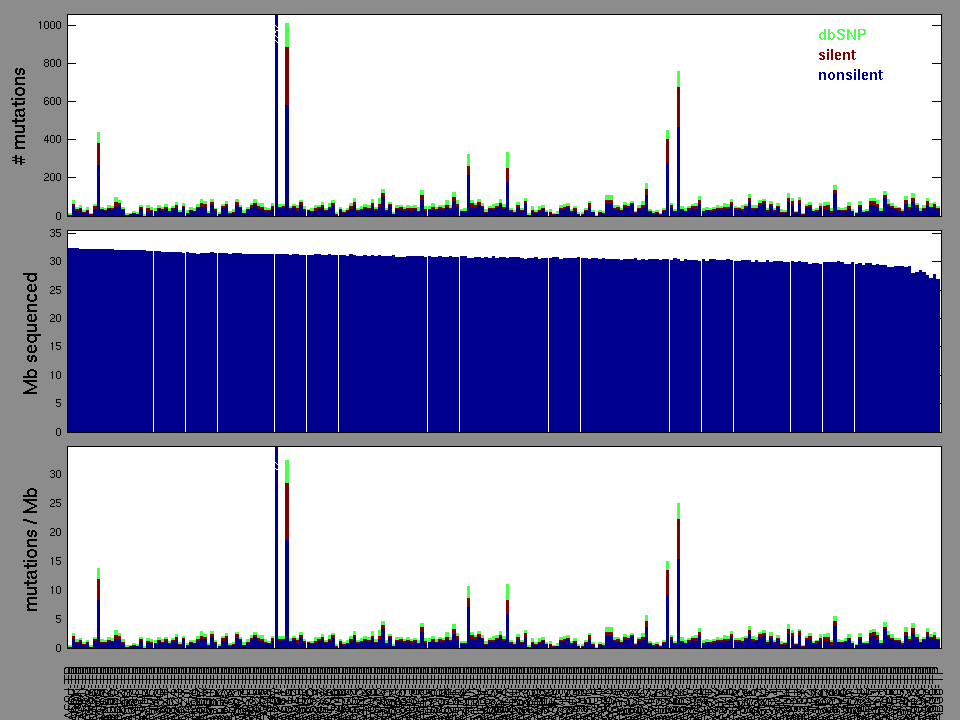
Figure 2. Patients counts and rates file used to generate this plot: SARC-TP.patients.counts_and_rates.txt
The mutation spectrum is depicted in the lego plots below in which the 96 possible mutation types are subdivided into six large blocks, color-coded to reflect the base substitution type. Each large block is further subdivided into the 16 possible pairs of 5' and 3' neighbors, as listed in the 4x4 trinucleotide context legend. The height of each block corresponds to the mutation frequency for that kind of mutation (counts of mutations normalized by the base coverage in a given bin). The shape of the spectrum is a signature for dominant mutational mechanisms in different tumor types.
Figure 3. Get High-res Image SNV Mutation rate lego plot for entire set. Each bin is normalized by base coverage for that bin. Colors represent the six SNV types on the upper right. The three-base context for each mutation is labeled in the 4x4 legend on the lower right. The fractional breakdown of SNV counts is shown in the pie chart on the upper left. If this figure is blank, not enough information was provided in the MAF to generate it.
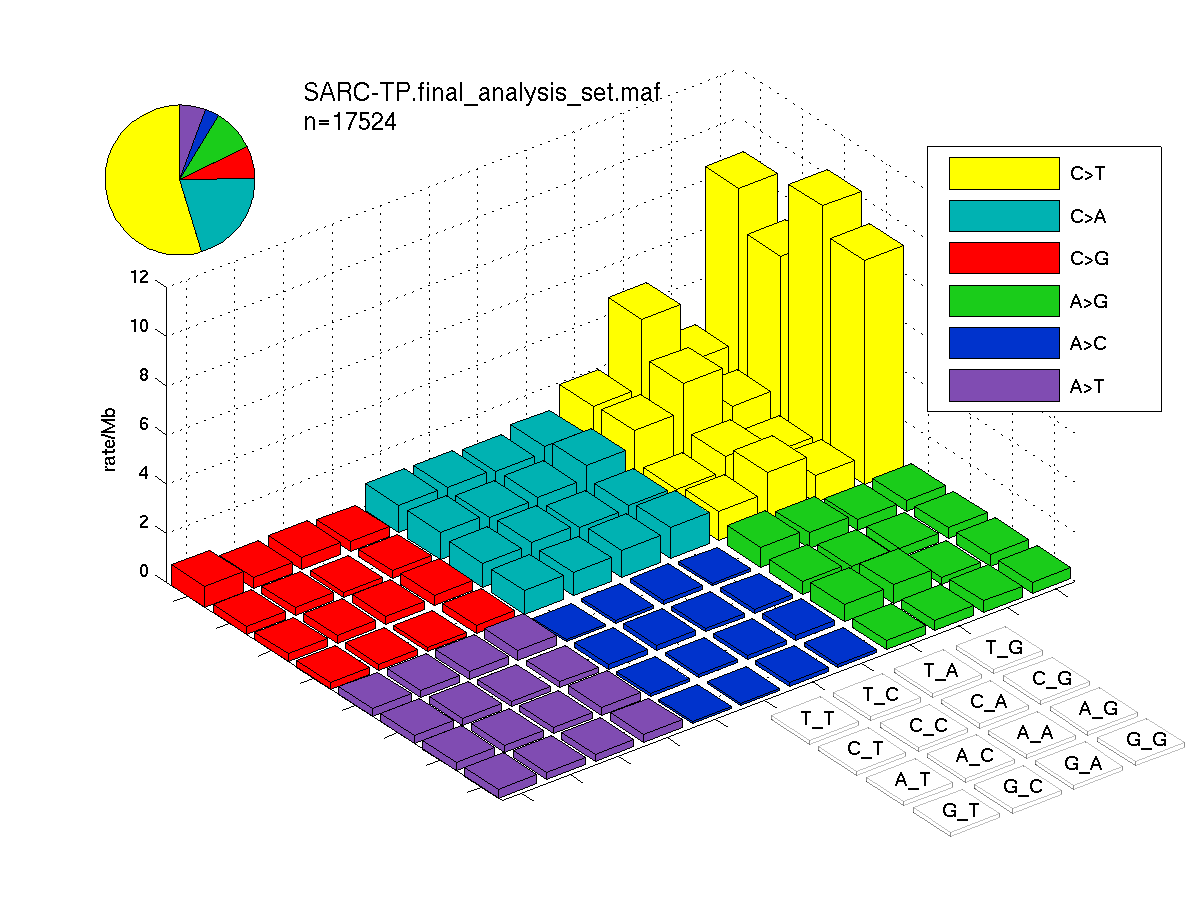
Figure 4. Get High-res Image SNV Mutation rate lego plots for 4 slices of mutation allele fraction (0<=AF<0.1, 0.1<=AF<0.25, 0.25<=AF<0.5, & 0.5<=AF) . The color code and three-base context legends are the same as the previous figure. If this figure is blank, not enough information was provided in the MAF to generate it.

Column Descriptions:
-
N = number of sequenced bases in this gene across the individual set
-
n = number of (nonsilent) mutations in this gene across the individual set
-
npat = number of patients (individuals) with at least one nonsilent mutation
-
nsite = number of unique sites having a non-silent mutation
-
nsil = number of silent mutations in this gene across the individual set
-
n1 = number of nonsilent mutations of type: *CpG->T
-
n2 = number of nonsilent mutations of type: *Cp(A/C/T)->T
-
n3 = number of nonsilent mutations of type: C->(G/A)
-
n4 = number of nonsilent mutations of type: A->mut
-
n5 = number of nonsilent mutations of type: indel+null
-
n6 = number of nonsilent mutations of type: double_null
-
p_classic = p-value for the observed amount of nonsilent mutations being elevated in this gene
-
p_ns_s = p-value for the observed nonsilent/silent ratio being elevated in this gene
-
p_cons = p-value for enrichment of mutations at evolutionarily most-conserved sites in gene
-
p_joint = p-value for clustering + conservation
-
p = p-value (overall)
-
q = q-value, False Discovery Rate (Benjamini-Hochberg procedure)
Table 3. Get Full Table A Ranked List of Significantly Mutated Genes. Number of significant genes found: 36. Number of genes displayed: 35. Click on a gene name to display its stick figure depicting the distribution of mutations and mutation types across the chosen gene (this feature may not be available for all significant genes).
| rank | gene | description | N | n | npat | nsite | nsil | n1 | n2 | n3 | n4 | n5 | n6 | p_classic | p_ns_s | p_clust | p_cons | p_joint | p | q |
|---|---|---|---|---|---|---|---|---|---|---|---|---|---|---|---|---|---|---|---|---|
| 1 | RB1 | retinoblastoma 1 (including osteosarcoma) | 585385 | 25 | 24 | 25 | 0 | 0 | 0 | 2 | 0 | 21 | 2 | <1.00e-15 | 0.038 | 0.0079 | 0.6 | 0.02 | <7.77e-16 | <3.08e-12 |
| 2 | TP53 | tumor protein p53 | 269597 | 89 | 84 | 75 | 3 | 10 | 11 | 10 | 18 | 40 | 0 | <1.00e-15 | 5.6e-07 | 0 | 0 | 0 | <1.00e-15 | <3.08e-12 |
| 3 | NUMBL | numb homolog (Drosophila)-like | 317270 | 9 | 9 | 1 | 0 | 0 | 0 | 0 | 0 | 9 | 0 | 6.74e-09 | 1 | 0 | 0.9 | 0 | <1.00e-15 | <3.08e-12 |
| 4 | MSH3 | mutS homolog 3 (E. coli) | 847520 | 8 | 7 | 4 | 2 | 0 | 0 | 0 | 0 | 7 | 1 | 2.82e-05 | 1 | 0 | 1 | 0 | <1.00e-15 | <3.08e-12 |
| 5 | WNK1 | WNK lysine deficient protein kinase 1 | 1865549 | 6 | 6 | 2 | 2 | 0 | 0 | 1 | 0 | 5 | 0 | 0.0621 | 0.99 | 0.0017 | 0.000024 | 0 | <1.00e-15 | <3.08e-12 |
| 6 | LMTK2 | lemur tyrosine kinase 2 | 1050704 | 2 | 2 | 2 | 2 | 1 | 0 | 0 | 0 | 1 | 0 | 0.819 | 0.85 | 1 | 0 | 0 | <1.00e-15 | <3.08e-12 |
| 7 | ATRX | alpha thalassemia/mental retardation syndrome X-linked (RAD54 homolog, S. cerevisiae) | 1709368 | 40 | 37 | 40 | 0 | 0 | 1 | 4 | 3 | 32 | 0 | 7.66e-15 | 0.0076 | 0.046 | 0.36 | 0.077 | 2.13e-14 | 5.63e-11 |
| 8 | LOR | loricrin | 73051 | 6 | 6 | 2 | 2 | 0 | 0 | 0 | 0 | 6 | 0 | 1.77e-10 | 1 | 2e-07 | 1 | 0.000017 | 1.04e-13 | 2.40e-10 |
| 9 | KRTAP2-2 | keratin associated protein 2-2 | 45502 | 4 | 4 | 1 | 0 | 0 | 0 | 0 | 0 | 4 | 0 | 4.65e-08 | 1 | 1e-06 | 0.8 | 0.000023 | 3.06e-11 | 6.28e-08 |
| 10 | KIAA0040 | KIAA0040 | 73441 | 5 | 5 | 2 | 0 | 0 | 0 | 0 | 0 | 5 | 0 | 3.34e-09 | 1 | 0.0002 | 0.32 | 0.00046 | 4.36e-11 | 8.07e-08 |
| 11 | PTEN | phosphatase and tensin homolog (mutated in multiple advanced cancers 1) | 289394 | 8 | 7 | 8 | 0 | 1 | 1 | 0 | 4 | 2 | 0 | 1.21e-08 | 0.19 | 0.026 | 0.037 | 0.0091 | 2.63e-09 | 4.42e-06 |
| 12 | KRTAP5-5 | keratin associated protein 5-5 | 170570 | 8 | 7 | 7 | 1 | 0 | 2 | 1 | 0 | 4 | 1 | 1.28e-09 | 0.6 | 0.14 | 0.48 | 0.23 | 6.83e-09 | 1.05e-05 |
| 13 | ANP32E | acidic (leucine-rich) nuclear phosphoprotein 32 family, member E | 203879 | 4 | 4 | 1 | 0 | 0 | 0 | 0 | 0 | 4 | 0 | 4.67e-05 | 1 | 1e-06 | 1 | 0.000024 | 2.42e-08 | 3.44e-05 |
| 14 | AR | androgen receptor (dihydrotestosterone receptor; testicular feminization; spinal and bulbar muscular atrophy; Kennedy disease) | 599982 | 5 | 5 | 4 | 1 | 0 | 0 | 1 | 3 | 1 | 0 | 0.00151 | 0.67 | 6.4e-06 | 1 | 0.000043 | 1.13e-06 | 0.00150 |
| 15 | EOMES | eomesodermin homolog (Xenopus laevis) | 384227 | 6 | 6 | 2 | 0 | 0 | 0 | 1 | 0 | 5 | 0 | 1.62e-05 | 0.81 | 0.0023 | 1 | 0.0049 | 1.37e-06 | 0.00169 |
| 16 | LTBP3 | latent transforming growth factor beta binding protein 3 | 674927 | 5 | 5 | 2 | 0 | 0 | 0 | 0 | 0 | 5 | 0 | 0.0115 | 1 | 0 | 0.8 | 9.4e-06 | 1.85e-06 | 0.00213 |
| 17 | PRB3 | proline-rich protein BstNI subfamily 3 | 216943 | 6 | 6 | 6 | 0 | 2 | 1 | 0 | 1 | 2 | 0 | 3.00e-07 | 0.25 | 0.5 | 0.62 | 0.64 | 3.18e-06 | 0.00346 |
| 18 | EFCAB2 | EF-hand calcium binding domain 2 | 119874 | 4 | 4 | 1 | 0 | 0 | 0 | 0 | 0 | 4 | 0 | 3.93e-06 | 1 | NaN | NaN | NaN | 3.93e-06 | 0.00402 |
| 19 | DCDC1 | doublecortin domain containing 1 | 260902 | 6 | 6 | 6 | 0 | 1 | 2 | 0 | 1 | 2 | 0 | 4.14e-06 | 0.16 | NaN | NaN | NaN | 4.14e-06 | 0.00402 |
| 20 | CYLC2 | cylicin, basic protein of sperm head cytoskeleton 2 | 222005 | 5 | 5 | 4 | 0 | 0 | 2 | 0 | 1 | 2 | 0 | 1.72e-05 | 0.4 | 0.021 | 1 | 0.045 | 1.16e-05 | 0.0107 |
| 21 | FOXD2 | forkhead box D2 | 120791 | 3 | 3 | 1 | 0 | 0 | 0 | 0 | 0 | 3 | 0 | 0.000487 | 1 | 0.00054 | 1 | 0.0027 | 1.91e-05 | 0.0168 |
| 22 | MMP3 | matrix metallopeptidase 3 (stromelysin 1, progelatinase) | 354235 | 6 | 6 | 5 | 1 | 1 | 0 | 2 | 0 | 3 | 0 | 1.51e-06 | 0.58 | 0.8 | 0.99 | 1 | 2.17e-05 | 0.0182 |
| 23 | PKD2 | polycystic kidney disease 2 (autosomal dominant) | 603162 | 6 | 6 | 3 | 0 | 0 | 1 | 1 | 0 | 4 | 0 | 0.000373 | 0.52 | 0.0017 | 0.52 | 0.0043 | 2.31e-05 | 0.0186 |
| 24 | USP8 | ubiquitin specific peptidase 8 | 804369 | 4 | 2 | 2 | 0 | 2 | 0 | 2 | 0 | 0 | 0 | 0.126 | 0.56 | 3.6e-06 | 0.8 | 0.000016 | 2.78e-05 | 0.0214 |
| 25 | SPHKAP | SPHK1 interactor, AKAP domain containing | 1165604 | 12 | 11 | 12 | 1 | 0 | 2 | 6 | 3 | 1 | 0 | 4.74e-06 | 0.22 | 0.29 | 0.65 | 0.51 | 3.39e-05 | 0.0250 |
| 26 | LHCGR | luteinizing hormone/choriogonadotropin receptor | 503006 | 6 | 6 | 4 | 0 | 0 | 1 | 0 | 0 | 5 | 0 | 9.93e-05 | 0.51 | 0.017 | 1 | 0.037 | 4.94e-05 | 0.0351 |
| 27 | C14orf39 | chromosome 14 open reading frame 39 | 440909 | 5 | 5 | 5 | 0 | 1 | 1 | 0 | 1 | 2 | 0 | 0.000163 | 0.26 | 0.097 | 0.049 | 0.03 | 6.46e-05 | 0.0435 |
| 28 | CCDC7 | coiled-coil domain containing 7 | 348400 | 5 | 5 | 5 | 1 | 0 | 2 | 0 | 1 | 2 | 0 | 6.60e-05 | 0.69 | NaN | NaN | NaN | 6.60e-05 | 0.0435 |
| 29 | OR4S1 | olfactory receptor, family 4, subfamily S, member 1 | 221458 | 5 | 5 | 5 | 0 | 0 | 1 | 1 | 2 | 1 | 0 | 1.21e-05 | 0.29 | 0.33 | 0.98 | 0.48 | 7.56e-05 | 0.0481 |
| 30 | SCN2A | sodium channel, voltage-gated, type II, alpha subunit | 1497363 | 11 | 11 | 11 | 0 | 3 | 3 | 1 | 3 | 1 | 0 | 5.99e-06 | 0.039 | 0.87 | 0.74 | 1 | 7.80e-05 | 0.0481 |
| 31 | CABLES1 | Cdk5 and Abl enzyme substrate 1 | 299085 | 3 | 3 | 1 | 0 | 0 | 0 | 0 | 0 | 3 | 0 | 0.00464 | 1 | 0.00015 | 0.84 | 0.0015 | 9.20e-05 | 0.0548 |
| 32 | EGF | epidermal growth factor (beta-urogastrone) | 903860 | 4 | 1 | 4 | 1 | 0 | 2 | 1 | 0 | 1 | 0 | 0.500 | 0.62 | 0.00025 | 0.0012 | 0.000019 | 0.000120 | 0.0696 |
| 33 | OR8D1 | olfactory receptor, family 8, subfamily D, member 1 | 224050 | 5 | 5 | 5 | 0 | 0 | 2 | 3 | 0 | 0 | 0 | 1.70e-05 | 0.14 | 0.43 | 0.82 | 0.63 | 0.000134 | 0.0751 |
| 34 | COPS4 | COP9 constitutive photomorphogenic homolog subunit 4 (Arabidopsis) | 304448 | 4 | 4 | 4 | 1 | 0 | 1 | 1 | 1 | 1 | 0 | 0.000565 | 0.69 | 0.018 | 0.35 | 0.021 | 0.000145 | 0.0789 |
| 35 | DOCK3 | dedicator of cytokinesis 3 | 1485260 | 7 | 7 | 7 | 0 | 1 | 2 | 0 | 2 | 2 | 0 | 0.0313 | 0.12 | 0.00027 | 0.13 | 0.00042 | 0.000159 | 0.0841 |
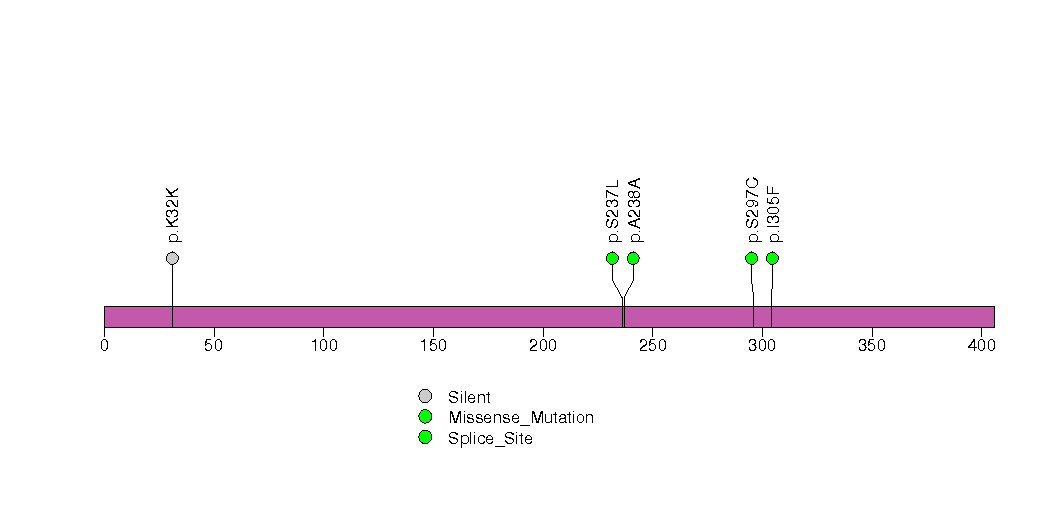
Figure S1. This figure depicts the distribution of mutations and mutation types across the RB1 significant gene.
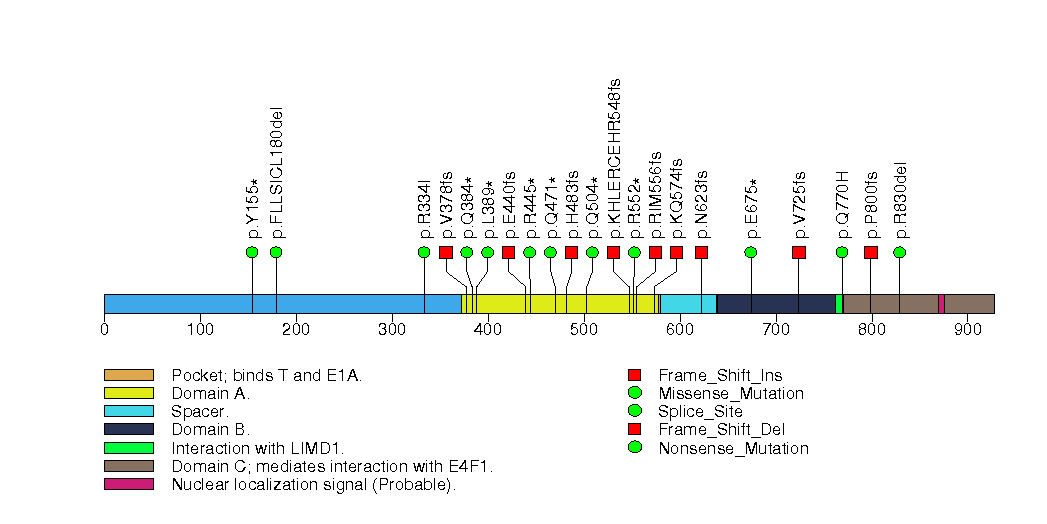
Figure S2. This figure depicts the distribution of mutations and mutation types across the TP53 significant gene.
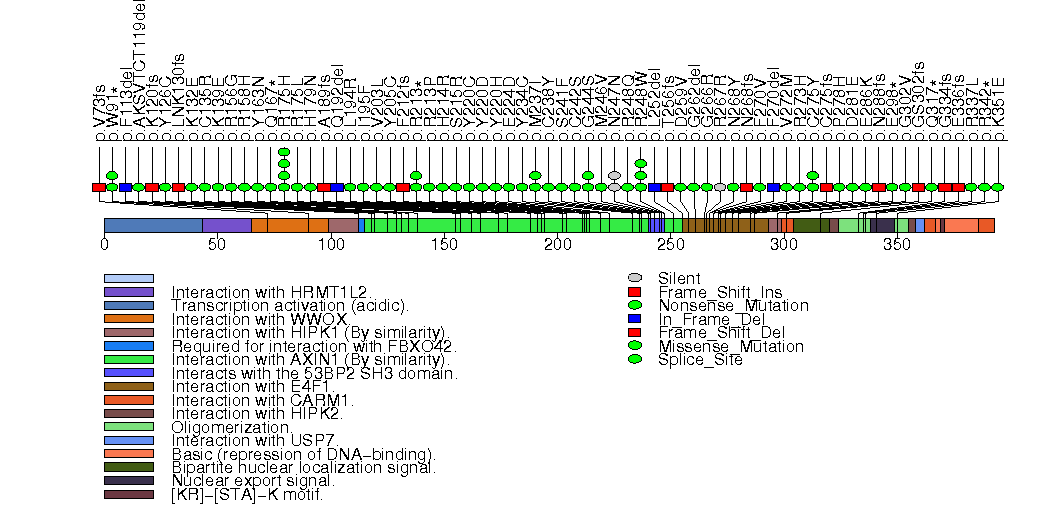
Figure S3. This figure depicts the distribution of mutations and mutation types across the NUMBL significant gene.
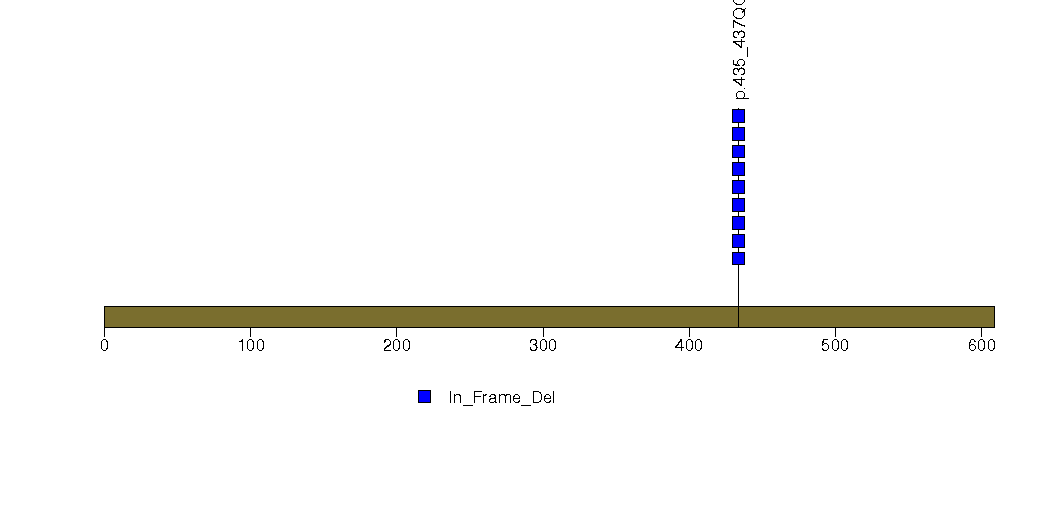
Figure S4. This figure depicts the distribution of mutations and mutation types across the MSH3 significant gene.
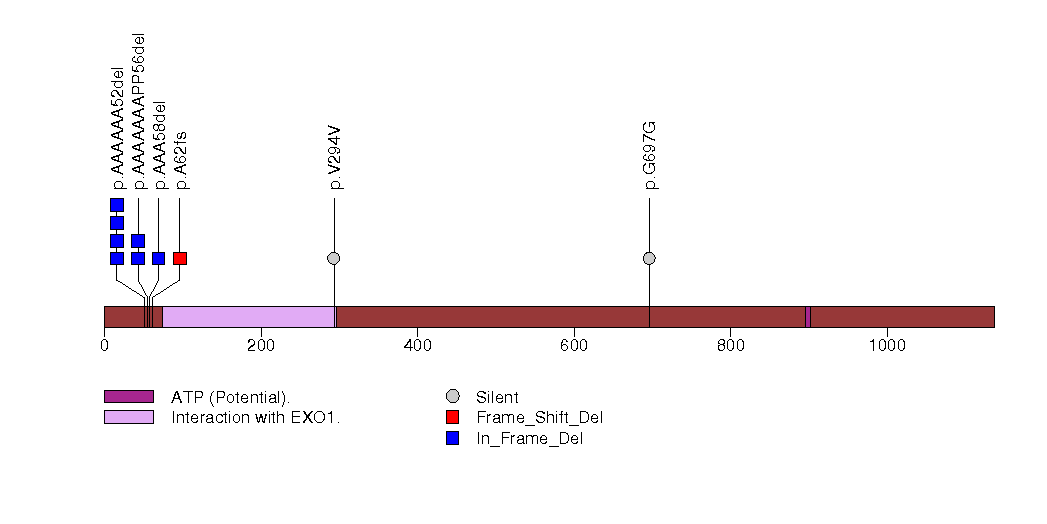
Figure S5. This figure depicts the distribution of mutations and mutation types across the WNK1 significant gene.
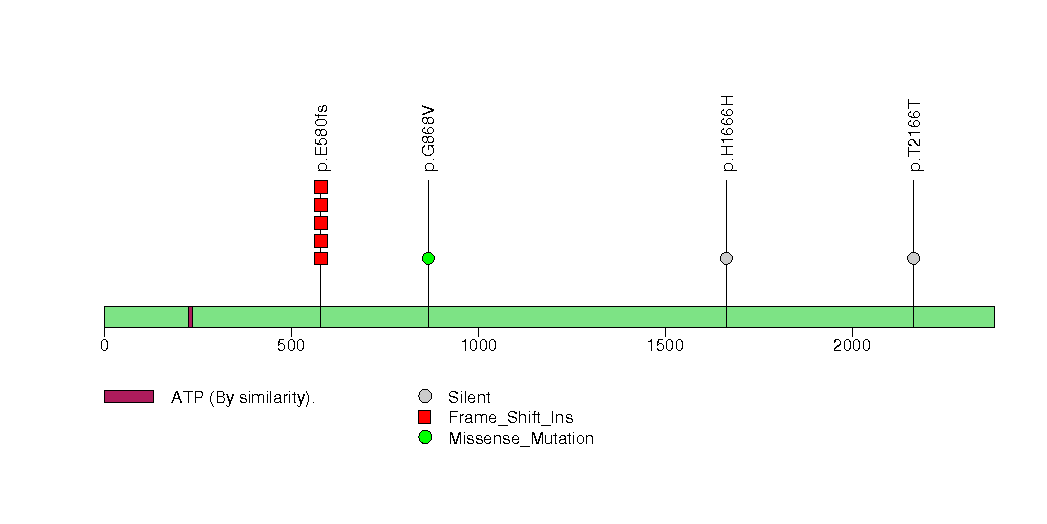
Figure S6. This figure depicts the distribution of mutations and mutation types across the LMTK2 significant gene.
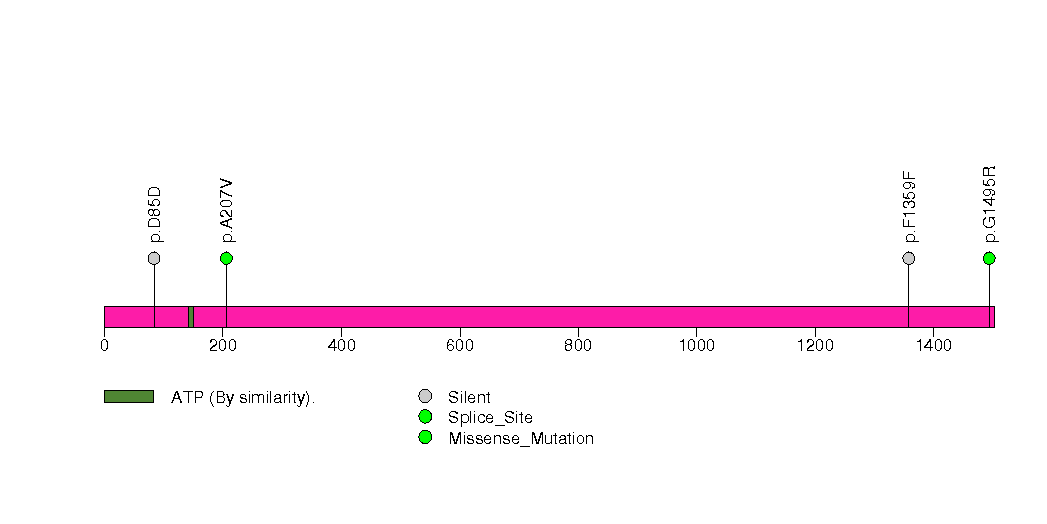
Figure S7. This figure depicts the distribution of mutations and mutation types across the ATRX significant gene.
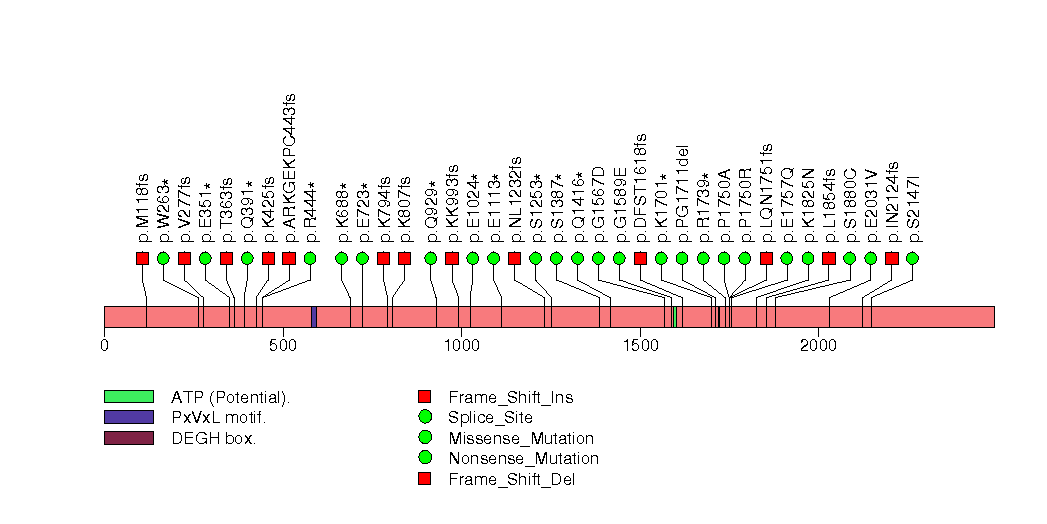
Figure S8. This figure depicts the distribution of mutations and mutation types across the LOR significant gene.
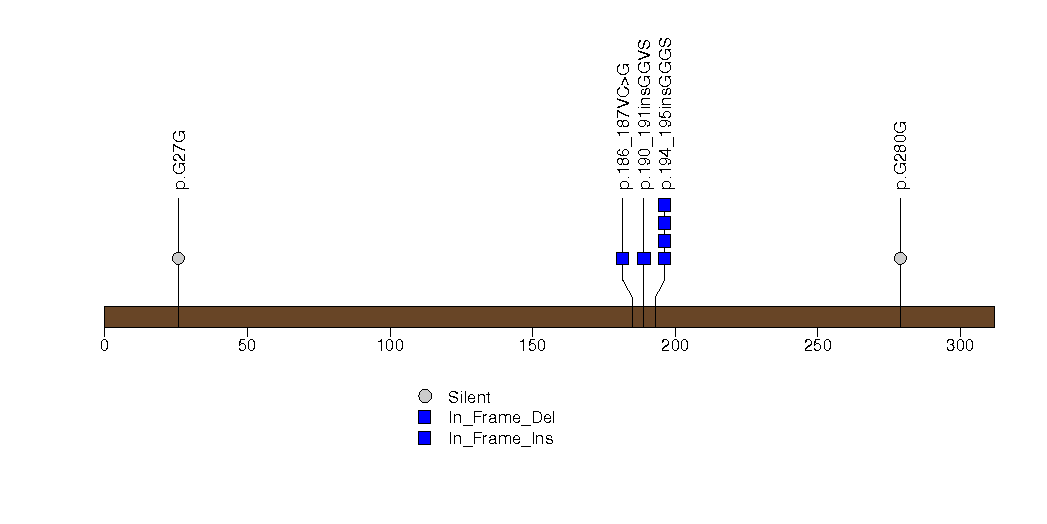
Figure S9. This figure depicts the distribution of mutations and mutation types across the KRTAP2-2 significant gene.
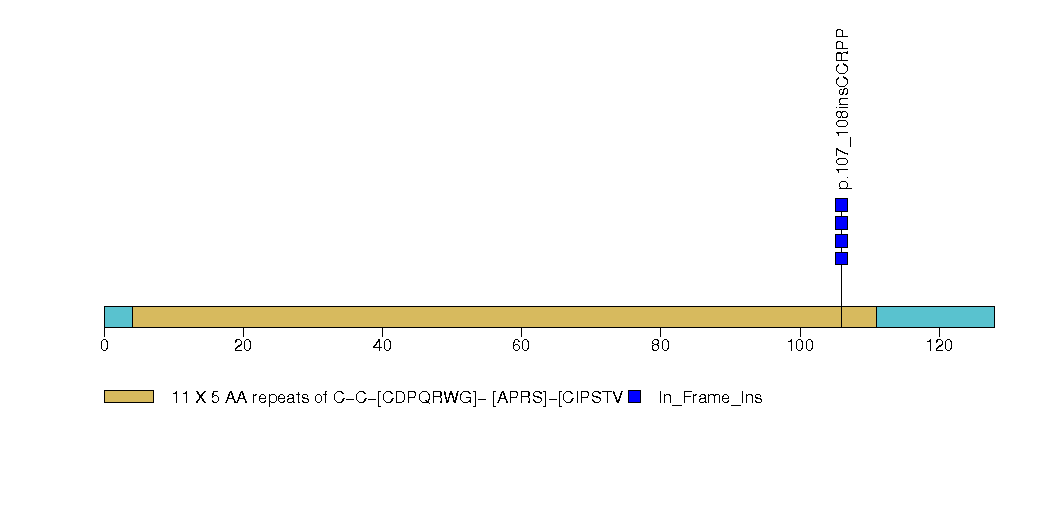
Figure S10. This figure depicts the distribution of mutations and mutation types across the KIAA0040 significant gene.
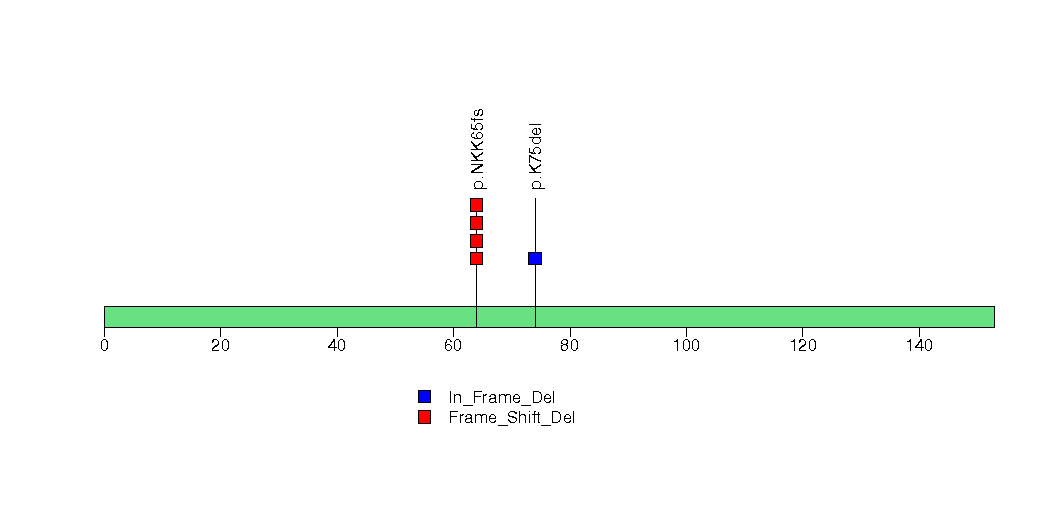
Figure S11. This figure depicts the distribution of mutations and mutation types across the PTEN significant gene.
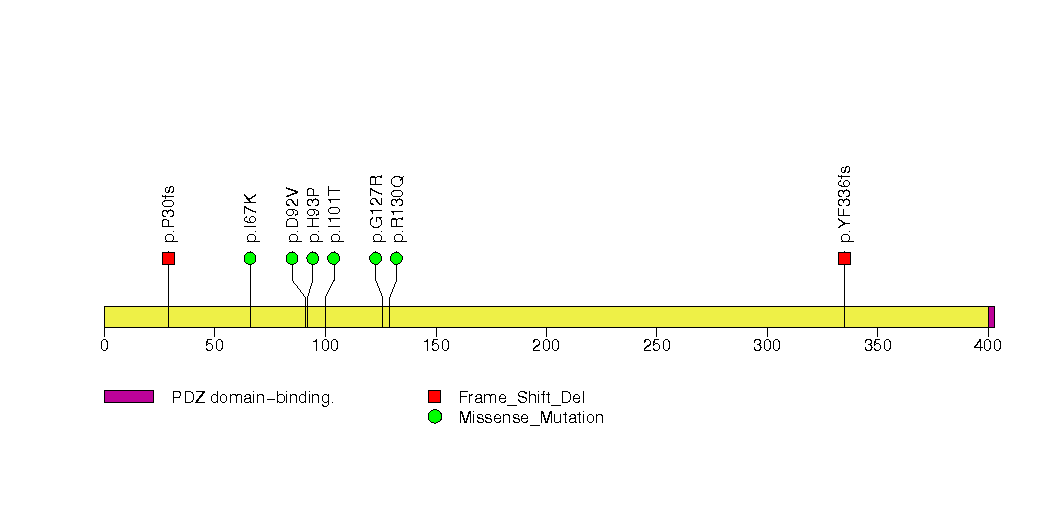
Figure S12. This figure depicts the distribution of mutations and mutation types across the KRTAP5-5 significant gene.
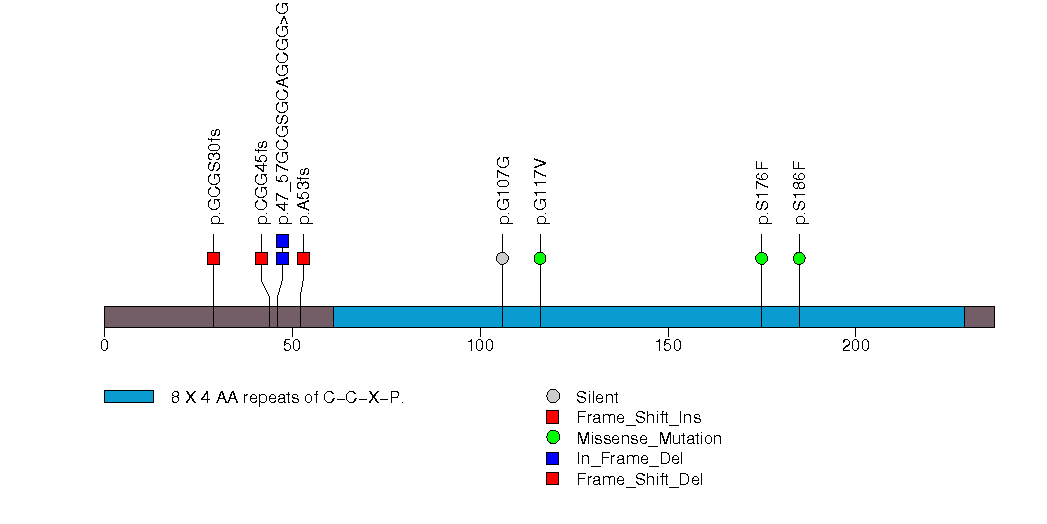
Figure S13. This figure depicts the distribution of mutations and mutation types across the ANP32E significant gene.
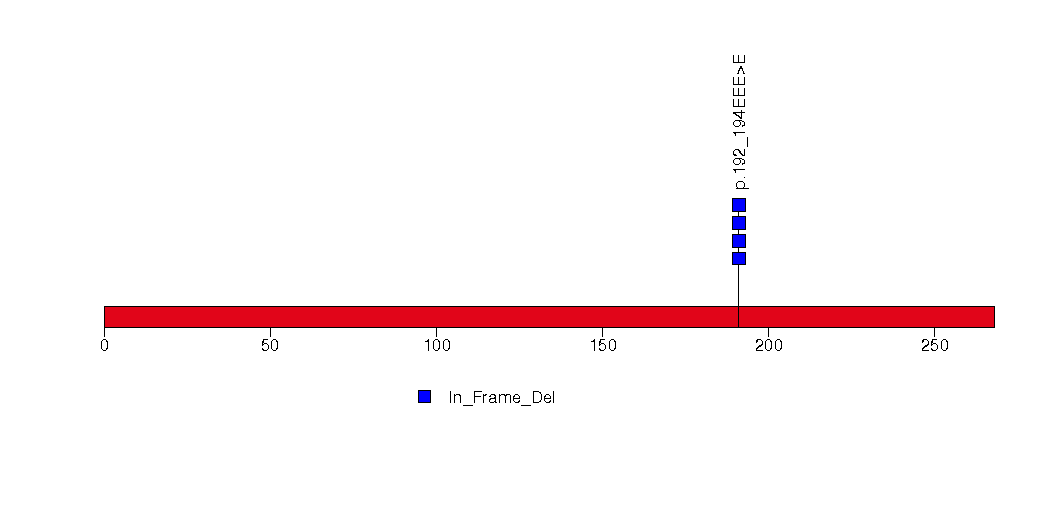
Figure S14. This figure depicts the distribution of mutations and mutation types across the AR significant gene.
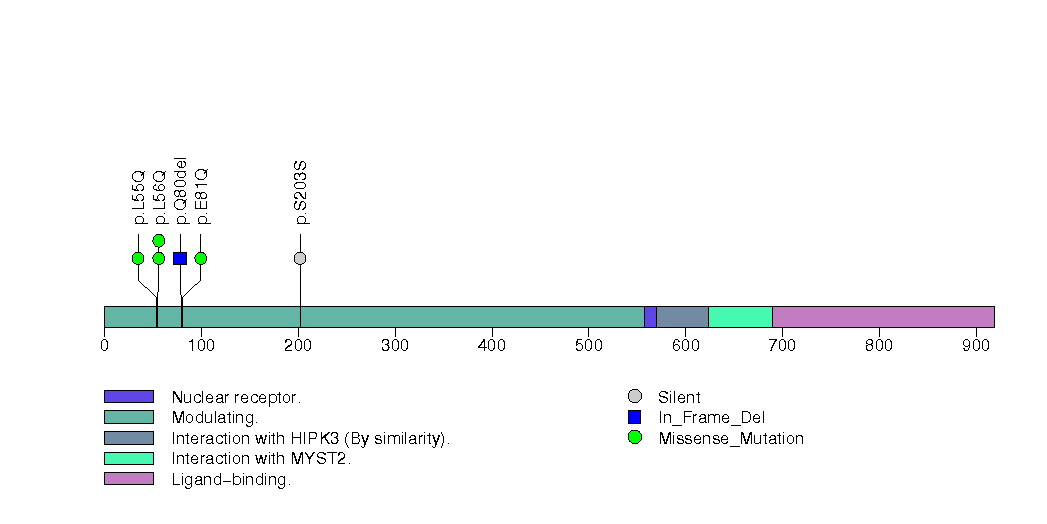
Figure S15. This figure depicts the distribution of mutations and mutation types across the EOMES significant gene.
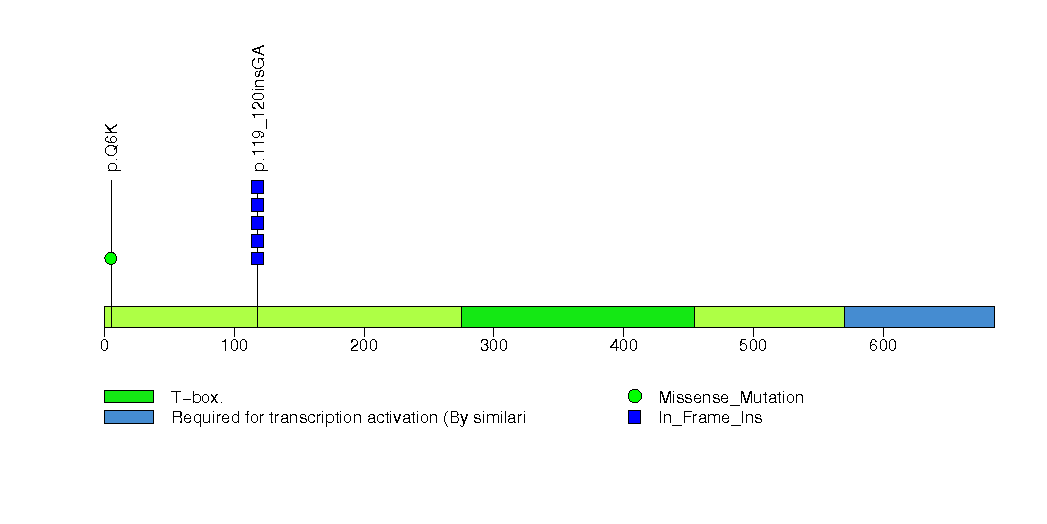
Figure S16. This figure depicts the distribution of mutations and mutation types across the LTBP3 significant gene.
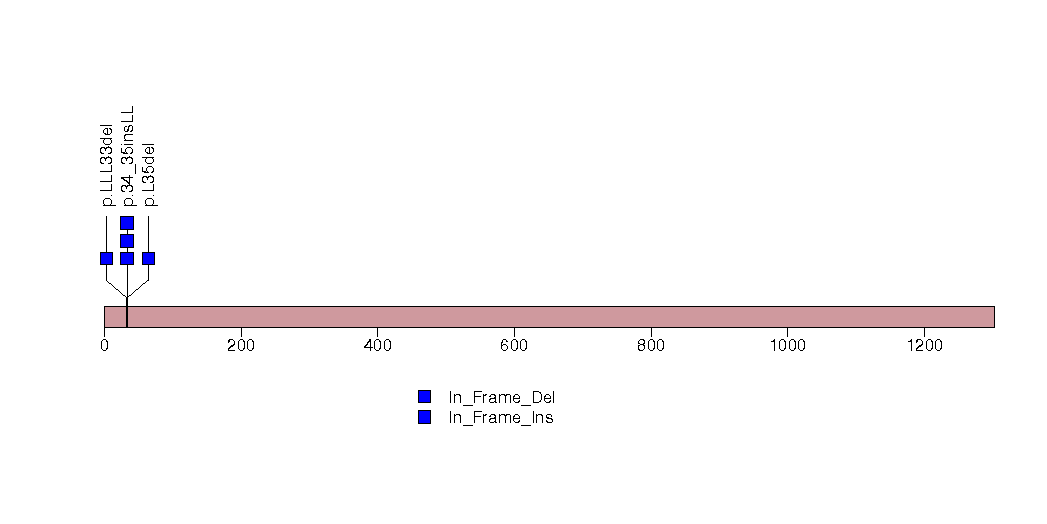
Figure S17. This figure depicts the distribution of mutations and mutation types across the PRB3 significant gene.
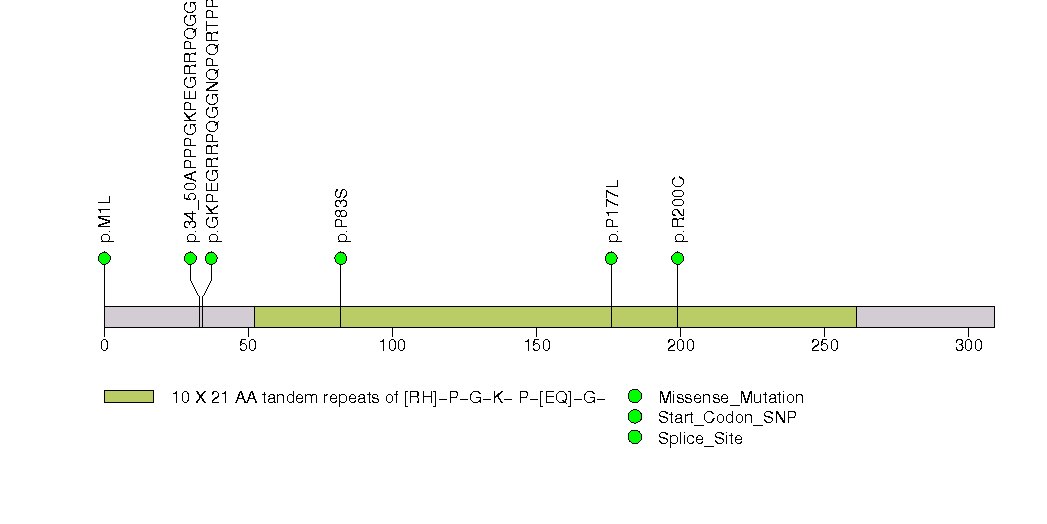
Figure S18. This figure depicts the distribution of mutations and mutation types across the EFCAB2 significant gene.
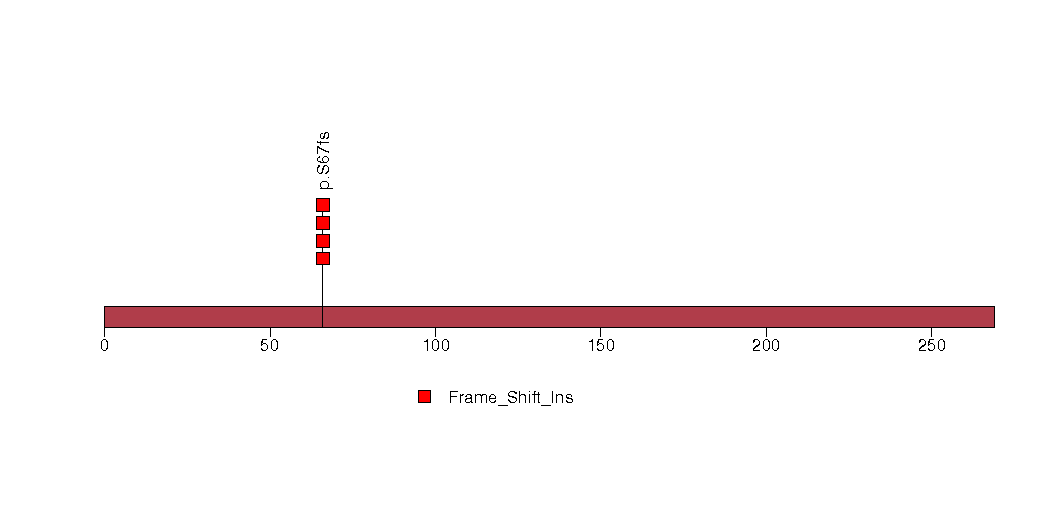
Figure S19. This figure depicts the distribution of mutations and mutation types across the DCDC1 significant gene.
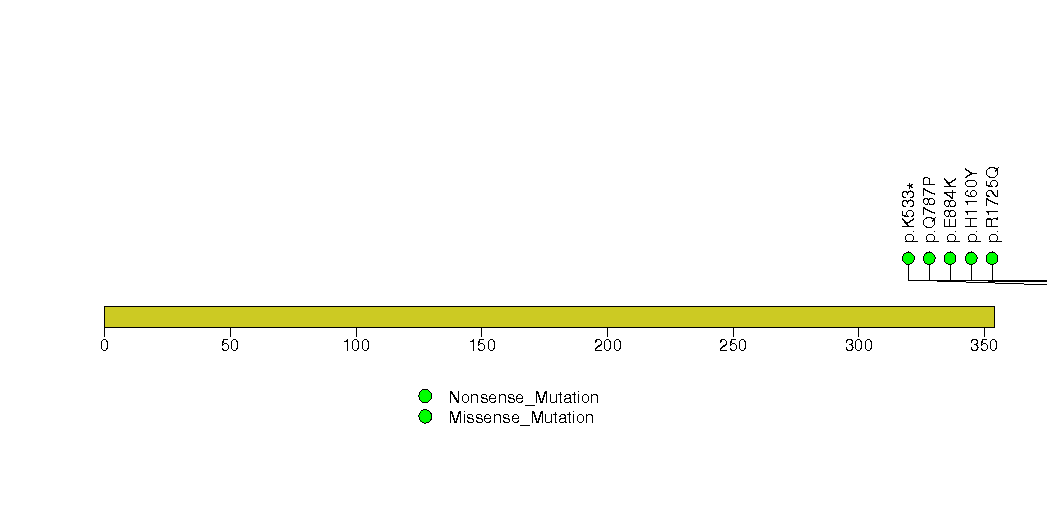
Figure S20. This figure depicts the distribution of mutations and mutation types across the CYLC2 significant gene.
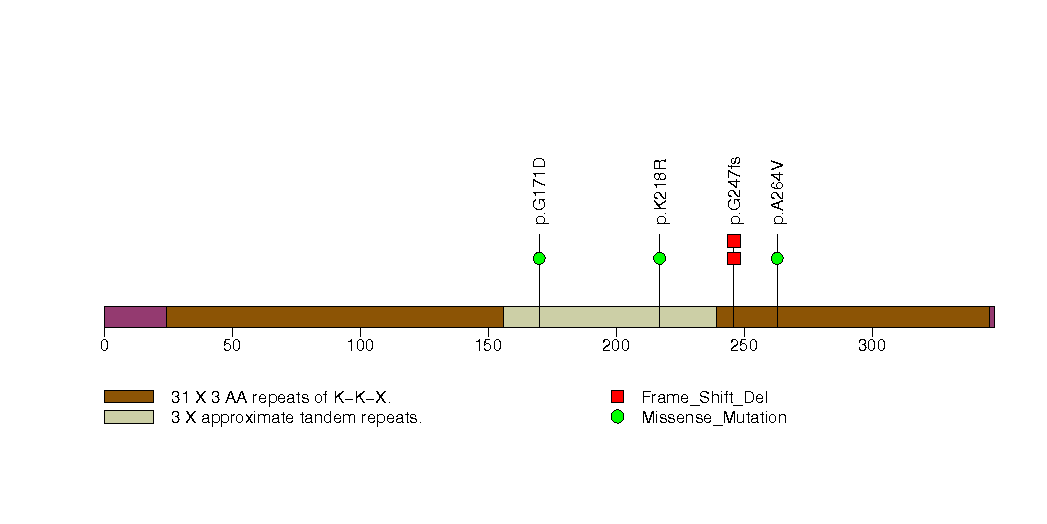
Figure S21. This figure depicts the distribution of mutations and mutation types across the FOXD2 significant gene.
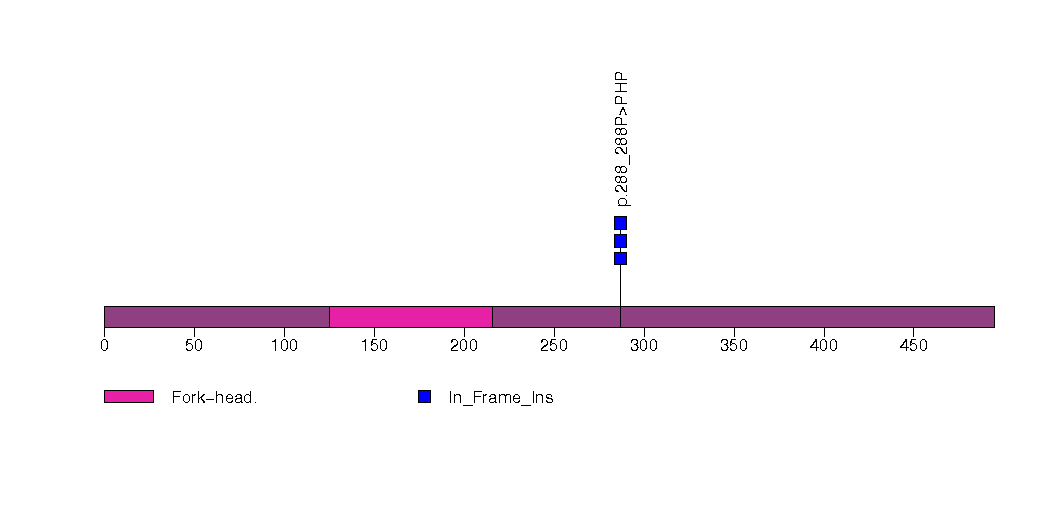
Figure S22. This figure depicts the distribution of mutations and mutation types across the MMP3 significant gene.
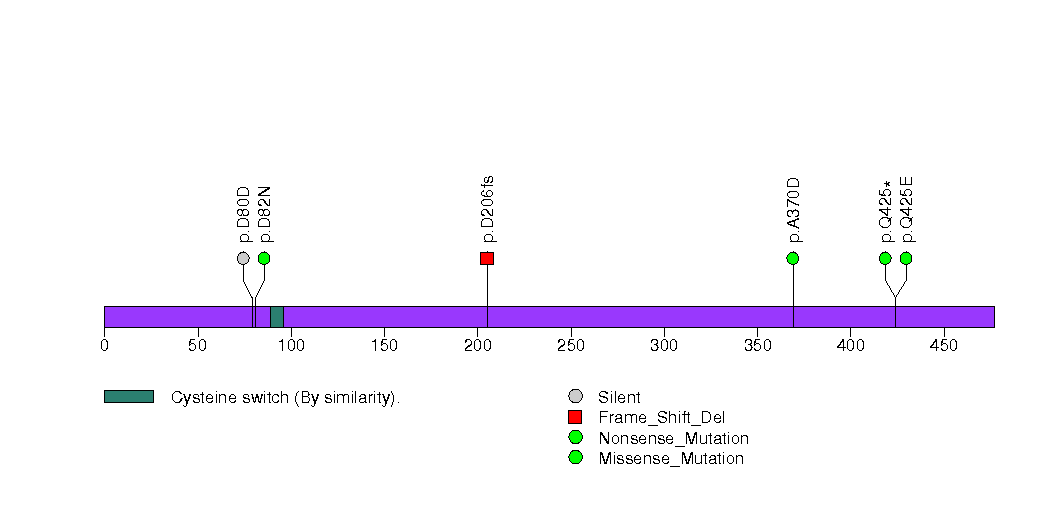
Figure S23. This figure depicts the distribution of mutations and mutation types across the PKD2 significant gene.
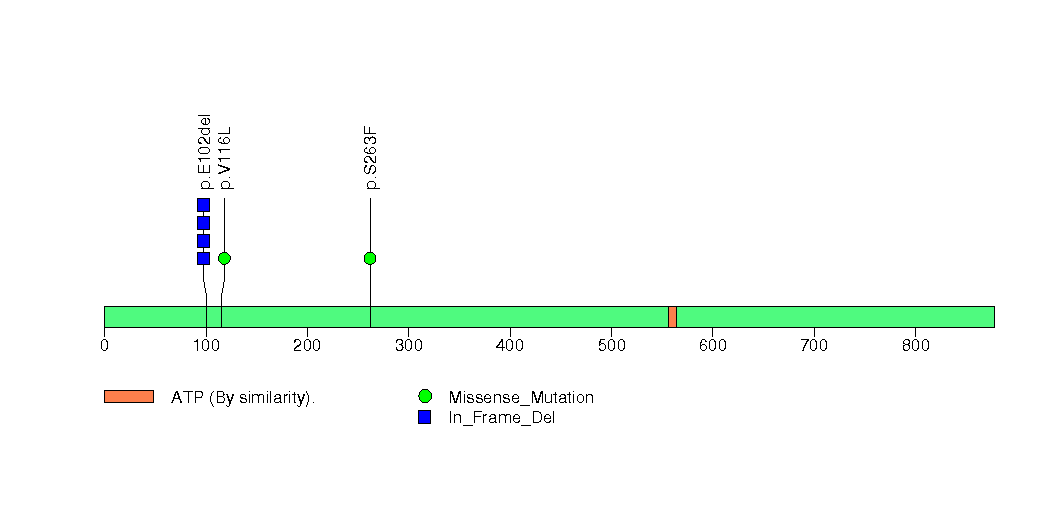
Figure S24. This figure depicts the distribution of mutations and mutation types across the USP8 significant gene.
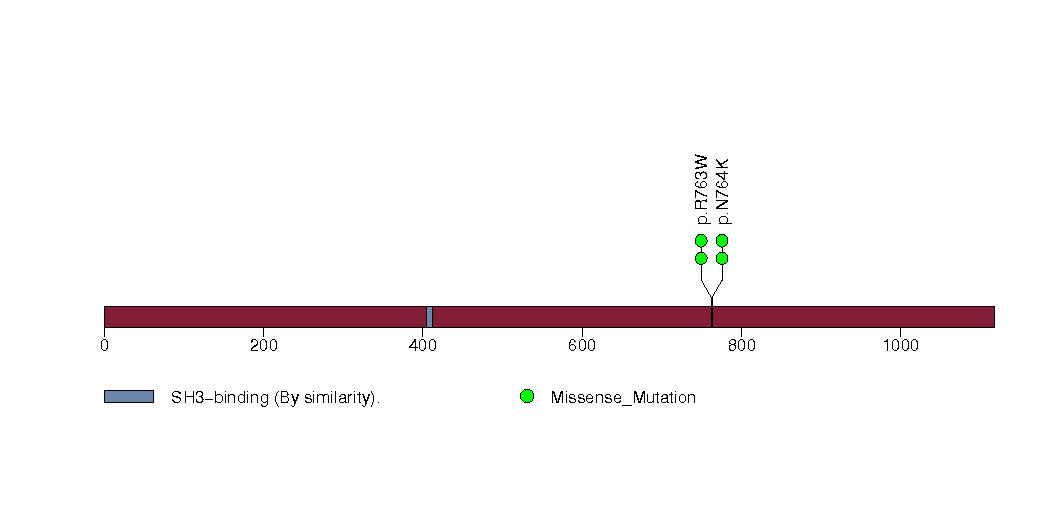
Figure S25. This figure depicts the distribution of mutations and mutation types across the SPHKAP significant gene.
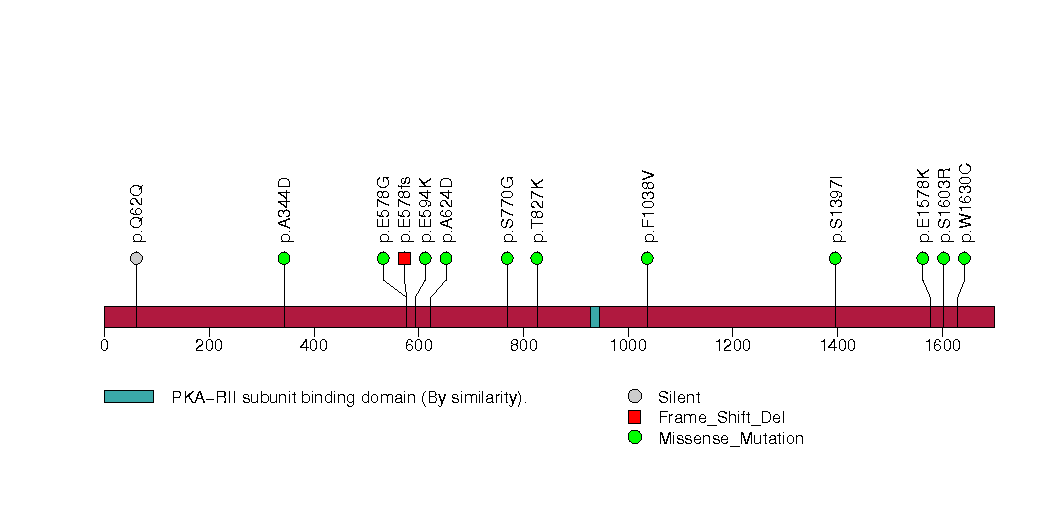
Figure S26. This figure depicts the distribution of mutations and mutation types across the LHCGR significant gene.
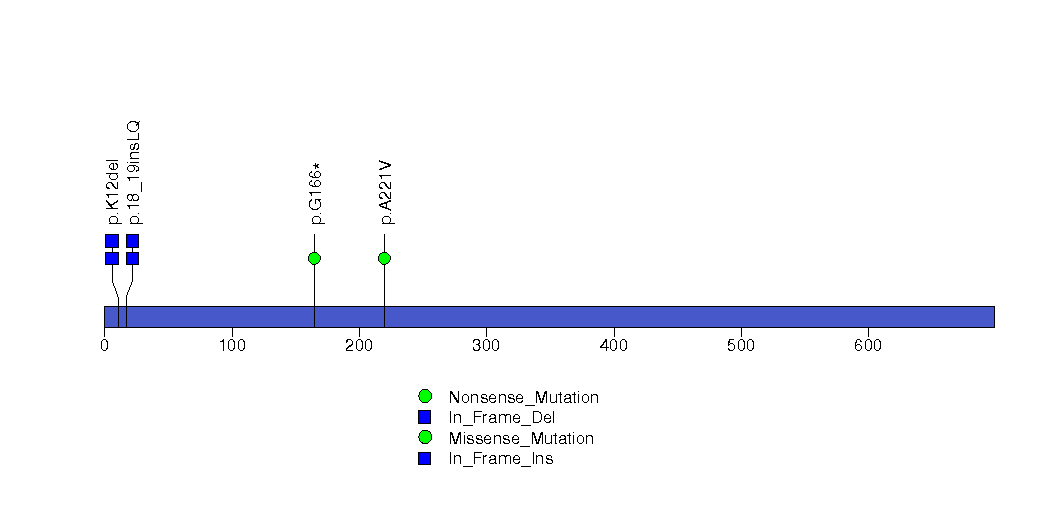
Figure S27. This figure depicts the distribution of mutations and mutation types across the C14orf39 significant gene.
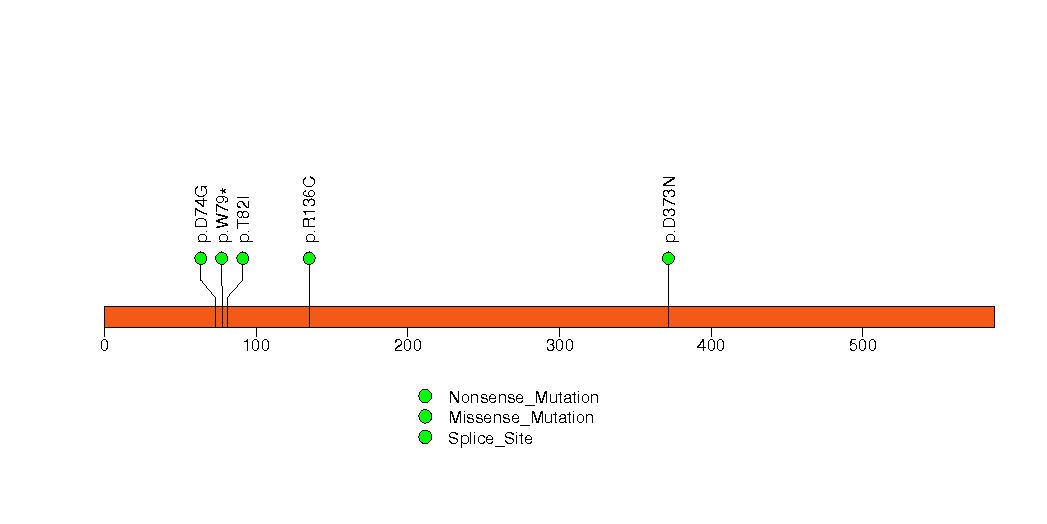
Figure S28. This figure depicts the distribution of mutations and mutation types across the CCDC7 significant gene.
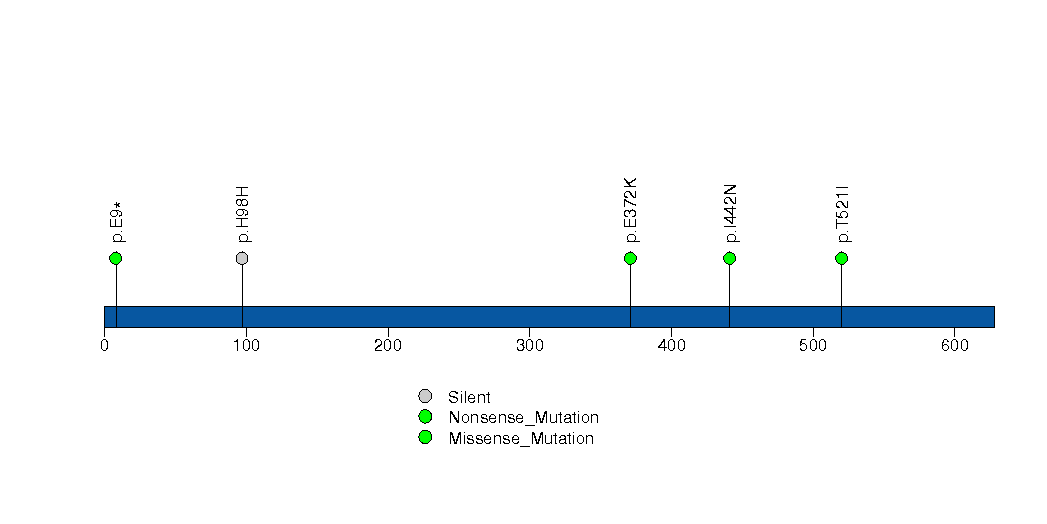
Figure S29. This figure depicts the distribution of mutations and mutation types across the OR4S1 significant gene.
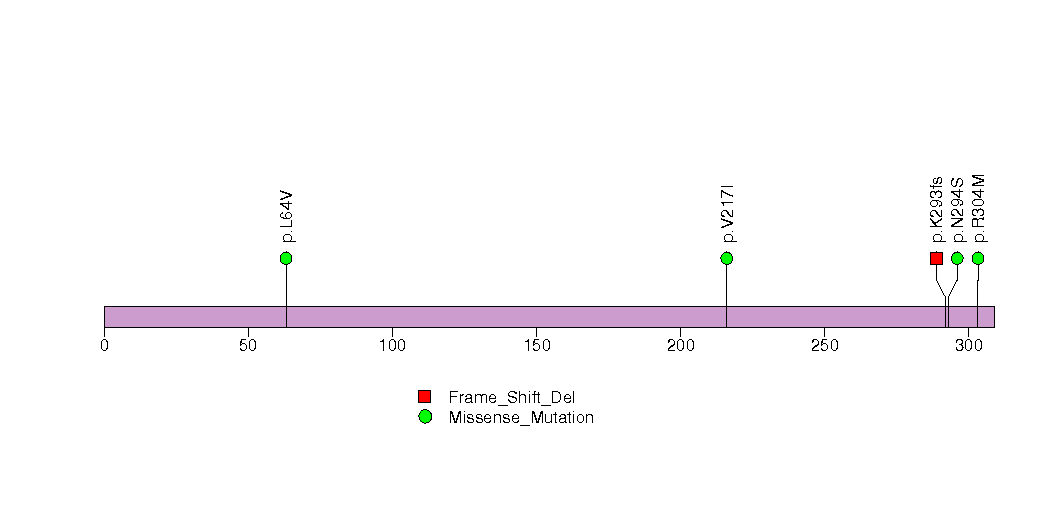
Figure S30. This figure depicts the distribution of mutations and mutation types across the SCN2A significant gene.
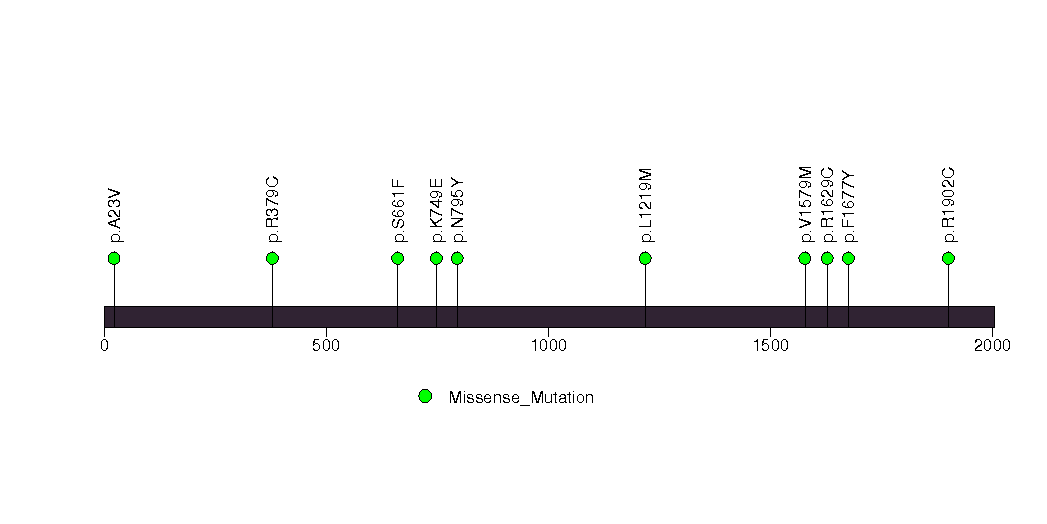
Figure S31. This figure depicts the distribution of mutations and mutation types across the CABLES1 significant gene.
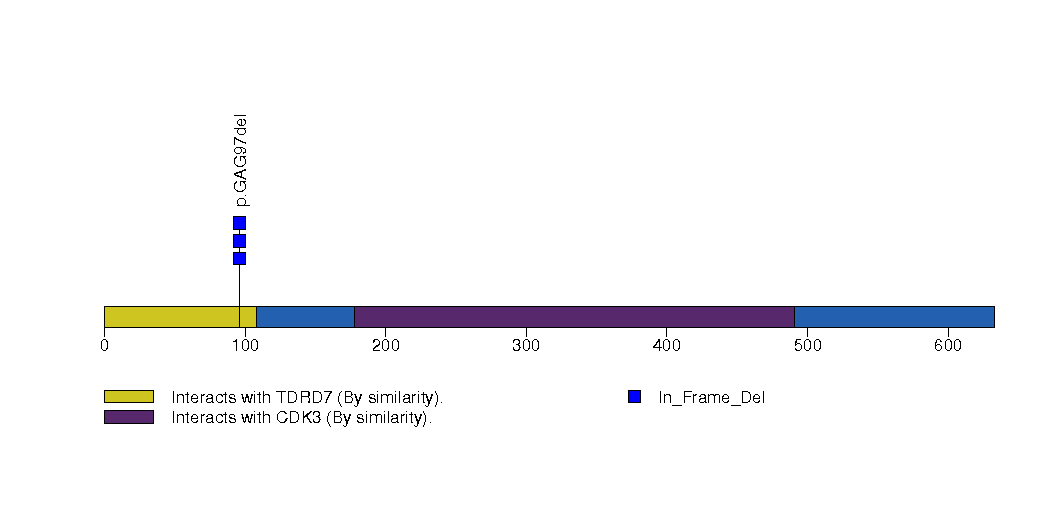
Figure S32. This figure depicts the distribution of mutations and mutation types across the EGF significant gene.
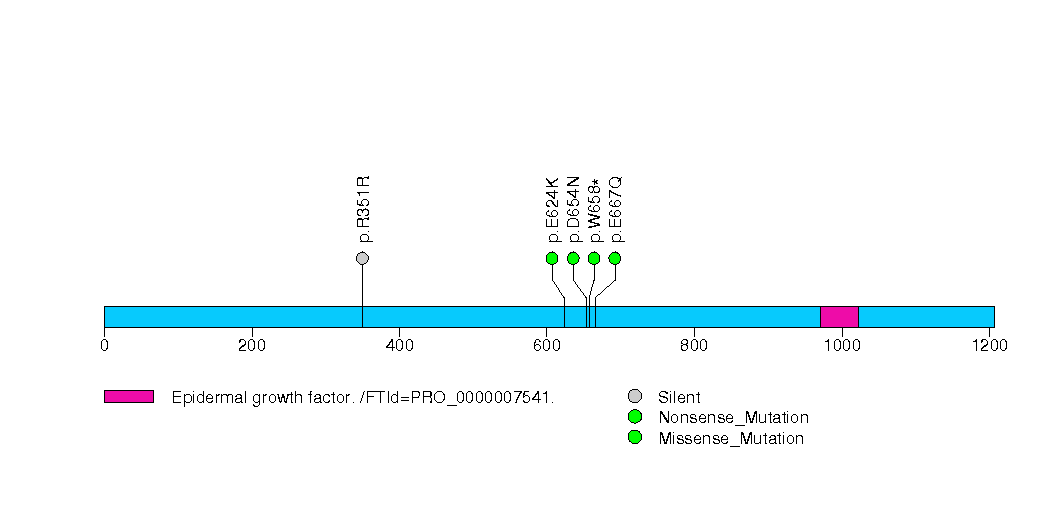
Figure S33. This figure depicts the distribution of mutations and mutation types across the OR8D1 significant gene.
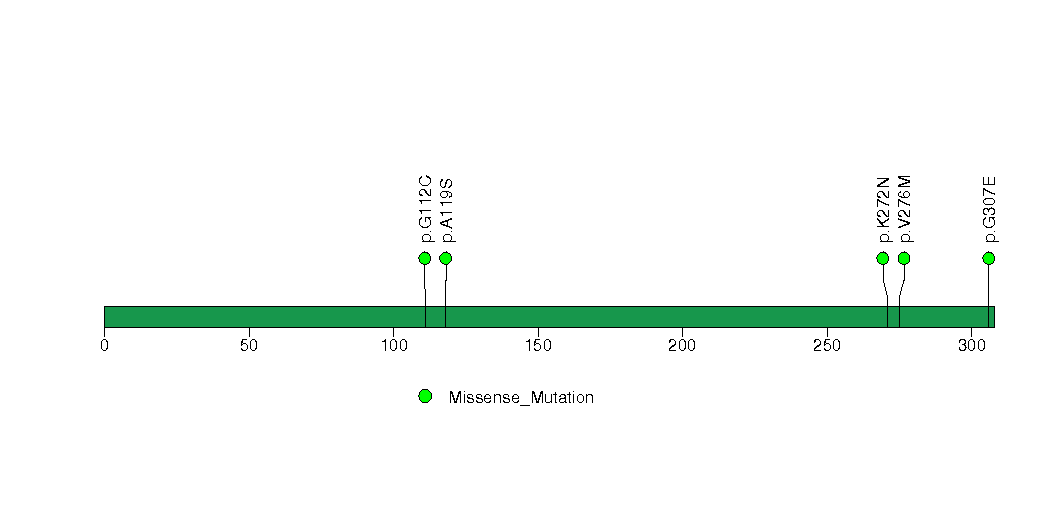
Figure S34. This figure depicts the distribution of mutations and mutation types across the COPS4 significant gene.
In this analysis, COSMIC is used as a filter to increase power by restricting the territory of each gene. Cosmic version: v48.
Table 4. Get Full Table Significantly mutated genes (COSMIC territory only). To access the database please go to: COSMIC. Number of significant genes found: 6. Number of genes displayed: 10
| rank | gene | description | n | cos | n_cos | N_cos | cos_ev | p | q |
|---|---|---|---|---|---|---|---|---|---|
| 1 | RB1 | retinoblastoma 1 (including osteosarcoma) | 25 | 267 | 16 | 65415 | 40 | 5.9e-13 | 1.7e-09 |
| 2 | TP53 | tumor protein p53 | 89 | 356 | 82 | 87220 | 13230 | 7.5e-13 | 1.7e-09 |
| 3 | PTEN | phosphatase and tensin homolog (mutated in multiple advanced cancers 1) | 8 | 767 | 8 | 187915 | 265 | 4.6e-09 | 7e-06 |
| 4 | CCNL2 | cyclin L2 | 2 | 1 | 2 | 245 | 2 | 1.1e-07 | 0.00012 |
| 5 | PIK3CA | phosphoinositide-3-kinase, catalytic, alpha polypeptide | 6 | 220 | 4 | 53900 | 2167 | 4.2e-06 | 0.0038 |
| 6 | PTPN11 | protein tyrosine phosphatase, non-receptor type 11 (Noonan syndrome 1) | 3 | 32 | 2 | 7840 | 4 | 0.00011 | 0.082 |
| 7 | KRAS | v-Ki-ras2 Kirsten rat sarcoma viral oncogene homolog | 2 | 52 | 2 | 12740 | 13156 | 0.00029 | 0.12 |
| 8 | AP1M1 | adaptor-related protein complex 1, mu 1 subunit | 1 | 1 | 1 | 245 | 1 | 0.00046 | 0.12 |
| 9 | GTF2B | general transcription factor IIB | 1 | 1 | 1 | 245 | 1 | 0.00046 | 0.12 |
| 10 | LENG8 | leukocyte receptor cluster (LRC) member 8 | 2 | 1 | 1 | 245 | 1 | 0.00046 | 0.12 |
Note:
n - number of (nonsilent) mutations in this gene across the individual set.
cos = number of unique mutated sites in this gene in COSMIC
n_cos = overlap between n and cos.
N_cos = number of individuals times cos.
cos_ev = total evidence: number of reports in COSMIC for mutations seen in this gene.
p = p-value for seeing the observed amount of overlap in this gene)
q = q-value, False Discovery Rate (Benjamini-Hochberg procedure)
Table 5. Get Full Table A Ranked List of Significantly Mutated Genesets. (Source: MSigDB GSEA Cannonical Pathway Set).Number of significant genesets found: 33. Number of genesets displayed: 10
| rank | geneset | description | genes | N_genes | mut_tally | N | n | npat | nsite | nsil | n1 | n2 | n3 | n4 | n5 | n6 | p_ns_s | p | q |
|---|---|---|---|---|---|---|---|---|---|---|---|---|---|---|---|---|---|---|---|
| 1 | P53HYPOXIAPATHWAY | Hypoxia induces p53 accumulation and consequent apoptosis with p53-mediated cell cycle arrest, which is present under conditions of DNA damage. | ABCB1, AKT1, ATM, BAX, CDKN1A, CPB2, CSNK1A1, CSNK1D, FHL2, GADD45A, HIC1, HIF1A, HSPA1A, HSPCA, IGFBP3, MAPK8, MDM2, NFKBIB, NQO1, TP53 | 19 | ABCB1(1), ATM(5), CDKN1A(2), HIC1(1), HIF1A(1), MDM2(1), TP53(89) | 7512770 | 100 | 90 | 86 | 12 | 11 | 13 | 14 | 21 | 41 | 0 | 0.0025 | <1.00e-15 | <2.18e-13 |
| 2 | SA_G1_AND_S_PHASES | Cdk2, 4, and 6 bind cyclin D in G1, while cdk2/cyclin E promotes the G1/S transition. | ARF1, ARF3, CCND1, CDK2, CDK4, CDKN1A, CDKN1B, CDKN2A, CFL1, E2F1, E2F2, MDM2, NXT1, PRB1, TP53 | 15 | ARF1(1), CCND1(1), CDK2(1), CDK4(1), CDKN1A(2), CDKN2A(2), MDM2(1), TP53(89) | 2970476 | 98 | 90 | 84 | 4 | 12 | 12 | 11 | 20 | 43 | 0 | 8e-08 | <1.00e-15 | <2.18e-13 |
| 3 | PLK3PATHWAY | Active Plk3 phosphorylates CDC25c, blocking the G2/M transition, and phosphorylates p53 to induce apoptosis. | ATM, ATR, CDC25C, CHEK1, CHEK2, CNK, TP53, YWHAH | 7 | ATM(5), ATR(4), CHEK2(2), TP53(89) | 5707218 | 100 | 87 | 86 | 6 | 10 | 14 | 12 | 21 | 43 | 0 | 0.0001 | 1.11e-15 | 2.18e-13 |
| 4 | ARFPATHWAY | Cyclin-dependent kinase inhibitor 2A is a tumor suppressor that induces G1 arrest and can activate the p53 pathway, leading to G2/M arrest. | ABL1, CDKN2A, E2F1, MDM2, MYC, PIK3CA, PIK3R1, POLR1A, POLR1B, POLR1C, POLR1D, RAC1, RB1, TBX2, TP53, TWIST1 | 16 | ABL1(2), CDKN2A(2), MDM2(1), MYC(3), PIK3CA(6), PIK3R1(1), POLR1A(1), RAC1(1), RB1(25), TP53(89), TWIST1(1) | 7224205 | 132 | 103 | 117 | 7 | 13 | 13 | 13 | 23 | 68 | 2 | 6.8e-08 | 1.89e-15 | 2.18e-13 |
| 5 | TIDPATHWAY | On ligand binding, interferon gamma receptors stimulate JAK2 kinase to phosphorylate STAT transcription factors, which promote expression of interferon responsive genes. | DNAJA3, HSPA1A, IFNG, IFNGR1, IFNGR2, IKBKB, JAK2, LIN7A, NFKB1, NFKBIA, RB1, RELA, TIP-1, TNF, TNFRSF1A, TNFRSF1B, TP53, USH1C, WT1 | 18 | IFNG(1), LIN7A(1), NFKB1(1), RB1(25), RELA(2), TNF(1), TNFRSF1A(1), TP53(89), USH1C(2) | 6645294 | 123 | 99 | 109 | 7 | 14 | 14 | 13 | 19 | 61 | 2 | 1.9e-07 | 2.66e-15 | 2.18e-13 |
| 6 | TELPATHWAY | Telomerase is a ribonucleotide protein that adds telomeric repeats to the 3' ends of chromosomes. | AKT1, BCL2, EGFR, G22P1, HSPCA, IGF1R, KRAS2, MYC, POLR2A, PPP2CA, PRKCA, RB1, TEP1, TERF1, TERT, TNKS, TP53, XRCC5 | 15 | EGFR(3), IGF1R(2), MYC(3), PRKCA(1), RB1(25), TEP1(3), TERF1(3), TERT(1), TP53(89) | 10130981 | 130 | 103 | 116 | 6 | 14 | 14 | 14 | 19 | 67 | 2 | 7.5e-09 | 2.78e-15 | 2.18e-13 |
| 7 | P53PATHWAY | p53 induces cell cycle arrest or apoptosis under conditions of DNA damage. | APAF1, ATM, BAX, BCL2, CCND1, CCNE1, CDK2, CDK4, CDKN1A, E2F1, GADD45A, MDM2, PCNA, RB1, TIMP3, TP53 | 16 | ATM(5), CCND1(1), CDK2(1), CDK4(1), CDKN1A(2), MDM2(1), RB1(25), TP53(89) | 6521754 | 125 | 101 | 111 | 7 | 12 | 13 | 15 | 21 | 62 | 2 | 1.2e-06 | 3.11e-15 | 2.18e-13 |
| 8 | RNAPATHWAY | dsRNA-activated protein kinase phosphorylates elF2a, which generally inhibits translation, and activates NF-kB to provoke inflammation. | CHUK, DNAJC3, EIF2S1, EIF2S2, MAP3K14, NFKB1, NFKBIA, PRKR, RELA, TP53 | 9 | EIF2S2(1), NFKB1(1), RELA(2), TP53(89) | 3632340 | 93 | 87 | 79 | 6 | 12 | 13 | 10 | 18 | 40 | 0 | 0.000028 | 3.11e-15 | 2.18e-13 |
| 9 | TERTPATHWAY | hTERC, the RNA subunit of telomerase, and hTERT, the catalytic protein subunit, are required for telomerase activity and are overexpressed in many cancers. | HDAC1, MAX, MYC, SP1, SP3, TP53, WT1, ZNF42 | 7 | MYC(3), SP1(2), SP3(2), TP53(89) | 2470479 | 96 | 88 | 82 | 3 | 11 | 13 | 11 | 19 | 42 | 0 | 7.5e-08 | 3.33e-15 | 2.18e-13 |
| 10 | RBPATHWAY | The ATM protein kinase recognizes DNA damage and blocks cell cycle progression by phosphorylating chk1 and p53, which normally inhibits Rb to allow G1/S transitions. | ATM, CDC2, CDC25A, CDC25B, CDC25C, CDK2, CDK4, CHEK1, MYT1, RB1, TP53, WEE1, YWHAH | 12 | ATM(5), CDC25B(1), CDK2(1), CDK4(1), MYT1(3), RB1(25), TP53(89), WEE1(1) | 6298210 | 126 | 99 | 112 | 10 | 10 | 16 | 17 | 19 | 62 | 2 | 4e-05 | 3.89e-15 | 2.18e-13 |
Table 6. Get Full Table A Ranked List of Significantly Mutated Genesets (Excluding Significantly Mutated Genes). Number of significant genesets found: 0. Number of genesets displayed: 10
| rank | geneset | description | genes | N_genes | mut_tally | N | n | npat | nsite | nsil | n1 | n2 | n3 | n4 | n5 | n6 | p_ns_s | p | q |
|---|---|---|---|---|---|---|---|---|---|---|---|---|---|---|---|---|---|---|---|
| 1 | PLCPATHWAY | Phospholipase C hydrolyzes the membrane lipid PIP2 to DAG, which activates protein kinase C, and IP3, which causes calcium influx. | AKT1, PIK3CA, PIK3R1, PLCB1, PLCG1, PRKCA, PRKCB1, VAV1 | 7 | PIK3CA(6), PIK3R1(1), PLCB1(5), PLCG1(1), PRKCA(1), VAV1(3) | 4699509 | 17 | 15 | 16 | 1 | 2 | 3 | 1 | 8 | 3 | 0 | 0.051 | 0.01 | 1 |
| 2 | FIBRINOLYSISPATHWAY | Thrombin cleavage of fibrinogen results in rapid formation of fibrin threads that form a mesh to capture platelets and other blood cells into a clot. | CPB2, F13A1, F2, F2R, FGA, FGB, FGG, PLAT, PLAU, PLG, SERPINB2, SERPINE1 | 12 | F13A1(3), F2(3), F2R(1), FGA(2), FGB(2), FGG(2), PLG(1) | 4869769 | 14 | 14 | 14 | 1 | 1 | 3 | 6 | 3 | 1 | 0 | 0.11 | 0.012 | 1 |
| 3 | ST_JAK_STAT_PATHWAY | The Janus kinase-signal transducer and activator of transcription (JAK-STAT) pathway transduces extracellular signals to promote gene activation. | CISH, JAK1, JAK2, JAK3, PIAS1, PIAS3, PTPRU, REG1A, SOAT1 | 9 | CISH(2), JAK1(1), JAK3(2), PIAS1(3), PTPRU(8), SOAT1(1) | 5161931 | 17 | 16 | 17 | 2 | 4 | 2 | 5 | 4 | 2 | 0 | 0.13 | 0.015 | 1 |
| 4 | PANTOTHENATE_AND_COA_BIOSYNTHESIS | BCAT1, COASY, DPYD, DPYS, ENPP1, ENPP3, PANK1, PANK2, PANK3, PANK4, PPCS, UPB1 | 12 | BCAT1(1), COASY(1), DPYD(6), ENPP1(3), ENPP3(2), PANK1(2), PANK3(1), PANK4(1), PPCS(1) | 5105361 | 18 | 16 | 18 | 1 | 0 | 6 | 4 | 2 | 6 | 0 | 0.026 | 0.018 | 1 | |
| 5 | HSA00950_ALKALOID_BIOSYNTHESIS_I | Genes involved in alkaloid biosynthesis I | DDC, GOT1, GOT2, TAT, TYR | 5 | DDC(2), TAT(2), TYR(2) | 1661167 | 6 | 6 | 6 | 0 | 2 | 2 | 1 | 0 | 1 | 0 | 0.16 | 0.018 | 1 |
| 6 | SA_G1_AND_S_PHASES | Cdk2, 4, and 6 bind cyclin D in G1, while cdk2/cyclin E promotes the G1/S transition. | ARF1, ARF3, CCND1, CDK2, CDK4, CDKN1A, CDKN1B, CDKN2A, CFL1, E2F1, E2F2, MDM2, NXT1, PRB1, TP53 | 14 | ARF1(1), CCND1(1), CDK2(1), CDK4(1), CDKN1A(2), CDKN2A(2), MDM2(1) | 2700879 | 9 | 9 | 9 | 1 | 2 | 1 | 1 | 2 | 3 | 0 | 0.18 | 0.023 | 1 |
| 7 | ST_INTERFERON_GAMMA_PATHWAY | The interferon gamma pathway resembles the JAK-STAT pathway and activates STAT transcription factors. | CISH, IFNG, IFNGR1, JAK1, JAK2, PLA2G2A, PTPRU, REG1A, STAT1, STATIP1 | 9 | CISH(2), IFNG(1), JAK1(1), PTPRU(8), STAT1(2) | 4202463 | 14 | 13 | 14 | 2 | 3 | 3 | 3 | 4 | 1 | 0 | 0.14 | 0.037 | 1 |
| 8 | TRKAPATHWAY | Nerve growth factor (NGF) promotes neuronal survival and proliferation by binding its receptor TrkA, which activates PI3K/AKT, Ras, and the MAP kinase pathway. | AKT1, DPM2, GRB2, HRAS, KLK2, NGFB, NTRK1, PIK3CA, PIK3R1, PLCG1, PRKCA, PRKCB1, SHC1, SOS1 | 12 | DPM2(1), NTRK1(3), PIK3CA(6), PIK3R1(1), PLCG1(1), PRKCA(1), SOS1(2) | 5667907 | 15 | 15 | 14 | 1 | 4 | 1 | 3 | 4 | 3 | 0 | 0.1 | 0.04 | 1 |
| 9 | IL10PATHWAY | The cytokine IL-10 inhibits the inflammatory response by macrophages via activation of heme oxygenase 1. | BLVRA, BLVRB, HMOX1, IL10, IL10RA, IL10RB, IL1A, IL6, JAK1, STAT1, STAT3, STAT5A, TNF | 13 | BLVRB(2), HMOX1(1), IL10RA(2), IL1A(1), JAK1(1), STAT1(2), STAT3(1), STAT5A(1), TNF(1) | 4447478 | 12 | 12 | 12 | 0 | 3 | 1 | 3 | 2 | 3 | 0 | 0.025 | 0.042 | 1 |
| 10 | ST_STAT3_PATHWAY | The transcription factor STAT3 is involved in cell growth regulation and is commonly upregulated in tumors. | CISH, IL6, IL6R, JAK1, JAK2, JAK3, PIAS3, PTPRU, REG1A, SRC, STAT3 | 11 | CISH(2), IL6R(2), JAK1(1), JAK3(2), PTPRU(8), STAT3(1) | 5659860 | 16 | 15 | 16 | 2 | 4 | 2 | 4 | 6 | 0 | 0 | 0.12 | 0.049 | 1 |
In brief, we tabulate the number of mutations and the number of covered bases for each gene. The counts are broken down by mutation context category: four context categories that are discovered by MutSig, and one for indel and 'null' mutations, which include indels, nonsense mutations, splice-site mutations, and non-stop (read-through) mutations. For each gene, we calculate the probability of seeing the observed constellation of mutations, i.e. the product P1 x P2 x ... x Pm, or a more extreme one, given the background mutation rates calculated across the dataset. [1]
In addition to the links below, the full results of the analysis summarized in this report can also be downloaded programmatically using firehose_get, or interactively from either the Broad GDAC website or TCGA Data Coordination Center Portal.