This report serves to describe the mutational landscape and properties of a given individual set, as well as rank genes and genesets according to mutational significance. MutSig 2CV v3.1 was used to generate the results found in this report.
-
Working with individual set: SARC-TP
-
Number of patients in set: 245
The input for this pipeline is a set of individuals with the following files associated for each:
-
An annotated .maf file describing the mutations called for the respective individual, and their properties.
-
A .wig file that contains information about the coverage of the sample.
-
MAF used for this analysis:SARC-TP.final_analysis_set.maf
-
Blacklist used for this analysis: pancan_mutation_blacklist.v14.hg19.txt
-
Significantly mutated genes (q ≤ 0.1): 19
The mutation spectrum is depicted in the lego plots below in which the 96 possible mutation types are subdivided into six large blocks, color-coded to reflect the base substitution type. Each large block is further subdivided into the 16 possible pairs of 5' and 3' neighbors, as listed in the 4x4 trinucleotide context legend. The height of each block corresponds to the mutation frequency for that kind of mutation (counts of mutations normalized by the base coverage in a given bin). The shape of the spectrum is a signature for dominant mutational mechanisms in different tumor types.
Figure 1. Get High-res Image SNV Mutation rate lego plot for entire set. Each bin is normalized by base coverage for that bin. Colors represent the six SNV types on the upper right. The three-base context for each mutation is labeled in the 4x4 legend on the lower right. The fractional breakdown of SNV counts is shown in the pie chart on the upper left. If this figure is blank, not enough information was provided in the MAF to generate it.
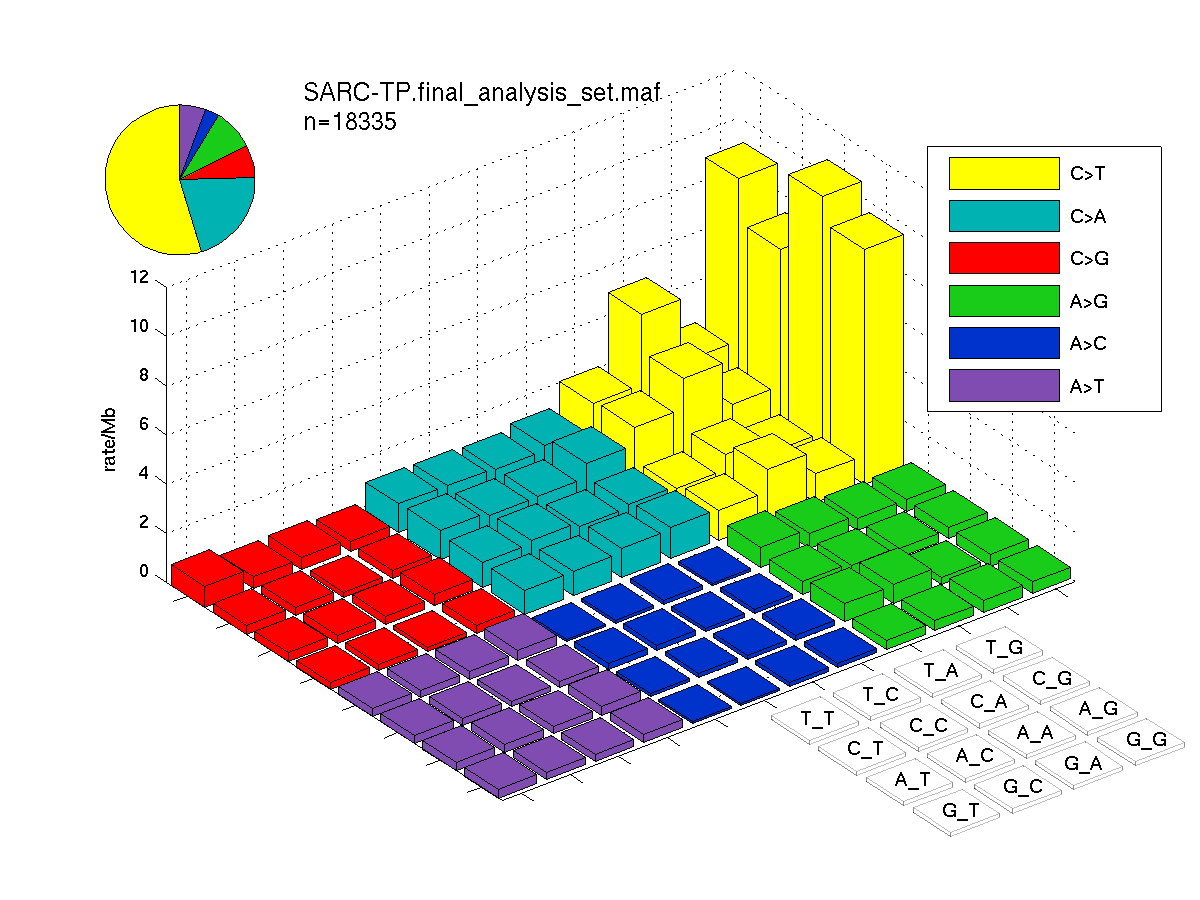
Figure 2. Get High-res Image SNV Mutation rate lego plots for 4 slices of mutation allele fraction (0<=AF<0.1, 0.1<=AF<0.25, 0.25<=AF<0.5, & 0.5<=AF) . The color code and three-base context legends are the same as the previous figure. If this figure is blank, not enough information was provided in the MAF to generate it.

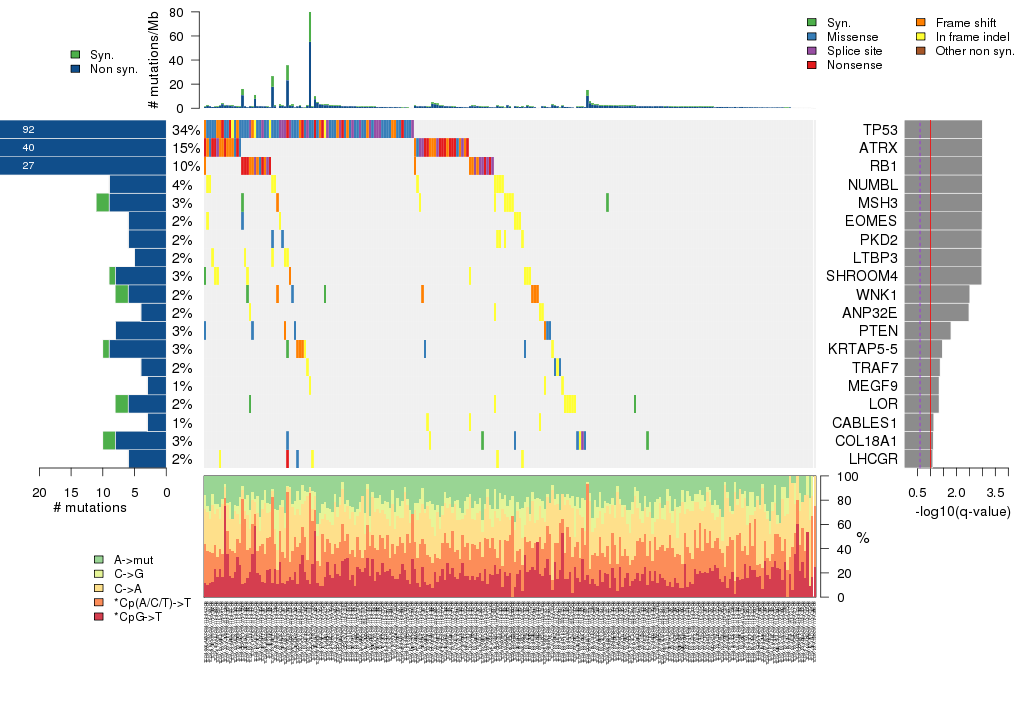
Figure 3. Get High-res Image The matrix in the center of the figure represents individual mutations in patient samples, color-coded by type of mutation, for the significantly mutated genes. The rate of synonymous and non-synonymous mutations is displayed at the top of the matrix. The barplot on the left of the matrix shows the number of mutations in each gene. The percentages represent the fraction of tumors with at least one mutation in the specified gene. The barplot to the right of the matrix displays the q-values for the most significantly mutated genes. The purple boxplots below the matrix (only displayed if required columns are present in the provided MAF) represent the distributions of allelic fractions observed in each sample. The plot at the bottom represents the base substitution distribution of individual samples, using the same categories that were used to calculate significance.
Column Descriptions:
-
nnon = number of (nonsilent) mutations in this gene across the individual set
-
npat = number of patients (individuals) with at least one nonsilent mutation
-
nsite = number of unique sites having a non-silent mutation
-
nsil = number of silent mutations in this gene across the individual set
-
p = p-value (overall)
-
q = q-value, False Discovery Rate (Benjamini-Hochberg procedure)
Table 1. Get Full Table A Ranked List of Significantly Mutated Genes. Number of significant genes found: 19. Number of genes displayed: 35. Click on a gene name to display its stick figure depicting the distribution of mutations and mutation types across the chosen gene (this feature may not be available for all significant genes).
| rank | gene | longname | codelen | nnei | nncd | nsil | nmis | nstp | nspl | nind | nnon | npat | nsite | pCV | pCL | pFN | p | q |
|---|---|---|---|---|---|---|---|---|---|---|---|---|---|---|---|---|---|---|
| 1 | TP53 | tumor protein p53 | 1889 | 5 | 0 | 3 | 49 | 8 | 12 | 20 | 89 | 84 | 75 | 6.8e-16 | 0.0032 | 1e-05 | 1e-16 | 1.8e-12 |
| 2 | ATRX | alpha thalassemia/mental retardation syndrome X-linked (RAD54 homolog, S. cerevisiae) | 7615 | 2 | 0 | 0 | 8 | 14 | 3 | 15 | 40 | 37 | 40 | 1e-16 | 1 | 0.23 | 1.4e-15 | 1.3e-11 |
| 3 | RB1 | retinoblastoma 1 (including osteosarcoma) | 3704 | 12 | 0 | 0 | 2 | 8 | 6 | 11 | 27 | 24 | 27 | 1e-16 | 1 | 0.35 | 2.3e-15 | 1.4e-11 |
| 4 | NUMBL | numb homolog (Drosophila)-like | 1866 | 426 | 0 | 0 | 0 | 0 | 0 | 9 | 9 | 9 | 1 | 4.1e-09 | 1e-05 | 0.97 | 1.3e-12 | 5.9e-09 |
| 5 | MSH3 | mutS homolog 3 (E. coli) | 3543 | 8 | 0 | 2 | 0 | 0 | 0 | 9 | 9 | 7 | 5 | 6e-09 | 1e-05 | 1 | 1.9e-12 | 6.9e-09 |
| 6 | EOMES | eomesodermin homolog (Xenopus laevis) | 2081 | 117 | 0 | 0 | 1 | 0 | 0 | 5 | 6 | 6 | 2 | 0.000035 | 1e-05 | 1 | 7.9e-09 | 0.000024 |
| 7 | PKD2 | polycystic kidney disease 2 (autosomal dominant) | 2965 | 2 | 0 | 0 | 2 | 0 | 0 | 4 | 6 | 6 | 3 | 3.5e-06 | 0.00015 | 0.59 | 1.8e-08 | 0.000046 |
| 8 | LTBP3 | latent transforming growth factor beta binding protein 3 | 4020 | 2 | 0 | 0 | 0 | 0 | 0 | 5 | 5 | 5 | 2 | 0.00011 | 1e-05 | 0.85 | 2.5e-08 | 0.000057 |
| 9 | SHROOM4 | shroom family member 4 | 4516 | 6 | 0 | 1 | 0 | 0 | 0 | 8 | 8 | 8 | 3 | 0.00014 | 1e-05 | 1 | 3e-08 | 0.000061 |
| 10 | WNK1 | WNK lysine deficient protein kinase 1 | 8759 | 13 | 0 | 2 | 1 | 0 | 0 | 5 | 6 | 6 | 2 | 0.0064 | 1e-05 | 3e-05 | 1.1e-06 | 0.0021 |
| 11 | ANP32E | acidic (leucine-rich) nuclear phosphoprotein 32 family, member E | 831 | 595 | 0 | 0 | 0 | 0 | 0 | 4 | 4 | 4 | 1 | 0.0008 | 0.0001 | 1 | 1.4e-06 | 0.0023 |
| 12 | PTEN | phosphatase and tensin homolog (mutated in multiple advanced cancers 1) | 1244 | 660 | 0 | 0 | 6 | 0 | 0 | 2 | 8 | 7 | 8 | 5.5e-06 | 1 | 0.049 | 1e-05 | 0.015 |
| 13 | KRTAP5-5 | keratin associated protein 5-5 | 716 | 24 | 0 | 1 | 3 | 0 | 0 | 6 | 9 | 7 | 8 | 8.3e-06 | 0.16 | 0.65 | 0.000024 | 0.034 |
| 14 | TRAF7 | TNF receptor-associated factor 7 | 2113 | 104 | 0 | 0 | 2 | 0 | 0 | 2 | 4 | 4 | 3 | 0.00066 | 0.02 | 0.04 | 0.000032 | 0.041 |
| 15 | MEGF9 | multiple EGF-like-domains 9 | 1948 | 96 | 0 | 0 | 0 | 0 | 0 | 3 | 3 | 3 | 1 | 0.0027 | 0.001 | 0.98 | 0.000037 | 0.045 |
| 16 | LOR | loricrin | 943 | 0 | 0 | 2 | 0 | 0 | 0 | 6 | 6 | 6 | 2 | 0.0031 | 0.00053 | 1 | 4e-05 | 0.045 |
| 17 | CABLES1 | Cdk5 and Abl enzyme substrate 1 | 1992 | 206 | 0 | 0 | 0 | 0 | 0 | 3 | 3 | 3 | 1 | 0.0052 | 0.001 | 0.83 | 0.000069 | 0.074 |
| 18 | COL18A1 | collagen, type XVIII, alpha 1 | 5536 | 11 | 0 | 2 | 5 | 0 | 1 | 2 | 8 | 7 | 8 | 0.00011 | 0.039 | 0.39 | 0.000074 | 0.075 |
| 19 | LHCGR | luteinizing hormone/choriogonadotropin receptor | 2144 | 44 | 0 | 0 | 1 | 1 | 0 | 4 | 6 | 6 | 4 | 0.033 | 0.00011 | 1 | 0.000084 | 0.081 |
| 20 | NF1 | neurofibromin 1 (neurofibromatosis, von Recklinghausen disease, Watson disease) | 12119 | 1 | 0 | 1 | 4 | 1 | 1 | 5 | 11 | 10 | 11 | 0.00058 | 0.017 | 0.88 | 0.00012 | 0.11 |
| 21 | FOXD2 | forkhead box D2 | 1488 | 1000 | 0 | 0 | 0 | 0 | 0 | 3 | 3 | 3 | 1 | 0.012 | 0.001 | 1 | 0.00015 | 0.13 |
| 22 | CCNL2 | cyclin L2 | 1680 | 1 | 0 | 0 | 0 | 0 | 0 | 2 | 2 | 2 | 1 | 0.0013 | 0.01 | 0.54 | 0.00016 | 0.13 |
| 23 | MMP17 | matrix metallopeptidase 17 (membrane-inserted) | 1850 | 63 | 0 | 0 | 1 | 0 | 0 | 2 | 3 | 3 | 2 | 0.0012 | 0.016 | 0.99 | 0.00023 | 0.18 |
| 24 | ASTE1 | asteroid homolog 1 (Drosophila) | 2150 | 22 | 0 | 1 | 0 | 0 | 0 | 3 | 3 | 3 | 1 | 0.026 | 0.001 | 0.89 | 0.0003 | 0.23 |
| 25 | CHRNA9 | cholinergic receptor, nicotinic, alpha 9 | 1458 | 77 | 0 | 0 | 3 | 1 | 0 | 0 | 4 | 4 | 4 | 0.000076 | 1 | 0.29 | 0.00034 | 0.25 |
| 26 | COL4A3 | collagen, type IV, alpha 3 (Goodpasture antigen) | 5291 | 12 | 0 | 0 | 6 | 0 | 1 | 0 | 7 | 5 | 6 | 0.12 | 0.00017 | 0.89 | 0.00035 | 0.25 |
| 27 | ZNF324B | zinc finger protein 324B | 1652 | 60 | 0 | 1 | 3 | 1 | 0 | 0 | 4 | 3 | 4 | 0.0055 | 0.012 | 0.33 | 0.00039 | 0.26 |
| 28 | TAS1R1 | taste receptor, type 1, member 1 | 2549 | 16 | 0 | 0 | 1 | 1 | 0 | 0 | 2 | 2 | 2 | 0.00019 | 1 | 0.044 | 0.00042 | 0.27 |
| 29 | TMPRSS5 | transmembrane protease, serine 5 (spinesin) | 1422 | 93 | 0 | 0 | 2 | 0 | 0 | 1 | 3 | 3 | 3 | 0.00081 | 1 | 0.0066 | 0.00044 | 0.28 |
| 30 | FRAS1 | Fraser syndrome 1 | 12406 | 2 | 0 | 1 | 6 | 0 | 1 | 0 | 7 | 6 | 7 | 0.28 | 0.0076 | 0.0038 | 0.00047 | 0.28 |
| 31 | PFKL | phosphofructokinase, liver | 2429 | 35 | 0 | 0 | 1 | 2 | 0 | 0 | 3 | 3 | 3 | 0.000043 | 1 | 0.75 | 0.00048 | 0.28 |
| 32 | SCAP | SREBF chaperone | 3928 | 15 | 0 | 0 | 3 | 0 | 1 | 0 | 4 | 3 | 4 | 0.025 | 0.0054 | 0.15 | 0.00058 | 0.33 |
| 33 | COL7A1 | collagen, type VII, alpha 1 (epidermolysis bullosa, dystrophic, dominant and recessive) | 9304 | 6 | 0 | 1 | 1 | 0 | 2 | 2 | 5 | 4 | 5 | 0.0059 | 0.0086 | 0.78 | 0.00062 | 0.34 |
| 34 | MMP3 | matrix metallopeptidase 3 (stromelysin 1, progelatinase) | 1472 | 3 | 0 | 1 | 3 | 1 | 1 | 1 | 6 | 6 | 5 | 0.00077 | 0.06 | 0.99 | 0.00064 | 0.34 |
| 35 | AR | androgen receptor (dihydrotestosterone receptor; testicular feminization; spinal and bulbar muscular atrophy; Kennedy disease) | 2813 | 60 | 0 | 1 | 5 | 0 | 0 | 1 | 6 | 6 | 5 | 0.038 | 0.0008 | 1 | 0.00064 | 0.34 |
Figure S1. This figure depicts the distribution of mutations and mutation types across the TP53 significant gene.
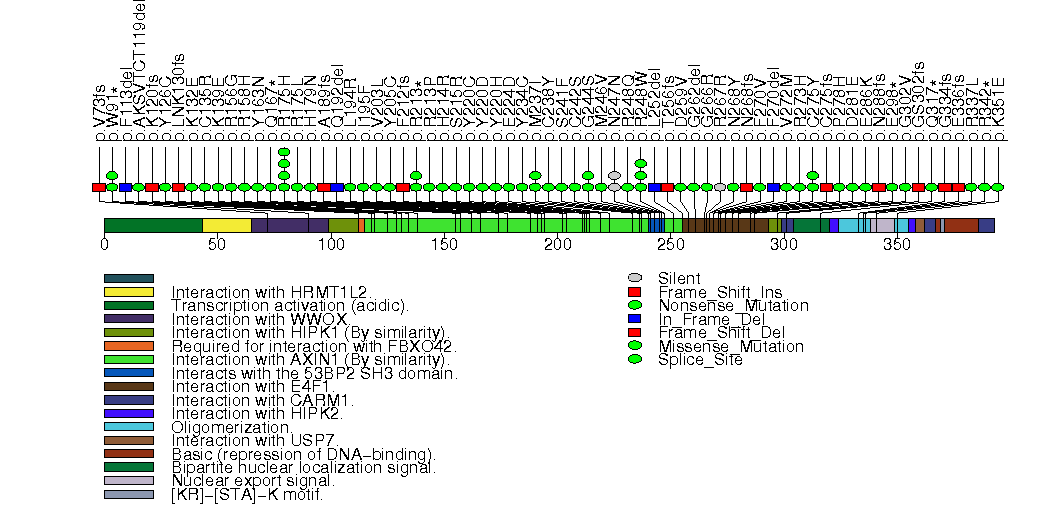
Figure S2. This figure depicts the distribution of mutations and mutation types across the ATRX significant gene.
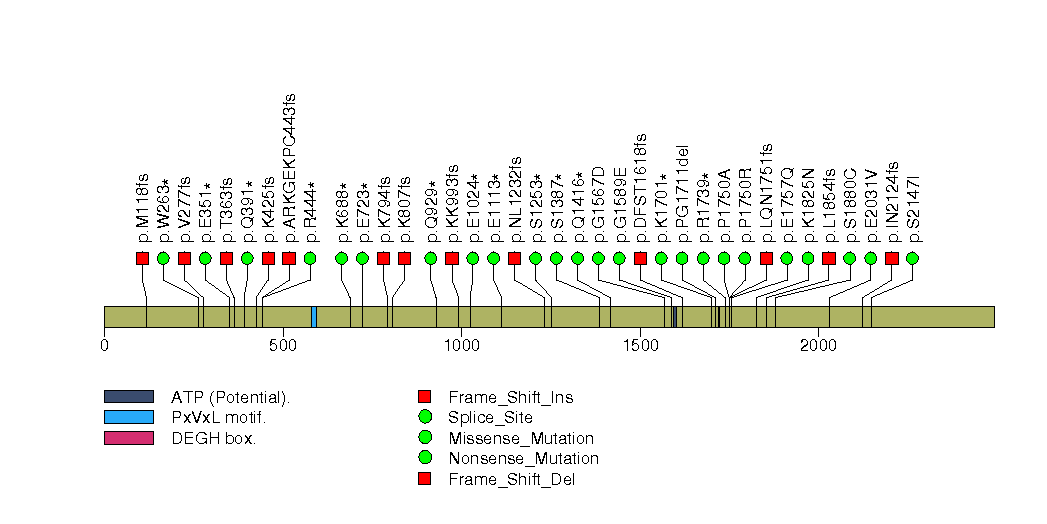
Figure S3. This figure depicts the distribution of mutations and mutation types across the RB1 significant gene.
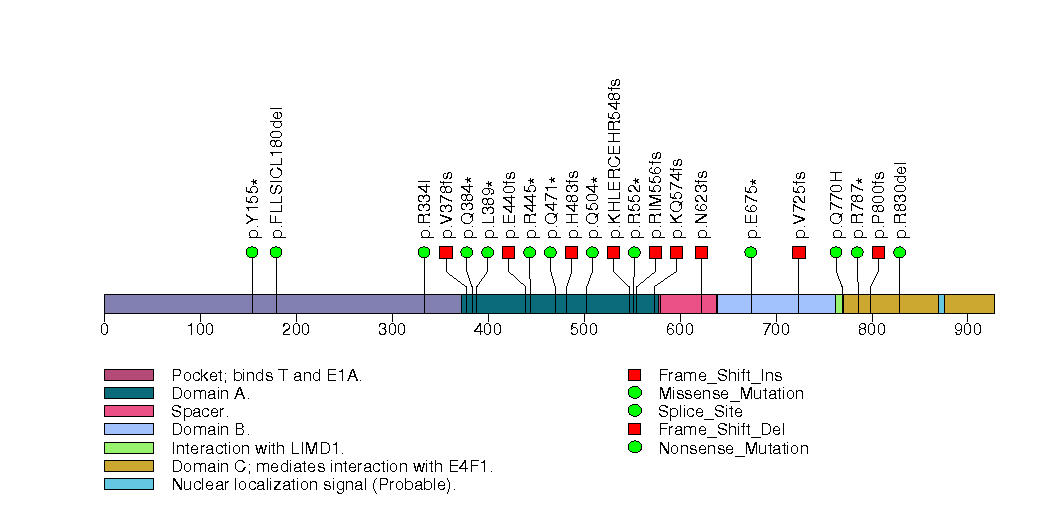
Figure S4. This figure depicts the distribution of mutations and mutation types across the NUMBL significant gene.
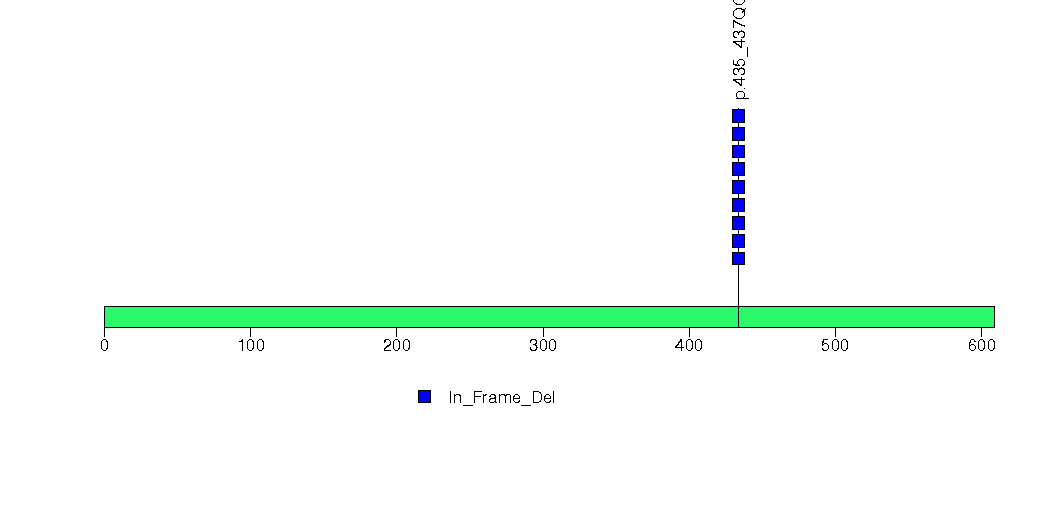
Figure S5. This figure depicts the distribution of mutations and mutation types across the MSH3 significant gene.
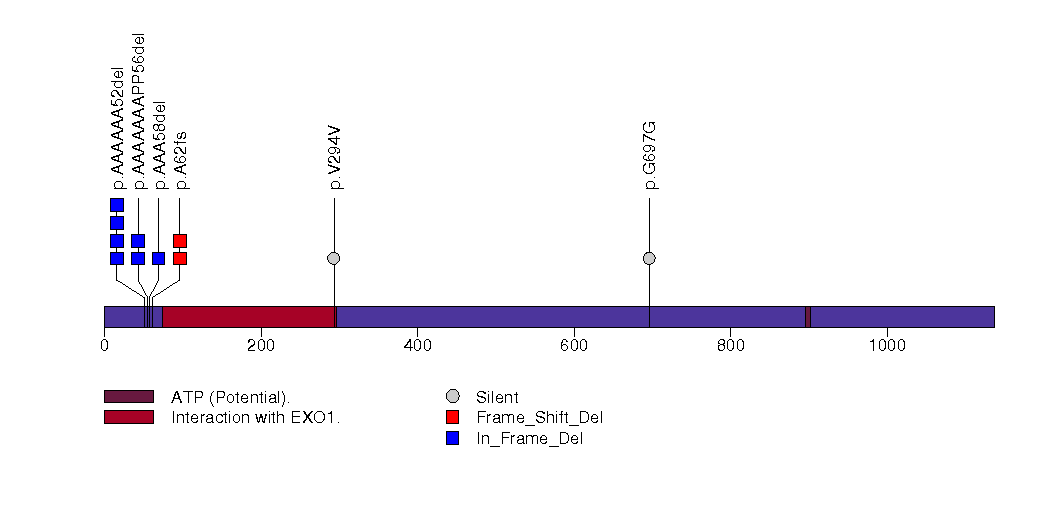
Figure S6. This figure depicts the distribution of mutations and mutation types across the EOMES significant gene.
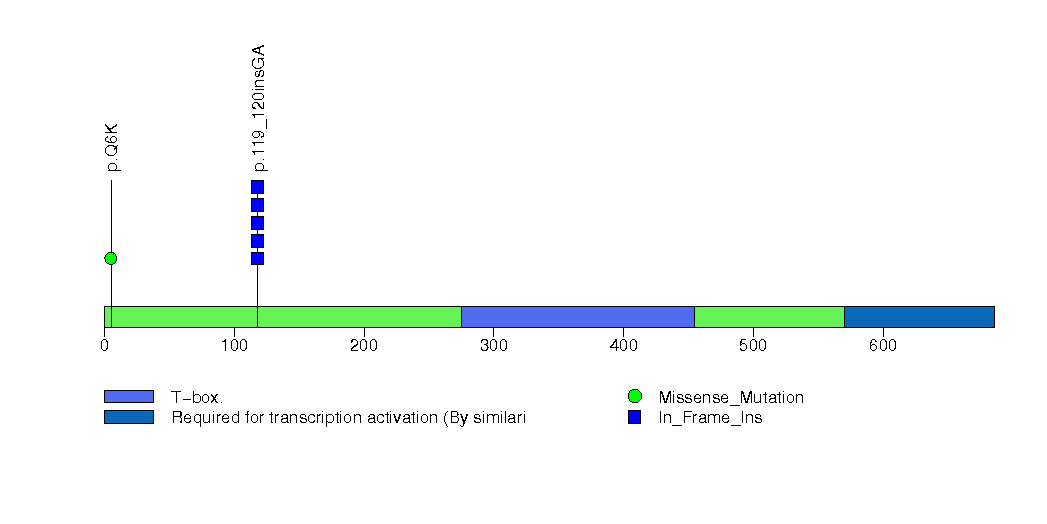
Figure S7. This figure depicts the distribution of mutations and mutation types across the PKD2 significant gene.
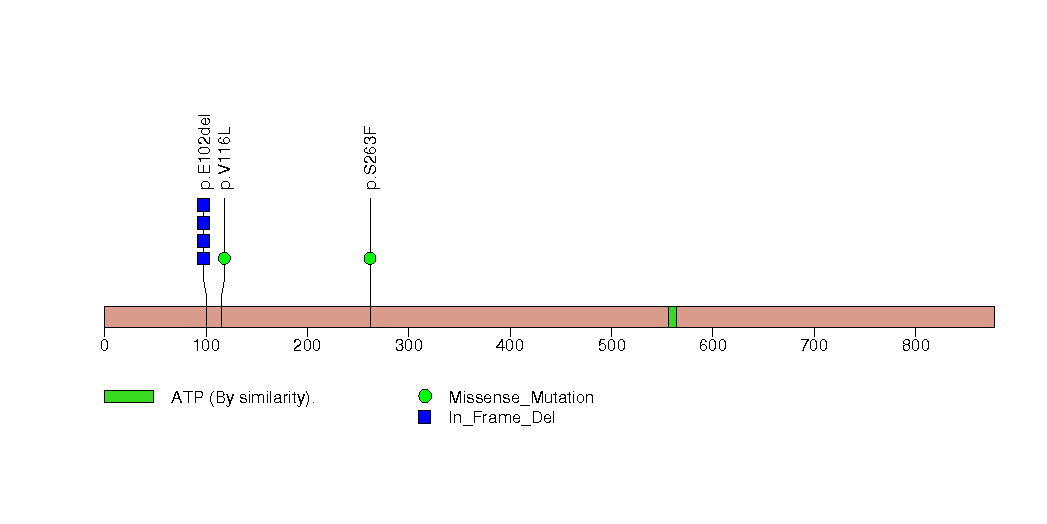
Figure S8. This figure depicts the distribution of mutations and mutation types across the LTBP3 significant gene.
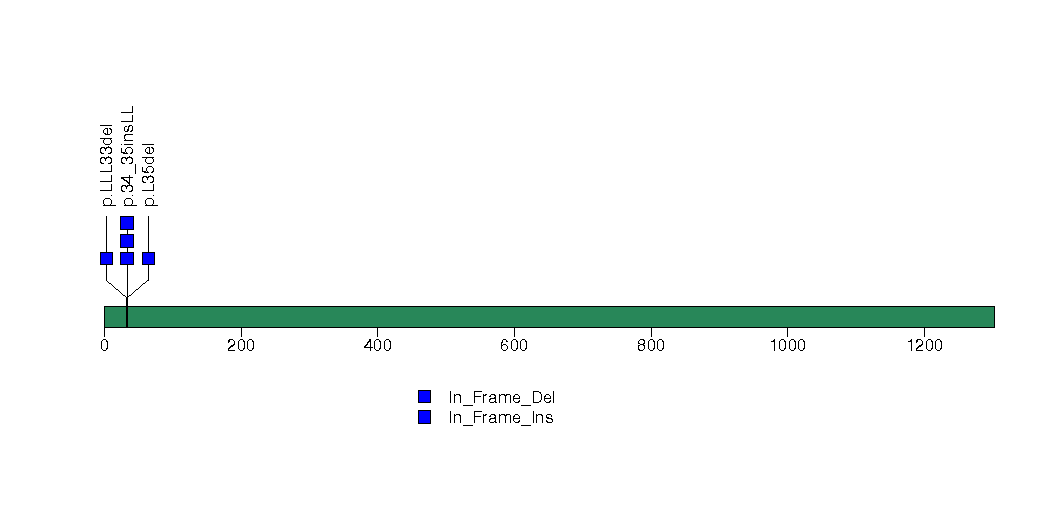
Figure S9. This figure depicts the distribution of mutations and mutation types across the SHROOM4 significant gene.
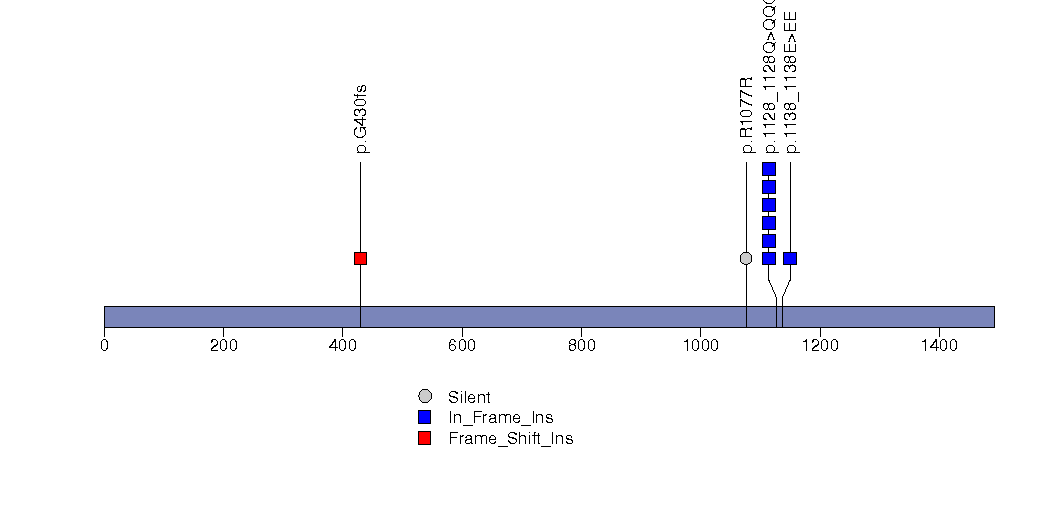
Figure S10. This figure depicts the distribution of mutations and mutation types across the WNK1 significant gene.
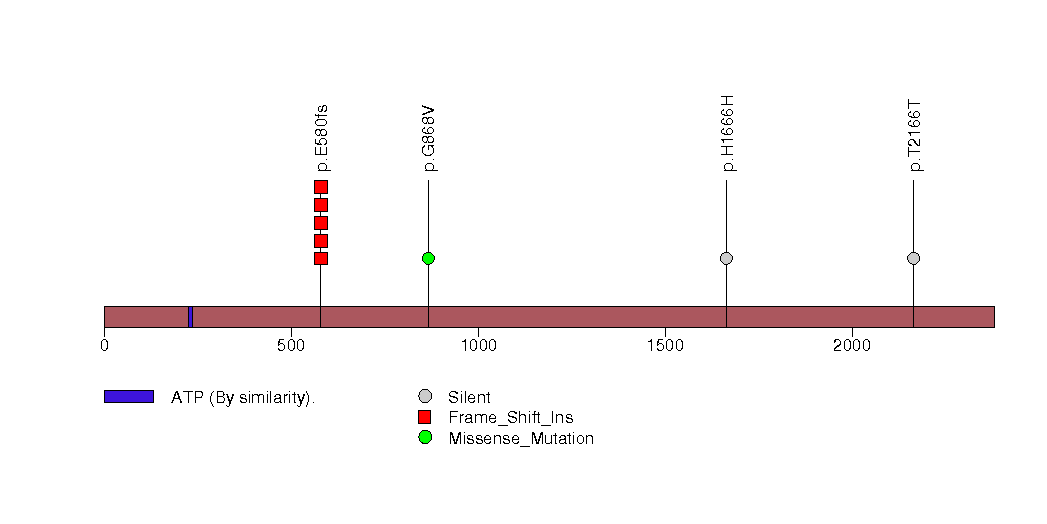
Figure S11. This figure depicts the distribution of mutations and mutation types across the ANP32E significant gene.
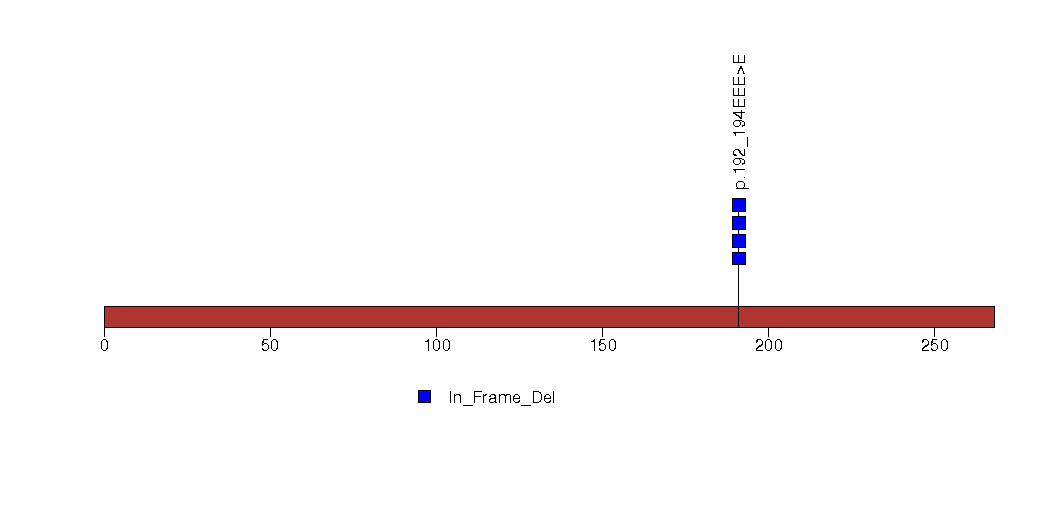
Figure S12. This figure depicts the distribution of mutations and mutation types across the PTEN significant gene.
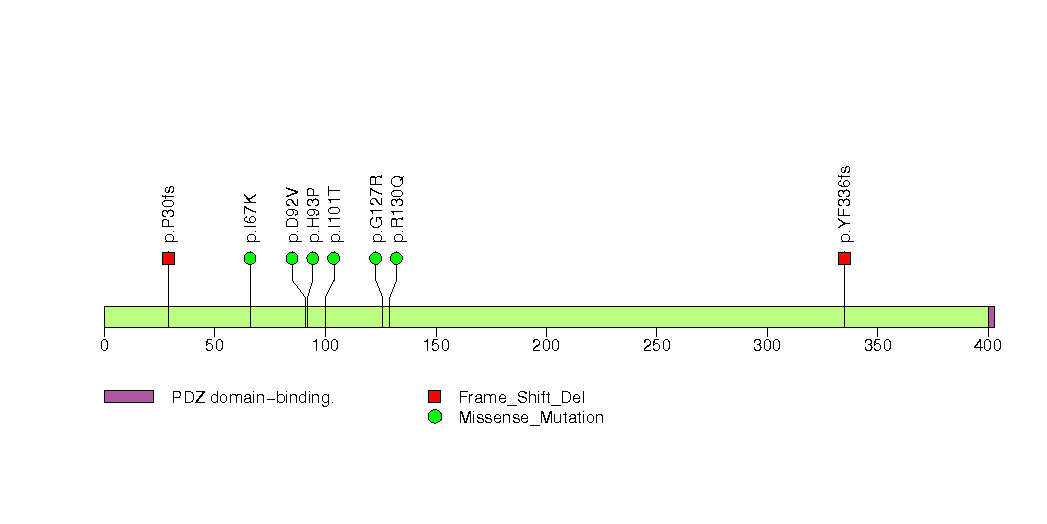
Figure S13. This figure depicts the distribution of mutations and mutation types across the KRTAP5-5 significant gene.
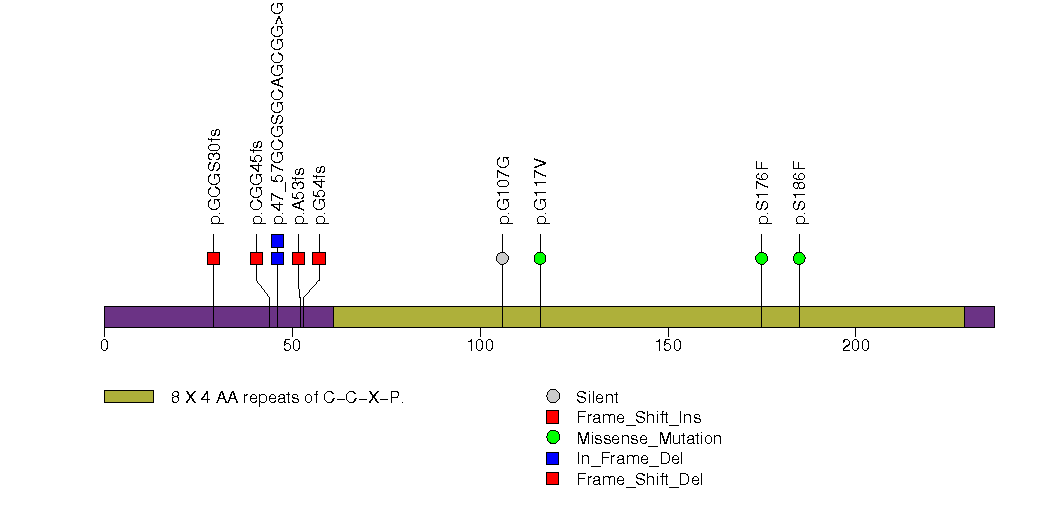
Figure S14. This figure depicts the distribution of mutations and mutation types across the TRAF7 significant gene.
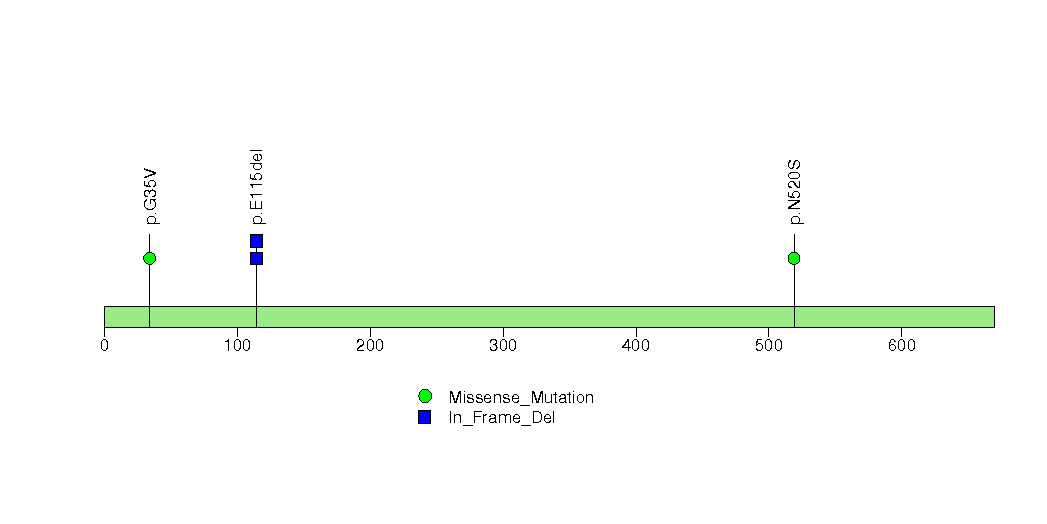
Figure S15. This figure depicts the distribution of mutations and mutation types across the MEGF9 significant gene.
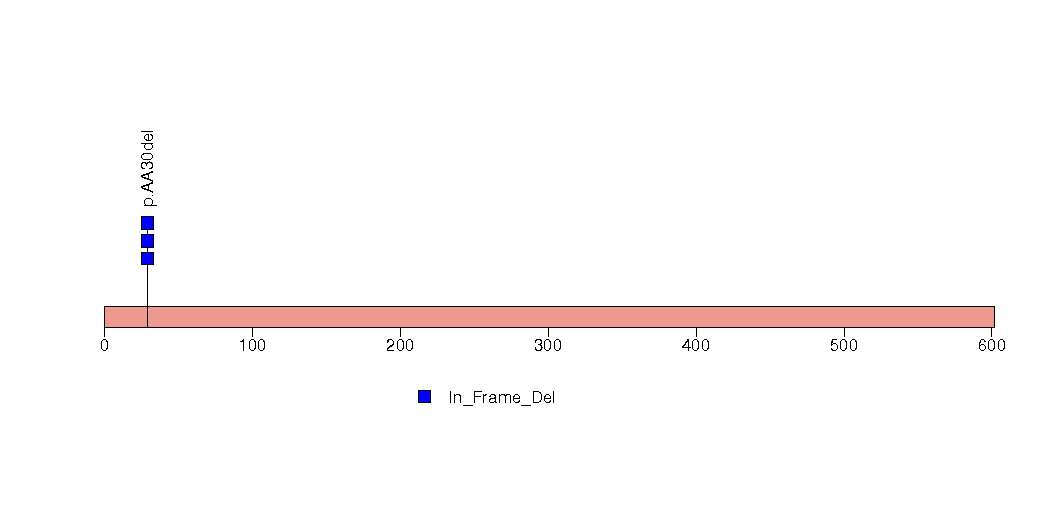
Figure S16. This figure depicts the distribution of mutations and mutation types across the LOR significant gene.
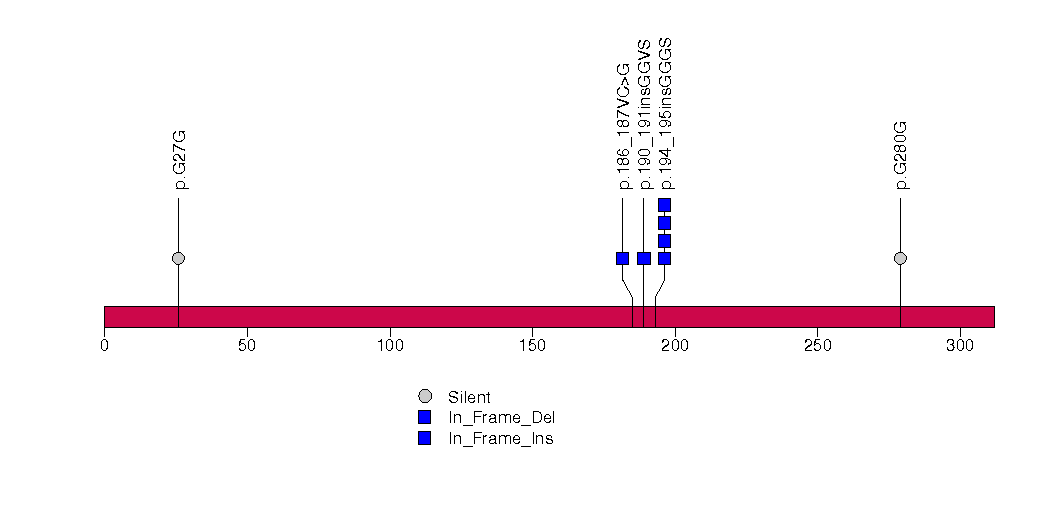
Figure S17. This figure depicts the distribution of mutations and mutation types across the CABLES1 significant gene.
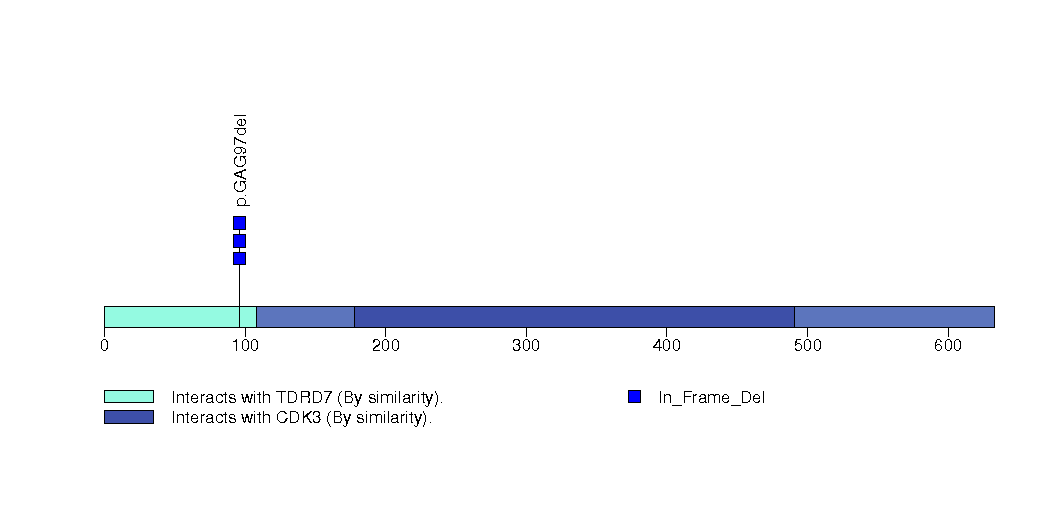
Figure S18. This figure depicts the distribution of mutations and mutation types across the COL18A1 significant gene.
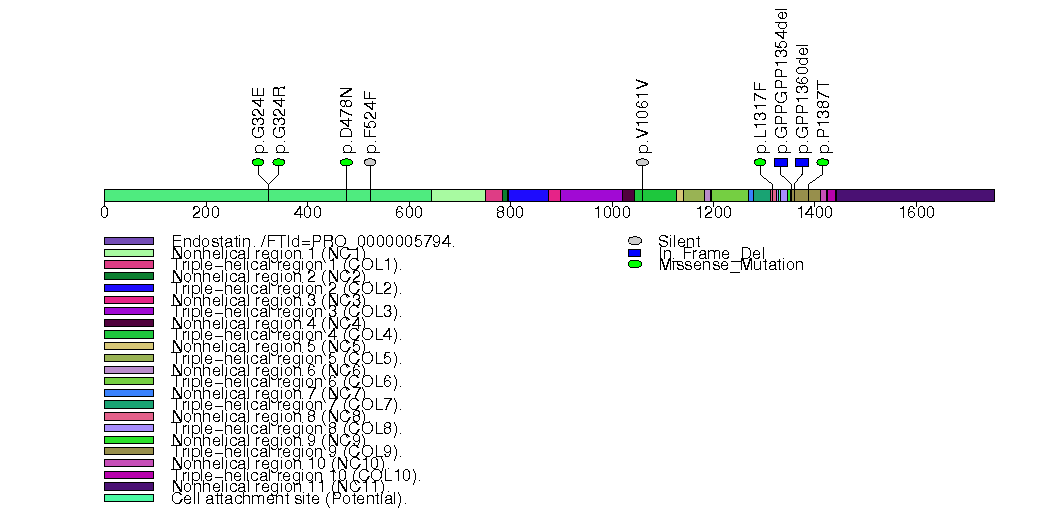
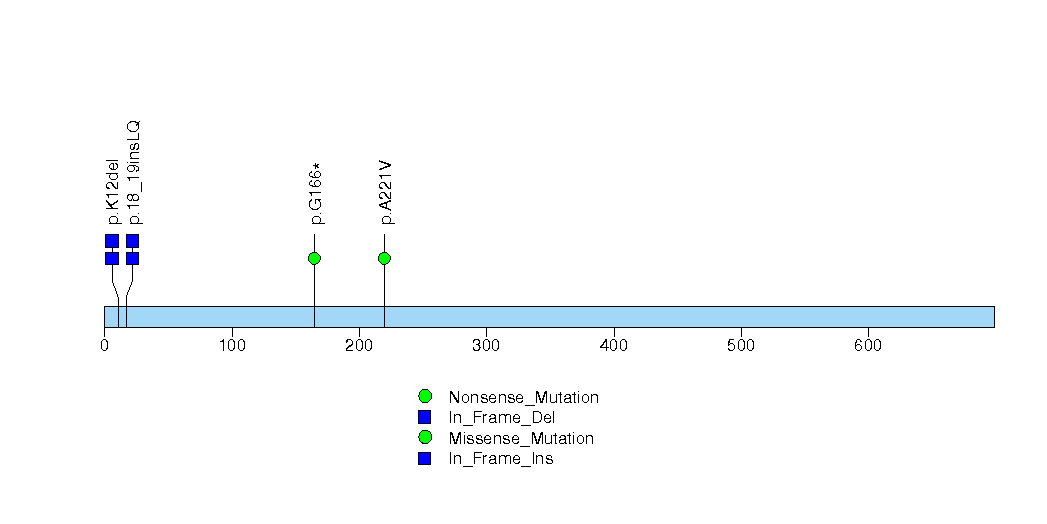
Figure S19. This figure depicts the distribution of mutations and mutation types across the LHCGR significant gene.
In brief, we tabulate the number of mutations and the number of covered bases for each gene. The counts are broken down by mutation context category: four context categories that are discovered by MutSig, and one for indel and 'null' mutations, which include indels, nonsense mutations, splice-site mutations, and non-stop (read-through) mutations. For each gene, we calculate the probability of seeing the observed constellation of mutations, i.e. the product P1 x P2 x ... x Pm, or a more extreme one, given the background mutation rates calculated across the dataset. [1]
In addition to the links below, the full results of the analysis summarized in this report can also be downloaded programmatically using firehose_get, or interactively from either the Broad GDAC website or TCGA Data Coordination Center Portal.