This report serves to describe the mutational landscape and properties of a given individual set, as well as rank genes and genesets according to mutational significance. MutSig v2.0 was used to generate the results found in this report.
-
Working with individual set: TGCT-TP
-
Number of patients in set: 149
The input for this pipeline is a set of individuals with the following files associated for each:
-
An annotated .maf file describing the mutations called for the respective individual, and their properties.
-
A .wig file that contains information about the coverage of the sample.
-
MAF used for this analysis:TGCT-TP.final_analysis_set.maf
-
Blacklist used for this analysis: pancan_mutation_blacklist.v14.hg19.txt
-
Significantly mutated genes (q ≤ 0.1): 48
-
Mutations seen in COSMIC: 77
-
Significantly mutated genes in COSMIC territory: 11
-
Significantly mutated genesets: 3
-
Significantly mutated genesets: (excluding sig. mutated genes):0
-
Read 149 MAFs of type "maf1"
-
Total number of mutations in input MAFs: 14126
-
After removing 55 mutations outside chr1-24: 14071
-
After removing 470 blacklisted mutations: 13601
-
After removing 2387 noncoding mutations: 11214
-
After collapsing adjacent/redundant mutations: 11213
-
Number of mutations before filtering: 11213
-
After removing 876 mutations outside gene set: 10337
-
After removing 8 mutations outside category set: 10329
Table 1. Get Full Table Table representing breakdown of mutations by type.
| type | count |
|---|---|
| De_novo_Start_InFrame | 4 |
| De_novo_Start_OutOfFrame | 5 |
| Frame_Shift_Del | 175 |
| Frame_Shift_Ins | 90 |
| In_Frame_Del | 89 |
| In_Frame_Ins | 22 |
| Missense_Mutation | 6560 |
| Nonsense_Mutation | 433 |
| Nonstop_Mutation | 4 |
| Silent | 2607 |
| Splice_Site | 329 |
| Start_Codon_SNP | 11 |
| Total | 10329 |
Table 2. Get Full Table A breakdown of mutation rates per category discovered for this individual set.
| category | n | N | rate | rate_per_mb | relative_rate | exp_ns_s_ratio |
|---|---|---|---|---|---|---|
| *CpG->(A/T) | 1523 | 277176689 | 5.5e-06 | 5.5 | 3.4 | 2.1 |
| *Cp(A/C/T)->(A/T) | 3330 | 2192395219 | 1.5e-06 | 1.5 | 0.95 | 2.7 |
| A->(C/G) | 1037 | 2336356068 | 4.4e-07 | 0.44 | 0.28 | 3.4 |
| flip | 681 | 4805927976 | 1.4e-07 | 0.14 | 0.088 | 5.3 |
| indel+null | 1144 | 4805927976 | 2.4e-07 | 0.24 | 0.15 | NaN |
| double_null | 7 | 4805927976 | 1.5e-09 | 0.0015 | 0.00091 | NaN |
| Total | 7722 | 4805927976 | 1.6e-06 | 1.6 | 1 | 3.5 |
The x axis represents the samples. The y axis represents the exons, one row per exon, and they are sorted by average coverage across samples. For exons with exactly the same average coverage, they are sorted next by the %GC of the exon. (The secondary sort is especially useful for the zero-coverage exons at the bottom). If the figure is unpopulated, then full coverage is assumed (e.g. MutSig CV doesn't use WIGs and assumes full coverage).
Figure 1.
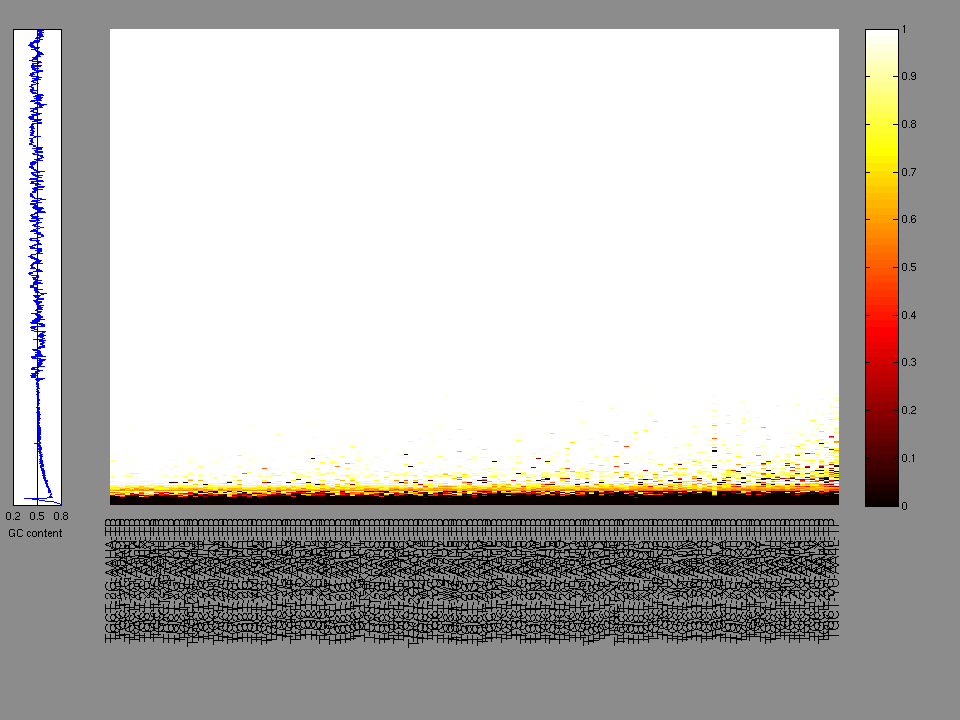
Figure 2. Patients counts and rates file used to generate this plot: TGCT-TP.patients.counts_and_rates.txt

The mutation spectrum is depicted in the lego plots below in which the 96 possible mutation types are subdivided into six large blocks, color-coded to reflect the base substitution type. Each large block is further subdivided into the 16 possible pairs of 5' and 3' neighbors, as listed in the 4x4 trinucleotide context legend. The height of each block corresponds to the mutation frequency for that kind of mutation (counts of mutations normalized by the base coverage in a given bin). The shape of the spectrum is a signature for dominant mutational mechanisms in different tumor types.
Figure 3. Get High-res Image SNV Mutation rate lego plot for entire set. Each bin is normalized by base coverage for that bin. Colors represent the six SNV types on the upper right. The three-base context for each mutation is labeled in the 4x4 legend on the lower right. The fractional breakdown of SNV counts is shown in the pie chart on the upper left. If this figure is blank, not enough information was provided in the MAF to generate it.

Figure 4. Get High-res Image SNV Mutation rate lego plots for 4 slices of mutation allele fraction (0<=AF<0.1, 0.1<=AF<0.25, 0.25<=AF<0.5, & 0.5<=AF) . The color code and three-base context legends are the same as the previous figure. If this figure is blank, not enough information was provided in the MAF to generate it.

Figure 5. Get High-res Image The matrix in the center of the figure represents individual mutations in patient samples, color-coded by type of mutation, for the significantly mutated genes. The rate of synonymous and non-synonymous mutations is displayed at the top of the matrix. The barplot on the left of the matrix shows the number of mutations in each gene. The percentages represent the fraction of tumors with at least one mutation in the specified gene. The barplot to the right of the matrix displays the q-values for the most significantly mutated genes. The purple boxplots below the matrix (only displayed if required columns are present in the provided MAF) represent the distributions of allelic fractions observed in each sample. The plot at the bottom represents the base substitution distribution of individual samples, using the same categories that were used to calculate significance.

Column Descriptions:
-
N = number of sequenced bases in this gene across the individual set
-
n = number of (nonsilent) mutations in this gene across the individual set
-
npat = number of patients (individuals) with at least one nonsilent mutation
-
nsite = number of unique sites having a non-silent mutation
-
nsil = number of silent mutations in this gene across the individual set
-
n1 = number of nonsilent mutations of type: *CpG->(A/T)
-
n2 = number of nonsilent mutations of type: *Cp(A/C/T)->(A/T)
-
n3 = number of nonsilent mutations of type: A->(C/G)
-
n4 = number of nonsilent mutations of type: flip
-
n5 = number of nonsilent mutations of type: indel+null
-
n6 = number of nonsilent mutations of type: double_null
-
p_classic = p-value for the observed amount of nonsilent mutations being elevated in this gene
-
p_ns_s = p-value for the observed nonsilent/silent ratio being elevated in this gene
-
p_cons = p-value for enrichment of mutations at evolutionarily most-conserved sites in gene
-
p_joint = p-value for clustering + conservation
-
p = p-value (overall)
-
q = q-value, False Discovery Rate (Benjamini-Hochberg procedure)
Table 3. Get Full Table A Ranked List of Significantly Mutated Genes. Number of significant genes found: 48. Number of genes displayed: 35. Click on a gene name to display its stick figure depicting the distribution of mutations and mutation types across the chosen gene (this feature may not be available for all significant genes).
| rank | gene | description | N | n | npat | nsite | nsil | n1 | n2 | n3 | n4 | n5 | n6 | p_classic | p_ns_s | p_clust | p_cons | p_joint | p | q |
|---|---|---|---|---|---|---|---|---|---|---|---|---|---|---|---|---|---|---|---|---|
| 1 | KRAS | v-Ki-ras2 Kirsten rat sarcoma viral oncogene homolog | 105343 | 19 | 19 | 7 | 0 | 0 | 8 | 3 | 8 | 0 | 0 | <1.00e-15 | 0.029 | 0.00054 | 0.00041 | 0.000037 | <0.000 | <0.000 |
| 2 | KIT | v-kit Hardy-Zuckerman 4 feline sarcoma viral oncogene homolog | 449194 | 27 | 26 | 13 | 0 | 0 | 5 | 8 | 11 | 3 | 0 | 4.33e-15 | 0.0034 | 0 | 0 | 0 | <1.00e-15 | <4.67e-12 |
| 3 | FAM104B | family with sequence similarity 104, member B | 48754 | 11 | 7 | 3 | 0 | 0 | 1 | 0 | 5 | 5 | 0 | 1.27e-14 | 0.15 | 0 | 0.4 | 0 | <1.00e-15 | <4.67e-12 |
| 4 | PNPLA4 | patatin-like phospholipase domain containing 4 | 116976 | 5 | 5 | 1 | 0 | 0 | 0 | 5 | 0 | 0 | 0 | 4.50e-08 | 0.27 | 0 | 0.042 | 0 | <1.00e-15 | <4.67e-12 |
| 5 | NRAS | neuroblastoma RAS viral (v-ras) oncogene homolog | 87314 | 7 | 7 | 4 | 0 | 0 | 3 | 4 | 0 | 0 | 0 | 4.36e-11 | 0.14 | 0.0026 | 0.083 | 0.0038 | 5.00e-12 | 1.87e-08 |
| 6 | SP8 | Sp8 transcription factor | 124935 | 6 | 6 | 1 | 0 | 6 | 0 | 0 | 0 | 0 | 0 | 7.89e-07 | 0.052 | 0 | 0.98 | 2.2e-06 | 4.87e-11 | 1.52e-07 |
| 7 | TPTE2 | transmembrane phosphoinositide 3-phosphatase and tensin homolog 2 | 242626 | 5 | 5 | 1 | 2 | 0 | 0 | 0 | 0 | 5 | 0 | 6.36e-06 | 0.75 | 1.4e-06 | 0.99 | 2.4e-06 | 3.95e-10 | 9.35e-07 |
| 8 | MUC6 | mucin 6, oligomeric mucus/gel-forming | 1077081 | 15 | 15 | 11 | 3 | 1 | 9 | 1 | 4 | 0 | 0 | 2.40e-07 | 0.23 | 9.6e-06 | 0.95 | 0.000064 | 4.01e-10 | 9.35e-07 |
| 9 | MUC4 | mucin 4, cell surface associated | 539634 | 27 | 20 | 25 | 5 | 2 | 15 | 5 | 5 | 0 | 0 | 1.74e-09 | 0.12 | NaN | NaN | NaN | 1.74e-09 | 3.62e-06 |
| 10 | ERC1 | ELKS/RAB6-interacting/CAST family member 1 | 509509 | 7 | 7 | 3 | 0 | 1 | 0 | 5 | 1 | 0 | 0 | 1.25e-06 | 0.17 | 0.00072 | 0.0048 | 0.000069 | 2.07e-09 | 3.87e-06 |
| 11 | ATXN3 | ataxin 3 | 168326 | 4 | 4 | 1 | 0 | 0 | 0 | 0 | 0 | 4 | 0 | 1.53e-05 | 1 | 6e-07 | 1 | 0.000037 | 1.27e-08 | 2.15e-05 |
| 12 | PCMTD1 | protein-L-isoaspartate (D-aspartate) O-methyltransferase domain containing 1 | 162374 | 6 | 5 | 5 | 0 | 0 | 4 | 2 | 0 | 0 | 0 | 2.12e-06 | 0.24 | 0.00044 | 0.97 | 0.0005 | 2.29e-08 | 3.56e-05 |
| 13 | CSGALNACT2 | chondroitin sulfate N-acetylgalactosaminyltransferase 2 | 246792 | 5 | 5 | 2 | 0 | 0 | 2 | 0 | 0 | 3 | 0 | 9.85e-06 | 0.27 | 0.00011 | 0.57 | 0.00015 | 3.20e-08 | 4.49e-05 |
| 14 | FANK1 | fibronectin type III and ankyrin repeat domains 1 | 159300 | 4 | 4 | 1 | 0 | 0 | 0 | 0 | 0 | 4 | 0 | 1.63e-05 | 0.34 | 0.000025 | 1 | 0.000097 | 3.37e-08 | 4.49e-05 |
| 15 | NBPF10 | neuroblastoma breakpoint family, member 10 | 911116 | 7 | 7 | 2 | 0 | 0 | 0 | 0 | 7 | 0 | 0 | 9.76e-06 | 0.36 | 0.00022 | 1 | 0.00057 | 1.11e-07 | 0.000139 |
| 16 | PSMD11 | proteasome (prosome, macropain) 26S subunit, non-ATPase, 11 | 196820 | 4 | 4 | 1 | 0 | 4 | 0 | 0 | 0 | 0 | 0 | 2.65e-05 | 0.21 | 0.00011 | 0.66 | 0.00029 | 1.52e-07 | 0.000177 |
| 17 | KRTAP1-1 | keratin associated protein 1-1 | 80162 | 3 | 3 | 1 | 0 | 0 | 0 | 3 | 0 | 0 | 0 | 1.16e-05 | 0.51 | 0.0001 | 0.88 | 0.00085 | 1.91e-07 | 0.000210 |
| 18 | RHPN2 | rhophilin, Rho GTPase binding protein 2 | 294827 | 6 | 6 | 3 | 1 | 1 | 5 | 0 | 0 | 0 | 0 | 9.81e-06 | 0.26 | 0.0047 | 0.016 | 0.0011 | 2.13e-07 | 0.000211 |
| 19 | DEK | DEK oncogene (DNA binding) | 174028 | 5 | 5 | 2 | 0 | 0 | 1 | 0 | 4 | 0 | 0 | 1.48e-06 | 0.5 | 0.0039 | 1 | 0.0075 | 2.15e-07 | 0.000211 |
| 20 | SP4 | Sp4 transcription factor | 354431 | 4 | 4 | 1 | 0 | 0 | 4 | 0 | 0 | 0 | 0 | 0.00154 | 0.47 | 1.2e-06 | 0.94 | 1e-05 | 2.93e-07 | 0.000274 |
| 21 | SPIN2A | spindlin family, member 2A | 116362 | 3 | 3 | 1 | 0 | 0 | 0 | 3 | 0 | 0 | 0 | 0.000115 | 0.42 | 0.00011 | 0.046 | 0.00032 | 6.65e-07 | 0.000591 |
| 22 | DDX11 | DEAD/H (Asp-Glu-Ala-Asp/His) box polypeptide 11 (CHL1-like helicase homolog, S. cerevisiae) | 450278 | 8 | 8 | 4 | 1 | 1 | 2 | 0 | 2 | 3 | 0 | 1.30e-07 | 0.57 | 0.17 | 0.87 | 0.35 | 8.19e-07 | 0.000695 |
| 23 | FAM101B | family with sequence similarity 101, member B | 66098 | 4 | 4 | 3 | 0 | 0 | 1 | 2 | 0 | 1 | 0 | 8.19e-07 | 0.3 | 0.048 | 0.94 | 0.1 | 1.47e-06 | 0.00119 |
| 24 | KRTAP10-10 | keratin associated protein 10-10 | 113016 | 5 | 5 | 1 | 2 | 5 | 0 | 0 | 0 | 0 | 0 | 0.000317 | 0.6 | 0.000011 | 0.61 | 0.00033 | 1.77e-06 | 0.00138 |
| 25 | MLLT3 | myeloid/lymphoid or mixed-lineage leukemia (trithorax homolog, Drosophila); translocated to, 3 | 258821 | 4 | 4 | 2 | 1 | 0 | 0 | 0 | 1 | 3 | 0 | 8.56e-05 | 0.97 | 0.0005 | 0.93 | 0.0014 | 2.05e-06 | 0.00153 |
| 26 | CDC27 | cell division cycle 27 homolog (S. cerevisiae) | 359494 | 6 | 6 | 4 | 1 | 0 | 1 | 1 | 0 | 4 | 0 | 1.30e-06 | 0.39 | 0.1 | 0.55 | 0.17 | 3.53e-06 | 0.00254 |
| 27 | SSBP3 | single stranded DNA binding protein 3 | 184464 | 3 | 3 | 1 | 0 | 0 | 0 | 3 | 0 | 0 | 0 | 0.000366 | 0.39 | 0.00017 | 0.75 | 0.00062 | 3.68e-06 | 0.00254 |
| 28 | BCL11B | B-cell CLL/lymphoma 11B (zinc finger protein) | 251714 | 5 | 5 | 3 | 0 | 1 | 1 | 0 | 3 | 0 | 0 | 1.47e-05 | 0.24 | 0.0075 | 1 | 0.022 | 5.21e-06 | 0.00347 |
| 29 | RUNX2 | runt-related transcription factor 2 | 226399 | 4 | 4 | 2 | 2 | 1 | 0 | 0 | 3 | 0 | 0 | 0.00782 | 0.86 | 0.000012 | 0.58 | 0.000058 | 7.08e-06 | 0.00456 |
| 30 | HSF4 | heat shock transcription factor 4 | 184689 | 6 | 6 | 5 | 0 | 2 | 2 | 2 | 0 | 0 | 0 | 4.80e-07 | 0.15 | 0.77 | 0.9 | 1 | 7.46e-06 | 0.00464 |
| 31 | LHCGR | luteinizing hormone/choriogonadotropin receptor | 304957 | 3 | 3 | 2 | 0 | 0 | 0 | 0 | 3 | 0 | 0 | 0.000949 | 0.58 | 0.00013 | 0.86 | 0.00063 | 9.20e-06 | 0.00554 |
| 32 | RAC1 | ras-related C3 botulinum toxin substrate 1 (rho family, small GTP binding protein Rac1) | 92618 | 4 | 4 | 3 | 0 | 0 | 0 | 1 | 2 | 1 | 0 | 1.07e-06 | 0.32 | 0.34 | 0.24 | 0.62 | 1.00e-05 | 0.00585 |
| 33 | ZNF814 | zinc finger protein 814 | 384311 | 5 | 5 | 2 | 2 | 0 | 0 | 4 | 0 | 1 | 0 | 0.0134 | 0.79 | 0.000011 | 0.68 | 0.000065 | 1.29e-05 | 0.00731 |
| 34 | ZNF680 | zinc finger protein 680 | 244023 | 3 | 3 | 1 | 0 | 3 | 0 | 0 | 0 | 0 | 0 | 0.000109 | 0.42 | 0.045 | 0.42 | 0.013 | 2.01e-05 | 0.0110 |
| 35 | ZNF799 | zinc finger protein 799 | 290247 | 5 | 4 | 4 | 0 | 0 | 0 | 4 | 0 | 1 | 0 | 0.000355 | 0.29 | 0.0027 | 0.19 | 0.0051 | 2.56e-05 | 0.0137 |
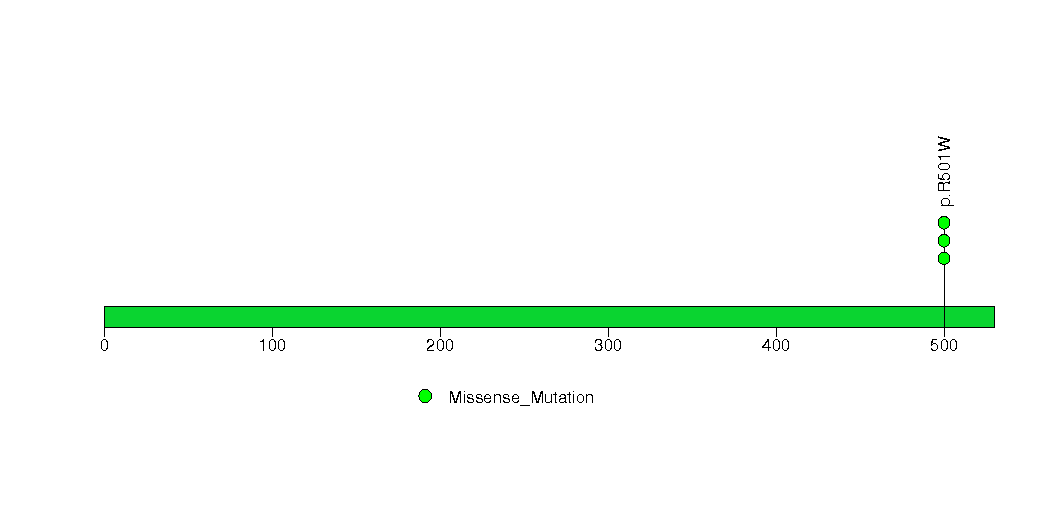
Figure S1. This figure depicts the distribution of mutations and mutation types across the KRAS significant gene.

Figure S2. This figure depicts the distribution of mutations and mutation types across the KIT significant gene.
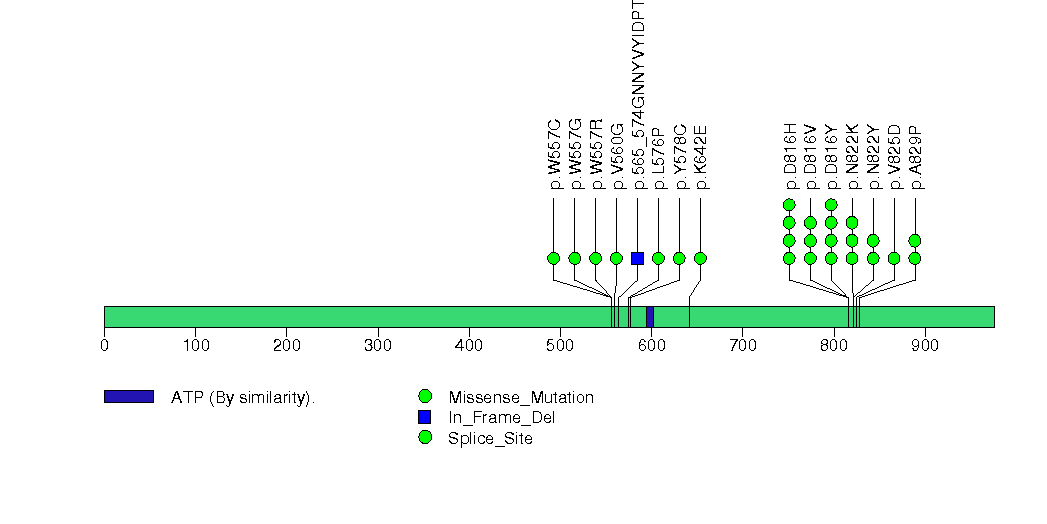
Figure S3. This figure depicts the distribution of mutations and mutation types across the FAM104B significant gene.
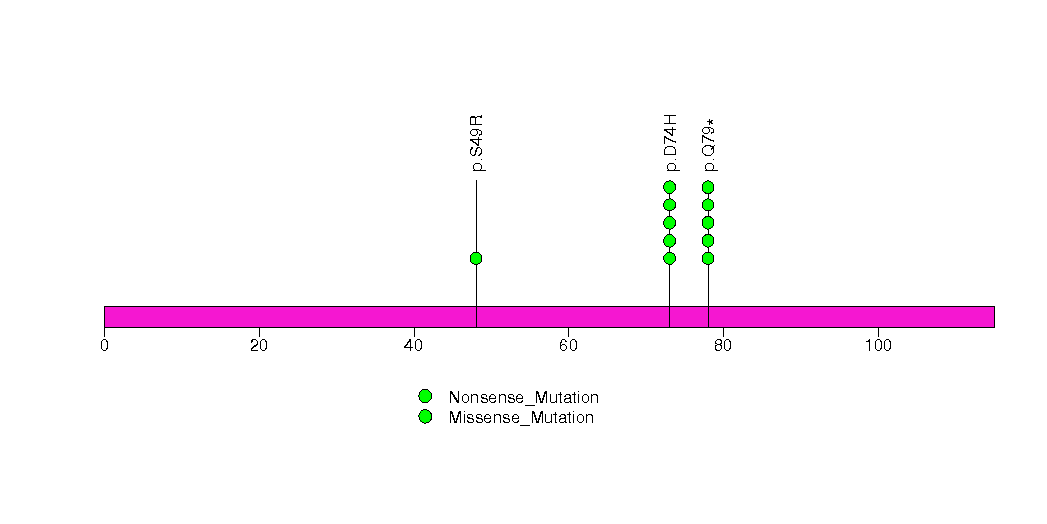
Figure S4. This figure depicts the distribution of mutations and mutation types across the PNPLA4 significant gene.

Figure S5. This figure depicts the distribution of mutations and mutation types across the NRAS significant gene.
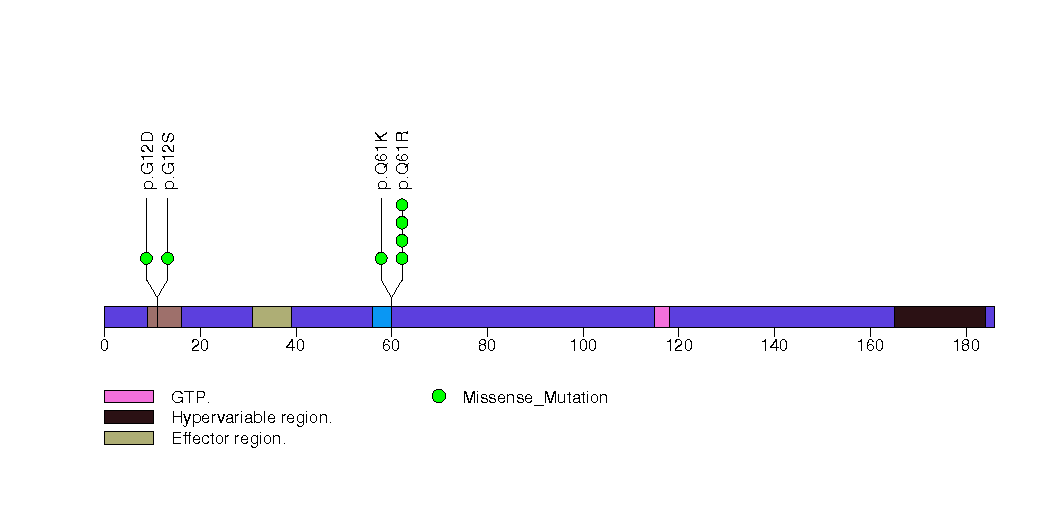
Figure S6. This figure depicts the distribution of mutations and mutation types across the SP8 significant gene.

Figure S7. This figure depicts the distribution of mutations and mutation types across the TPTE2 significant gene.

Figure S8. This figure depicts the distribution of mutations and mutation types across the MUC6 significant gene.
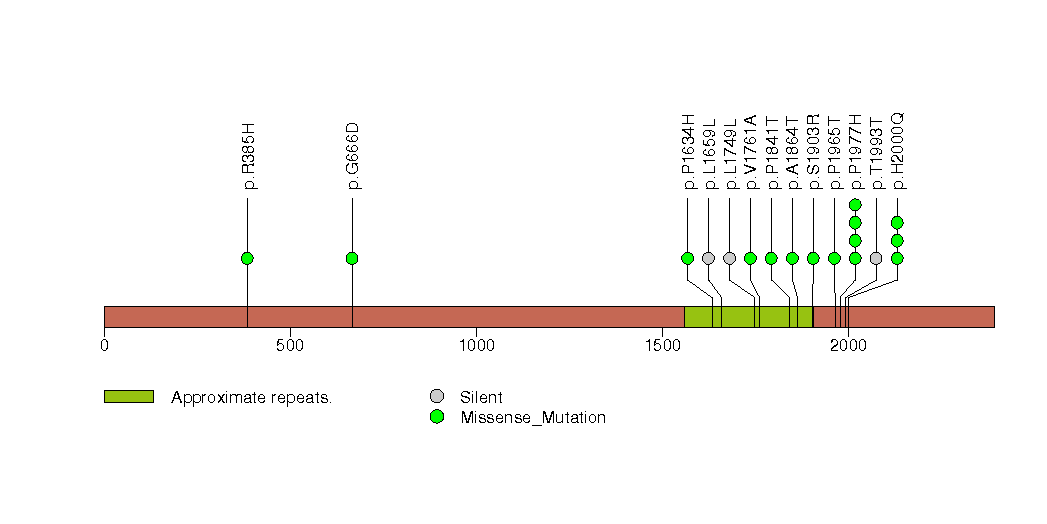
Figure S9. This figure depicts the distribution of mutations and mutation types across the MUC4 significant gene.

Figure S10. This figure depicts the distribution of mutations and mutation types across the ERC1 significant gene.
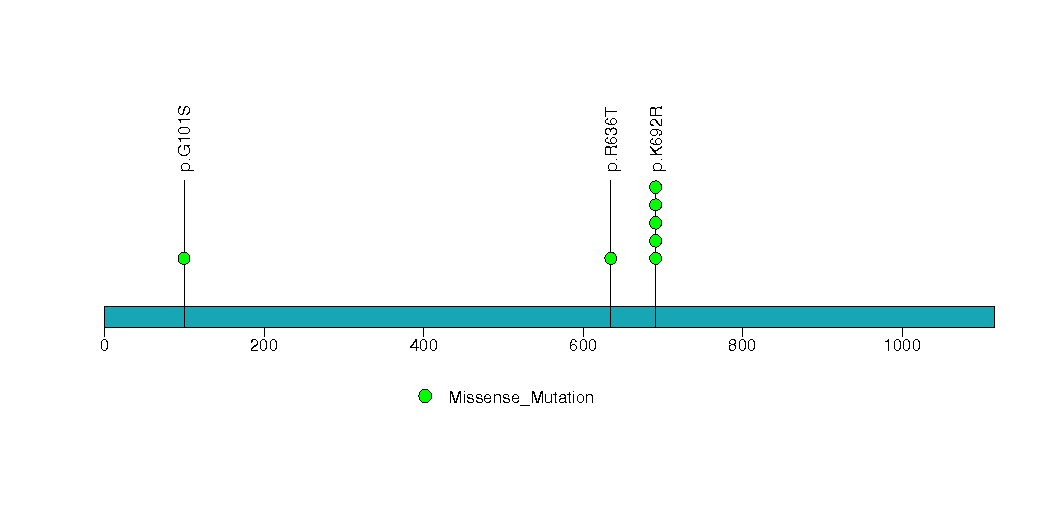
Figure S11. This figure depicts the distribution of mutations and mutation types across the ATXN3 significant gene.

Figure S12. This figure depicts the distribution of mutations and mutation types across the PCMTD1 significant gene.

Figure S13. This figure depicts the distribution of mutations and mutation types across the CSGALNACT2 significant gene.

Figure S14. This figure depicts the distribution of mutations and mutation types across the FANK1 significant gene.

Figure S15. This figure depicts the distribution of mutations and mutation types across the NBPF10 significant gene.

Figure S16. This figure depicts the distribution of mutations and mutation types across the PSMD11 significant gene.

Figure S17. This figure depicts the distribution of mutations and mutation types across the KRTAP1-1 significant gene.
Figure S18. This figure depicts the distribution of mutations and mutation types across the RHPN2 significant gene.

Figure S19. This figure depicts the distribution of mutations and mutation types across the DEK significant gene.
Figure S20. This figure depicts the distribution of mutations and mutation types across the SP4 significant gene.
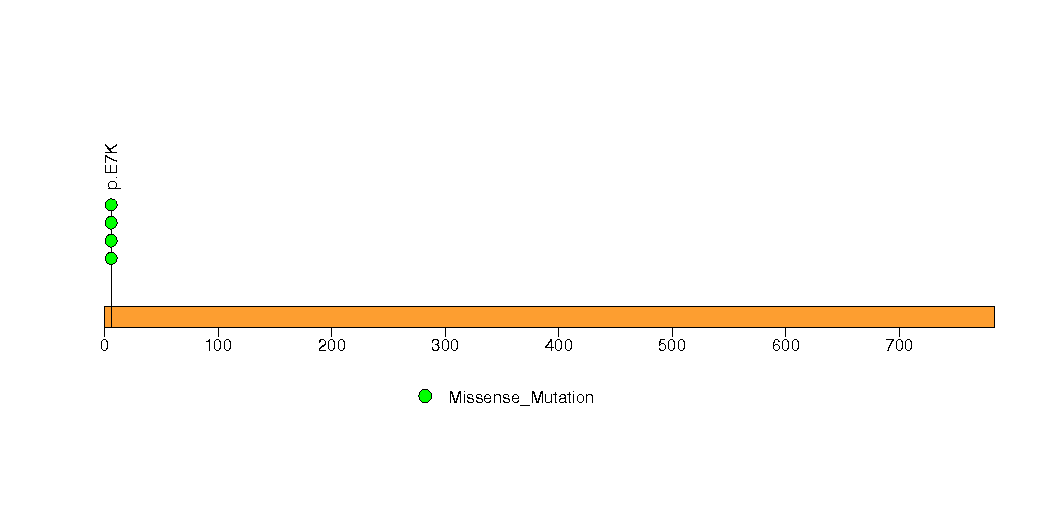
Figure S21. This figure depicts the distribution of mutations and mutation types across the SPIN2A significant gene.

Figure S22. This figure depicts the distribution of mutations and mutation types across the DDX11 significant gene.
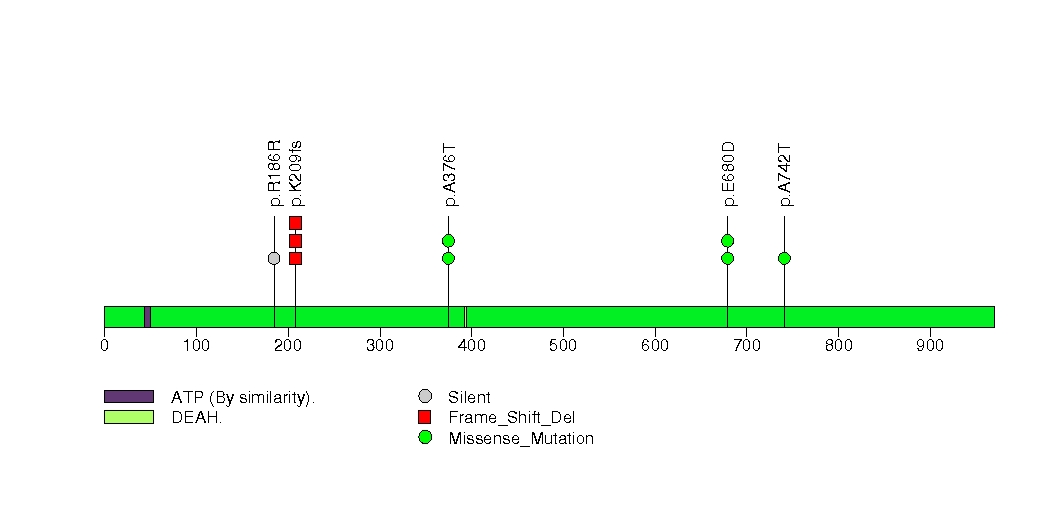
Figure S23. This figure depicts the distribution of mutations and mutation types across the FAM101B significant gene.

Figure S24. This figure depicts the distribution of mutations and mutation types across the KRTAP10-10 significant gene.

Figure S25. This figure depicts the distribution of mutations and mutation types across the MLLT3 significant gene.
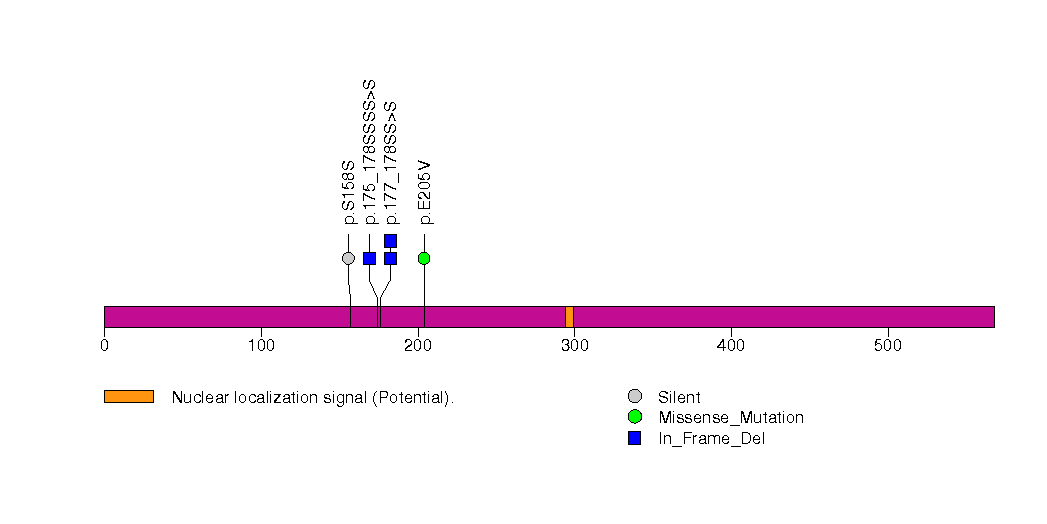
Figure S26. This figure depicts the distribution of mutations and mutation types across the CDC27 significant gene.
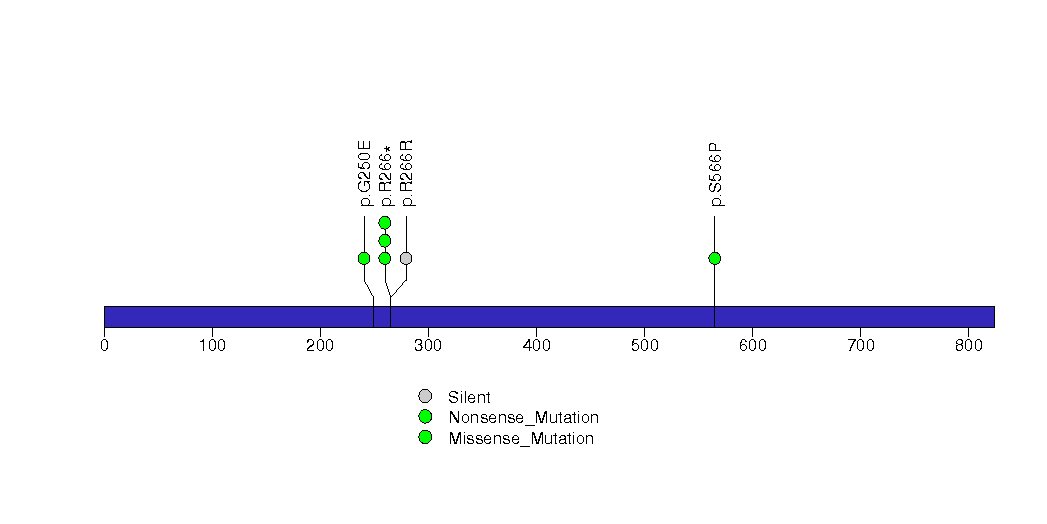
Figure S27. This figure depicts the distribution of mutations and mutation types across the SSBP3 significant gene.

Figure S28. This figure depicts the distribution of mutations and mutation types across the BCL11B significant gene.
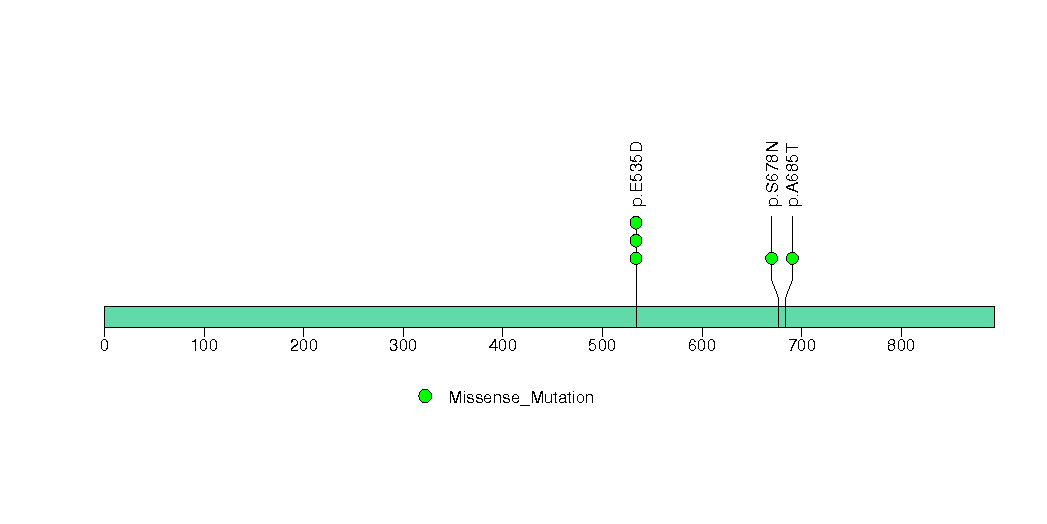
Figure S29. This figure depicts the distribution of mutations and mutation types across the RUNX2 significant gene.
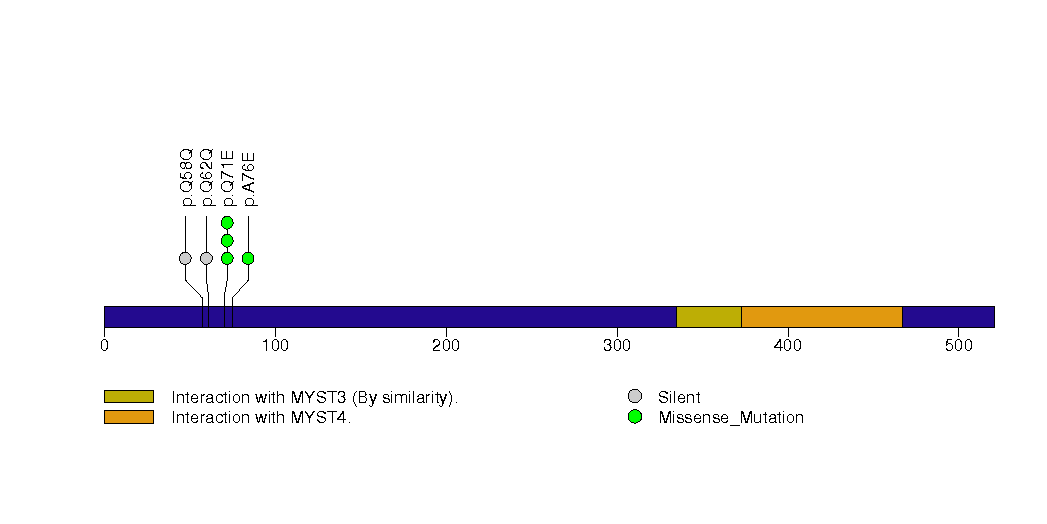
Figure S30. This figure depicts the distribution of mutations and mutation types across the HSF4 significant gene.
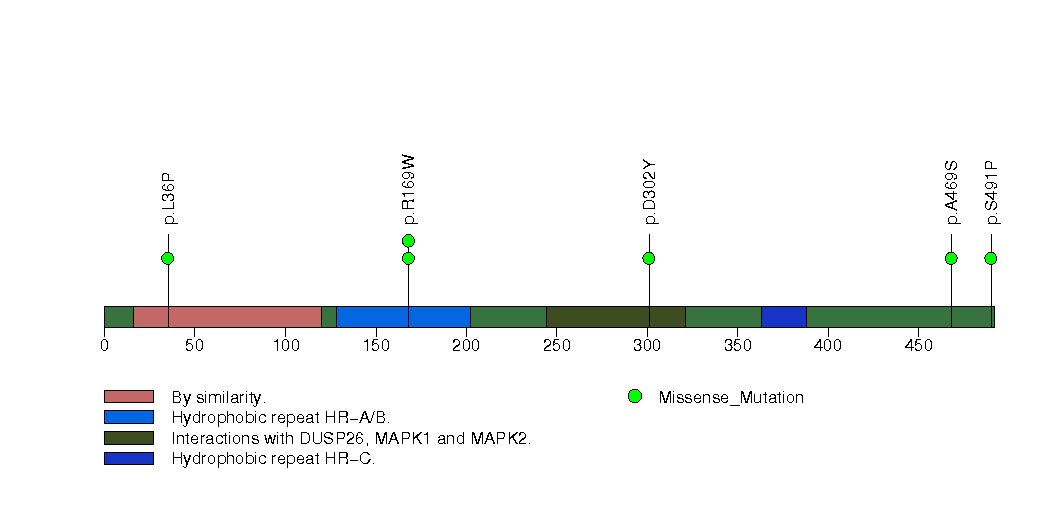
Figure S31. This figure depicts the distribution of mutations and mutation types across the LHCGR significant gene.

Figure S32. This figure depicts the distribution of mutations and mutation types across the RAC1 significant gene.
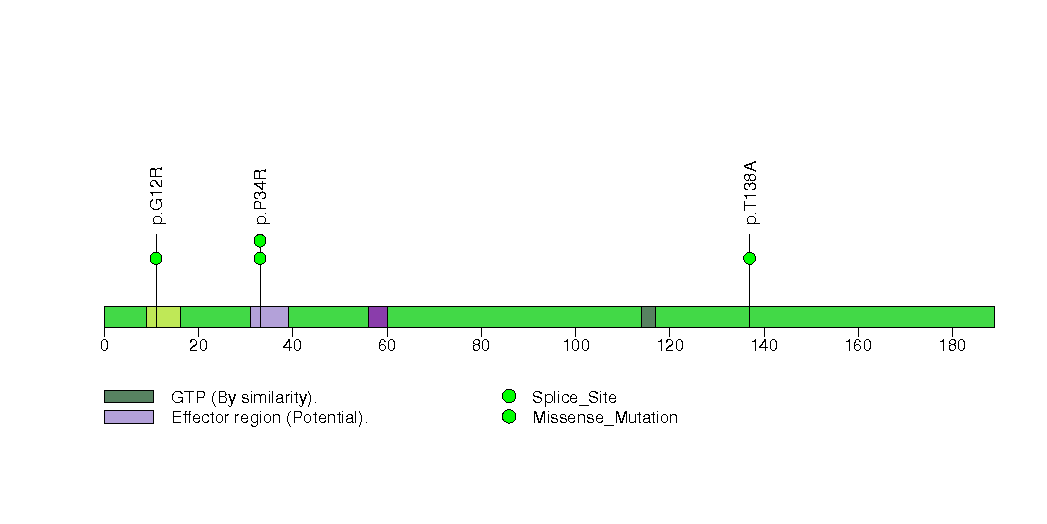
Figure S33. This figure depicts the distribution of mutations and mutation types across the ZNF814 significant gene.

Figure S34. This figure depicts the distribution of mutations and mutation types across the ZNF680 significant gene.
In this analysis, COSMIC is used as a filter to increase power by restricting the territory of each gene. Cosmic version: v48.
Table 4. Get Full Table Significantly mutated genes (COSMIC territory only). To access the database please go to: COSMIC. Number of significant genes found: 11. Number of genes displayed: 10
| rank | gene | description | n | cos | n_cos | N_cos | cos_ev | p | q |
|---|---|---|---|---|---|---|---|---|---|
| 1 | KRAS | v-Ki-ras2 Kirsten rat sarcoma viral oncogene homolog | 19 | 52 | 19 | 7748 | 117424 | 0 | 0 |
| 2 | NRAS | neuroblastoma RAS viral (v-ras) oncogene homolog | 7 | 33 | 7 | 4917 | 7705 | 0 | 0 |
| 3 | KIT | v-kit Hardy-Zuckerman 4 feline sarcoma viral oncogene homolog | 27 | 240 | 27 | 35760 | 10702 | 0 | 0 |
| 4 | PIK3CA | phosphoinositide-3-kinase, catalytic, alpha polypeptide | 3 | 220 | 3 | 32780 | 1335 | 0.000023 | 0.027 |
| 5 | AVPR2 | arginine vasopressin receptor 2 (nephrogenic diabetes insipidus) | 1 | 1 | 1 | 149 | 0 | 0.00024 | 0.099 |
| 6 | CCNL2 | cyclin L2 | 1 | 1 | 1 | 149 | 1 | 0.00024 | 0.099 |
| 7 | FAAH | fatty acid amide hydrolase | 1 | 1 | 1 | 149 | 1 | 0.00024 | 0.099 |
| 8 | LYPLA1 | lysophospholipase I | 1 | 1 | 1 | 149 | 1 | 0.00024 | 0.099 |
| 9 | MAP3K7 | mitogen-activated protein kinase kinase kinase 7 | 2 | 1 | 1 | 149 | 1 | 0.00024 | 0.099 |
| 10 | PTK7 | PTK7 protein tyrosine kinase 7 | 1 | 1 | 1 | 149 | 1 | 0.00024 | 0.099 |
Note:
n - number of (nonsilent) mutations in this gene across the individual set.
cos = number of unique mutated sites in this gene in COSMIC
n_cos = overlap between n and cos.
N_cos = number of individuals times cos.
cos_ev = total evidence: number of reports in COSMIC for mutations seen in this gene.
p = p-value for seeing the observed amount of overlap in this gene)
q = q-value, False Discovery Rate (Benjamini-Hochberg procedure)
Table 5. Get Full Table A Ranked List of Significantly Mutated Genesets. (Source: MSigDB GSEA Cannonical Pathway Set).Number of significant genesets found: 3. Number of genesets displayed: 10
| rank | geneset | description | genes | N_genes | mut_tally | N | n | npat | nsite | nsil | n1 | n2 | n3 | n4 | n5 | n6 | p_ns_s | p | q |
|---|---|---|---|---|---|---|---|---|---|---|---|---|---|---|---|---|---|---|---|
| 1 | BADPATHWAY | When phosphorylated, BAD is inhibited by sequestration; when non-phosphorylated, it promotes apoptosis by inactivating pro-survival BCL-XL and BCL-2. | ADCY1, AKT1, BAD, BAX, BCL2, BCL2L1, CSF2RB, IGF1, IGF1R, IL3, IL3RA, KIT, KITLG, PIK3CA, PIK3R1, PRKACB, PRKACG, PRKAR1A, PRKAR1B, PRKAR2A, PRKAR2B, YWHAH | 22 | BCL2L1(1), IL3RA(1), KIT(27), PIK3CA(3), PIK3R1(1), PRKAR2B(2) | 5007558 | 35 | 32 | 20 | 5 | 0 | 10 | 9 | 13 | 3 | 0 | 0.11 | 6.5e-07 | 0.0004 |
| 2 | CDC42RACPATHWAY | PI3 kinase stimulates cell migration by activating cdc42, which activates ARP2/3, which in turn promotes formation of new actin fibers. | ACTR2, ACTR3, ARHA, ARPC1A, ARPC1B, ARPC2, ARPC3, ARPC4, CDC42, PAK1, PDGFRA, PIK3CA, PIK3R1, RAC1, WASL | 14 | ARPC1B(1), ARPC2(1), PAK1(1), PDGFRA(1), PIK3CA(3), PIK3R1(1), RAC1(4), WASL(2) | 3047557 | 14 | 14 | 12 | 0 | 1 | 7 | 2 | 3 | 1 | 0 | 0.025 | 0.000094 | 0.029 |
| 3 | NKCELLSPATHWAY | Natural killer (NK) lymphocytes are inhibited by MHC and activated by surface glycoproteins on tumor or virus-infected cells, which undergo perforin-mediated lysis. | B2M, HLA-A, IL18, ITGB1, KLRC1, KLRC2, KLRC3, KLRC4, KLRD1, LAT, MAP2K1, MAPK3, PAK1, PIK3CA, PIK3R1, PTK2B, PTPN6, RAC1, SYK, VAV1 | 20 | HLA-A(1), KLRC3(1), KLRC4(1), PAK1(1), PIK3CA(3), PIK3R1(1), PTK2B(1), RAC1(4), SYK(1), VAV1(2) | 4322569 | 16 | 16 | 14 | 0 | 2 | 6 | 3 | 4 | 1 | 0 | 0.012 | 0.00043 | 0.088 |
| 4 | SALMONELLAPATHWAY | Salmonella induces membrane ruffling in infected cells via bacterial proteins including SipA, SipC, and SopE, which alter actin structure. | ACTA1, ACTR2, ACTR3, ARPC1A, ARPC1B, ARPC2, ARPC3, ARPC4, CDC42, RAC1, WASF1, WASL | 12 | ACTA1(1), ARPC1B(1), ARPC2(1), RAC1(4), WASL(2) | 1876385 | 9 | 9 | 8 | 0 | 0 | 4 | 2 | 2 | 1 | 0 | 0.089 | 0.002 | 0.29 |
| 5 | RASPATHWAY | Ras activation stimulates many signaling cascades, including PI3K/AKT activation to inhibit apoptosis. | AKT1, ARHA, BAD, BCL2L1, CASP9, CDC42, CHUK, ELK1, H2AFX, HRAS, MAP2K1, MAPK3, MLLT7, NFKB1, PIK3CA, PIK3R1, RAC1, RAF1, RALA, RALBP1, RALGDS, RELA, RHOA | 21 | BCL2L1(1), HRAS(1), PIK3CA(3), PIK3R1(1), RAC1(4), RAF1(1), RALGDS(1), RELA(1), RHOA(1) | 4462015 | 14 | 14 | 12 | 1 | 1 | 5 | 2 | 3 | 3 | 0 | 0.075 | 0.0024 | 0.29 |
| 6 | HSA04662_B_CELL_RECEPTOR_SIGNALING_PATHWAY | Genes involved in B cell receptor signaling pathway | AKT1, AKT2, AKT3, BCL10, BLNK, BTK, CARD11, CD19, CD22, CD72, CD79A, CD79B, CD81, CHP, CHUK, CR2, FCGR2B, FOS, GSK3B, HRAS, IFITM1, IKBKB, IKBKG, INPP5D, JUN, KRAS, LILRB3, LYN, MALT1, NFAT5, NFATC1, NFATC2, NFATC3, NFATC4, NFKB1, NFKB2, NFKBIA, NFKBIB, NFKBIE, NRAS, PIK3CA, PIK3CB, PIK3CD, PIK3CG, PIK3R1, PIK3R2, PIK3R3, PIK3R5, PLCG2, PPP3CA, PPP3CB, PPP3CC, PPP3R1, PPP3R2, PRKCB1, PTPN6, RAC1, RAC2, RAC3, RASGRP3, SYK, VAV1, VAV2, VAV3 | 63 | AKT3(1), BLNK(1), BTK(1), CARD11(1), CD19(1), CD79A(1), CD79B(1), FOS(2), HRAS(1), INPP5D(1), KRAS(19), MALT1(1), NFATC2(4), NFATC4(1), NFKB2(2), NFKBIB(1), NRAS(7), PIK3CA(3), PIK3CB(2), PIK3CD(4), PIK3R1(1), PIK3R5(1), RAC1(4), SYK(1), VAV1(2), VAV3(1) | 17419085 | 65 | 51 | 47 | 9 | 7 | 29 | 12 | 13 | 4 | 0 | 0.0042 | 0.0039 | 0.4 |
| 7 | ERK5PATHWAY | Signaling between a tissue and its innervating axon stimulates retrograde transport via Trk receptors, which activate Erk5, which induces transcription of anti-apoptotic factors. | AKT1, CREB1, GRB2, HRAS, MAPK1, MAPK3, MAPK7, MEF2A, MEF2B, MEF2C, MEF2D, NTRK1, PIK3CA, PIK3R1, PLCG1, RPS6KA1, SHC1 | 17 | HRAS(1), MAPK7(3), MEF2A(3), MEF2B(2), MEF2C(1), NTRK1(1), PIK3CA(3), PIK3R1(1), RPS6KA1(2) | 4532448 | 17 | 17 | 13 | 2 | 4 | 10 | 0 | 1 | 2 | 0 | 0.059 | 0.011 | 0.86 |
| 8 | HSA04664_FC_EPSILON_RI_SIGNALING_PATHWAY | Genes involved in Fc epsilon RI signaling pathway | AKT1, AKT2, AKT3, BTK, CSF2, FCER1A, FCER1G, FYN, GAB2, GRB2, HRAS, IL13, IL3, IL4, IL5, INPP5D, KRAS, LAT, LCP2, LYN, MAP2K1, MAP2K2, MAP2K3, MAP2K4, MAP2K6, MAP2K7, MAPK1, MAPK10, MAPK11, MAPK12, MAPK13, MAPK14, MAPK3, MAPK8, MAPK9, MS4A2, NRAS, PDK1, PIK3CA, PIK3CB, PIK3CD, PIK3CG, PIK3R1, PIK3R2, PIK3R3, PIK3R5, PLA2G10, PLA2G12A, PLA2G12B, PLA2G1B, PLA2G2A, PLA2G2D, PLA2G2E, PLA2G2F, PLA2G3, PLA2G4A, PLA2G5, PLA2G6, PLCG1, PLCG2, PRKCA, PRKCB1, PRKCD, PRKCE, RAC1, RAC2, RAC3, RAF1, SOS1, SOS2, SYK, TNF, VAV1, VAV2, VAV3 | 73 | AKT3(1), BTK(1), HRAS(1), INPP5D(1), KRAS(19), LCP2(1), MAP2K2(1), MAPK10(1), MAPK11(1), NRAS(7), PIK3CA(3), PIK3CB(2), PIK3CD(4), PIK3R1(1), PIK3R5(1), PLA2G6(1), RAC1(4), RAF1(1), SOS1(3), SYK(1), VAV1(2), VAV3(1) | 16388160 | 58 | 48 | 40 | 8 | 6 | 23 | 12 | 14 | 3 | 0 | 0.011 | 0.011 | 0.86 |
| 9 | NUCLEOTIDE_METABOLISM | ADSL, ADSS, DHFR, HPRT1, IMPDH1, MTHFD2, NME2, OAZ1, POLA, POLB, POLD1, POLG, PRPS2, RRM1, SAT, SRM | 14 | ADSL(2), ADSS(3), DHFR(1), POLB(1), POLD1(2), POLG(2) | 2969192 | 11 | 11 | 11 | 1 | 5 | 5 | 1 | 0 | 0 | 0 | 0.09 | 0.013 | 0.89 | |
| 10 | SETPATHWAY | Cytotoxic T cells release perforin, which to allow entry into target cells of granzyme B, which activates caspases, and granzyme A, which induces caspase-independent apoptosis. | ANP32A, APEX1, CREBBP, DFFA, DFFB, GZMA, GZMB, HMGB2, NME1, PRF1, SET | 11 | APEX1(1), CREBBP(6), DFFB(1), SET(1) | 2382845 | 9 | 9 | 9 | 0 | 0 | 7 | 1 | 0 | 1 | 0 | 0.082 | 0.017 | 1 |
Table 6. Get Full Table A Ranked List of Significantly Mutated Genesets (Excluding Significantly Mutated Genes). Number of significant genesets found: 0. Number of genesets displayed: 10
| rank | geneset | description | genes | N_genes | mut_tally | N | n | npat | nsite | nsil | n1 | n2 | n3 | n4 | n5 | n6 | p_ns_s | p | q |
|---|---|---|---|---|---|---|---|---|---|---|---|---|---|---|---|---|---|---|---|
| 1 | CDC42RACPATHWAY | PI3 kinase stimulates cell migration by activating cdc42, which activates ARP2/3, which in turn promotes formation of new actin fibers. | ACTR2, ACTR3, ARHA, ARPC1A, ARPC1B, ARPC2, ARPC3, ARPC4, CDC42, PAK1, PDGFRA, PIK3CA, PIK3R1, RAC1, WASL | 13 | ARPC1B(1), ARPC2(1), PAK1(1), PDGFRA(1), PIK3CA(3), PIK3R1(1), WASL(2) | 2954939 | 10 | 10 | 9 | 0 | 1 | 7 | 1 | 1 | 0 | 0 | 0.067 | 0.011 | 1 |
| 2 | NUCLEOTIDE_METABOLISM | ADSL, ADSS, DHFR, HPRT1, IMPDH1, MTHFD2, NME2, OAZ1, POLA, POLB, POLD1, POLG, PRPS2, RRM1, SAT, SRM | 14 | ADSL(2), ADSS(3), DHFR(1), POLB(1), POLD1(2), POLG(2) | 2969192 | 11 | 11 | 11 | 1 | 5 | 5 | 1 | 0 | 0 | 0 | 0.09 | 0.013 | 1 | |
| 3 | SETPATHWAY | Cytotoxic T cells release perforin, which to allow entry into target cells of granzyme B, which activates caspases, and granzyme A, which induces caspase-independent apoptosis. | ANP32A, APEX1, CREBBP, DFFA, DFFB, GZMA, GZMB, HMGB2, NME1, PRF1, SET | 11 | APEX1(1), CREBBP(6), DFFB(1), SET(1) | 2382845 | 9 | 9 | 9 | 0 | 0 | 7 | 1 | 0 | 1 | 0 | 0.082 | 0.017 | 1 |
| 4 | ERK5PATHWAY | Signaling between a tissue and its innervating axon stimulates retrograde transport via Trk receptors, which activate Erk5, which induces transcription of anti-apoptotic factors. | AKT1, CREB1, GRB2, HRAS, MAPK1, MAPK3, MAPK7, MEF2A, MEF2B, MEF2C, MEF2D, NTRK1, PIK3CA, PIK3R1, PLCG1, RPS6KA1, SHC1 | 16 | HRAS(1), MAPK7(3), MEF2B(2), MEF2C(1), NTRK1(1), PIK3CA(3), PIK3R1(1), RPS6KA1(2) | 4279787 | 14 | 14 | 12 | 1 | 1 | 10 | 0 | 1 | 2 | 0 | 0.045 | 0.02 | 1 |
| 5 | NKCELLSPATHWAY | Natural killer (NK) lymphocytes are inhibited by MHC and activated by surface glycoproteins on tumor or virus-infected cells, which undergo perforin-mediated lysis. | B2M, HLA-A, IL18, ITGB1, KLRC1, KLRC2, KLRC3, KLRC4, KLRD1, LAT, MAP2K1, MAPK3, PAK1, PIK3CA, PIK3R1, PTK2B, PTPN6, RAC1, SYK, VAV1 | 19 | HLA-A(1), KLRC3(1), KLRC4(1), PAK1(1), PIK3CA(3), PIK3R1(1), PTK2B(1), SYK(1), VAV1(2) | 4229951 | 12 | 12 | 11 | 0 | 2 | 6 | 2 | 2 | 0 | 0 | 0.031 | 0.022 | 1 |
| 6 | NGFPATHWAY | Nerve growth factor (NGF) stimulates neural survival and proliferation via the TrkA and p75 receptors, which induce DAG and IP3 production and activate Ras. | CSNK2A1, DPM2, ELK1, FOS, GRB2, HRAS, JUN, KLK2, MAP2K1, MAPK3, MAPK8, NGFB, NGFR, PIK3CA, PIK3R1, PLCG1, RAF1, SHC1, SOS1 | 18 | CSNK2A1(1), FOS(2), HRAS(1), KLK2(1), NGFR(1), PIK3CA(3), PIK3R1(1), RAF1(1), SOS1(3) | 4359991 | 14 | 13 | 13 | 1 | 2 | 7 | 2 | 2 | 1 | 0 | 0.088 | 0.022 | 1 |
| 7 | SA_PTEN_PATHWAY | PTEN is a tumor suppressor that dephosphorylates the lipid messenger phosphatidylinositol triphosphate. | AKT1, AKT2, AKT3, BPNT1, GRB2, ILK, MAPK1, MAPK3, PDK1, PIK3CA, PIK3CD, PIP3-E, PTEN, PTK2B, RBL2, SHC1, SOS1 | 16 | AKT3(1), ILK(1), PIK3CA(3), PIK3CD(4), PTK2B(1), RBL2(1), SOS1(3) | 4601358 | 14 | 12 | 12 | 1 | 2 | 5 | 3 | 2 | 2 | 0 | 0.1 | 0.027 | 1 |
| 8 | GPCRDB_CLASS_B_SECRETIN_LIKE | ADCYAP1R1, CALCR, CALCRL, CD97, CRHR1, CRHR2, ELTD1, EMR1, EMR2, GCGR, GHRHR, GIPR, GLP1R, GLP2R, GPR64, LPHN1, LPHN2, LPHN3, PTHR1, PTHR2, SCTR, VIPR1, VIPR2 | 20 | CD97(4), CRHR1(1), EMR1(3), GPR64(1), LPHN1(3), LPHN2(2), LPHN3(1), VIPR1(1) | 6416433 | 16 | 16 | 16 | 1 | 3 | 7 | 2 | 3 | 1 | 0 | 0.032 | 0.03 | 1 | |
| 9 | BILE_ACID_BIOSYNTHESIS | ACAA1, ACAA2, ADH1A, ADH1A, ADH1B, ADH1C, ADH1B, ADH1C, ADH4, ADH6, ADH7, ADHFE1, AKR1C4, AKR1D1, ALDH1A1, ALDH1A2, ALDH1A3, ALDH1B1, ALDH2, ALDH3A1, ALDH3A2, ALDH9A1, BAAT, CEL, CYP27A1, CYP7A1, HADHB, SOAT2, SRD5A1, SRD5A2 | 27 | ADH1B(1), ADH4(1), AKR1C4(1), ALDH1A1(1), ALDH1B1(1), ALDH3A1(2), BAAT(2), CEL(3), CYP7A1(2), SOAT2(1) | 5259287 | 15 | 14 | 15 | 1 | 4 | 10 | 0 | 1 | 0 | 0 | 0.035 | 0.03 | 1 | |
| 10 | IFNAPATHWAY | Interferon alpha, active in the immune response, binds to the IFN receptor and activates Jak1 and Tyk2, which phosphorylate Stat1 and Stat2. | IFNA1, IFNAR1, IFNAR2, IFNB1, ISGF3G, JAK1, STAT1, STAT2, TYK2 | 8 | IFNAR1(1), IFNAR2(1), JAK1(1), STAT1(2), TYK2(3) | 2481181 | 8 | 8 | 8 | 0 | 1 | 5 | 1 | 0 | 1 | 0 | 0.098 | 0.031 | 1 |
In brief, we tabulate the number of mutations and the number of covered bases for each gene. The counts are broken down by mutation context category: four context categories that are discovered by MutSig, and one for indel and 'null' mutations, which include indels, nonsense mutations, splice-site mutations, and non-stop (read-through) mutations. For each gene, we calculate the probability of seeing the observed constellation of mutations, i.e. the product P1 x P2 x ... x Pm, or a more extreme one, given the background mutation rates calculated across the dataset. [1]
In addition to the links below, the full results of the analysis summarized in this report can also be downloaded programmatically using firehose_get, or interactively from either the Broad GDAC website or TCGA Data Coordination Center Portal.