This pipeline computes the correlation between significant arm-level copy number variations (cnvs) and selected clinical features.
Testing the association between copy number variation 50 arm-level events and 7 clinical features across 80 patients, 4 significant findings detected with Q value < 0.25.
-
8q gain cnv correlated to 'Time to Death'.
-
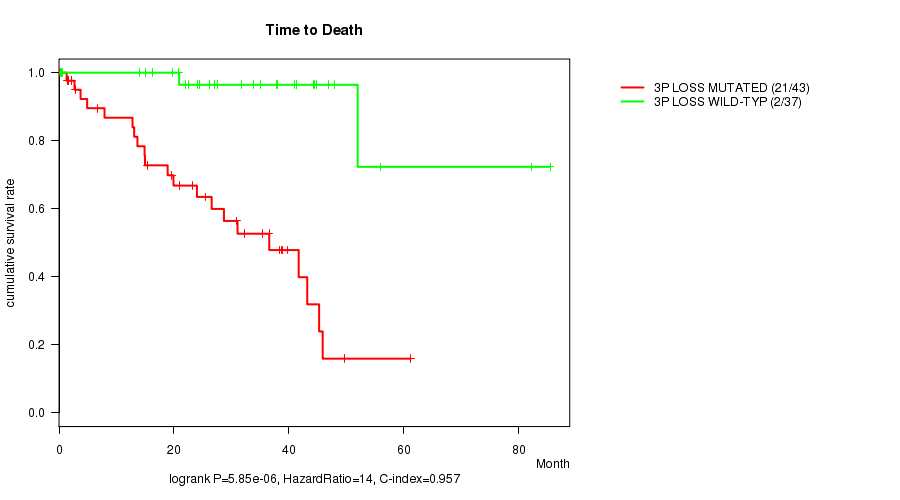
3p loss cnv correlated to 'Time to Death'.
-
3q loss cnv correlated to 'Time to Death'.
-
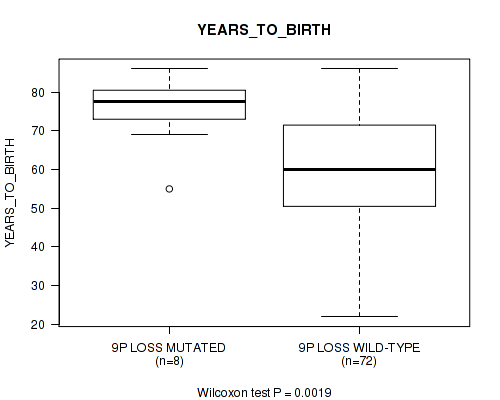
9p loss cnv correlated to 'YEARS_TO_BIRTH'.
Table 1. Get Full Table Overview of the association between significant copy number variation of 50 arm-level events and 7 clinical features. Shown in the table are P values (Q values). Thresholded by Q value < 0.25, 4 significant findings detected.
|
Clinical Features |
Time to Death |
YEARS TO BIRTH |
PATHOLOGIC STAGE |
PATHOLOGY T STAGE |
PATHOLOGY M STAGE |
GENDER |
RADIATION THERAPY |
||
| nCNV (%) | nWild-Type | logrank test | Wilcoxon-test | Fisher's exact test | Fisher's exact test | Fisher's exact test | Fisher's exact test | Fisher's exact test | |
| 8q gain | 53 (66%) | 27 |
0.00199 (0.174) |
0.768 (1.00) |
0.91 (1.00) |
0.778 (1.00) |
1 (1.00) |
1 (1.00) |
0.547 (1.00) |
| 3p loss | 43 (54%) | 37 |
5.85e-06 (0.00102) |
0.322 (1.00) |
0.0583 (0.905) |
0.268 (1.00) |
0.117 (1.00) |
1 (1.00) |
1 (1.00) |
| 3q loss | 43 (54%) | 37 |
5.85e-06 (0.00102) |
0.322 (1.00) |
0.0595 (0.905) |
0.269 (1.00) |
0.117 (1.00) |
1 (1.00) |
1 (1.00) |
| 9p loss | 8 (10%) | 72 |
0.0191 (0.476) |
0.0019 (0.174) |
0.603 (1.00) |
0.889 (1.00) |
1 (1.00) |
0.724 (1.00) |
0.277 (1.00) |
| 1q gain | 8 (10%) | 72 |
0.231 (1.00) |
0.34 (1.00) |
0.367 (1.00) |
0.488 (1.00) |
0.477 (1.00) |
0.288 (1.00) |
1 (1.00) |
| 2p gain | 10 (12%) | 70 |
0.776 (1.00) |
0.344 (1.00) |
0.361 (1.00) |
0.667 (1.00) |
1 (1.00) |
0.32 (1.00) |
0.337 (1.00) |
| 2q gain | 8 (10%) | 72 |
0.757 (1.00) |
0.11 (1.00) |
0.619 (1.00) |
0.552 (1.00) |
1 (1.00) |
0.288 (1.00) |
1 (1.00) |
| 4p gain | 7 (9%) | 73 |
0.674 (1.00) |
0.17 (1.00) |
0.0343 (0.745) |
0.288 (1.00) |
0.379 (1.00) |
1 (1.00) |
0.246 (1.00) |
| 4q gain | 4 (5%) | 76 |
0.785 (1.00) |
0.0849 (1.00) |
0.00512 (0.32) |
0.0965 (1.00) |
0.267 (1.00) |
0.314 (1.00) |
1 (1.00) |
| 5p gain | 3 (4%) | 77 |
0.475 (1.00) |
0.447 (1.00) |
0.888 (1.00) |
1 (1.00) |
1 (1.00) |
0.578 (1.00) |
1 (1.00) |
| 5q gain | 3 (4%) | 77 |
0.475 (1.00) |
0.447 (1.00) |
0.889 (1.00) |
1 (1.00) |
1 (1.00) |
0.578 (1.00) |
1 (1.00) |
| 6p gain | 38 (48%) | 42 |
0.00822 (0.32) |
0.15 (1.00) |
0.837 (1.00) |
0.798 (1.00) |
0.632 (1.00) |
0.653 (1.00) |
1 (1.00) |
| 6q gain | 16 (20%) | 64 |
0.00726 (0.32) |
0.279 (1.00) |
0.472 (1.00) |
0.302 (1.00) |
1 (1.00) |
0.587 (1.00) |
0.498 (1.00) |
| 7p gain | 9 (11%) | 71 |
0.3 (1.00) |
0.415 (1.00) |
0.518 (1.00) |
0.424 (1.00) |
0.325 (1.00) |
1 (1.00) |
1 (1.00) |
| 7q gain | 8 (10%) | 72 |
0.17 (1.00) |
0.217 (1.00) |
0.397 (1.00) |
0.488 (1.00) |
0.267 (1.00) |
0.724 (1.00) |
1 (1.00) |
| 8p gain | 39 (49%) | 41 |
0.0075 (0.32) |
0.441 (1.00) |
0.714 (1.00) |
0.58 (1.00) |
0.611 (1.00) |
0.822 (1.00) |
0.107 (1.00) |
| 9p gain | 5 (6%) | 75 |
0.684 (1.00) |
0.183 (1.00) |
0.6 (1.00) |
0.32 (1.00) |
1 (1.00) |
0.162 (1.00) |
1 (1.00) |
| 9q gain | 4 (5%) | 76 |
0.212 (1.00) |
0.178 (1.00) |
0.26 (1.00) |
0.289 (1.00) |
1 (1.00) |
0.314 (1.00) |
1 (1.00) |
| 11p gain | 10 (12%) | 70 |
0.973 (1.00) |
0.462 (1.00) |
0.915 (1.00) |
0.909 (1.00) |
1 (1.00) |
0.32 (1.00) |
1 (1.00) |
| 11q gain | 10 (12%) | 70 |
0.699 (1.00) |
0.436 (1.00) |
0.775 (1.00) |
0.743 (1.00) |
1 (1.00) |
0.741 (1.00) |
1 (1.00) |
| 12p gain | 3 (4%) | 77 |
0.882 (1.00) |
0.56 (1.00) |
1 (1.00) |
0.782 (1.00) |
1 (1.00) |
0.578 (1.00) |
1 (1.00) |
| 12q gain | 3 (4%) | 77 |
0.882 (1.00) |
0.56 (1.00) |
1 (1.00) |
0.784 (1.00) |
1 (1.00) |
0.578 (1.00) |
1 (1.00) |
| 13q gain | 6 (8%) | 74 |
0.789 (1.00) |
0.165 (1.00) |
0.791 (1.00) |
1 (1.00) |
1 (1.00) |
1 (1.00) |
0.213 (1.00) |
| 14q gain | 3 (4%) | 77 |
0.103 (1.00) |
0.603 (1.00) |
0.887 (1.00) |
1 (1.00) |
1 (1.00) |
0.252 (1.00) |
1 (1.00) |
| 16p gain | 4 (5%) | 76 |
0.518 (1.00) |
0.707 (1.00) |
0.795 (1.00) |
1 (1.00) |
1 (1.00) |
1 (1.00) |
1 (1.00) |
| 17p gain | 8 (10%) | 72 |
0.484 (1.00) |
0.365 (1.00) |
0.97 (1.00) |
0.888 (1.00) |
1 (1.00) |
0.724 (1.00) |
1 (1.00) |
| 17q gain | 9 (11%) | 71 |
0.665 (1.00) |
0.772 (1.00) |
0.869 (1.00) |
0.64 (1.00) |
1 (1.00) |
0.494 (1.00) |
1 (1.00) |
| 20p gain | 8 (10%) | 72 |
0.199 (1.00) |
0.332 (1.00) |
0.696 (1.00) |
0.491 (1.00) |
1 (1.00) |
1 (1.00) |
1 (1.00) |
| 20q gain | 9 (11%) | 71 |
0.0549 (0.905) |
0.19 (1.00) |
0.602 (1.00) |
0.381 (1.00) |
1 (1.00) |
1 (1.00) |
1 (1.00) |
| 21q gain | 14 (18%) | 66 |
0.211 (1.00) |
0.115 (1.00) |
0.777 (1.00) |
0.631 (1.00) |
0.477 (1.00) |
0.375 (1.00) |
1 (1.00) |
| 22q gain | 5 (6%) | 75 |
0.682 (1.00) |
0.0435 (0.846) |
0.664 (1.00) |
0.195 (1.00) |
1 (1.00) |
0.0135 (0.394) |
1 (1.00) |
| xp gain | 10 (12%) | 70 |
0.115 (1.00) |
0.158 (1.00) |
0.962 (1.00) |
0.666 (1.00) |
1 (1.00) |
0.0949 (1.00) |
1 (1.00) |
| xq gain | 9 (11%) | 71 |
0.204 (1.00) |
0.209 (1.00) |
0.976 (1.00) |
0.81 (1.00) |
1 (1.00) |
0.169 (1.00) |
1 (1.00) |
| 1p loss | 19 (24%) | 61 |
0.55 (1.00) |
0.0503 (0.905) |
0.916 (1.00) |
0.831 (1.00) |
1 (1.00) |
0.433 (1.00) |
0.567 (1.00) |
| 1q loss | 3 (4%) | 77 |
0.859 (1.00) |
0.494 (1.00) |
1 (1.00) |
0.137 (1.00) |
1 (1.00) |
0.578 (1.00) |
1 (1.00) |
| 4q loss | 3 (4%) | 77 |
0.757 (1.00) |
0.939 (1.00) |
0.598 (1.00) |
0.296 (1.00) |
1 (1.00) |
1 (1.00) |
0.111 (1.00) |
| 5q loss | 3 (4%) | 77 |
0.276 (1.00) |
0.462 (1.00) |
0.457 (1.00) |
0.577 (1.00) |
1 (1.00) |
0.0797 (1.00) |
1 (1.00) |
| 6q loss | 17 (21%) | 63 |
0.0112 (0.379) |
0.167 (1.00) |
0.0676 (0.986) |
0.0362 (0.745) |
0.298 (1.00) |
0.583 (1.00) |
0.522 (1.00) |
| 8p loss | 4 (5%) | 76 |
0.626 (1.00) |
0.965 (1.00) |
0.309 (1.00) |
0.513 (1.00) |
0.141 (1.00) |
0.628 (1.00) |
1 (1.00) |
| 8q loss | 3 (4%) | 77 |
0.427 (1.00) |
0.751 (1.00) |
0.302 (1.00) |
1 (1.00) |
0.141 (1.00) |
1 (1.00) |
1 (1.00) |
| 9q loss | 7 (9%) | 73 |
0.018 (0.476) |
0.00729 (0.32) |
0.378 (1.00) |
0.439 (1.00) |
1 (1.00) |
1 (1.00) |
0.246 (1.00) |
| 12p loss | 3 (4%) | 77 |
0.763 (1.00) |
0.761 (1.00) |
0.341 (1.00) |
0.139 (1.00) |
1 (1.00) |
0.578 (1.00) |
1 (1.00) |
| 13q loss | 3 (4%) | 77 |
0.264 (1.00) |
0.761 (1.00) |
1 (1.00) |
0.138 (1.00) |
1 (1.00) |
0.0797 (1.00) |
1 (1.00) |
| 15q loss | 4 (5%) | 76 |
0.707 (1.00) |
0.208 (1.00) |
0.795 (1.00) |
0.395 (1.00) |
1 (1.00) |
1 (1.00) |
1 (1.00) |
| 16p loss | 3 (4%) | 77 |
0.386 (1.00) |
0.254 (1.00) |
0.0863 (1.00) |
0.211 (1.00) |
0.206 (1.00) |
0.578 (1.00) |
1 (1.00) |
| 16q loss | 16 (20%) | 64 |
0.0544 (0.905) |
0.125 (1.00) |
0.169 (1.00) |
0.375 (1.00) |
0.204 (1.00) |
0.779 (1.00) |
0.0907 (1.00) |
| 19p loss | 3 (4%) | 77 |
0.684 (1.00) |
0.879 (1.00) |
0.412 (1.00) |
0.391 (1.00) |
1 (1.00) |
1 (1.00) |
0.111 (1.00) |
| 19q loss | 3 (4%) | 77 |
0.684 (1.00) |
0.879 (1.00) |
0.415 (1.00) |
0.395 (1.00) |
1 (1.00) |
1 (1.00) |
0.111 (1.00) |
| xp loss | 12 (15%) | 68 |
0.765 (1.00) |
0.0119 (0.379) |
0.169 (1.00) |
0.224 (1.00) |
0.522 (1.00) |
0.349 (1.00) |
0.394 (1.00) |
| xq loss | 13 (16%) | 67 |
0.876 (1.00) |
0.0248 (0.579) |
0.394 (1.00) |
0.203 (1.00) |
0.563 (1.00) |
0.223 (1.00) |
0.421 (1.00) |
P value = 0.00199 (logrank test), Q value = 0.17
Table S1. Gene #13: '8q gain' versus Clinical Feature #1: 'Time to Death'
| nPatients | nDeath | Duration Range (Median), Month | |
|---|---|---|---|
| ALL | 80 | 23 | 0.1 - 85.5 (25.8) |
| 8Q GAIN MUTATED | 53 | 21 | 0.1 - 82.2 (24.1) |
| 8Q GAIN WILD-TYPE | 27 | 2 | 0.2 - 85.5 (27.0) |
Figure S1. Get High-res Image Gene #13: '8q gain' versus Clinical Feature #1: 'Time to Death'

P value = 5.85e-06 (logrank test), Q value = 0.001
Table S2. Gene #33: '3p loss' versus Clinical Feature #1: 'Time to Death'
| nPatients | nDeath | Duration Range (Median), Month | |
|---|---|---|---|
| ALL | 80 | 23 | 0.1 - 85.5 (25.8) |
| 3P LOSS MUTATED | 43 | 21 | 0.1 - 61.2 (21.0) |
| 3P LOSS WILD-TYPE | 37 | 2 | 0.2 - 85.5 (27.5) |
Figure S2. Get High-res Image Gene #33: '3p loss' versus Clinical Feature #1: 'Time to Death'
P value = 5.85e-06 (logrank test), Q value = 0.001
Table S3. Gene #34: '3q loss' versus Clinical Feature #1: 'Time to Death'
| nPatients | nDeath | Duration Range (Median), Month | |
|---|---|---|---|
| ALL | 80 | 23 | 0.1 - 85.5 (25.8) |
| 3Q LOSS MUTATED | 43 | 21 | 0.1 - 61.2 (21.0) |
| 3Q LOSS WILD-TYPE | 37 | 2 | 0.2 - 85.5 (27.5) |
Figure S3. Get High-res Image Gene #34: '3q loss' versus Clinical Feature #1: 'Time to Death'

P value = 0.0019 (Wilcoxon-test), Q value = 0.17
Table S4. Gene #40: '9p loss' versus Clinical Feature #2: 'YEARS_TO_BIRTH'
| nPatients | Mean (Std.Dev) | |
|---|---|---|
| ALL | 80 | 61.6 (13.9) |
| 9P LOSS MUTATED | 8 | 75.4 (9.6) |
| 9P LOSS WILD-TYPE | 72 | 60.1 (13.6) |
Figure S4. Get High-res Image Gene #40: '9p loss' versus Clinical Feature #2: 'YEARS_TO_BIRTH'
-
Copy number data file = broad_values_by_arm.txt from GISTIC pipeline
-
Processed Copy number data file = /xchip/cga/gdac-prod/tcga-gdac/jobResults/GDAC_Correlate_Genomic_Events_Preprocess/UVM-TP/22534465/transformed.cor.cli.txt
-
Clinical data file = /xchip/cga/gdac-prod/tcga-gdac/jobResults/Append_Data/UVM-TP/22507229/UVM-TP.merged_data.txt
-
Number of patients = 80
-
Number of significantly arm-level cnvs = 50
-
Number of selected clinical features = 7
-
Exclude regions that fewer than K tumors have mutations, K = 3
For survival clinical features, the Kaplan-Meier survival curves of tumors with and without gene mutations were plotted and the statistical significance P values were estimated by logrank test (Bland and Altman 2004) using the 'survdiff' function in R
For binary or multi-class clinical features (nominal or ordinal), two-tailed Fisher's exact tests (Fisher 1922) were used to estimate the P values using the 'fisher.test' function in R
For multiple hypothesis correction, Q value is the False Discovery Rate (FDR) analogue of the P value (Benjamini and Hochberg 1995), defined as the minimum FDR at which the test may be called significant. We used the 'Benjamini and Hochberg' method of 'p.adjust' function in R to convert P values into Q values.
In addition to the links below, the full results of the analysis summarized in this report can also be downloaded programmatically using firehose_get, or interactively from either the Broad GDAC website or TCGA Data Coordination Center Portal.