This pipeline computes the correlation between significant copy number variation (cnv focal) genes and molecular subtypes.
Testing the association between copy number variation 51 focal events and 2 molecular subtypes across 110 patients, 31 significant findings detected with P value < 0.05 and Q value < 0.25.
-
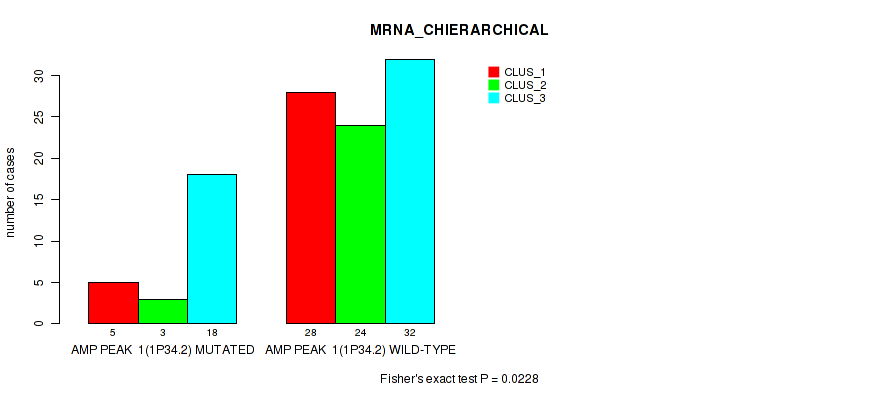
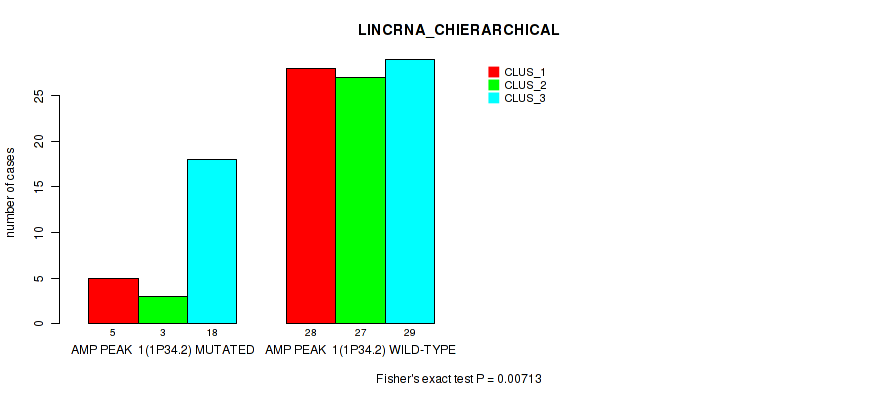
amp_1p34.2 cnv correlated to 'MRNA_CHIERARCHICAL' and 'LINCRNA_CHIERARCHICAL'.
-
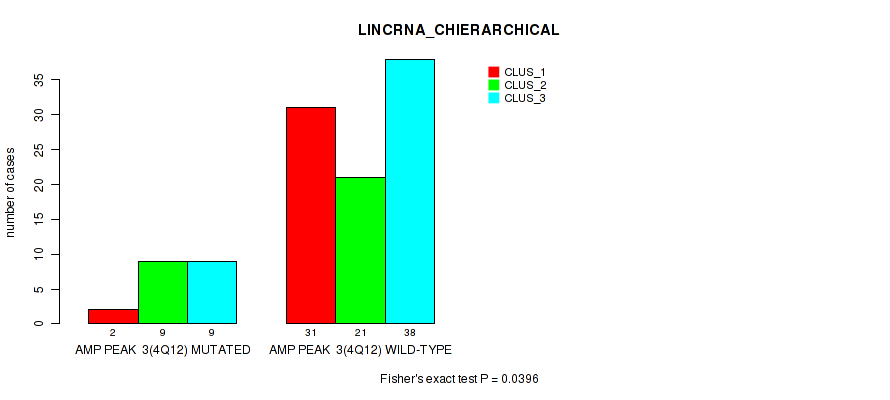
amp_4q12 cnv correlated to 'LINCRNA_CHIERARCHICAL'.
-
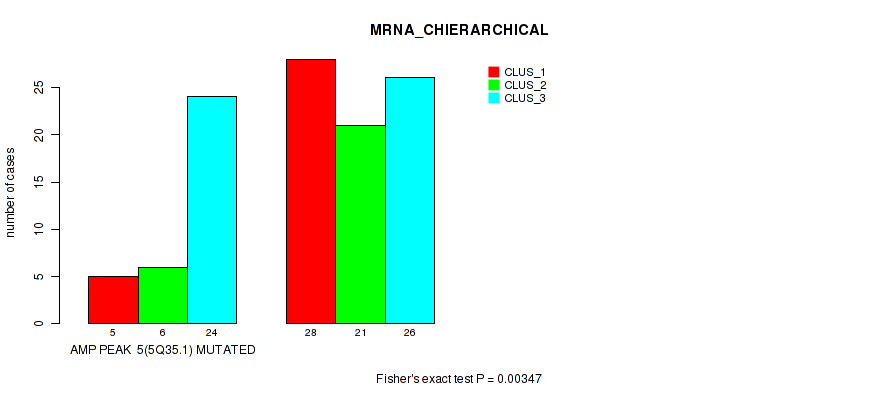
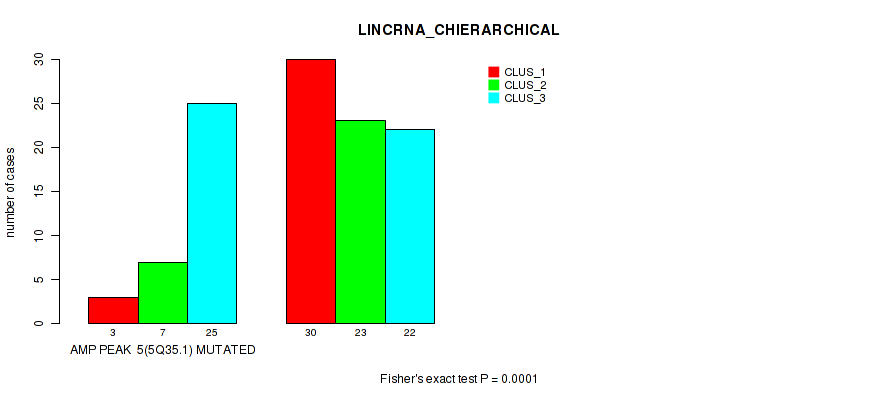
amp_5q35.1 cnv correlated to 'MRNA_CHIERARCHICAL' and 'LINCRNA_CHIERARCHICAL'.
-
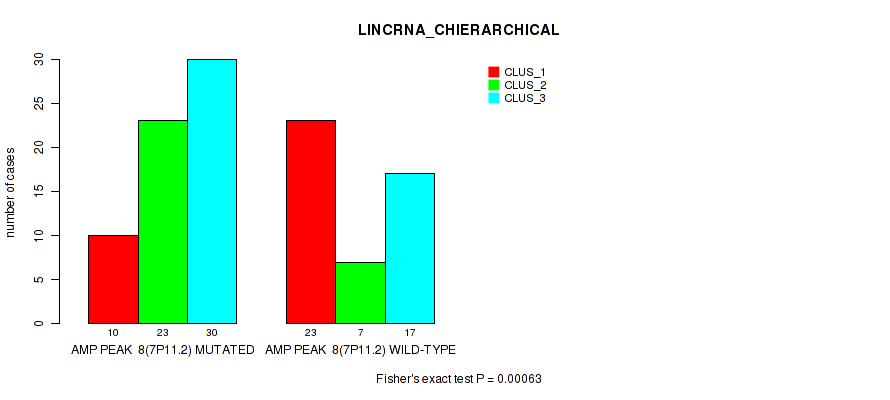
amp_7p11.2 cnv correlated to 'LINCRNA_CHIERARCHICAL'.
-
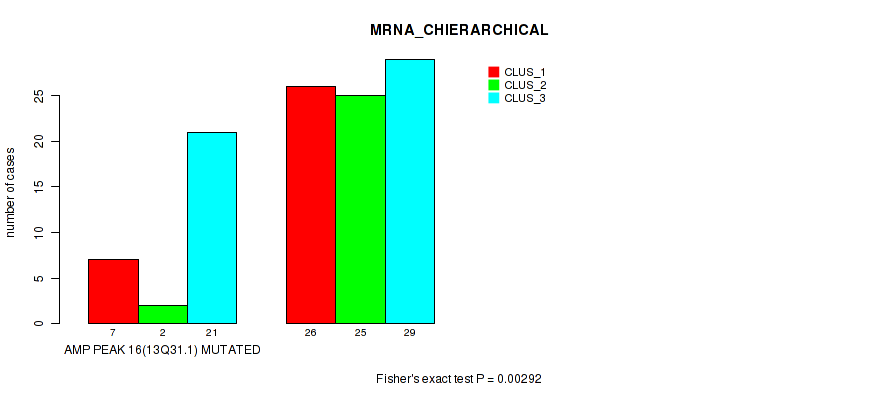
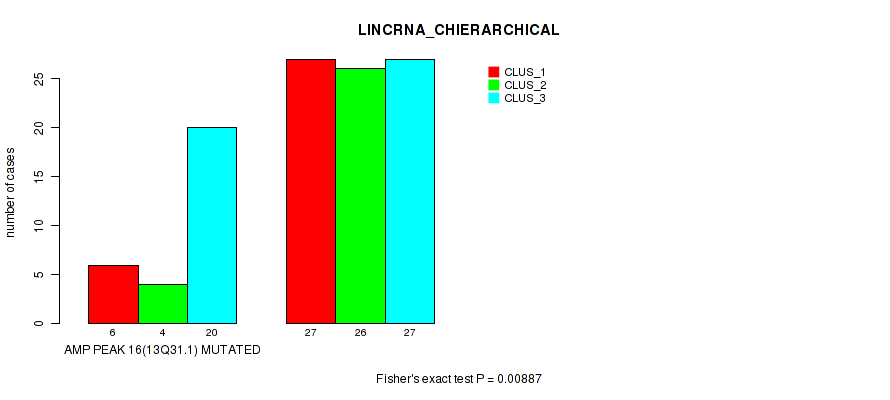
amp_13q31.1 cnv correlated to 'MRNA_CHIERARCHICAL' and 'LINCRNA_CHIERARCHICAL'.
-
amp_17q23.1 cnv correlated to 'LINCRNA_CHIERARCHICAL'.
-
amp_20p11.21 cnv correlated to 'MRNA_CHIERARCHICAL'.
-
amp_xp22.33 cnv correlated to 'MRNA_CHIERARCHICAL' and 'LINCRNA_CHIERARCHICAL'.
-
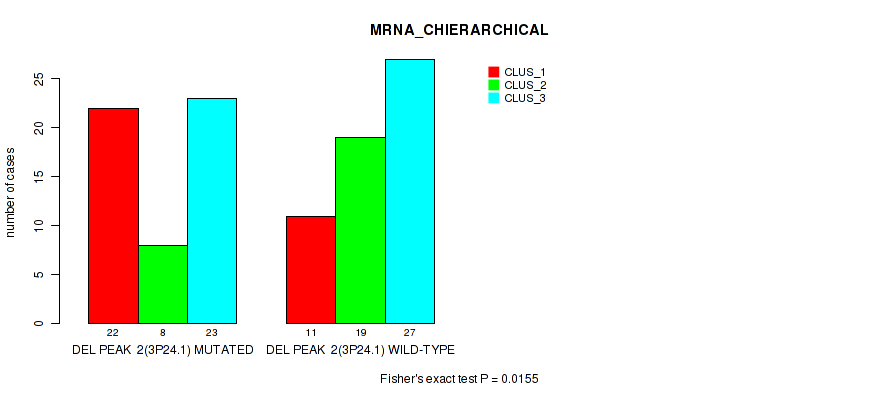
del_3p24.1 cnv correlated to 'MRNA_CHIERARCHICAL'.
-
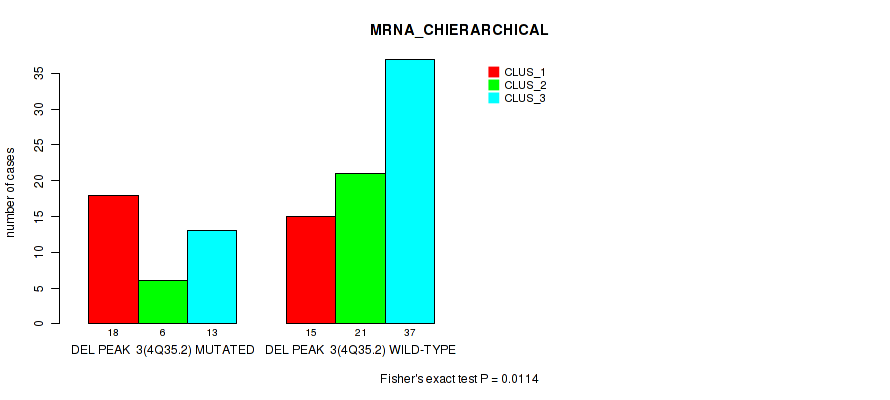
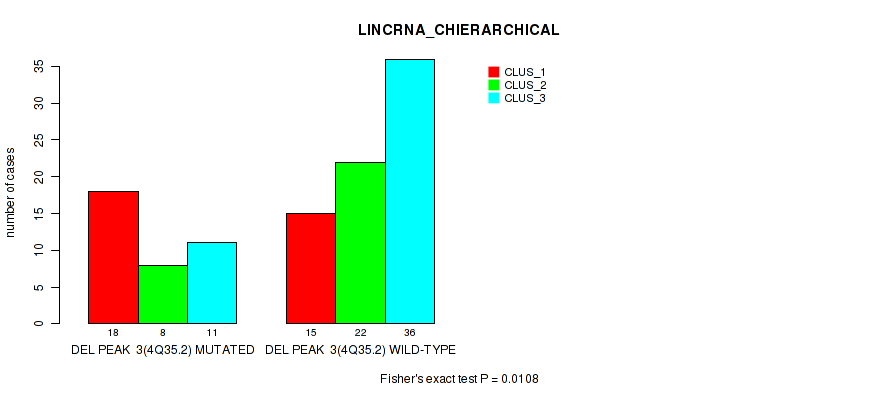
del_4q35.2 cnv correlated to 'MRNA_CHIERARCHICAL' and 'LINCRNA_CHIERARCHICAL'.
-
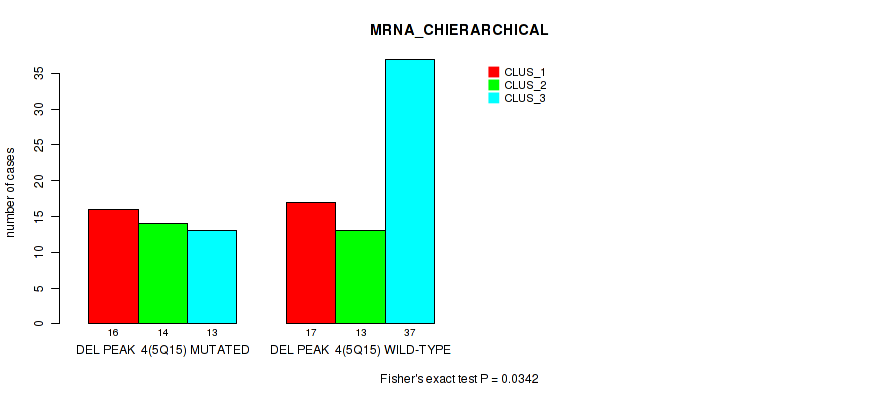
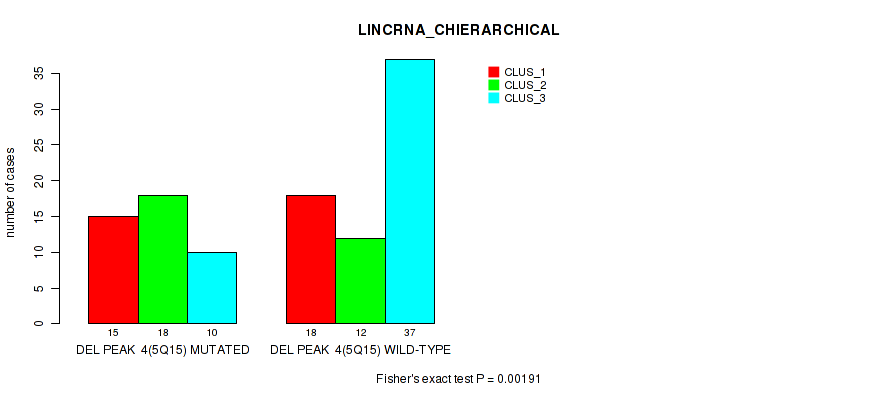
del_5q15 cnv correlated to 'MRNA_CHIERARCHICAL' and 'LINCRNA_CHIERARCHICAL'.
-
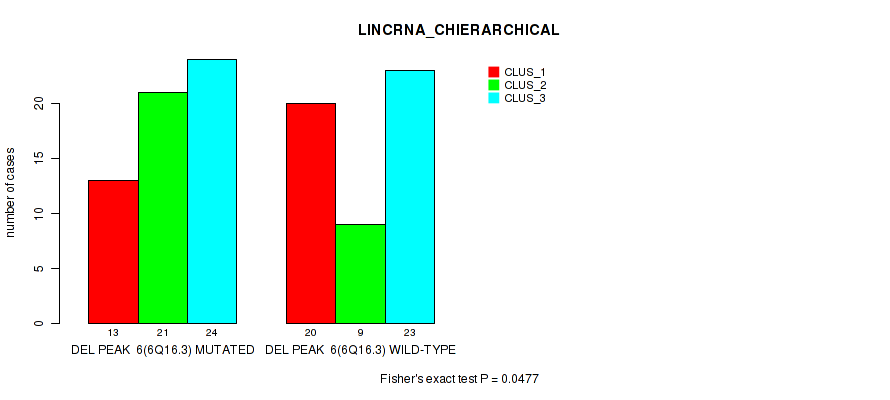
del_6q16.3 cnv correlated to 'LINCRNA_CHIERARCHICAL'.
-
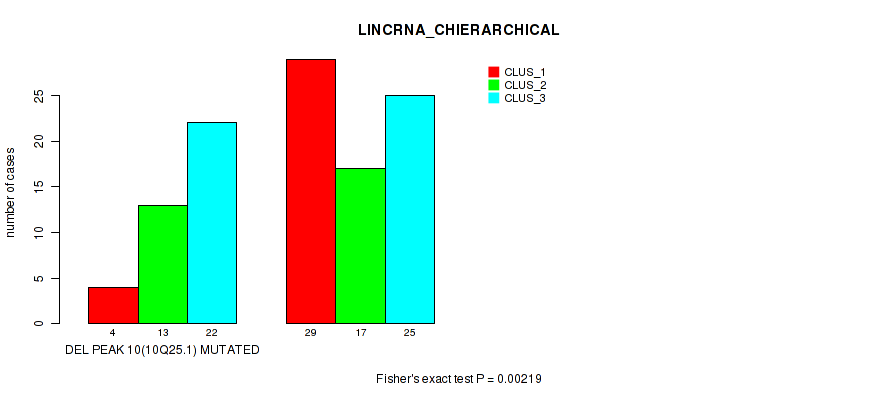
del_10q25.1 cnv correlated to 'LINCRNA_CHIERARCHICAL'.
-
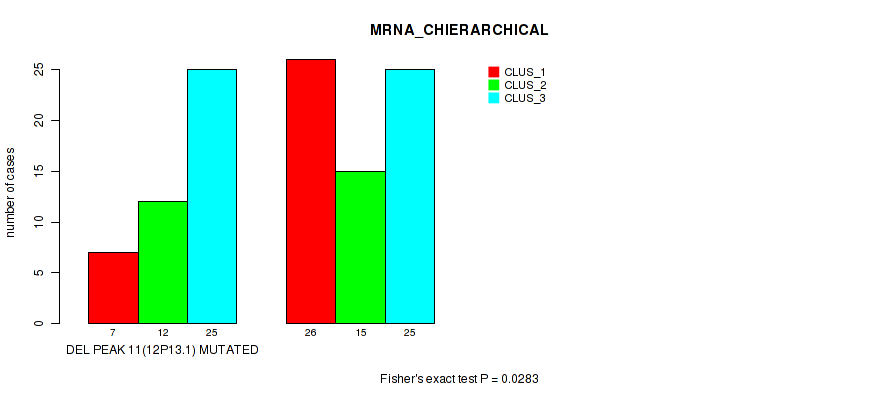
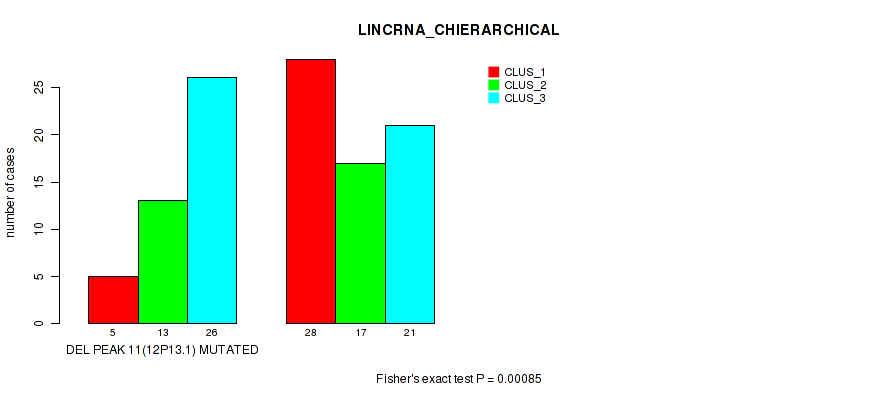
del_12p13.1 cnv correlated to 'MRNA_CHIERARCHICAL' and 'LINCRNA_CHIERARCHICAL'.
-
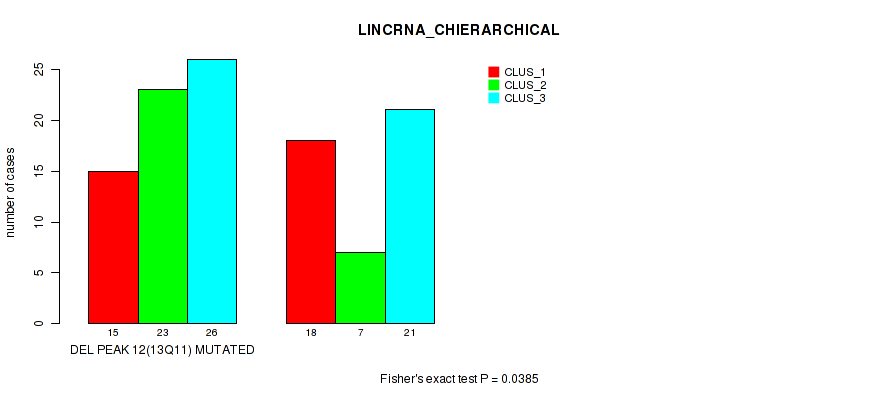
del_13q11 cnv correlated to 'LINCRNA_CHIERARCHICAL'.
-
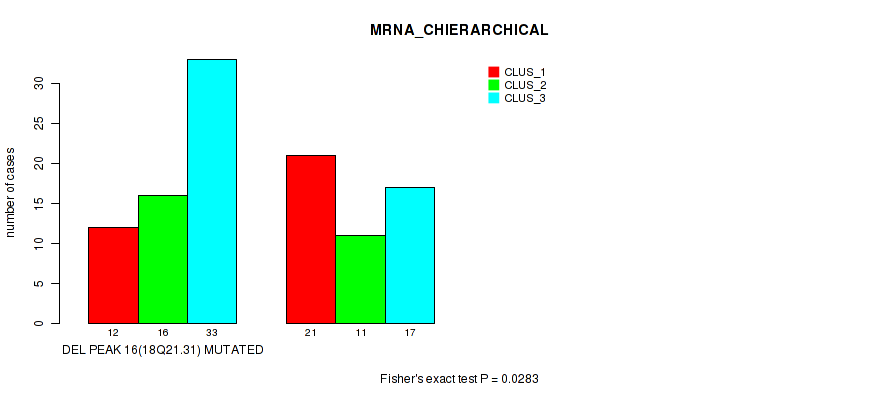
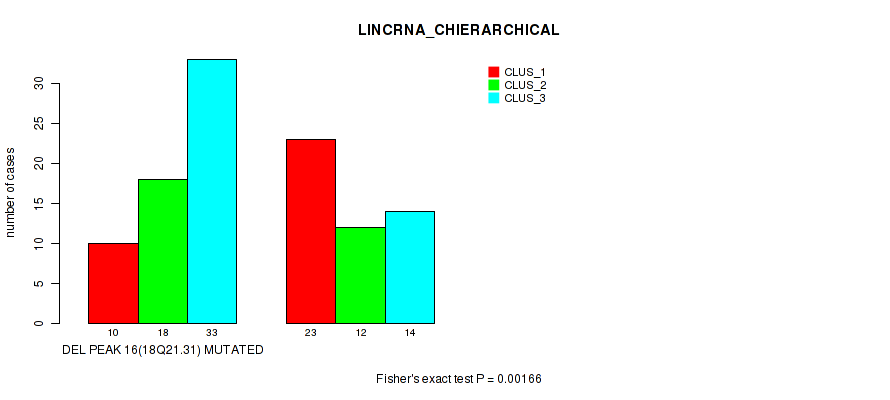
del_18q21.31 cnv correlated to 'MRNA_CHIERARCHICAL' and 'LINCRNA_CHIERARCHICAL'.
-
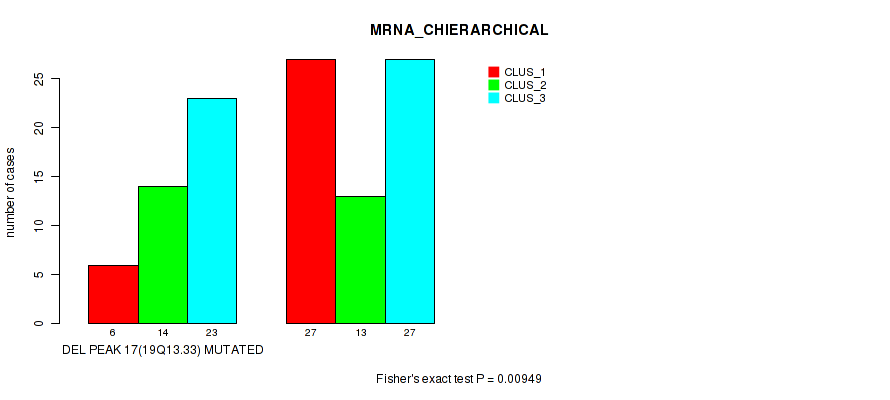
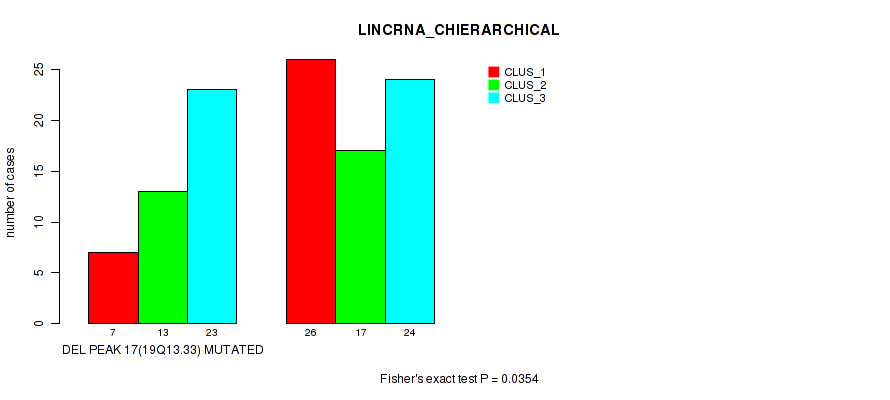
del_19q13.33 cnv correlated to 'MRNA_CHIERARCHICAL' and 'LINCRNA_CHIERARCHICAL'.
-
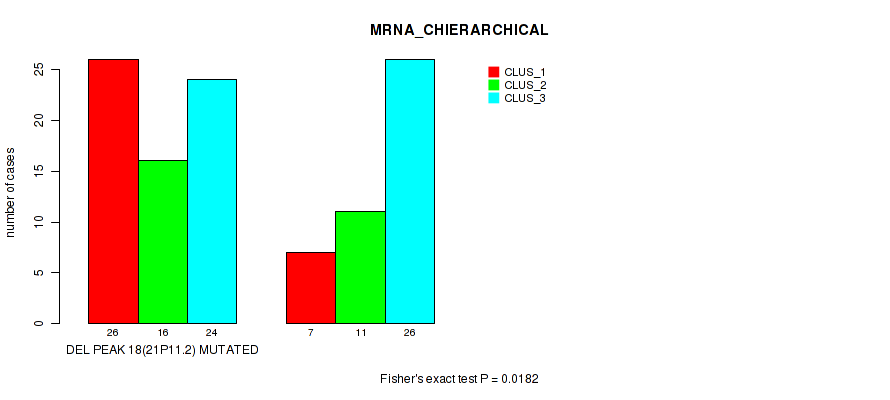
del_21p11.2 cnv correlated to 'MRNA_CHIERARCHICAL'.
-
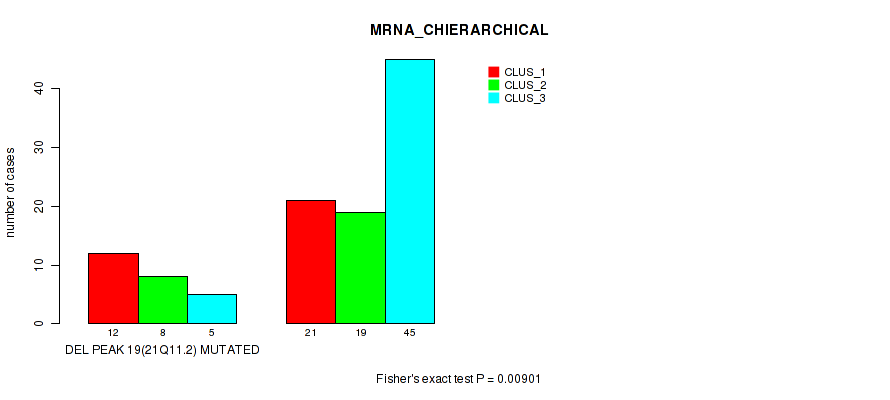
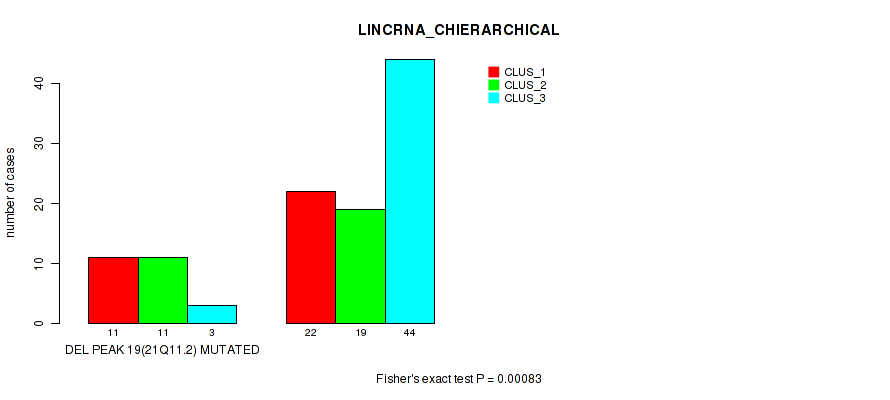
del_21q11.2 cnv correlated to 'MRNA_CHIERARCHICAL' and 'LINCRNA_CHIERARCHICAL'.
-
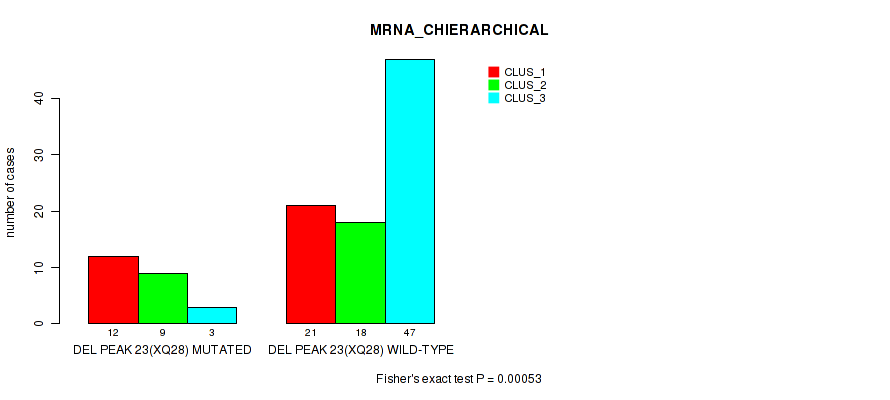
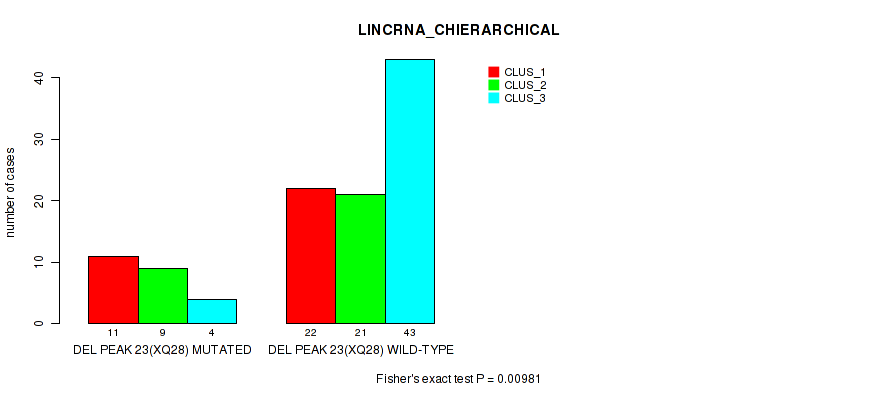
del_xq28 cnv correlated to 'MRNA_CHIERARCHICAL' and 'LINCRNA_CHIERARCHICAL'.
Table 1. Get Full Table Overview of the association between significant copy number variation of 51 focal events and 2 molecular subtypes. Shown in the table are P values (Q values). Thresholded by P value < 0.05 and Q value < 0.25, 31 significant findings detected.
|
Clinical Features |
MRNA CHIERARCHICAL |
LINCRNA CHIERARCHICAL |
||
| nCNV (%) | nWild-Type | Fisher's exact test | Fisher's exact test | |
| amp 1p34 2 | 26 (24%) | 84 |
0.0228 (0.0971) |
0.00713 (0.0589) |
| amp 5q35 1 | 35 (32%) | 75 |
0.00347 (0.0354) |
0.0001 (0.0102) |
| amp 13q31 1 | 30 (27%) | 80 |
0.00292 (0.0331) |
0.00887 (0.0589) |
| amp xp22 33 | 46 (42%) | 64 |
0.0179 (0.0842) |
0.00881 (0.0589) |
| del 4q35 2 | 37 (34%) | 73 |
0.0114 (0.0614) |
0.0108 (0.0614) |
| del 5q15 | 43 (39%) | 67 |
0.0342 (0.129) |
0.00191 (0.0278) |
| del 12p13 1 | 44 (40%) | 66 |
0.0283 (0.111) |
0.00085 (0.0173) |
| del 18q21 31 | 61 (55%) | 49 |
0.0283 (0.111) |
0.00166 (0.0278) |
| del 19q13 33 | 43 (39%) | 67 |
0.00949 (0.0589) |
0.0354 (0.129) |
| del 21q11 2 | 25 (23%) | 85 |
0.00901 (0.0589) |
0.00083 (0.0173) |
| del xq28 | 24 (22%) | 86 |
0.00053 (0.0173) |
0.00981 (0.0589) |
| amp 4q12 | 20 (18%) | 90 |
0.234 (0.451) |
0.0396 (0.135) |
| amp 7p11 2 | 63 (57%) | 47 |
0.133 (0.332) |
0.00063 (0.0173) |
| amp 17q23 1 | 54 (49%) | 56 |
0.252 (0.46) |
0.00517 (0.0479) |
| amp 20p11 21 | 27 (25%) | 83 |
0.0199 (0.0885) |
0.0654 (0.19) |
| del 3p24 1 | 53 (48%) | 57 |
0.0155 (0.0789) |
0.673 (0.789) |
| del 6q16 3 | 58 (53%) | 52 |
0.456 (0.628) |
0.0477 (0.157) |
| del 10q25 1 | 39 (35%) | 71 |
0.103 (0.263) |
0.00219 (0.0279) |
| del 13q11 | 64 (58%) | 46 |
0.345 (0.542) |
0.0385 (0.135) |
| del 21p11 2 | 66 (60%) | 44 |
0.0182 (0.0842) |
0.0564 (0.174) |
| amp 1q21 2 | 89 (81%) | 21 |
0.744 (0.842) |
0.822 (0.892) |
| amp 5p15 33 | 76 (69%) | 34 |
0.224 (0.444) |
0.207 (0.422) |
| amp 6p21 1 | 44 (40%) | 66 |
0.617 (0.74) |
0.401 (0.583) |
| amp 6q27 | 41 (37%) | 69 |
0.848 (0.904) |
0.3 (0.502) |
| amp 8q13 1 | 47 (43%) | 63 |
0.881 (0.909) |
0.61 (0.74) |
| amp 8q24 21 | 65 (59%) | 45 |
0.176 (0.383) |
0.085 (0.228) |
| amp 8q24 3 | 69 (63%) | 41 |
0.611 (0.74) |
0.262 (0.46) |
| amp 11q13 3 | 46 (42%) | 64 |
0.531 (0.695) |
0.756 (0.842) |
| amp 12p13 33 | 54 (49%) | 56 |
0.167 (0.369) |
0.809 (0.888) |
| amp 12p11 21 | 37 (34%) | 73 |
0.553 (0.705) |
0.759 (0.842) |
| amp 12q15 | 33 (30%) | 77 |
0.293 (0.502) |
0.163 (0.369) |
| amp 14q13 3 | 62 (56%) | 48 |
0.663 (0.787) |
0.226 (0.444) |
| amp 14q32 33 | 46 (42%) | 64 |
0.577 (0.727) |
0.687 (0.796) |
| amp 19q12 | 33 (30%) | 77 |
0.331 (0.536) |
0.299 (0.502) |
| amp 20q13 2 | 51 (46%) | 59 |
0.97 (0.979) |
0.857 (0.904) |
| amp 20q13 33 | 51 (46%) | 59 |
0.399 (0.583) |
1 (1.00) |
| amp 21p12 | 24 (22%) | 86 |
0.253 (0.46) |
0.0686 (0.19) |
| amp xq27 3 | 60 (55%) | 50 |
0.429 (0.599) |
0.735 (0.842) |
| amp yq11 223 | 25 (23%) | 85 |
0.586 (0.729) |
0.261 (0.46) |
| del 1p13 3 | 38 (35%) | 72 |
0.522 (0.695) |
0.155 (0.359) |
| del 6p11 2 | 12 (11%) | 98 |
0.859 (0.904) |
0.927 (0.946) |
| del 8p23 1 | 58 (53%) | 52 |
0.417 (0.591) |
0.203 (0.422) |
| del 9p23 | 63 (57%) | 47 |
0.529 (0.695) |
0.461 (0.628) |
| del 9p21 3 | 67 (61%) | 43 |
0.553 (0.705) |
0.359 (0.555) |
| del 15q13 1 | 64 (58%) | 46 |
0.882 (0.909) |
0.391 (0.583) |
| del 16q24 3 | 42 (38%) | 68 |
0.185 (0.393) |
0.139 (0.338) |
| del 17p13 1 | 75 (68%) | 35 |
0.0627 (0.188) |
0.0531 (0.169) |
| del 22p11 2 | 44 (40%) | 66 |
0.152 (0.359) |
0.0691 (0.19) |
| del 22q13 32 | 55 (50%) | 55 |
0.345 (0.542) |
0.379 (0.577) |
| del xp22 33 | 23 (21%) | 87 |
0.406 (0.583) |
0.331 (0.536) |
| del yq11 223 | 69 (63%) | 41 |
0.244 (0.46) |
0.095 (0.249) |
P value = 0.0228 (Fisher's exact test), Q value = 0.097
Table S1. Gene #1: 'amp_1p34.2' versus Molecular Subtype #1: 'MRNA_CHIERARCHICAL'
| nPatients | CLUS_1 | CLUS_2 | CLUS_3 |
|---|---|---|---|
| ALL | 33 | 27 | 50 |
| AMP PEAK 1(1P34.2) MUTATED | 5 | 3 | 18 |
| AMP PEAK 1(1P34.2) WILD-TYPE | 28 | 24 | 32 |
Figure S1. Get High-res Image Gene #1: 'amp_1p34.2' versus Molecular Subtype #1: 'MRNA_CHIERARCHICAL'
P value = 0.00713 (Fisher's exact test), Q value = 0.059
Table S2. Gene #1: 'amp_1p34.2' versus Molecular Subtype #2: 'LINCRNA_CHIERARCHICAL'
| nPatients | CLUS_1 | CLUS_2 | CLUS_3 |
|---|---|---|---|
| ALL | 33 | 30 | 47 |
| AMP PEAK 1(1P34.2) MUTATED | 5 | 3 | 18 |
| AMP PEAK 1(1P34.2) WILD-TYPE | 28 | 27 | 29 |
Figure S2. Get High-res Image Gene #1: 'amp_1p34.2' versus Molecular Subtype #2: 'LINCRNA_CHIERARCHICAL'
P value = 0.0396 (Fisher's exact test), Q value = 0.13
Table S3. Gene #3: 'amp_4q12' versus Molecular Subtype #2: 'LINCRNA_CHIERARCHICAL'
| nPatients | CLUS_1 | CLUS_2 | CLUS_3 |
|---|---|---|---|
| ALL | 33 | 30 | 47 |
| AMP PEAK 3(4Q12) MUTATED | 2 | 9 | 9 |
| AMP PEAK 3(4Q12) WILD-TYPE | 31 | 21 | 38 |
Figure S3. Get High-res Image Gene #3: 'amp_4q12' versus Molecular Subtype #2: 'LINCRNA_CHIERARCHICAL'
P value = 0.00347 (Fisher's exact test), Q value = 0.035
Table S4. Gene #5: 'amp_5q35.1' versus Molecular Subtype #1: 'MRNA_CHIERARCHICAL'
| nPatients | CLUS_1 | CLUS_2 | CLUS_3 |
|---|---|---|---|
| ALL | 33 | 27 | 50 |
| AMP PEAK 5(5Q35.1) MUTATED | 5 | 6 | 24 |
| AMP PEAK 5(5Q35.1) WILD-TYPE | 28 | 21 | 26 |
Figure S4. Get High-res Image Gene #5: 'amp_5q35.1' versus Molecular Subtype #1: 'MRNA_CHIERARCHICAL'
P value = 1e-04 (Fisher's exact test), Q value = 0.01
Table S5. Gene #5: 'amp_5q35.1' versus Molecular Subtype #2: 'LINCRNA_CHIERARCHICAL'
| nPatients | CLUS_1 | CLUS_2 | CLUS_3 |
|---|---|---|---|
| ALL | 33 | 30 | 47 |
| AMP PEAK 5(5Q35.1) MUTATED | 3 | 7 | 25 |
| AMP PEAK 5(5Q35.1) WILD-TYPE | 30 | 23 | 22 |
Figure S5. Get High-res Image Gene #5: 'amp_5q35.1' versus Molecular Subtype #2: 'LINCRNA_CHIERARCHICAL'
P value = 0.00063 (Fisher's exact test), Q value = 0.017
Table S6. Gene #8: 'amp_7p11.2' versus Molecular Subtype #2: 'LINCRNA_CHIERARCHICAL'
| nPatients | CLUS_1 | CLUS_2 | CLUS_3 |
|---|---|---|---|
| ALL | 33 | 30 | 47 |
| AMP PEAK 8(7P11.2) MUTATED | 10 | 23 | 30 |
| AMP PEAK 8(7P11.2) WILD-TYPE | 23 | 7 | 17 |
Figure S6. Get High-res Image Gene #8: 'amp_7p11.2' versus Molecular Subtype #2: 'LINCRNA_CHIERARCHICAL'
P value = 0.00292 (Fisher's exact test), Q value = 0.033
Table S7. Gene #16: 'amp_13q31.1' versus Molecular Subtype #1: 'MRNA_CHIERARCHICAL'
| nPatients | CLUS_1 | CLUS_2 | CLUS_3 |
|---|---|---|---|
| ALL | 33 | 27 | 50 |
| AMP PEAK 16(13Q31.1) MUTATED | 7 | 2 | 21 |
| AMP PEAK 16(13Q31.1) WILD-TYPE | 26 | 25 | 29 |
Figure S7. Get High-res Image Gene #16: 'amp_13q31.1' versus Molecular Subtype #1: 'MRNA_CHIERARCHICAL'
P value = 0.00887 (Fisher's exact test), Q value = 0.059
Table S8. Gene #16: 'amp_13q31.1' versus Molecular Subtype #2: 'LINCRNA_CHIERARCHICAL'
| nPatients | CLUS_1 | CLUS_2 | CLUS_3 |
|---|---|---|---|
| ALL | 33 | 30 | 47 |
| AMP PEAK 16(13Q31.1) MUTATED | 6 | 4 | 20 |
| AMP PEAK 16(13Q31.1) WILD-TYPE | 27 | 26 | 27 |
Figure S8. Get High-res Image Gene #16: 'amp_13q31.1' versus Molecular Subtype #2: 'LINCRNA_CHIERARCHICAL'
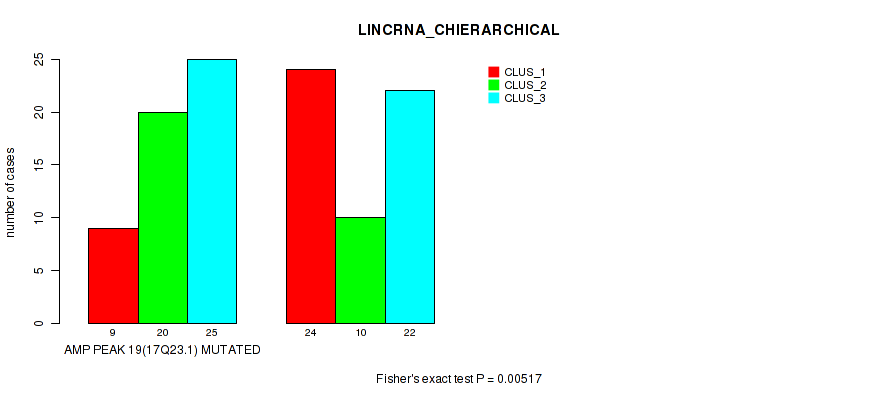
P value = 0.00517 (Fisher's exact test), Q value = 0.048
Table S9. Gene #19: 'amp_17q23.1' versus Molecular Subtype #2: 'LINCRNA_CHIERARCHICAL'
| nPatients | CLUS_1 | CLUS_2 | CLUS_3 |
|---|---|---|---|
| ALL | 33 | 30 | 47 |
| AMP PEAK 19(17Q23.1) MUTATED | 9 | 20 | 25 |
| AMP PEAK 19(17Q23.1) WILD-TYPE | 24 | 10 | 22 |
Figure S9. Get High-res Image Gene #19: 'amp_17q23.1' versus Molecular Subtype #2: 'LINCRNA_CHIERARCHICAL'
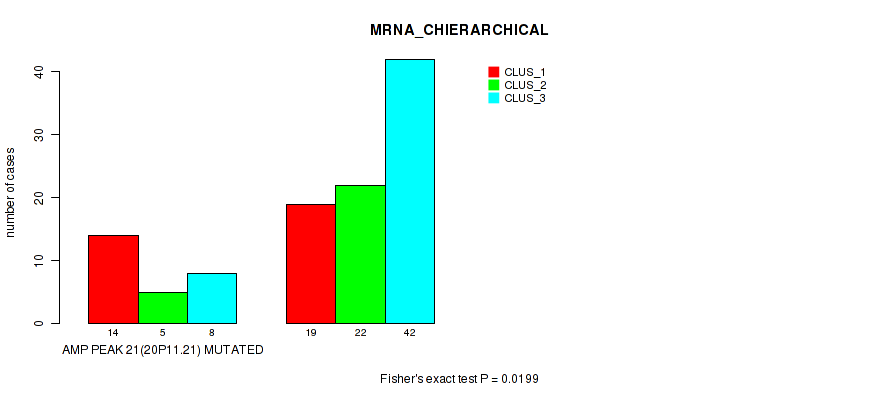
P value = 0.0199 (Fisher's exact test), Q value = 0.088
Table S10. Gene #21: 'amp_20p11.21' versus Molecular Subtype #1: 'MRNA_CHIERARCHICAL'
| nPatients | CLUS_1 | CLUS_2 | CLUS_3 |
|---|---|---|---|
| ALL | 33 | 27 | 50 |
| AMP PEAK 21(20P11.21) MUTATED | 14 | 5 | 8 |
| AMP PEAK 21(20P11.21) WILD-TYPE | 19 | 22 | 42 |
Figure S10. Get High-res Image Gene #21: 'amp_20p11.21' versus Molecular Subtype #1: 'MRNA_CHIERARCHICAL'
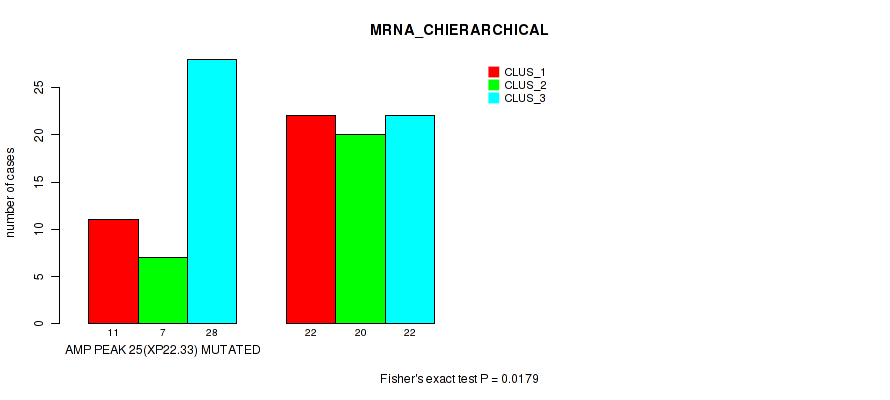
P value = 0.0179 (Fisher's exact test), Q value = 0.084
Table S11. Gene #25: 'amp_xp22.33' versus Molecular Subtype #1: 'MRNA_CHIERARCHICAL'
| nPatients | CLUS_1 | CLUS_2 | CLUS_3 |
|---|---|---|---|
| ALL | 33 | 27 | 50 |
| AMP PEAK 25(XP22.33) MUTATED | 11 | 7 | 28 |
| AMP PEAK 25(XP22.33) WILD-TYPE | 22 | 20 | 22 |
Figure S11. Get High-res Image Gene #25: 'amp_xp22.33' versus Molecular Subtype #1: 'MRNA_CHIERARCHICAL'
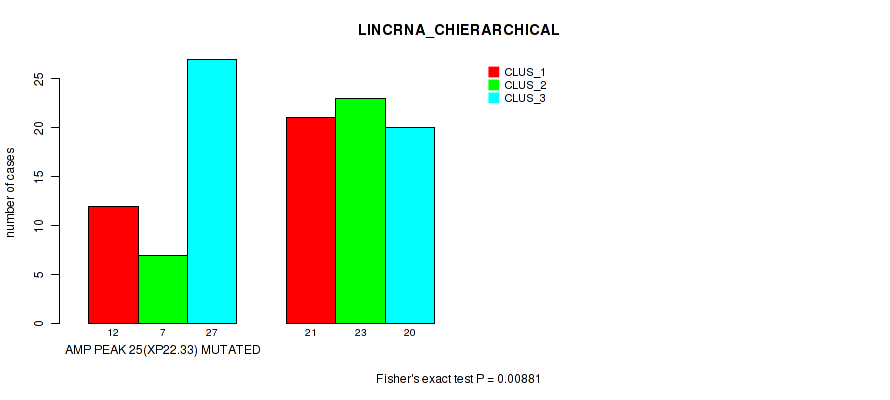
P value = 0.00881 (Fisher's exact test), Q value = 0.059
Table S12. Gene #25: 'amp_xp22.33' versus Molecular Subtype #2: 'LINCRNA_CHIERARCHICAL'
| nPatients | CLUS_1 | CLUS_2 | CLUS_3 |
|---|---|---|---|
| ALL | 33 | 30 | 47 |
| AMP PEAK 25(XP22.33) MUTATED | 12 | 7 | 27 |
| AMP PEAK 25(XP22.33) WILD-TYPE | 21 | 23 | 20 |
Figure S12. Get High-res Image Gene #25: 'amp_xp22.33' versus Molecular Subtype #2: 'LINCRNA_CHIERARCHICAL'
P value = 0.0155 (Fisher's exact test), Q value = 0.079
Table S13. Gene #29: 'del_3p24.1' versus Molecular Subtype #1: 'MRNA_CHIERARCHICAL'
| nPatients | CLUS_1 | CLUS_2 | CLUS_3 |
|---|---|---|---|
| ALL | 33 | 27 | 50 |
| DEL PEAK 2(3P24.1) MUTATED | 22 | 8 | 23 |
| DEL PEAK 2(3P24.1) WILD-TYPE | 11 | 19 | 27 |
Figure S13. Get High-res Image Gene #29: 'del_3p24.1' versus Molecular Subtype #1: 'MRNA_CHIERARCHICAL'
P value = 0.0114 (Fisher's exact test), Q value = 0.061
Table S14. Gene #30: 'del_4q35.2' versus Molecular Subtype #1: 'MRNA_CHIERARCHICAL'
| nPatients | CLUS_1 | CLUS_2 | CLUS_3 |
|---|---|---|---|
| ALL | 33 | 27 | 50 |
| DEL PEAK 3(4Q35.2) MUTATED | 18 | 6 | 13 |
| DEL PEAK 3(4Q35.2) WILD-TYPE | 15 | 21 | 37 |
Figure S14. Get High-res Image Gene #30: 'del_4q35.2' versus Molecular Subtype #1: 'MRNA_CHIERARCHICAL'
P value = 0.0108 (Fisher's exact test), Q value = 0.061
Table S15. Gene #30: 'del_4q35.2' versus Molecular Subtype #2: 'LINCRNA_CHIERARCHICAL'
| nPatients | CLUS_1 | CLUS_2 | CLUS_3 |
|---|---|---|---|
| ALL | 33 | 30 | 47 |
| DEL PEAK 3(4Q35.2) MUTATED | 18 | 8 | 11 |
| DEL PEAK 3(4Q35.2) WILD-TYPE | 15 | 22 | 36 |
Figure S15. Get High-res Image Gene #30: 'del_4q35.2' versus Molecular Subtype #2: 'LINCRNA_CHIERARCHICAL'
P value = 0.0342 (Fisher's exact test), Q value = 0.13
Table S16. Gene #31: 'del_5q15' versus Molecular Subtype #1: 'MRNA_CHIERARCHICAL'
| nPatients | CLUS_1 | CLUS_2 | CLUS_3 |
|---|---|---|---|
| ALL | 33 | 27 | 50 |
| DEL PEAK 4(5Q15) MUTATED | 16 | 14 | 13 |
| DEL PEAK 4(5Q15) WILD-TYPE | 17 | 13 | 37 |
Figure S16. Get High-res Image Gene #31: 'del_5q15' versus Molecular Subtype #1: 'MRNA_CHIERARCHICAL'
P value = 0.00191 (Fisher's exact test), Q value = 0.028
Table S17. Gene #31: 'del_5q15' versus Molecular Subtype #2: 'LINCRNA_CHIERARCHICAL'
| nPatients | CLUS_1 | CLUS_2 | CLUS_3 |
|---|---|---|---|
| ALL | 33 | 30 | 47 |
| DEL PEAK 4(5Q15) MUTATED | 15 | 18 | 10 |
| DEL PEAK 4(5Q15) WILD-TYPE | 18 | 12 | 37 |
Figure S17. Get High-res Image Gene #31: 'del_5q15' versus Molecular Subtype #2: 'LINCRNA_CHIERARCHICAL'
P value = 0.0477 (Fisher's exact test), Q value = 0.16
Table S18. Gene #33: 'del_6q16.3' versus Molecular Subtype #2: 'LINCRNA_CHIERARCHICAL'
| nPatients | CLUS_1 | CLUS_2 | CLUS_3 |
|---|---|---|---|
| ALL | 33 | 30 | 47 |
| DEL PEAK 6(6Q16.3) MUTATED | 13 | 21 | 24 |
| DEL PEAK 6(6Q16.3) WILD-TYPE | 20 | 9 | 23 |
Figure S18. Get High-res Image Gene #33: 'del_6q16.3' versus Molecular Subtype #2: 'LINCRNA_CHIERARCHICAL'
P value = 0.00219 (Fisher's exact test), Q value = 0.028
Table S19. Gene #37: 'del_10q25.1' versus Molecular Subtype #2: 'LINCRNA_CHIERARCHICAL'
| nPatients | CLUS_1 | CLUS_2 | CLUS_3 |
|---|---|---|---|
| ALL | 33 | 30 | 47 |
| DEL PEAK 10(10Q25.1) MUTATED | 4 | 13 | 22 |
| DEL PEAK 10(10Q25.1) WILD-TYPE | 29 | 17 | 25 |
Figure S19. Get High-res Image Gene #37: 'del_10q25.1' versus Molecular Subtype #2: 'LINCRNA_CHIERARCHICAL'
P value = 0.0283 (Fisher's exact test), Q value = 0.11
Table S20. Gene #38: 'del_12p13.1' versus Molecular Subtype #1: 'MRNA_CHIERARCHICAL'
| nPatients | CLUS_1 | CLUS_2 | CLUS_3 |
|---|---|---|---|
| ALL | 33 | 27 | 50 |
| DEL PEAK 11(12P13.1) MUTATED | 7 | 12 | 25 |
| DEL PEAK 11(12P13.1) WILD-TYPE | 26 | 15 | 25 |
Figure S20. Get High-res Image Gene #38: 'del_12p13.1' versus Molecular Subtype #1: 'MRNA_CHIERARCHICAL'
P value = 0.00085 (Fisher's exact test), Q value = 0.017
Table S21. Gene #38: 'del_12p13.1' versus Molecular Subtype #2: 'LINCRNA_CHIERARCHICAL'
| nPatients | CLUS_1 | CLUS_2 | CLUS_3 |
|---|---|---|---|
| ALL | 33 | 30 | 47 |
| DEL PEAK 11(12P13.1) MUTATED | 5 | 13 | 26 |
| DEL PEAK 11(12P13.1) WILD-TYPE | 28 | 17 | 21 |
Figure S21. Get High-res Image Gene #38: 'del_12p13.1' versus Molecular Subtype #2: 'LINCRNA_CHIERARCHICAL'
P value = 0.0385 (Fisher's exact test), Q value = 0.13
Table S22. Gene #39: 'del_13q11' versus Molecular Subtype #2: 'LINCRNA_CHIERARCHICAL'
| nPatients | CLUS_1 | CLUS_2 | CLUS_3 |
|---|---|---|---|
| ALL | 33 | 30 | 47 |
| DEL PEAK 12(13Q11) MUTATED | 15 | 23 | 26 |
| DEL PEAK 12(13Q11) WILD-TYPE | 18 | 7 | 21 |
Figure S22. Get High-res Image Gene #39: 'del_13q11' versus Molecular Subtype #2: 'LINCRNA_CHIERARCHICAL'
P value = 0.0283 (Fisher's exact test), Q value = 0.11
Table S23. Gene #43: 'del_18q21.31' versus Molecular Subtype #1: 'MRNA_CHIERARCHICAL'
| nPatients | CLUS_1 | CLUS_2 | CLUS_3 |
|---|---|---|---|
| ALL | 33 | 27 | 50 |
| DEL PEAK 16(18Q21.31) MUTATED | 12 | 16 | 33 |
| DEL PEAK 16(18Q21.31) WILD-TYPE | 21 | 11 | 17 |
Figure S23. Get High-res Image Gene #43: 'del_18q21.31' versus Molecular Subtype #1: 'MRNA_CHIERARCHICAL'
P value = 0.00166 (Fisher's exact test), Q value = 0.028
Table S24. Gene #43: 'del_18q21.31' versus Molecular Subtype #2: 'LINCRNA_CHIERARCHICAL'
| nPatients | CLUS_1 | CLUS_2 | CLUS_3 |
|---|---|---|---|
| ALL | 33 | 30 | 47 |
| DEL PEAK 16(18Q21.31) MUTATED | 10 | 18 | 33 |
| DEL PEAK 16(18Q21.31) WILD-TYPE | 23 | 12 | 14 |
Figure S24. Get High-res Image Gene #43: 'del_18q21.31' versus Molecular Subtype #2: 'LINCRNA_CHIERARCHICAL'
P value = 0.00949 (Fisher's exact test), Q value = 0.059
Table S25. Gene #44: 'del_19q13.33' versus Molecular Subtype #1: 'MRNA_CHIERARCHICAL'
| nPatients | CLUS_1 | CLUS_2 | CLUS_3 |
|---|---|---|---|
| ALL | 33 | 27 | 50 |
| DEL PEAK 17(19Q13.33) MUTATED | 6 | 14 | 23 |
| DEL PEAK 17(19Q13.33) WILD-TYPE | 27 | 13 | 27 |
Figure S25. Get High-res Image Gene #44: 'del_19q13.33' versus Molecular Subtype #1: 'MRNA_CHIERARCHICAL'
P value = 0.0354 (Fisher's exact test), Q value = 0.13
Table S26. Gene #44: 'del_19q13.33' versus Molecular Subtype #2: 'LINCRNA_CHIERARCHICAL'
| nPatients | CLUS_1 | CLUS_2 | CLUS_3 |
|---|---|---|---|
| ALL | 33 | 30 | 47 |
| DEL PEAK 17(19Q13.33) MUTATED | 7 | 13 | 23 |
| DEL PEAK 17(19Q13.33) WILD-TYPE | 26 | 17 | 24 |
Figure S26. Get High-res Image Gene #44: 'del_19q13.33' versus Molecular Subtype #2: 'LINCRNA_CHIERARCHICAL'
P value = 0.0182 (Fisher's exact test), Q value = 0.084
Table S27. Gene #45: 'del_21p11.2' versus Molecular Subtype #1: 'MRNA_CHIERARCHICAL'
| nPatients | CLUS_1 | CLUS_2 | CLUS_3 |
|---|---|---|---|
| ALL | 33 | 27 | 50 |
| DEL PEAK 18(21P11.2) MUTATED | 26 | 16 | 24 |
| DEL PEAK 18(21P11.2) WILD-TYPE | 7 | 11 | 26 |
Figure S27. Get High-res Image Gene #45: 'del_21p11.2' versus Molecular Subtype #1: 'MRNA_CHIERARCHICAL'
P value = 0.00901 (Fisher's exact test), Q value = 0.059
Table S28. Gene #46: 'del_21q11.2' versus Molecular Subtype #1: 'MRNA_CHIERARCHICAL'
| nPatients | CLUS_1 | CLUS_2 | CLUS_3 |
|---|---|---|---|
| ALL | 33 | 27 | 50 |
| DEL PEAK 19(21Q11.2) MUTATED | 12 | 8 | 5 |
| DEL PEAK 19(21Q11.2) WILD-TYPE | 21 | 19 | 45 |
Figure S28. Get High-res Image Gene #46: 'del_21q11.2' versus Molecular Subtype #1: 'MRNA_CHIERARCHICAL'
P value = 0.00083 (Fisher's exact test), Q value = 0.017
Table S29. Gene #46: 'del_21q11.2' versus Molecular Subtype #2: 'LINCRNA_CHIERARCHICAL'
| nPatients | CLUS_1 | CLUS_2 | CLUS_3 |
|---|---|---|---|
| ALL | 33 | 30 | 47 |
| DEL PEAK 19(21Q11.2) MUTATED | 11 | 11 | 3 |
| DEL PEAK 19(21Q11.2) WILD-TYPE | 22 | 19 | 44 |
Figure S29. Get High-res Image Gene #46: 'del_21q11.2' versus Molecular Subtype #2: 'LINCRNA_CHIERARCHICAL'
P value = 0.00053 (Fisher's exact test), Q value = 0.017
Table S30. Gene #50: 'del_xq28' versus Molecular Subtype #1: 'MRNA_CHIERARCHICAL'
| nPatients | CLUS_1 | CLUS_2 | CLUS_3 |
|---|---|---|---|
| ALL | 33 | 27 | 50 |
| DEL PEAK 23(XQ28) MUTATED | 12 | 9 | 3 |
| DEL PEAK 23(XQ28) WILD-TYPE | 21 | 18 | 47 |
Figure S30. Get High-res Image Gene #50: 'del_xq28' versus Molecular Subtype #1: 'MRNA_CHIERARCHICAL'
P value = 0.00981 (Fisher's exact test), Q value = 0.059
Table S31. Gene #50: 'del_xq28' versus Molecular Subtype #2: 'LINCRNA_CHIERARCHICAL'
| nPatients | CLUS_1 | CLUS_2 | CLUS_3 |
|---|---|---|---|
| ALL | 33 | 30 | 47 |
| DEL PEAK 23(XQ28) MUTATED | 11 | 9 | 4 |
| DEL PEAK 23(XQ28) WILD-TYPE | 22 | 21 | 43 |
Figure S31. Get High-res Image Gene #50: 'del_xq28' versus Molecular Subtype #2: 'LINCRNA_CHIERARCHICAL'
-
Copy number data file = all_lesions.txt from GISTIC pipeline
-
Processed Copy number data file = /cromwell_root/fc-e7058367-eaa6-44b5-aab5-1ec08acf146a/601c74c2-1f3b-4ccc-a955-3c502815f156/correlate_genomic_events_all/3ed33866-fb34-41f2-a6ce-5a5fef54acd2/call-preprocess_genomic_event/transformed.cor.cli.txt
-
Molecular subtype file = /cromwell_root/fc-e7058367-eaa6-44b5-aab5-1ec08acf146a/69dd18b3-97fe-4143-b0f4-32e5d55e929d/aggregate_clusters_workflow/d44c315a-761b-4b72-be1f-cb969be36102/call-aggregate_clusters/CPTAC3-LUAD-TP.transposedmergedcluster.txt
-
Number of patients = 110
-
Number of significantly focal cnvs = 51
-
Number of molecular subtypes = 2
-
Exclude genes that fewer than K tumors have alterations, K = 3
For binary or multi-class clinical features (nominal or ordinal), two-tailed Fisher's exact tests (Fisher 1922) were used to estimate the P values using the 'fisher.test' function in R
For multiple hypothesis correction, Q value is the False Discovery Rate (FDR) analogue of the P value (Benjamini and Hochberg 1995), defined as the minimum FDR at which the test may be called significant. We used the 'Benjamini and Hochberg' method of 'p.adjust' function in R to convert P values into Q values.