This pipeline computes the correlation between cancer subtypes identified by different molecular patterns and selected clinical features.
Testing the association between subtypes identified by 8 different clustering approaches and 15 clinical features across 223 patients, 19 significant findings detected with P value < 0.05.
-
CNMF clustering analysis on array-based mRNA expression data identified 2 subtypes that do not correlate to any clinical features.
-
Consensus hierarchical clustering analysis on array-based mRNA expression data identified 5 subtypes that do not correlate to any clinical features.
-
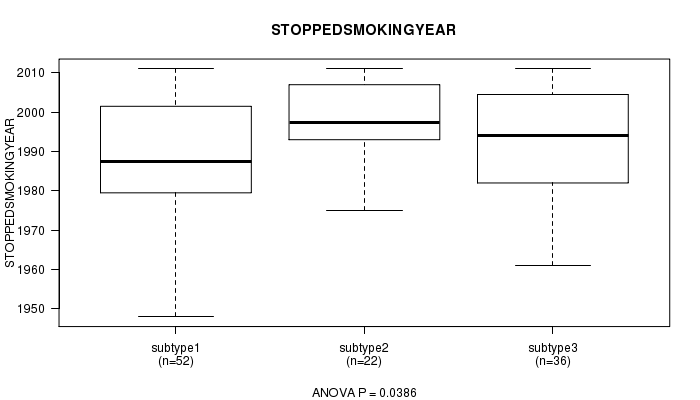
3 subtypes identified in current cancer cohort by 'CN CNMF'. These subtypes correlate to 'AGE', 'KARNOFSKY.PERFORMANCE.SCORE', 'STOPPEDSMOKINGYEAR', and 'TOBACCOSMOKINGHISTORYINDICATOR'.
-
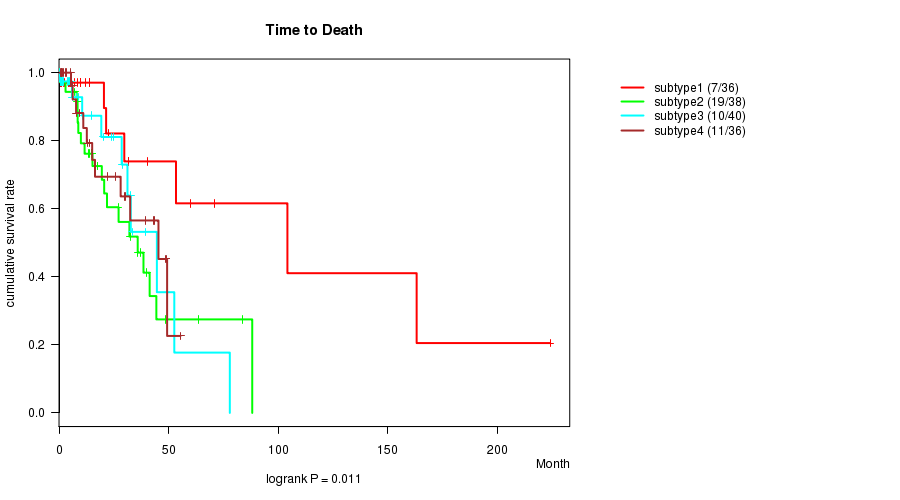
4 subtypes identified in current cancer cohort by 'METHLYATION CNMF'. These subtypes correlate to 'Time to Death', 'GENDER', and 'NUMBERPACKYEARSSMOKED'.
-
CNMF clustering analysis on sequencing-based mRNA expression data identified 3 subtypes that correlate to 'Time to Death', 'AGE', 'GENDER', 'KARNOFSKY.PERFORMANCE.SCORE', and 'HISTOLOGICAL.TYPE'.
-
Consensus hierarchical clustering analysis on sequencing-based mRNA expression data identified 3 subtypes that correlate to 'Time to Death', 'GENDER', and 'HISTOLOGICAL.TYPE'.
-
CNMF clustering analysis on sequencing-based miR expression data identified 3 subtypes that correlate to 'KARNOFSKY.PERFORMANCE.SCORE' and 'HISTOLOGICAL.TYPE'.
-
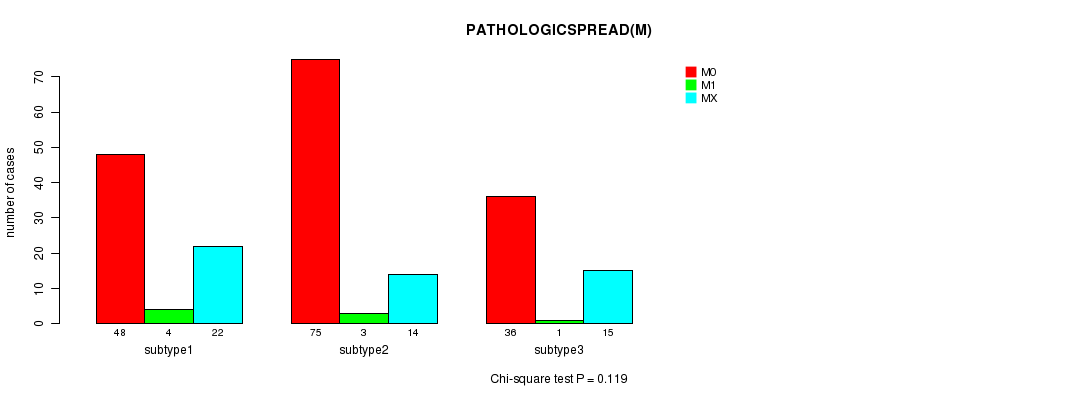
Consensus hierarchical clustering analysis on sequencing-based miR expression data identified 3 subtypes that correlate to 'Time to Death' and 'PATHOLOGICSPREAD(M)'.
Table 1. Get Full Table Overview of the association between subtypes identified by 8 different clustering approaches and 15 clinical features. Shown in the table are P values from statistical tests. Thresholded by P value < 0.05, 19 significant findings detected.
|
Clinical Features |
Statistical Tests |
mRNA CNMF subtypes |
mRNA cHierClus subtypes |
CN CNMF |
METHLYATION CNMF |
RNAseq CNMF subtypes |
RNAseq cHierClus subtypes |
MIRseq CNMF subtypes |
MIRseq cHierClus subtypes |
| Time to Death | logrank test | 0.678 | 0.145 | 0.19 | 0.011 | 0.00544 | 0.000721 | 0.0745 | 0.0225 |
| AGE | ANOVA | 0.623 | 0.394 | 0.0298 | 0.191 | 0.0343 | 0.222 | 0.348 | 0.152 |
| GENDER | Fisher's exact test | 0.0995 | 0.352 | 0.462 | 0.0129 | 5.47e-06 | 0.000214 | 0.659 | 0.0696 |
| KARNOFSKY PERFORMANCE SCORE | ANOVA | 0.0458 | 0.159 | 0.0171 | 0.065 | 0.0336 | 0.596 | ||
| HISTOLOGICAL TYPE | Chi-square test | 1 | 0.439 | 0.529 | 0.421 | 0.00697 | 0.00148 | 0.0143 | 0.122 |
| PATHOLOGY T | Chi-square test | 0.64 | 0.916 | 0.287 | 0.479 | 0.0763 | 0.463 | 0.601 | 0.34 |
| PATHOLOGY N | Chi-square test | 0.632 | 0.613 | 0.839 | 0.666 | 0.248 | 0.32 | 0.85 | 0.876 |
| PATHOLOGICSPREAD(M) | Chi-square test | 1 | 0.439 | 0.986 | 0.475 | 0.321 | 0.556 | 0.119 | 0.0366 |
| TUMOR STAGE | Chi-square test | 0.174 | 0.301 | 0.728 | 0.865 | 0.213 | 0.685 | 0.854 | 0.683 |
| RADIATIONS RADIATION REGIMENINDICATION | Fisher's exact test | 1 | 0.439 | 0.656 | 0.606 | 0.84 | 0.933 | 0.789 | 0.443 |
| NEOADJUVANT THERAPY | Fisher's exact test | 1 | 0.916 | 0.337 | 0.504 | 0.103 | 0.0574 | 0.0568 | 0.872 |
| NUMBERPACKYEARSSMOKED | ANOVA | 0.379 | 0.199 | 0.104 | 0.0483 | 0.113 | 0.81 | 0.739 | 0.523 |
| STOPPEDSMOKINGYEAR | ANOVA | 0.913 | 0.0386 | 0.352 | 0.81 | 0.178 | 0.347 | 0.485 | |
| TOBACCOSMOKINGHISTORYINDICATOR | Chi-square test | 0.234 | 0.246 | 0.0144 | 0.169 | 0.219 | 0.319 | 0.249 | 0.204 |
| YEAROFTOBACCOSMOKINGONSET | ANOVA | 0.742 | 0.892 | 0.952 | 0.299 | 0.504 | 0.521 | 0.197 | 0.351 |
Table S1. Get Full Table Description of clustering approach #1: 'mRNA CNMF subtypes'
| Cluster Labels | 1 | 2 |
|---|---|---|
| Number of samples | 11 | 12 |
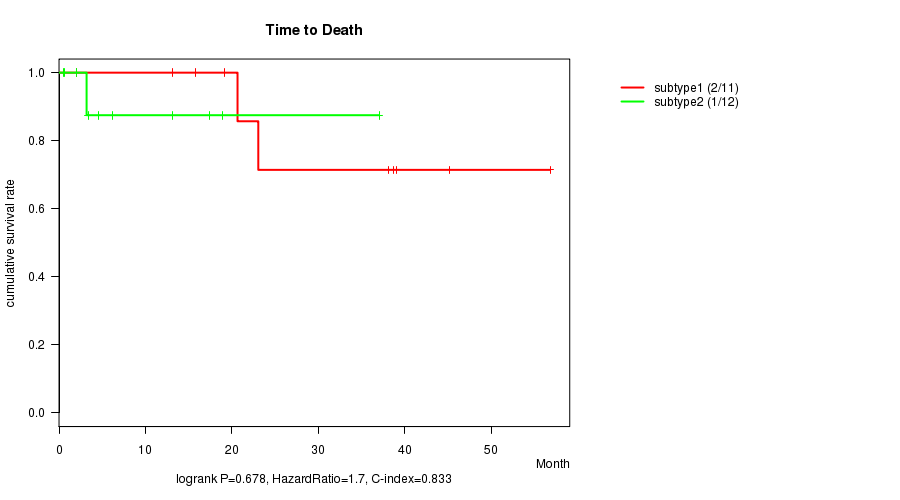
P value = 0.678 (logrank test)
Table S2. Clustering Approach #1: 'mRNA CNMF subtypes' versus Clinical Feature #1: 'Time to Death'
| nPatients | nDeath | Duration Range (Median), Month | |
|---|---|---|---|
| ALL | 23 | 3 | 0.5 - 56.8 (15.8) |
| subtype1 | 11 | 2 | 2.0 - 56.8 (23.1) |
| subtype2 | 12 | 1 | 0.5 - 37.0 (4.0) |
Figure S1. Get High-res Image Clustering Approach #1: 'mRNA CNMF subtypes' versus Clinical Feature #1: 'Time to Death'
P value = 0.623 (t-test)
Table S3. Clustering Approach #1: 'mRNA CNMF subtypes' versus Clinical Feature #2: 'AGE'
| nPatients | Mean (Std.Dev) | |
|---|---|---|
| ALL | 22 | 66.2 (9.8) |
| subtype1 | 10 | 65.1 (8.2) |
| subtype2 | 12 | 67.2 (11.2) |
Figure S2. Get High-res Image Clustering Approach #1: 'mRNA CNMF subtypes' versus Clinical Feature #2: 'AGE'

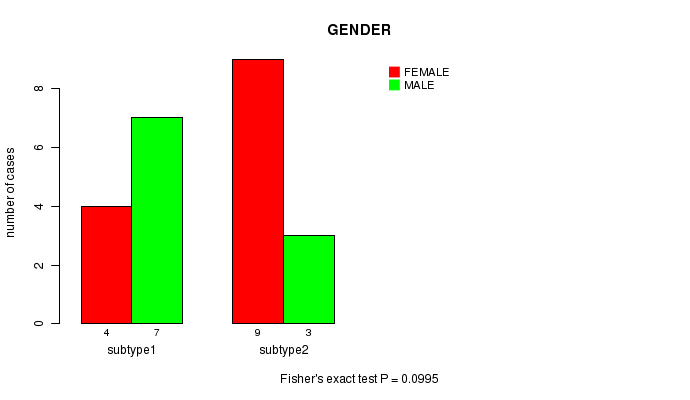
P value = 0.0995 (Fisher's exact test)
Table S4. Clustering Approach #1: 'mRNA CNMF subtypes' versus Clinical Feature #3: 'GENDER'
| nPatients | FEMALE | MALE |
|---|---|---|
| ALL | 13 | 10 |
| subtype1 | 4 | 7 |
| subtype2 | 9 | 3 |
Figure S3. Get High-res Image Clustering Approach #1: 'mRNA CNMF subtypes' versus Clinical Feature #3: 'GENDER'
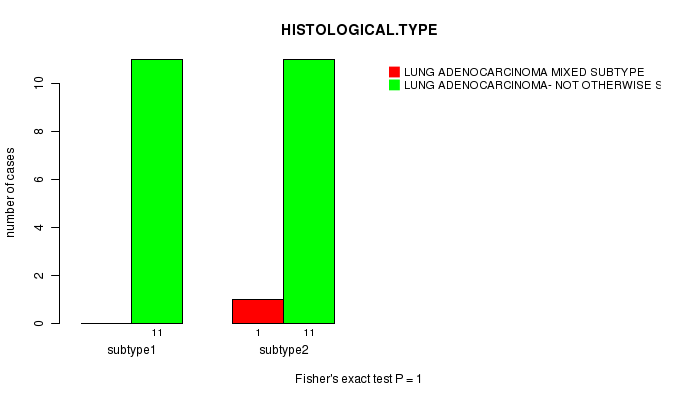
P value = 1 (Fisher's exact test)
Table S5. Clustering Approach #1: 'mRNA CNMF subtypes' versus Clinical Feature #5: 'HISTOLOGICAL.TYPE'
| nPatients | LUNG ADENOCARCINOMA MIXED SUBTYPE | LUNG ADENOCARCINOMA- NOT OTHERWISE SPECIFIED (NOS) |
|---|---|---|
| ALL | 1 | 22 |
| subtype1 | 0 | 11 |
| subtype2 | 1 | 11 |
Figure S4. Get High-res Image Clustering Approach #1: 'mRNA CNMF subtypes' versus Clinical Feature #5: 'HISTOLOGICAL.TYPE'
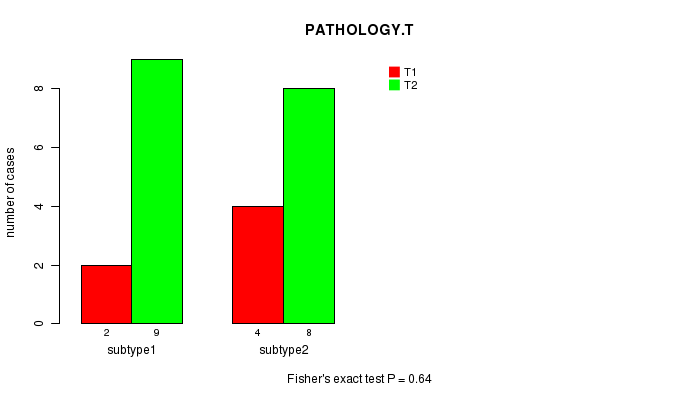
P value = 0.64 (Fisher's exact test)
Table S6. Clustering Approach #1: 'mRNA CNMF subtypes' versus Clinical Feature #6: 'PATHOLOGY.T'
| nPatients | T1 | T2 |
|---|---|---|
| ALL | 6 | 17 |
| subtype1 | 2 | 9 |
| subtype2 | 4 | 8 |
Figure S5. Get High-res Image Clustering Approach #1: 'mRNA CNMF subtypes' versus Clinical Feature #6: 'PATHOLOGY.T'
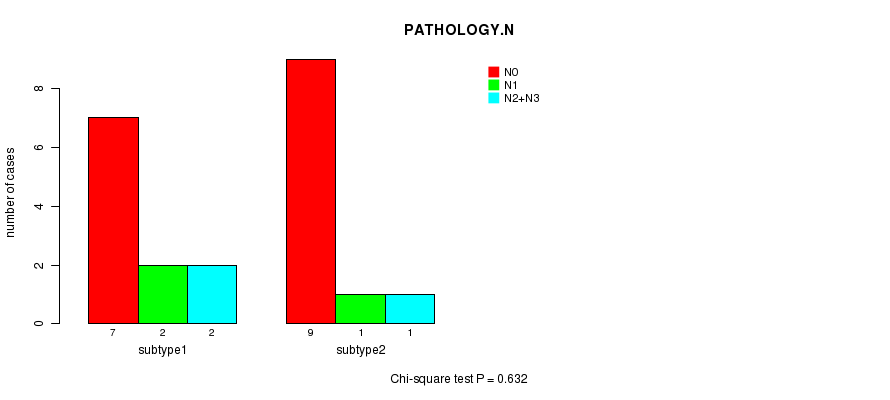
P value = 0.632 (Chi-square test)
Table S7. Clustering Approach #1: 'mRNA CNMF subtypes' versus Clinical Feature #7: 'PATHOLOGY.N'
| nPatients | N0 | N1 | N2+N3 |
|---|---|---|---|
| ALL | 16 | 3 | 3 |
| subtype1 | 7 | 2 | 2 |
| subtype2 | 9 | 1 | 1 |
Figure S6. Get High-res Image Clustering Approach #1: 'mRNA CNMF subtypes' versus Clinical Feature #7: 'PATHOLOGY.N'
P value = 1 (Fisher's exact test)
Table S8. Clustering Approach #1: 'mRNA CNMF subtypes' versus Clinical Feature #8: 'PATHOLOGICSPREAD(M)'
| nPatients | M0 | M1 |
|---|---|---|
| ALL | 22 | 1 |
| subtype1 | 11 | 0 |
| subtype2 | 11 | 1 |
Figure S7. Get High-res Image Clustering Approach #1: 'mRNA CNMF subtypes' versus Clinical Feature #8: 'PATHOLOGICSPREAD(M)'

P value = 0.174 (Chi-square test)
Table S9. Clustering Approach #1: 'mRNA CNMF subtypes' versus Clinical Feature #9: 'TUMOR.STAGE'
| nPatients | I | II | III | IV |
|---|---|---|---|---|
| ALL | 16 | 4 | 2 | 1 |
| subtype1 | 6 | 3 | 2 | 0 |
| subtype2 | 10 | 1 | 0 | 1 |
Figure S8. Get High-res Image Clustering Approach #1: 'mRNA CNMF subtypes' versus Clinical Feature #9: 'TUMOR.STAGE'

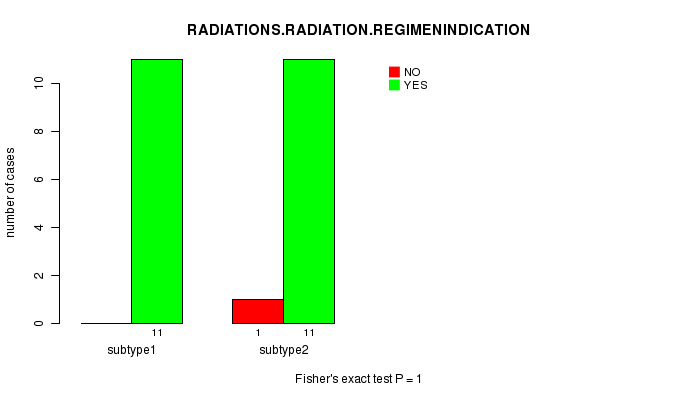
P value = 1 (Fisher's exact test)
Table S10. Clustering Approach #1: 'mRNA CNMF subtypes' versus Clinical Feature #10: 'RADIATIONS.RADIATION.REGIMENINDICATION'
| nPatients | NO | YES |
|---|---|---|
| ALL | 1 | 22 |
| subtype1 | 0 | 11 |
| subtype2 | 1 | 11 |
Figure S9. Get High-res Image Clustering Approach #1: 'mRNA CNMF subtypes' versus Clinical Feature #10: 'RADIATIONS.RADIATION.REGIMENINDICATION'
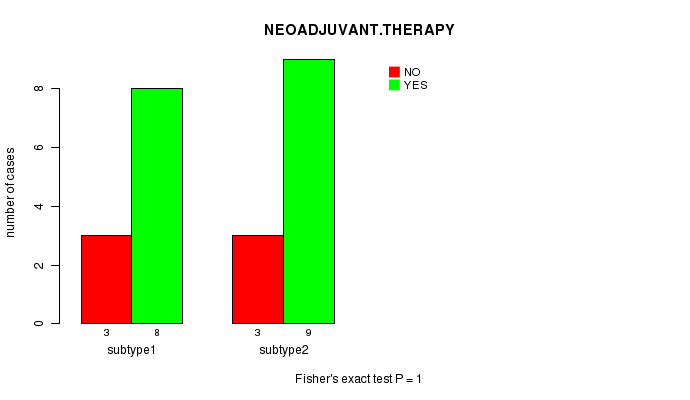
P value = 1 (Fisher's exact test)
Table S11. Clustering Approach #1: 'mRNA CNMF subtypes' versus Clinical Feature #11: 'NEOADJUVANT.THERAPY'
| nPatients | NO | YES |
|---|---|---|
| ALL | 6 | 17 |
| subtype1 | 3 | 8 |
| subtype2 | 3 | 9 |
Figure S10. Get High-res Image Clustering Approach #1: 'mRNA CNMF subtypes' versus Clinical Feature #11: 'NEOADJUVANT.THERAPY'
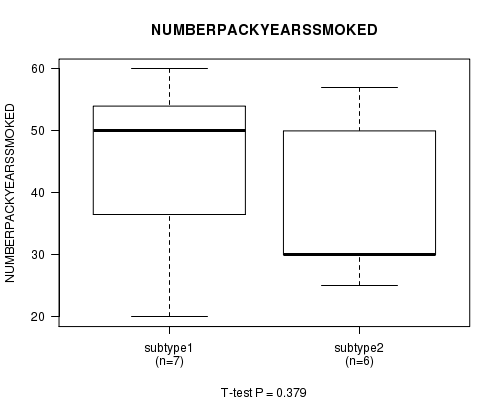
P value = 0.379 (t-test)
Table S12. Clustering Approach #1: 'mRNA CNMF subtypes' versus Clinical Feature #12: 'NUMBERPACKYEARSSMOKED'
| nPatients | Mean (Std.Dev) | |
|---|---|---|
| ALL | 13 | 41.0 (14.7) |
| subtype1 | 7 | 44.4 (16.1) |
| subtype2 | 6 | 37.0 (13.1) |
Figure S11. Get High-res Image Clustering Approach #1: 'mRNA CNMF subtypes' versus Clinical Feature #12: 'NUMBERPACKYEARSSMOKED'
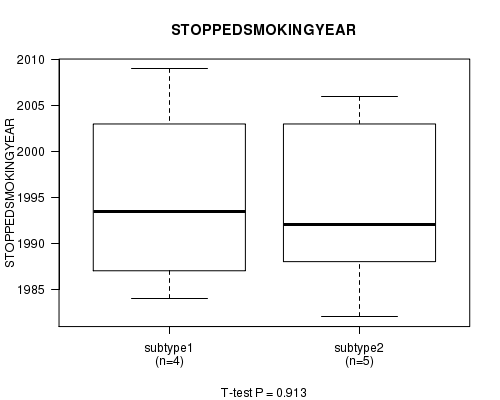
P value = 0.913 (t-test)
Table S13. Clustering Approach #1: 'mRNA CNMF subtypes' versus Clinical Feature #13: 'STOPPEDSMOKINGYEAR'
| nPatients | Mean (Std.Dev) | |
|---|---|---|
| ALL | 9 | 1994.6 (9.7) |
| subtype1 | 4 | 1995.0 (10.7) |
| subtype2 | 5 | 1994.2 (10.1) |
Figure S12. Get High-res Image Clustering Approach #1: 'mRNA CNMF subtypes' versus Clinical Feature #13: 'STOPPEDSMOKINGYEAR'
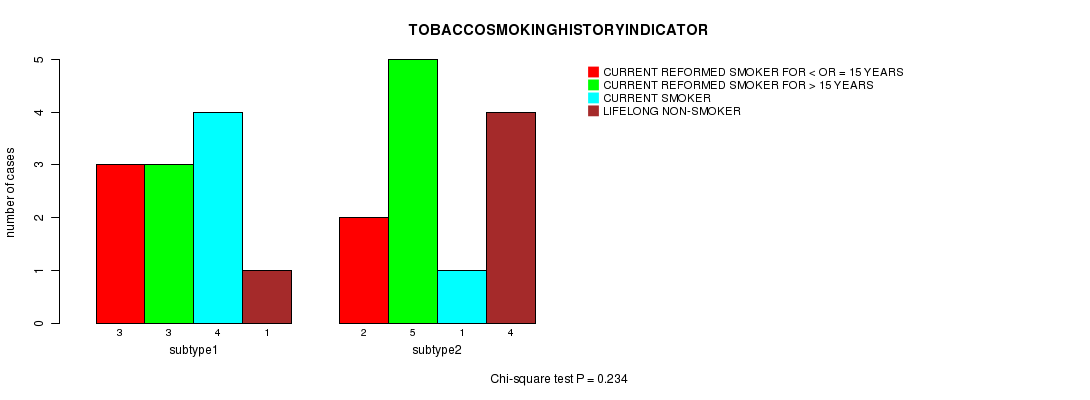
P value = 0.234 (Chi-square test)
Table S14. Clustering Approach #1: 'mRNA CNMF subtypes' versus Clinical Feature #14: 'TOBACCOSMOKINGHISTORYINDICATOR'
| nPatients | CURRENT REFORMED SMOKER FOR < OR = 15 YEARS | CURRENT REFORMED SMOKER FOR > 15 YEARS | CURRENT SMOKER | LIFELONG NON-SMOKER |
|---|---|---|---|---|
| ALL | 5 | 8 | 5 | 5 |
| subtype1 | 3 | 3 | 4 | 1 |
| subtype2 | 2 | 5 | 1 | 4 |
Figure S13. Get High-res Image Clustering Approach #1: 'mRNA CNMF subtypes' versus Clinical Feature #14: 'TOBACCOSMOKINGHISTORYINDICATOR'
P value = 0.742 (t-test)
Table S15. Clustering Approach #1: 'mRNA CNMF subtypes' versus Clinical Feature #15: 'YEAROFTOBACCOSMOKINGONSET'
| nPatients | Mean (Std.Dev) | |
|---|---|---|
| ALL | 13 | 1967.0 (11.5) |
| subtype1 | 7 | 1968.0 (14.4) |
| subtype2 | 6 | 1965.8 (8.2) |
Figure S14. Get High-res Image Clustering Approach #1: 'mRNA CNMF subtypes' versus Clinical Feature #15: 'YEAROFTOBACCOSMOKINGONSET'
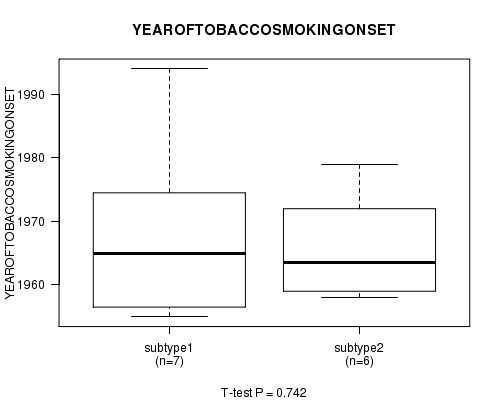
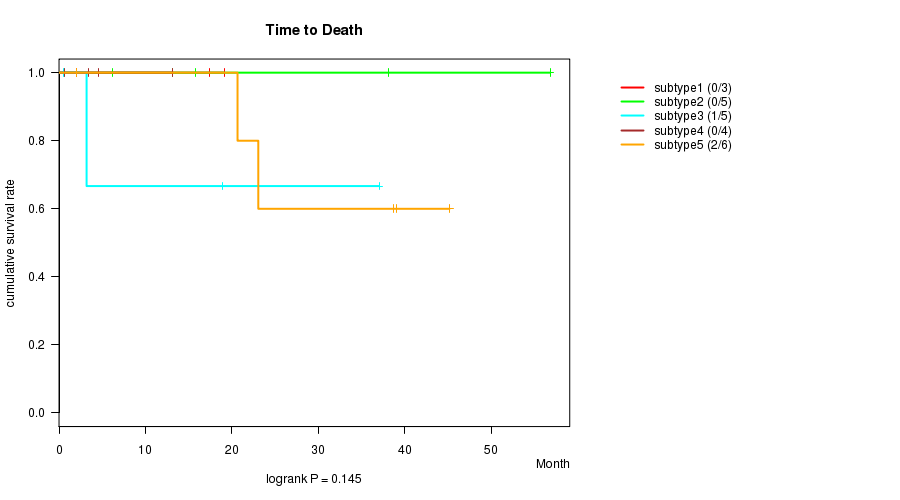
Table S16. Get Full Table Description of clustering approach #2: 'mRNA cHierClus subtypes'
| Cluster Labels | 1 | 2 | 3 | 4 | 5 |
|---|---|---|---|---|---|
| Number of samples | 3 | 5 | 5 | 4 | 6 |
P value = 0.145 (logrank test)
Table S17. Clustering Approach #2: 'mRNA cHierClus subtypes' versus Clinical Feature #1: 'Time to Death'
| nPatients | nDeath | Duration Range (Median), Month | |
|---|---|---|---|
| ALL | 23 | 3 | 0.5 - 56.8 (15.8) |
| subtype1 | 3 | 0 | 2.0 - 19.1 (17.4) |
| subtype2 | 5 | 0 | 6.2 - 56.8 (15.8) |
| subtype3 | 5 | 1 | 0.5 - 37.0 (3.2) |
| subtype4 | 4 | 0 | 0.6 - 13.2 (4.0) |
| subtype5 | 6 | 2 | 2.0 - 45.2 (30.9) |
Figure S15. Get High-res Image Clustering Approach #2: 'mRNA cHierClus subtypes' versus Clinical Feature #1: 'Time to Death'
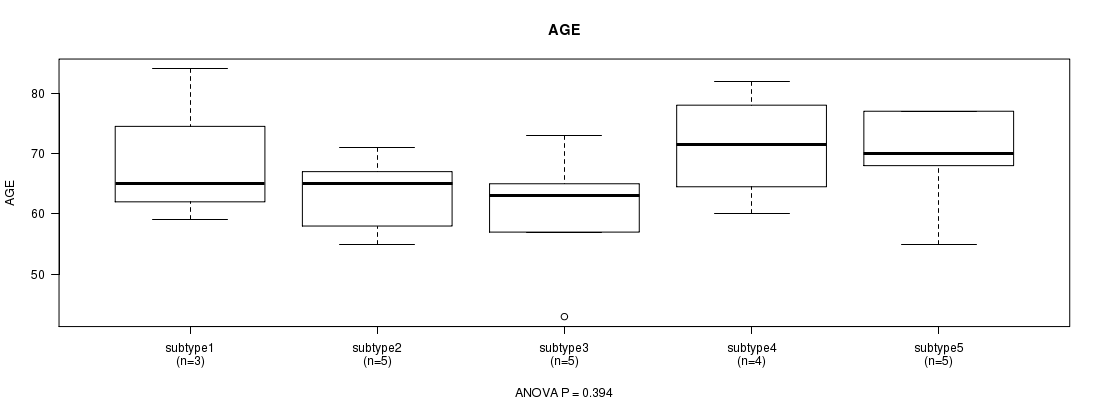
P value = 0.394 (ANOVA)
Table S18. Clustering Approach #2: 'mRNA cHierClus subtypes' versus Clinical Feature #2: 'AGE'
| nPatients | Mean (Std.Dev) | |
|---|---|---|
| ALL | 22 | 66.2 (9.8) |
| subtype1 | 3 | 69.3 (13.1) |
| subtype2 | 5 | 63.2 (6.6) |
| subtype3 | 5 | 60.2 (11.2) |
| subtype4 | 4 | 71.2 (9.2) |
| subtype5 | 5 | 69.4 (9.0) |
Figure S16. Get High-res Image Clustering Approach #2: 'mRNA cHierClus subtypes' versus Clinical Feature #2: 'AGE'
P value = 0.352 (Chi-square test)
Table S19. Clustering Approach #2: 'mRNA cHierClus subtypes' versus Clinical Feature #3: 'GENDER'
| nPatients | FEMALE | MALE |
|---|---|---|
| ALL | 13 | 10 |
| subtype1 | 2 | 1 |
| subtype2 | 2 | 3 |
| subtype3 | 2 | 3 |
| subtype4 | 4 | 0 |
| subtype5 | 3 | 3 |
Figure S17. Get High-res Image Clustering Approach #2: 'mRNA cHierClus subtypes' versus Clinical Feature #3: 'GENDER'

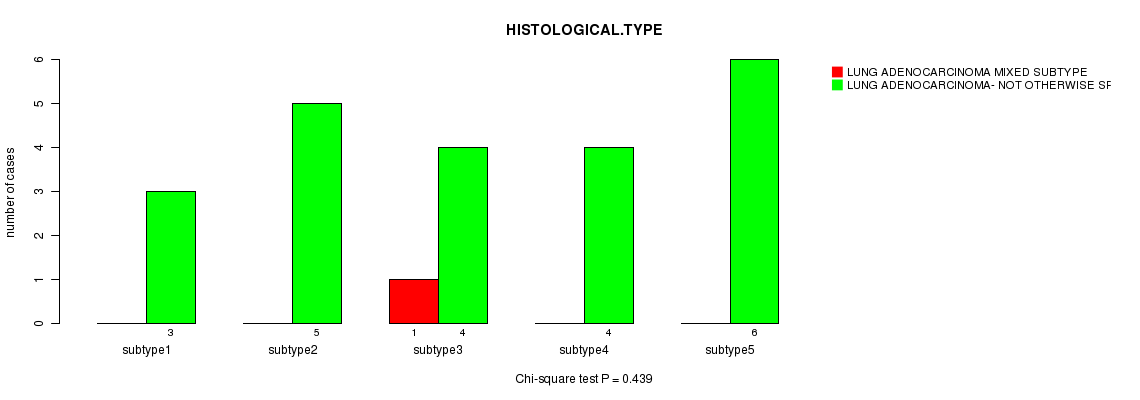
P value = 0.439 (Chi-square test)
Table S20. Clustering Approach #2: 'mRNA cHierClus subtypes' versus Clinical Feature #5: 'HISTOLOGICAL.TYPE'
| nPatients | LUNG ADENOCARCINOMA MIXED SUBTYPE | LUNG ADENOCARCINOMA- NOT OTHERWISE SPECIFIED (NOS) |
|---|---|---|
| ALL | 1 | 22 |
| subtype1 | 0 | 3 |
| subtype2 | 0 | 5 |
| subtype3 | 1 | 4 |
| subtype4 | 0 | 4 |
| subtype5 | 0 | 6 |
Figure S18. Get High-res Image Clustering Approach #2: 'mRNA cHierClus subtypes' versus Clinical Feature #5: 'HISTOLOGICAL.TYPE'
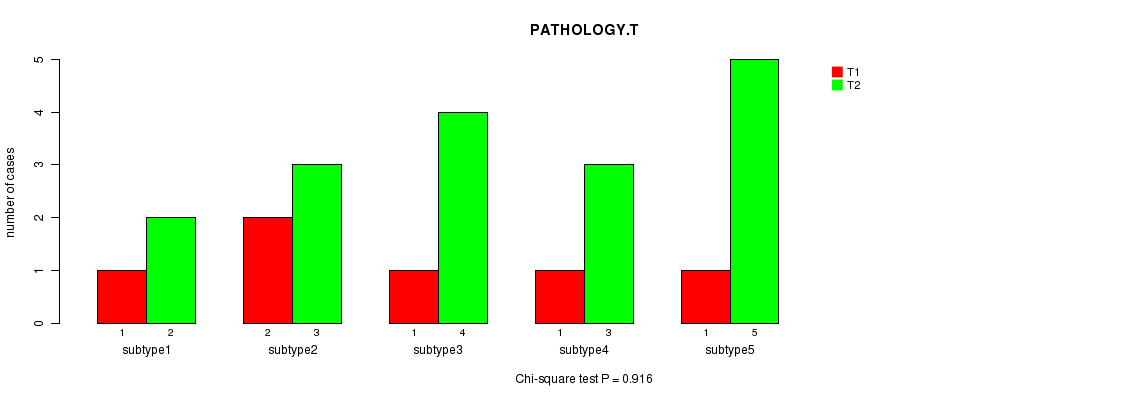
P value = 0.916 (Chi-square test)
Table S21. Clustering Approach #2: 'mRNA cHierClus subtypes' versus Clinical Feature #6: 'PATHOLOGY.T'
| nPatients | T1 | T2 |
|---|---|---|
| ALL | 6 | 17 |
| subtype1 | 1 | 2 |
| subtype2 | 2 | 3 |
| subtype3 | 1 | 4 |
| subtype4 | 1 | 3 |
| subtype5 | 1 | 5 |
Figure S19. Get High-res Image Clustering Approach #2: 'mRNA cHierClus subtypes' versus Clinical Feature #6: 'PATHOLOGY.T'
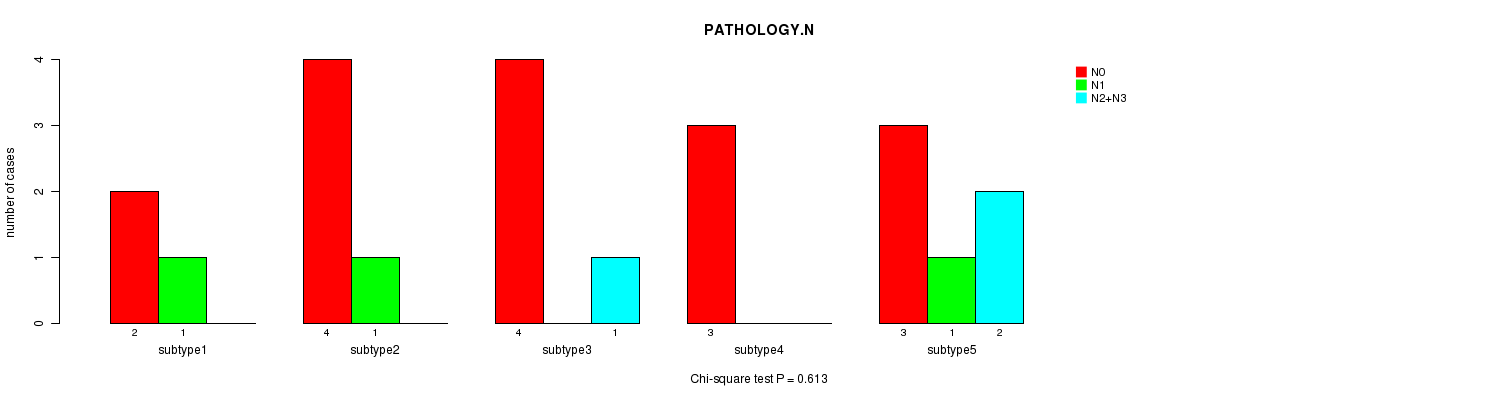
P value = 0.613 (Chi-square test)
Table S22. Clustering Approach #2: 'mRNA cHierClus subtypes' versus Clinical Feature #7: 'PATHOLOGY.N'
| nPatients | N0 | N1 | N2+N3 |
|---|---|---|---|
| ALL | 16 | 3 | 3 |
| subtype1 | 2 | 1 | 0 |
| subtype2 | 4 | 1 | 0 |
| subtype3 | 4 | 0 | 1 |
| subtype4 | 3 | 0 | 0 |
| subtype5 | 3 | 1 | 2 |
Figure S20. Get High-res Image Clustering Approach #2: 'mRNA cHierClus subtypes' versus Clinical Feature #7: 'PATHOLOGY.N'
P value = 0.439 (Chi-square test)
Table S23. Clustering Approach #2: 'mRNA cHierClus subtypes' versus Clinical Feature #8: 'PATHOLOGICSPREAD(M)'
| nPatients | M0 | M1 |
|---|---|---|
| ALL | 22 | 1 |
| subtype1 | 3 | 0 |
| subtype2 | 5 | 0 |
| subtype3 | 4 | 1 |
| subtype4 | 4 | 0 |
| subtype5 | 6 | 0 |
Figure S21. Get High-res Image Clustering Approach #2: 'mRNA cHierClus subtypes' versus Clinical Feature #8: 'PATHOLOGICSPREAD(M)'
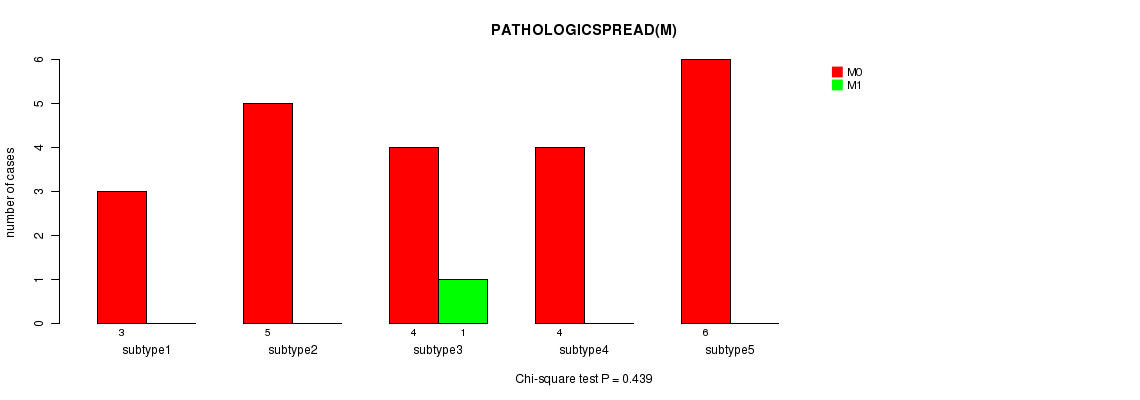
P value = 0.301 (Chi-square test)
Table S24. Clustering Approach #2: 'mRNA cHierClus subtypes' versus Clinical Feature #9: 'TUMOR.STAGE'
| nPatients | I | II | III | IV |
|---|---|---|---|---|
| ALL | 16 | 4 | 2 | 1 |
| subtype1 | 2 | 1 | 0 | 0 |
| subtype2 | 4 | 1 | 0 | 0 |
| subtype3 | 4 | 0 | 0 | 1 |
| subtype4 | 4 | 0 | 0 | 0 |
| subtype5 | 2 | 2 | 2 | 0 |
Figure S22. Get High-res Image Clustering Approach #2: 'mRNA cHierClus subtypes' versus Clinical Feature #9: 'TUMOR.STAGE'
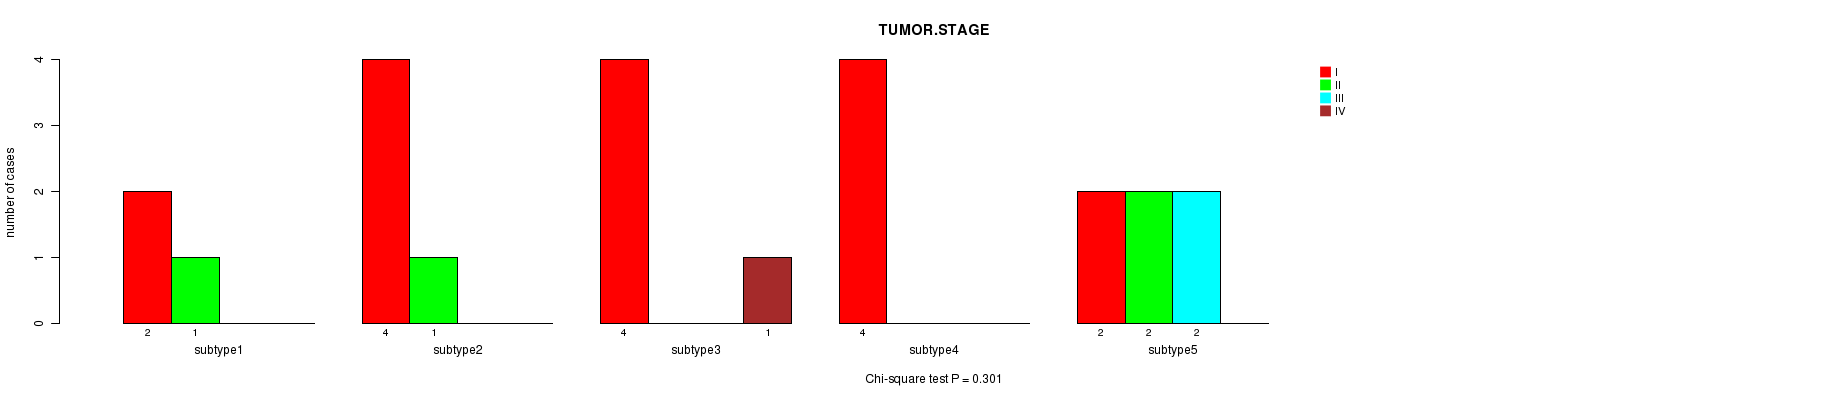
P value = 0.439 (Chi-square test)
Table S25. Clustering Approach #2: 'mRNA cHierClus subtypes' versus Clinical Feature #10: 'RADIATIONS.RADIATION.REGIMENINDICATION'
| nPatients | NO | YES |
|---|---|---|
| ALL | 1 | 22 |
| subtype1 | 0 | 3 |
| subtype2 | 0 | 5 |
| subtype3 | 1 | 4 |
| subtype4 | 0 | 4 |
| subtype5 | 0 | 6 |
Figure S23. Get High-res Image Clustering Approach #2: 'mRNA cHierClus subtypes' versus Clinical Feature #10: 'RADIATIONS.RADIATION.REGIMENINDICATION'
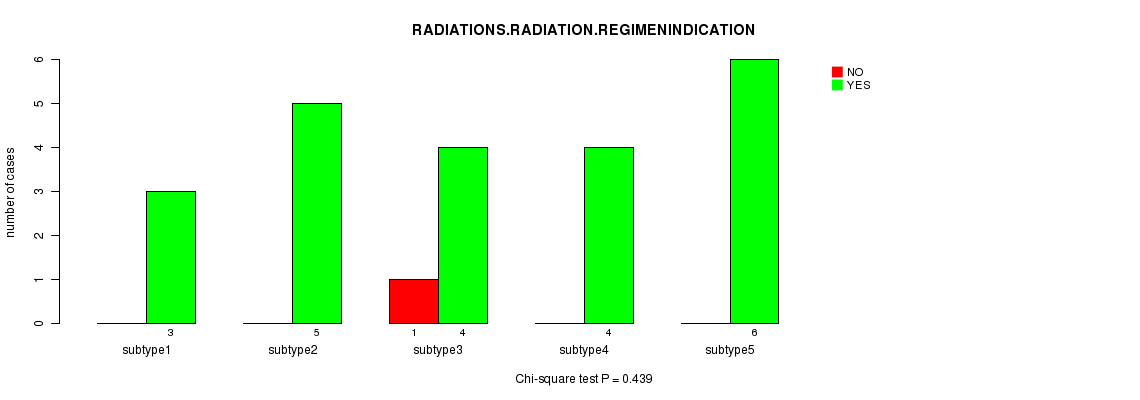
P value = 0.916 (Chi-square test)
Table S26. Clustering Approach #2: 'mRNA cHierClus subtypes' versus Clinical Feature #11: 'NEOADJUVANT.THERAPY'
| nPatients | NO | YES |
|---|---|---|
| ALL | 6 | 17 |
| subtype1 | 1 | 2 |
| subtype2 | 2 | 3 |
| subtype3 | 1 | 4 |
| subtype4 | 1 | 3 |
| subtype5 | 1 | 5 |
Figure S24. Get High-res Image Clustering Approach #2: 'mRNA cHierClus subtypes' versus Clinical Feature #11: 'NEOADJUVANT.THERAPY'

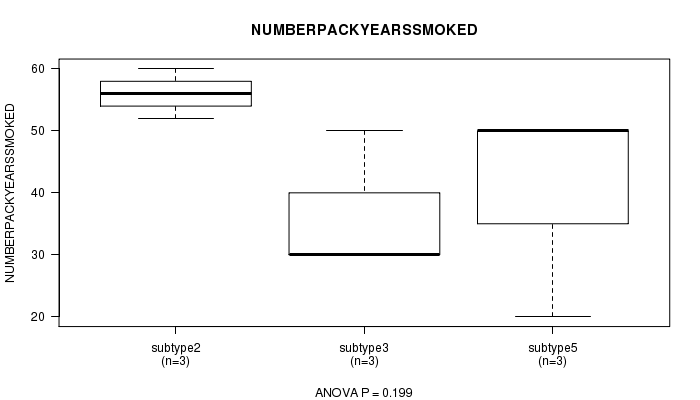
P value = 0.199 (ANOVA)
Table S27. Clustering Approach #2: 'mRNA cHierClus subtypes' versus Clinical Feature #12: 'NUMBERPACKYEARSSMOKED'
| nPatients | Mean (Std.Dev) | |
|---|---|---|
| ALL | 13 | 41.0 (14.7) |
| subtype1 | 2 | 40.0 (24.0) |
| subtype2 | 3 | 56.0 (4.0) |
| subtype3 | 3 | 36.7 (11.5) |
| subtype4 | 2 | 27.5 (3.5) |
| subtype5 | 3 | 40.0 (17.3) |
Figure S25. Get High-res Image Clustering Approach #2: 'mRNA cHierClus subtypes' versus Clinical Feature #12: 'NUMBERPACKYEARSSMOKED'
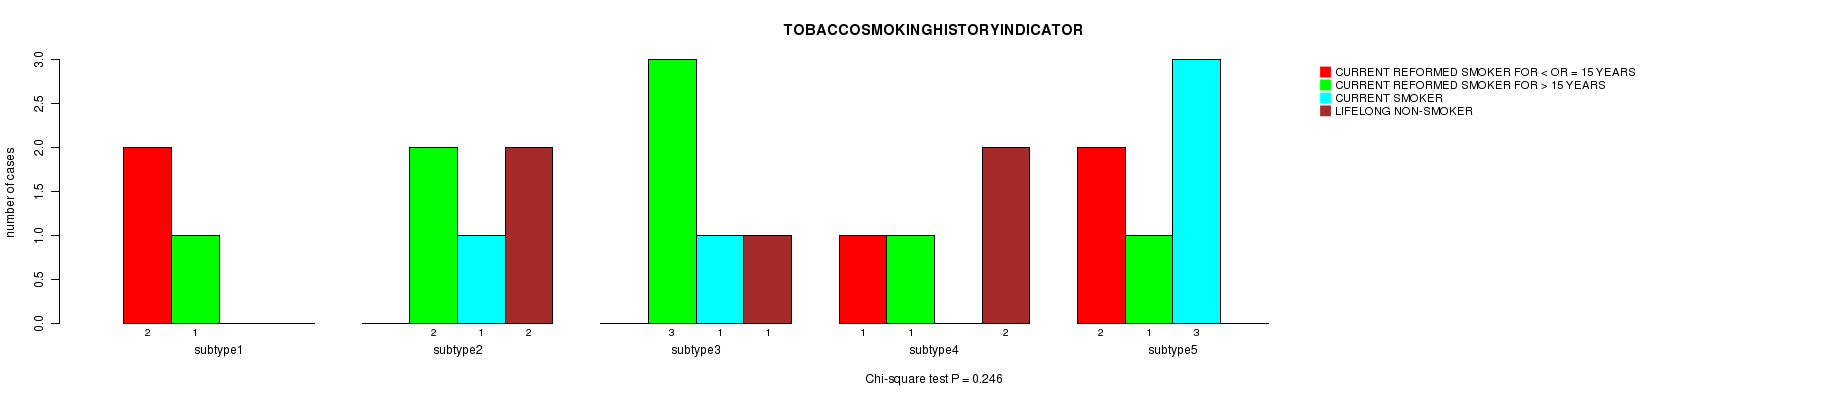
P value = 0.246 (Chi-square test)
Table S28. Clustering Approach #2: 'mRNA cHierClus subtypes' versus Clinical Feature #14: 'TOBACCOSMOKINGHISTORYINDICATOR'
| nPatients | CURRENT REFORMED SMOKER FOR < OR = 15 YEARS | CURRENT REFORMED SMOKER FOR > 15 YEARS | CURRENT SMOKER | LIFELONG NON-SMOKER |
|---|---|---|---|---|
| ALL | 5 | 8 | 5 | 5 |
| subtype1 | 2 | 1 | 0 | 0 |
| subtype2 | 0 | 2 | 1 | 2 |
| subtype3 | 0 | 3 | 1 | 1 |
| subtype4 | 1 | 1 | 0 | 2 |
| subtype5 | 2 | 1 | 3 | 0 |
Figure S26. Get High-res Image Clustering Approach #2: 'mRNA cHierClus subtypes' versus Clinical Feature #14: 'TOBACCOSMOKINGHISTORYINDICATOR'
P value = 0.892 (ANOVA)
Table S29. Clustering Approach #2: 'mRNA cHierClus subtypes' versus Clinical Feature #15: 'YEAROFTOBACCOSMOKINGONSET'
| nPatients | Mean (Std.Dev) | |
|---|---|---|
| ALL | 13 | 1967.0 (11.5) |
| subtype1 | 2 | 1979.5 (20.5) |
| subtype2 | 1 | 1956.0 (NA) |
| subtype3 | 3 | 1966.3 (11.2) |
| subtype4 | 2 | 1965.5 (9.2) |
| subtype5 | 5 | 1965.2 (9.8) |
Figure S27. Get High-res Image Clustering Approach #2: 'mRNA cHierClus subtypes' versus Clinical Feature #15: 'YEAROFTOBACCOSMOKINGONSET'

Table S30. Get Full Table Description of clustering approach #3: 'CN CNMF'
| Cluster Labels | 1 | 2 | 3 |
|---|---|---|---|
| Number of samples | 97 | 50 | 76 |
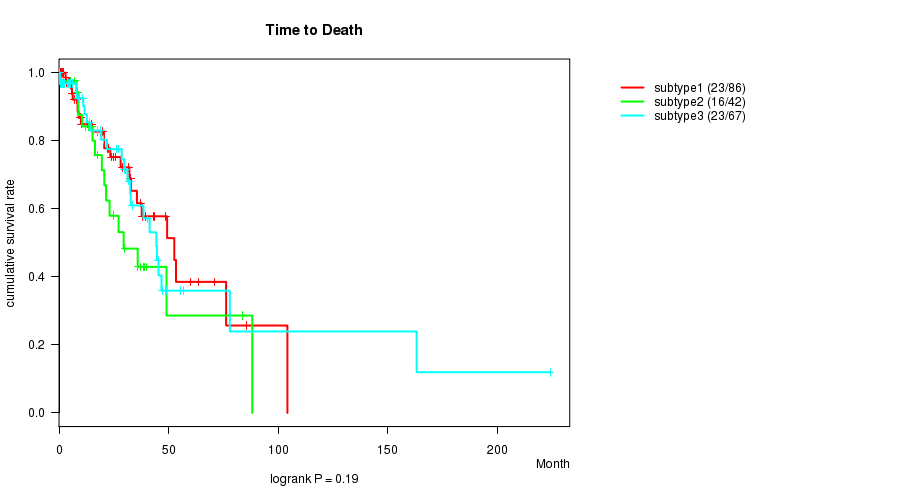
P value = 0.19 (logrank test)
Table S31. Clustering Approach #3: 'CN CNMF' versus Clinical Feature #1: 'Time to Death'
| nPatients | nDeath | Duration Range (Median), Month | |
|---|---|---|---|
| ALL | 195 | 62 | 0.0 - 224.0 (13.9) |
| subtype1 | 86 | 23 | 0.1 - 104.2 (13.1) |
| subtype2 | 42 | 16 | 0.1 - 88.1 (14.9) |
| subtype3 | 67 | 23 | 0.0 - 224.0 (15.8) |
Figure S28. Get High-res Image Clustering Approach #3: 'CN CNMF' versus Clinical Feature #1: 'Time to Death'
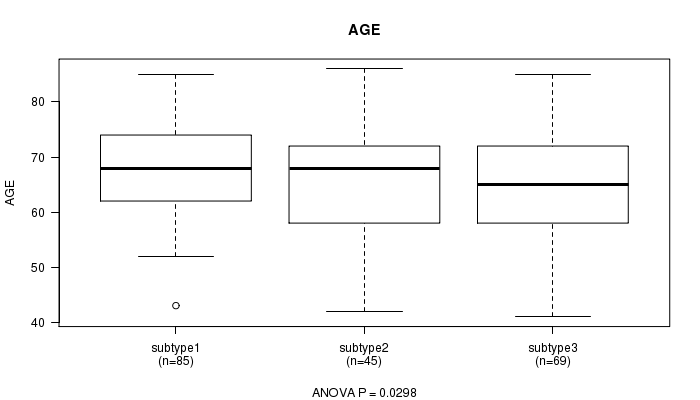
P value = 0.0298 (ANOVA)
Table S32. Clustering Approach #3: 'CN CNMF' versus Clinical Feature #2: 'AGE'
| nPatients | Mean (Std.Dev) | |
|---|---|---|
| ALL | 199 | 65.9 (9.7) |
| subtype1 | 85 | 68.0 (8.3) |
| subtype2 | 45 | 64.9 (10.1) |
| subtype3 | 69 | 64.1 (10.5) |
Figure S29. Get High-res Image Clustering Approach #3: 'CN CNMF' versus Clinical Feature #2: 'AGE'
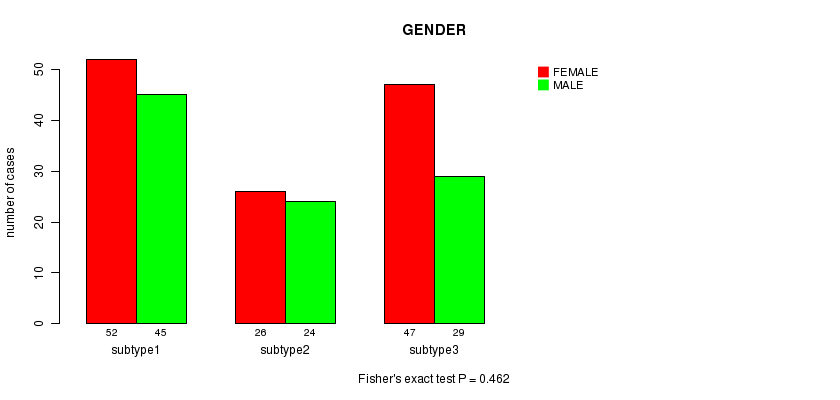
P value = 0.462 (Fisher's exact test)
Table S33. Clustering Approach #3: 'CN CNMF' versus Clinical Feature #3: 'GENDER'
| nPatients | FEMALE | MALE |
|---|---|---|
| ALL | 125 | 98 |
| subtype1 | 52 | 45 |
| subtype2 | 26 | 24 |
| subtype3 | 47 | 29 |
Figure S30. Get High-res Image Clustering Approach #3: 'CN CNMF' versus Clinical Feature #3: 'GENDER'
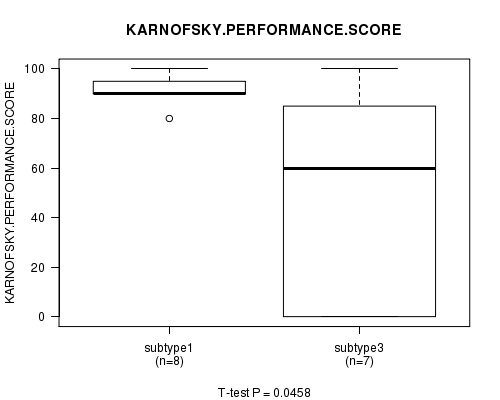
P value = 0.0458 (ANOVA)
Table S34. Clustering Approach #3: 'CN CNMF' versus Clinical Feature #4: 'KARNOFSKY.PERFORMANCE.SCORE'
| nPatients | Mean (Std.Dev) | |
|---|---|---|
| ALL | 17 | 67.1 (39.8) |
| subtype1 | 8 | 91.2 (6.4) |
| subtype2 | 2 | 40.0 (56.6) |
| subtype3 | 7 | 47.1 (46.4) |
Figure S31. Get High-res Image Clustering Approach #3: 'CN CNMF' versus Clinical Feature #4: 'KARNOFSKY.PERFORMANCE.SCORE'
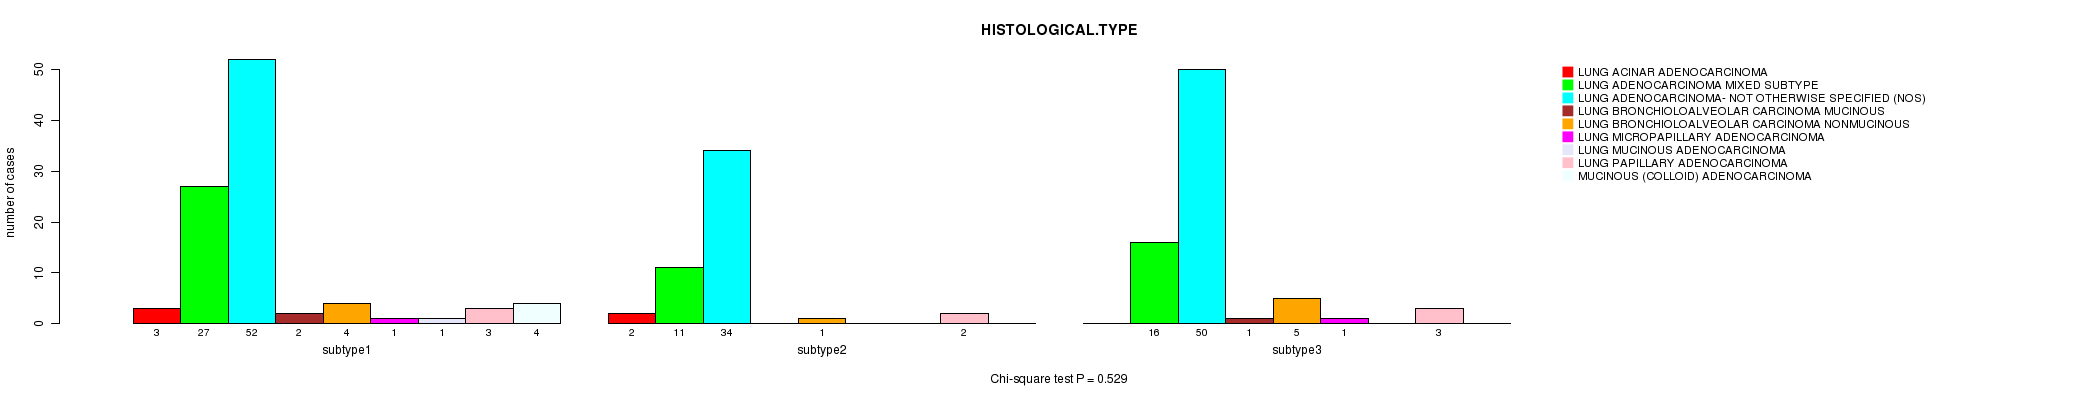
P value = 0.529 (Chi-square test)
Table S35. Clustering Approach #3: 'CN CNMF' versus Clinical Feature #5: 'HISTOLOGICAL.TYPE'
| nPatients | LUNG ACINAR ADENOCARCINOMA | LUNG ADENOCARCINOMA MIXED SUBTYPE | LUNG ADENOCARCINOMA- NOT OTHERWISE SPECIFIED (NOS) | LUNG BRONCHIOLOALVEOLAR CARCINOMA MUCINOUS | LUNG BRONCHIOLOALVEOLAR CARCINOMA NONMUCINOUS | LUNG MICROPAPILLARY ADENOCARCINOMA | LUNG MUCINOUS ADENOCARCINOMA | LUNG PAPILLARY ADENOCARCINOMA | MUCINOUS (COLLOID) ADENOCARCINOMA |
|---|---|---|---|---|---|---|---|---|---|
| ALL | 5 | 54 | 136 | 3 | 10 | 2 | 1 | 8 | 4 |
| subtype1 | 3 | 27 | 52 | 2 | 4 | 1 | 1 | 3 | 4 |
| subtype2 | 2 | 11 | 34 | 0 | 1 | 0 | 0 | 2 | 0 |
| subtype3 | 0 | 16 | 50 | 1 | 5 | 1 | 0 | 3 | 0 |
Figure S32. Get High-res Image Clustering Approach #3: 'CN CNMF' versus Clinical Feature #5: 'HISTOLOGICAL.TYPE'
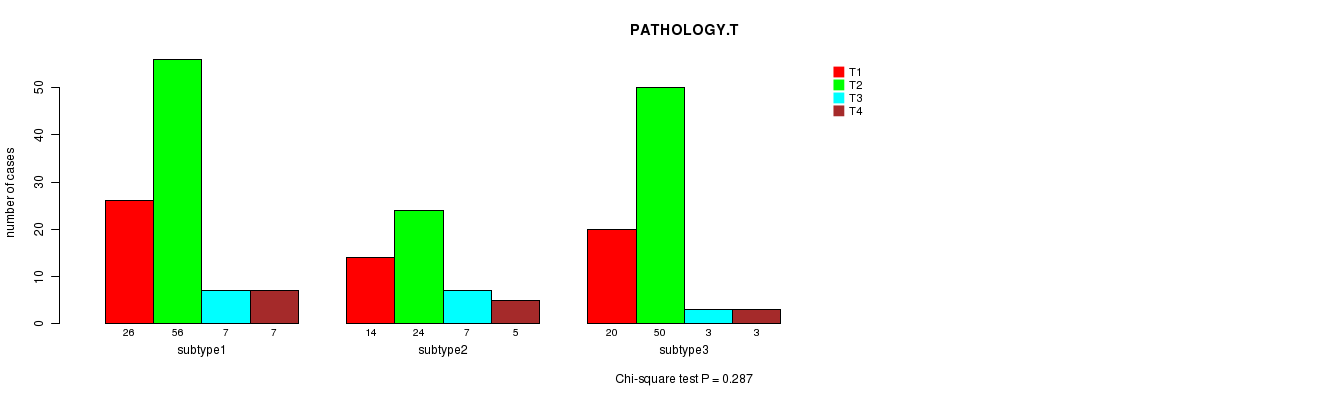
P value = 0.287 (Chi-square test)
Table S36. Clustering Approach #3: 'CN CNMF' versus Clinical Feature #6: 'PATHOLOGY.T'
| nPatients | T1 | T2 | T3 | T4 |
|---|---|---|---|---|
| ALL | 60 | 130 | 17 | 15 |
| subtype1 | 26 | 56 | 7 | 7 |
| subtype2 | 14 | 24 | 7 | 5 |
| subtype3 | 20 | 50 | 3 | 3 |
Figure S33. Get High-res Image Clustering Approach #3: 'CN CNMF' versus Clinical Feature #6: 'PATHOLOGY.T'
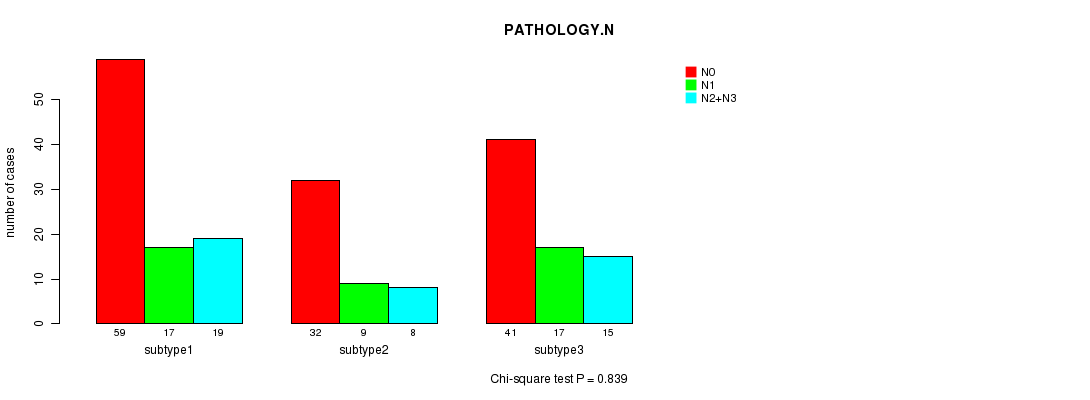
P value = 0.839 (Chi-square test)
Table S37. Clustering Approach #3: 'CN CNMF' versus Clinical Feature #7: 'PATHOLOGY.N'
| nPatients | N0 | N1 | N2+N3 |
|---|---|---|---|
| ALL | 132 | 43 | 42 |
| subtype1 | 59 | 17 | 19 |
| subtype2 | 32 | 9 | 8 |
| subtype3 | 41 | 17 | 15 |
Figure S34. Get High-res Image Clustering Approach #3: 'CN CNMF' versus Clinical Feature #7: 'PATHOLOGY.N'
P value = 0.986 (Chi-square test)
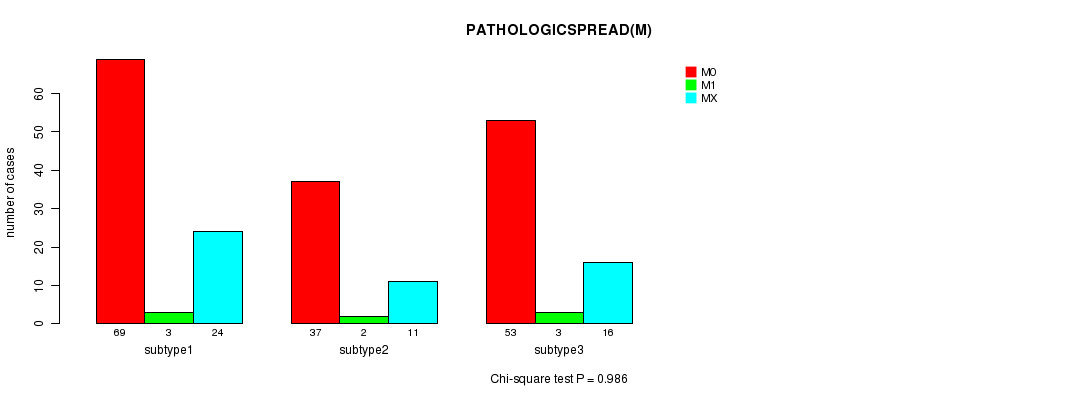
Table S38. Clustering Approach #3: 'CN CNMF' versus Clinical Feature #8: 'PATHOLOGICSPREAD(M)'
| nPatients | M0 | M1 | MX |
|---|---|---|---|
| ALL | 159 | 8 | 51 |
| subtype1 | 69 | 3 | 24 |
| subtype2 | 37 | 2 | 11 |
| subtype3 | 53 | 3 | 16 |
Figure S35. Get High-res Image Clustering Approach #3: 'CN CNMF' versus Clinical Feature #8: 'PATHOLOGICSPREAD(M)'
P value = 0.728 (Chi-square test)
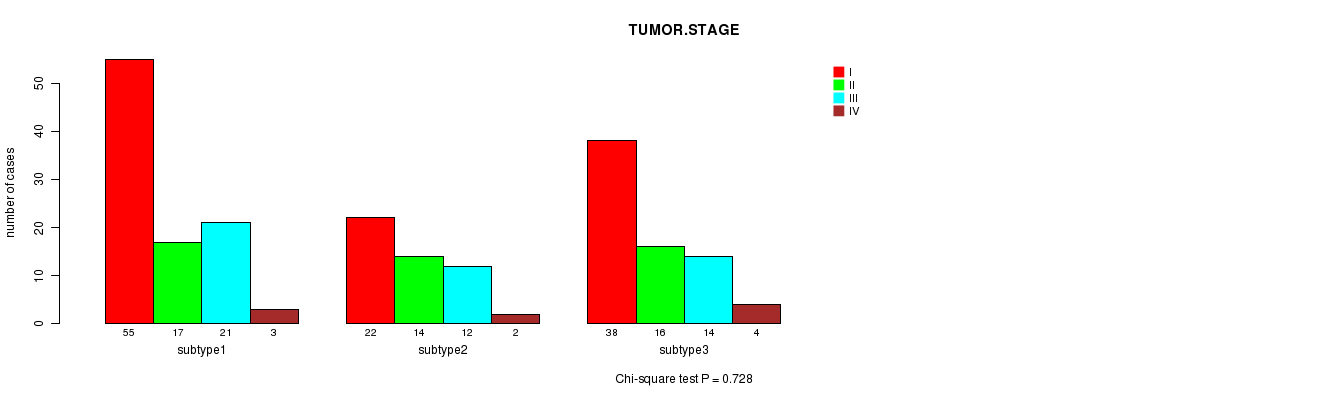
Table S39. Clustering Approach #3: 'CN CNMF' versus Clinical Feature #9: 'TUMOR.STAGE'
| nPatients | I | II | III | IV |
|---|---|---|---|---|
| ALL | 115 | 47 | 47 | 9 |
| subtype1 | 55 | 17 | 21 | 3 |
| subtype2 | 22 | 14 | 12 | 2 |
| subtype3 | 38 | 16 | 14 | 4 |
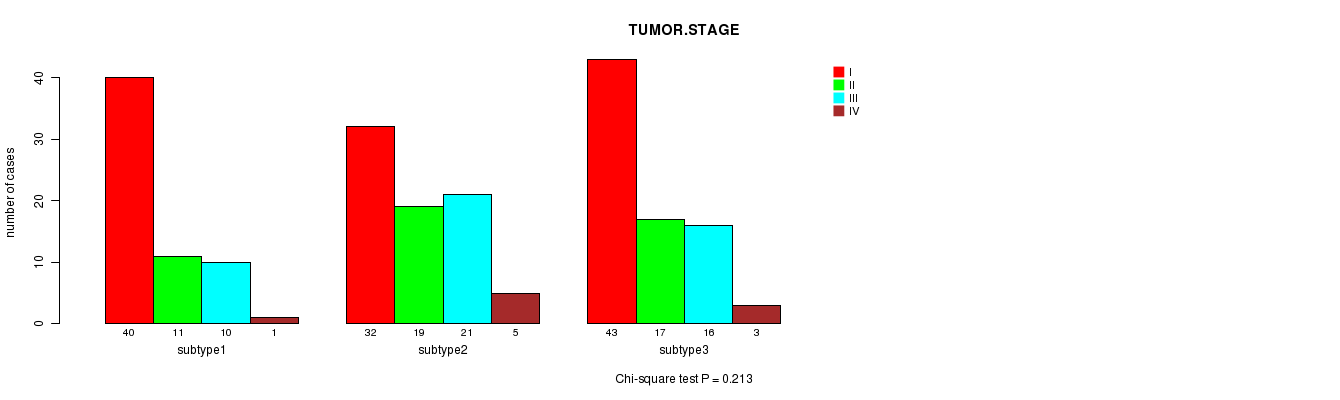
Figure S36. Get High-res Image Clustering Approach #3: 'CN CNMF' versus Clinical Feature #9: 'TUMOR.STAGE'
P value = 0.656 (Fisher's exact test)
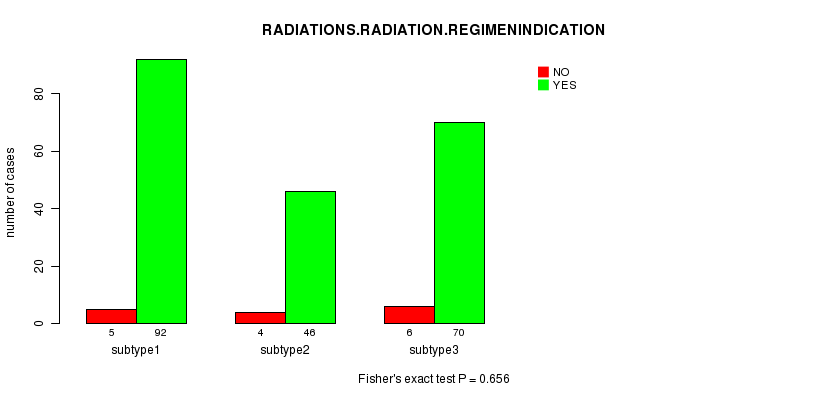
Table S40. Clustering Approach #3: 'CN CNMF' versus Clinical Feature #10: 'RADIATIONS.RADIATION.REGIMENINDICATION'
| nPatients | NO | YES |
|---|---|---|
| ALL | 15 | 208 |
| subtype1 | 5 | 92 |
| subtype2 | 4 | 46 |
| subtype3 | 6 | 70 |
Figure S37. Get High-res Image Clustering Approach #3: 'CN CNMF' versus Clinical Feature #10: 'RADIATIONS.RADIATION.REGIMENINDICATION'
P value = 0.337 (Fisher's exact test)
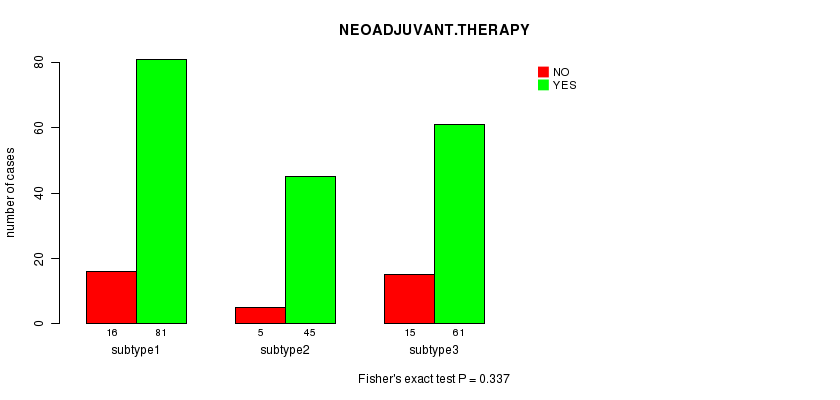
Table S41. Clustering Approach #3: 'CN CNMF' versus Clinical Feature #11: 'NEOADJUVANT.THERAPY'
| nPatients | NO | YES |
|---|---|---|
| ALL | 36 | 187 |
| subtype1 | 16 | 81 |
| subtype2 | 5 | 45 |
| subtype3 | 15 | 61 |
Figure S38. Get High-res Image Clustering Approach #3: 'CN CNMF' versus Clinical Feature #11: 'NEOADJUVANT.THERAPY'
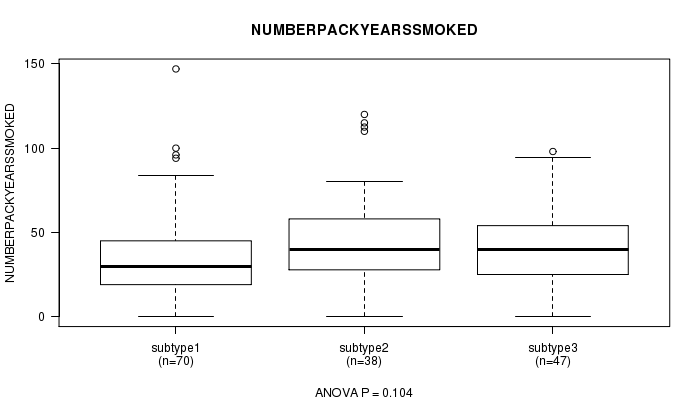
P value = 0.104 (ANOVA)
Table S42. Clustering Approach #3: 'CN CNMF' versus Clinical Feature #12: 'NUMBERPACKYEARSSMOKED'
| nPatients | Mean (Std.Dev) | |
|---|---|---|
| ALL | 155 | 40.0 (26.7) |
| subtype1 | 70 | 35.7 (26.7) |
| subtype2 | 38 | 47.1 (29.8) |
| subtype3 | 47 | 40.8 (22.9) |
Figure S39. Get High-res Image Clustering Approach #3: 'CN CNMF' versus Clinical Feature #12: 'NUMBERPACKYEARSSMOKED'
P value = 0.0386 (ANOVA)
Table S43. Clustering Approach #3: 'CN CNMF' versus Clinical Feature #13: 'STOPPEDSMOKINGYEAR'
| nPatients | Mean (Std.Dev) | |
|---|---|---|
| ALL | 110 | 1991.8 (14.2) |
| subtype1 | 52 | 1988.9 (14.9) |
| subtype2 | 22 | 1998.0 (9.0) |
| subtype3 | 36 | 1992.0 (14.8) |
Figure S40. Get High-res Image Clustering Approach #3: 'CN CNMF' versus Clinical Feature #13: 'STOPPEDSMOKINGYEAR'
P value = 0.0144 (Chi-square test)
Table S44. Clustering Approach #3: 'CN CNMF' versus Clinical Feature #14: 'TOBACCOSMOKINGHISTORYINDICATOR'
| nPatients | CURRENT REFORMED SMOKER FOR < OR = 15 YEARS | CURRENT REFORMED SMOKER FOR > 15 YEARS | CURRENT SMOKER | LIFELONG NON-SMOKER |
|---|---|---|---|---|
| ALL | 69 | 67 | 45 | 32 |
| subtype1 | 28 | 38 | 13 | 14 |
| subtype2 | 17 | 8 | 17 | 4 |
| subtype3 | 24 | 21 | 15 | 14 |
Figure S41. Get High-res Image Clustering Approach #3: 'CN CNMF' versus Clinical Feature #14: 'TOBACCOSMOKINGHISTORYINDICATOR'

P value = 0.952 (ANOVA)
Table S45. Clustering Approach #3: 'CN CNMF' versus Clinical Feature #15: 'YEAROFTOBACCOSMOKINGONSET'
| nPatients | Mean (Std.Dev) | |
|---|---|---|
| ALL | 105 | 1962.0 (12.8) |
| subtype1 | 47 | 1961.6 (14.3) |
| subtype2 | 27 | 1962.3 (10.9) |
| subtype3 | 31 | 1962.4 (12.2) |
Figure S42. Get High-res Image Clustering Approach #3: 'CN CNMF' versus Clinical Feature #15: 'YEAROFTOBACCOSMOKINGONSET'
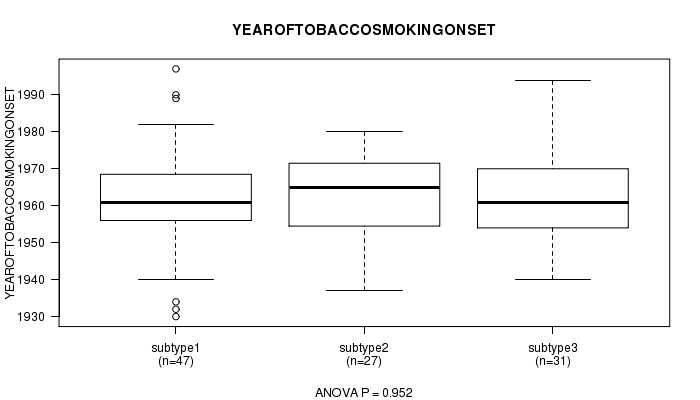
Table S46. Get Full Table Description of clustering approach #4: 'METHLYATION CNMF'
| Cluster Labels | 1 | 2 | 3 | 4 |
|---|---|---|---|---|
| Number of samples | 41 | 45 | 45 | 43 |
P value = 0.011 (logrank test)
Table S47. Clustering Approach #4: 'METHLYATION CNMF' versus Clinical Feature #1: 'Time to Death'
| nPatients | nDeath | Duration Range (Median), Month | |
|---|---|---|---|
| ALL | 150 | 47 | 0.0 - 224.0 (11.9) |
| subtype1 | 36 | 7 | 0.1 - 224.0 (9.8) |
| subtype2 | 38 | 19 | 0.1 - 88.1 (17.5) |
| subtype3 | 40 | 10 | 0.0 - 77.9 (5.9) |
| subtype4 | 36 | 11 | 0.8 - 55.4 (12.8) |
Figure S43. Get High-res Image Clustering Approach #4: 'METHLYATION CNMF' versus Clinical Feature #1: 'Time to Death'
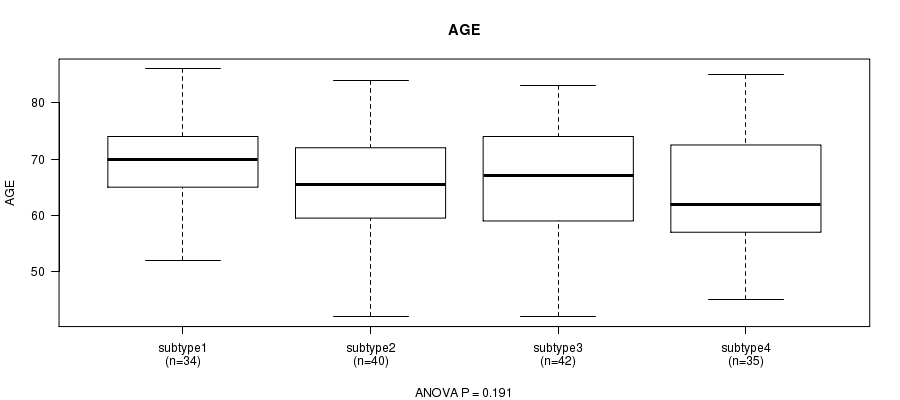
P value = 0.191 (ANOVA)
Table S48. Clustering Approach #4: 'METHLYATION CNMF' versus Clinical Feature #2: 'AGE'
| nPatients | Mean (Std.Dev) | |
|---|---|---|
| ALL | 151 | 66.1 (9.8) |
| subtype1 | 34 | 69.2 (6.9) |
| subtype2 | 40 | 65.3 (9.5) |
| subtype3 | 42 | 65.8 (10.6) |
| subtype4 | 35 | 64.4 (11.2) |
Figure S44. Get High-res Image Clustering Approach #4: 'METHLYATION CNMF' versus Clinical Feature #2: 'AGE'
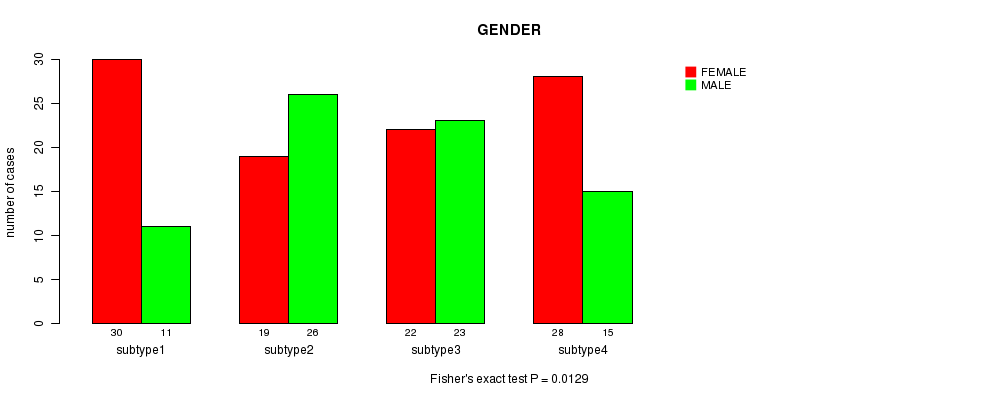
P value = 0.0129 (Fisher's exact test)
Table S49. Clustering Approach #4: 'METHLYATION CNMF' versus Clinical Feature #3: 'GENDER'
| nPatients | FEMALE | MALE |
|---|---|---|
| ALL | 99 | 75 |
| subtype1 | 30 | 11 |
| subtype2 | 19 | 26 |
| subtype3 | 22 | 23 |
| subtype4 | 28 | 15 |
Figure S45. Get High-res Image Clustering Approach #4: 'METHLYATION CNMF' versus Clinical Feature #3: 'GENDER'
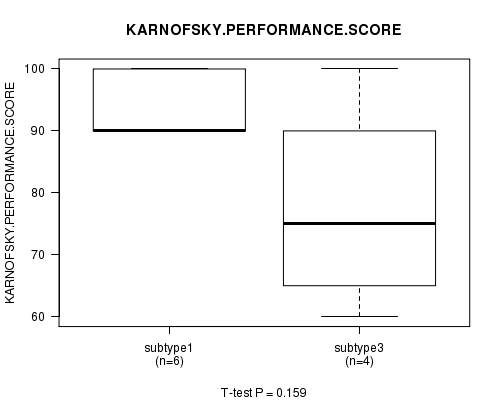
P value = 0.159 (ANOVA)
Table S50. Clustering Approach #4: 'METHLYATION CNMF' versus Clinical Feature #4: 'KARNOFSKY.PERFORMANCE.SCORE'
| nPatients | Mean (Std.Dev) | |
|---|---|---|
| ALL | 14 | 67.9 (38.5) |
| subtype1 | 6 | 93.3 (5.2) |
| subtype2 | 2 | 40.0 (56.6) |
| subtype3 | 4 | 77.5 (17.1) |
| subtype4 | 2 | 0.0 (0.0) |
Figure S46. Get High-res Image Clustering Approach #4: 'METHLYATION CNMF' versus Clinical Feature #4: 'KARNOFSKY.PERFORMANCE.SCORE'
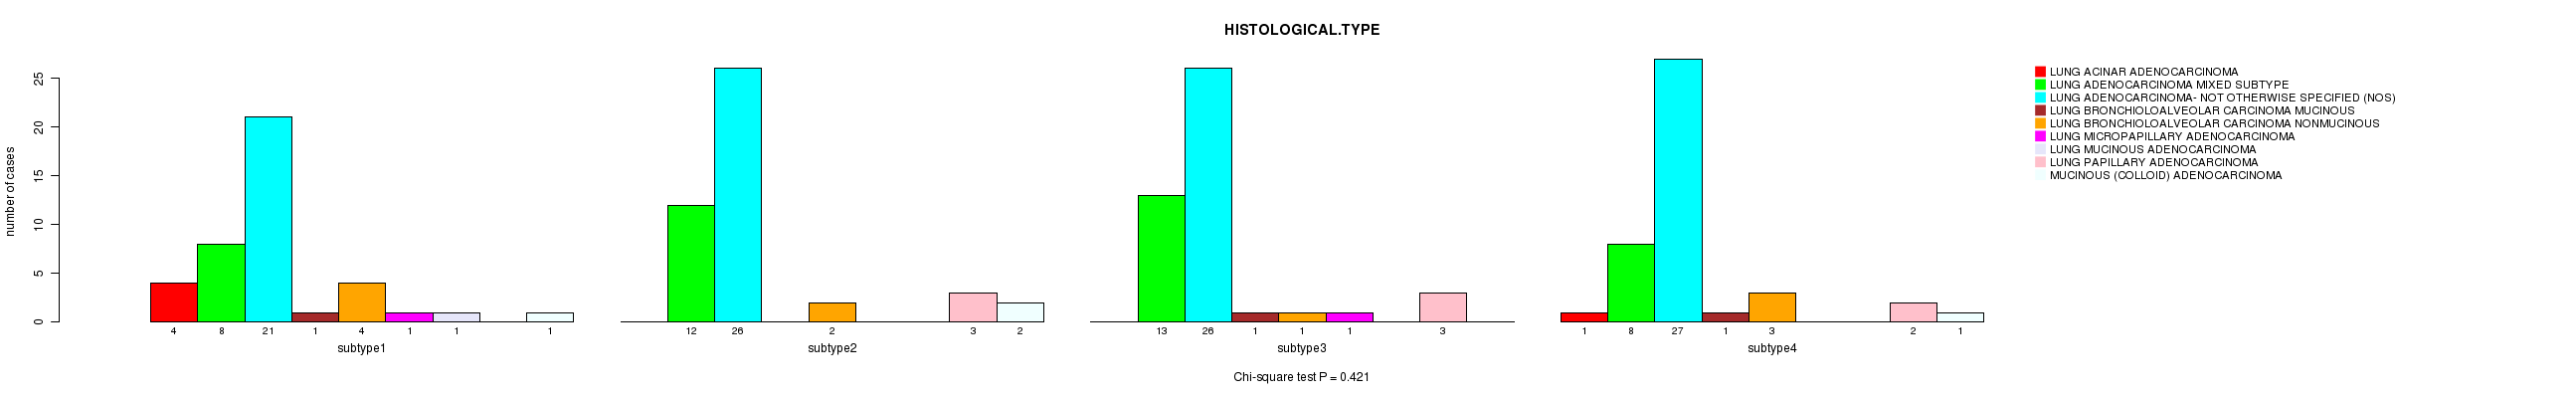
P value = 0.421 (Chi-square test)
Table S51. Clustering Approach #4: 'METHLYATION CNMF' versus Clinical Feature #5: 'HISTOLOGICAL.TYPE'
| nPatients | LUNG ACINAR ADENOCARCINOMA | LUNG ADENOCARCINOMA MIXED SUBTYPE | LUNG ADENOCARCINOMA- NOT OTHERWISE SPECIFIED (NOS) | LUNG BRONCHIOLOALVEOLAR CARCINOMA MUCINOUS | LUNG BRONCHIOLOALVEOLAR CARCINOMA NONMUCINOUS | LUNG MICROPAPILLARY ADENOCARCINOMA | LUNG MUCINOUS ADENOCARCINOMA | LUNG PAPILLARY ADENOCARCINOMA | MUCINOUS (COLLOID) ADENOCARCINOMA |
|---|---|---|---|---|---|---|---|---|---|
| ALL | 5 | 41 | 100 | 3 | 10 | 2 | 1 | 8 | 4 |
| subtype1 | 4 | 8 | 21 | 1 | 4 | 1 | 1 | 0 | 1 |
| subtype2 | 0 | 12 | 26 | 0 | 2 | 0 | 0 | 3 | 2 |
| subtype3 | 0 | 13 | 26 | 1 | 1 | 1 | 0 | 3 | 0 |
| subtype4 | 1 | 8 | 27 | 1 | 3 | 0 | 0 | 2 | 1 |
Figure S47. Get High-res Image Clustering Approach #4: 'METHLYATION CNMF' versus Clinical Feature #5: 'HISTOLOGICAL.TYPE'
P value = 0.479 (Chi-square test)
Table S52. Clustering Approach #4: 'METHLYATION CNMF' versus Clinical Feature #6: 'PATHOLOGY.T'
| nPatients | T1 | T2 | T3 | T4 |
|---|---|---|---|---|
| ALL | 50 | 97 | 13 | 13 |
| subtype1 | 16 | 20 | 2 | 2 |
| subtype2 | 10 | 26 | 3 | 6 |
| subtype3 | 11 | 27 | 3 | 4 |
| subtype4 | 13 | 24 | 5 | 1 |
Figure S48. Get High-res Image Clustering Approach #4: 'METHLYATION CNMF' versus Clinical Feature #6: 'PATHOLOGY.T'

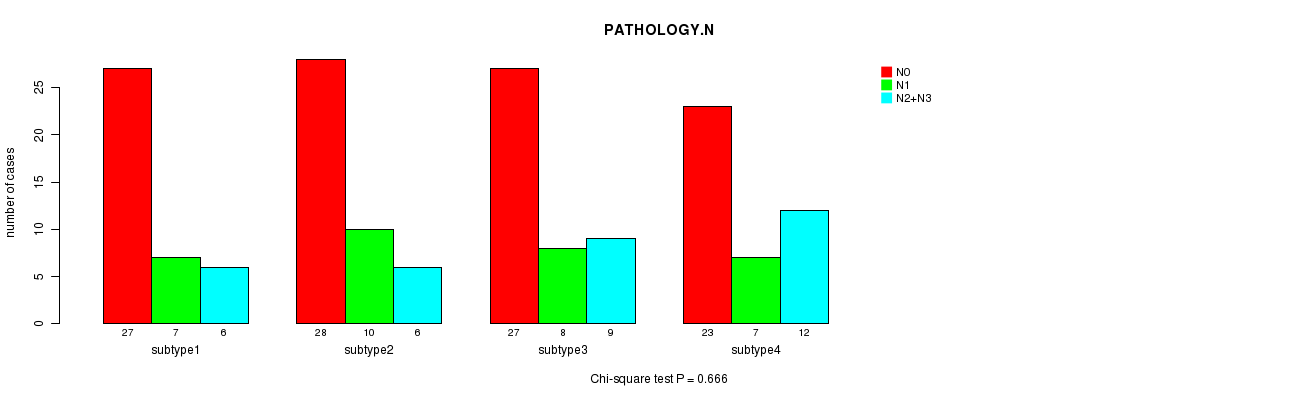
P value = 0.666 (Chi-square test)
Table S53. Clustering Approach #4: 'METHLYATION CNMF' versus Clinical Feature #7: 'PATHOLOGY.N'
| nPatients | N0 | N1 | N2+N3 |
|---|---|---|---|
| ALL | 105 | 32 | 33 |
| subtype1 | 27 | 7 | 6 |
| subtype2 | 28 | 10 | 6 |
| subtype3 | 27 | 8 | 9 |
| subtype4 | 23 | 7 | 12 |
Figure S49. Get High-res Image Clustering Approach #4: 'METHLYATION CNMF' versus Clinical Feature #7: 'PATHOLOGY.N'
P value = 0.475 (Chi-square test)
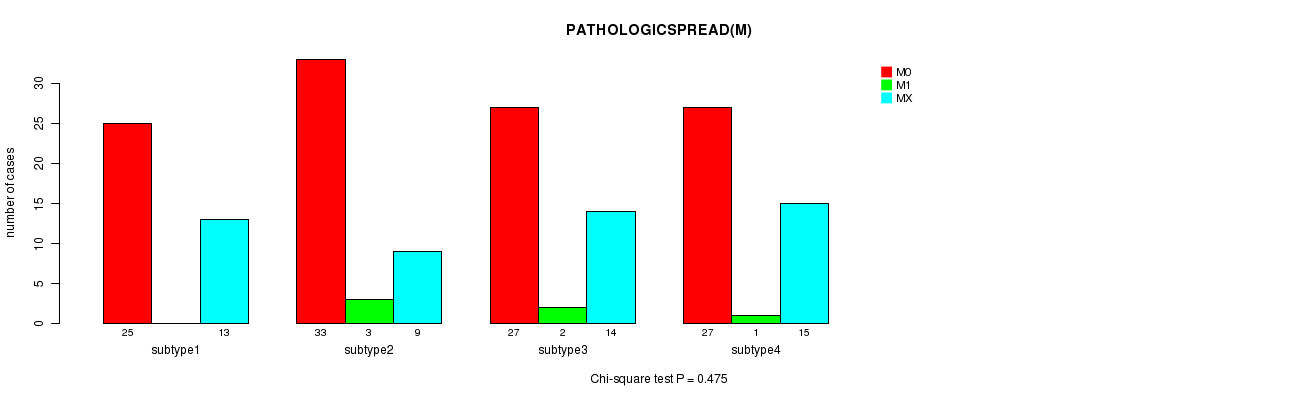
Table S54. Clustering Approach #4: 'METHLYATION CNMF' versus Clinical Feature #8: 'PATHOLOGICSPREAD(M)'
| nPatients | M0 | M1 | MX |
|---|---|---|---|
| ALL | 112 | 6 | 51 |
| subtype1 | 25 | 0 | 13 |
| subtype2 | 33 | 3 | 9 |
| subtype3 | 27 | 2 | 14 |
| subtype4 | 27 | 1 | 15 |
Figure S50. Get High-res Image Clustering Approach #4: 'METHLYATION CNMF' versus Clinical Feature #8: 'PATHOLOGICSPREAD(M)'
P value = 0.865 (Chi-square test)
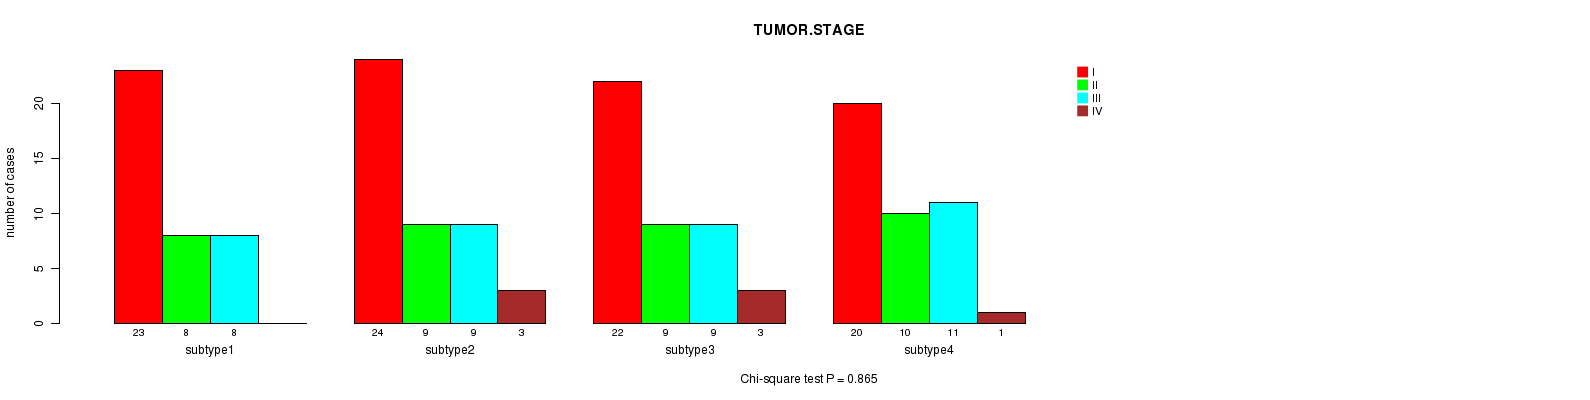
Table S55. Clustering Approach #4: 'METHLYATION CNMF' versus Clinical Feature #9: 'TUMOR.STAGE'
| nPatients | I | II | III | IV |
|---|---|---|---|---|
| ALL | 89 | 36 | 37 | 7 |
| subtype1 | 23 | 8 | 8 | 0 |
| subtype2 | 24 | 9 | 9 | 3 |
| subtype3 | 22 | 9 | 9 | 3 |
| subtype4 | 20 | 10 | 11 | 1 |
Figure S51. Get High-res Image Clustering Approach #4: 'METHLYATION CNMF' versus Clinical Feature #9: 'TUMOR.STAGE'
P value = 0.606 (Fisher's exact test)
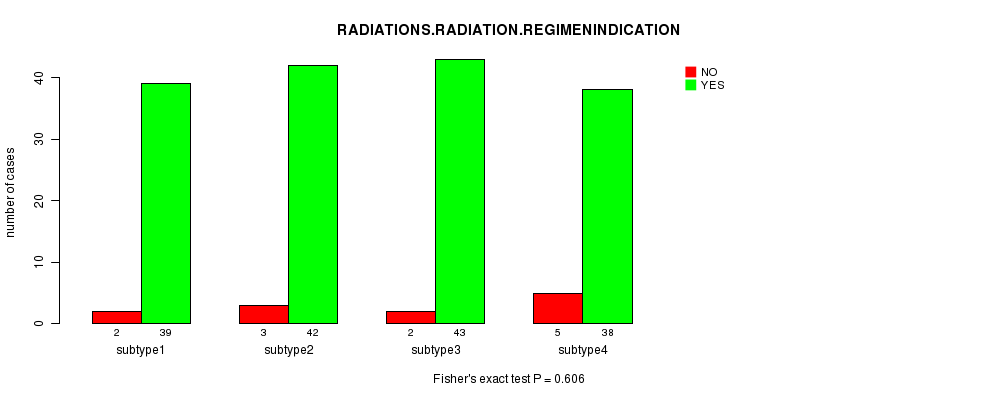
Table S56. Clustering Approach #4: 'METHLYATION CNMF' versus Clinical Feature #10: 'RADIATIONS.RADIATION.REGIMENINDICATION'
| nPatients | NO | YES |
|---|---|---|
| ALL | 12 | 162 |
| subtype1 | 2 | 39 |
| subtype2 | 3 | 42 |
| subtype3 | 2 | 43 |
| subtype4 | 5 | 38 |
Figure S52. Get High-res Image Clustering Approach #4: 'METHLYATION CNMF' versus Clinical Feature #10: 'RADIATIONS.RADIATION.REGIMENINDICATION'
P value = 0.504 (Fisher's exact test)
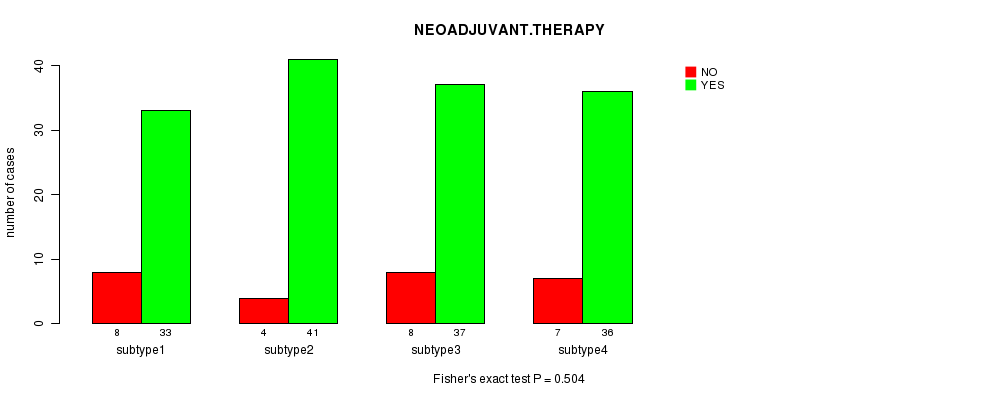
Table S57. Clustering Approach #4: 'METHLYATION CNMF' versus Clinical Feature #11: 'NEOADJUVANT.THERAPY'
| nPatients | NO | YES |
|---|---|---|
| ALL | 27 | 147 |
| subtype1 | 8 | 33 |
| subtype2 | 4 | 41 |
| subtype3 | 8 | 37 |
| subtype4 | 7 | 36 |
Figure S53. Get High-res Image Clustering Approach #4: 'METHLYATION CNMF' versus Clinical Feature #11: 'NEOADJUVANT.THERAPY'
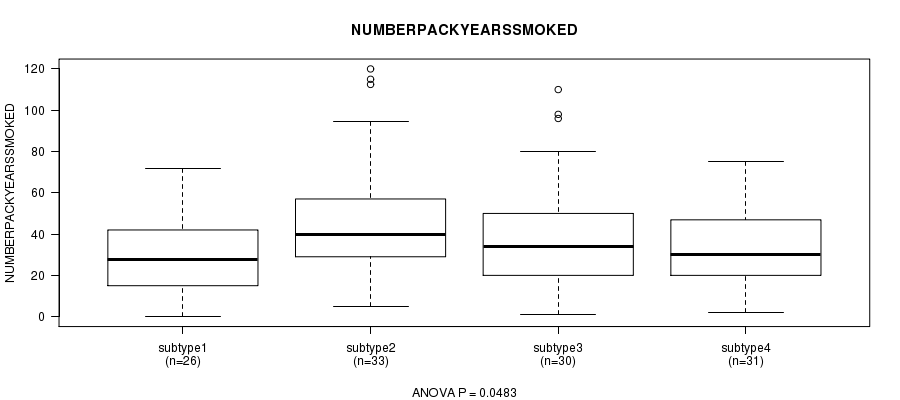
P value = 0.0483 (ANOVA)
Table S58. Clustering Approach #4: 'METHLYATION CNMF' versus Clinical Feature #12: 'NUMBERPACKYEARSSMOKED'
| nPatients | Mean (Std.Dev) | |
|---|---|---|
| ALL | 120 | 38.3 (25.8) |
| subtype1 | 26 | 30.3 (18.7) |
| subtype2 | 33 | 48.0 (30.6) |
| subtype3 | 30 | 38.4 (28.9) |
| subtype4 | 31 | 34.7 (19.1) |
Figure S54. Get High-res Image Clustering Approach #4: 'METHLYATION CNMF' versus Clinical Feature #12: 'NUMBERPACKYEARSSMOKED'
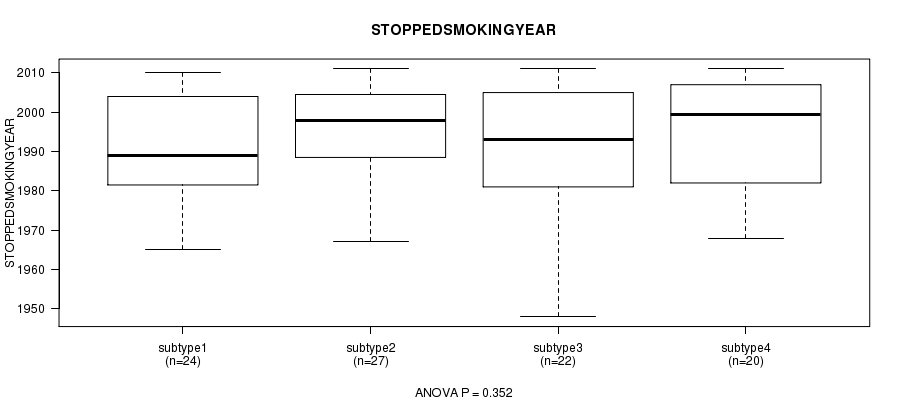
P value = 0.352 (ANOVA)
Table S59. Clustering Approach #4: 'METHLYATION CNMF' versus Clinical Feature #13: 'STOPPEDSMOKINGYEAR'
| nPatients | Mean (Std.Dev) | |
|---|---|---|
| ALL | 93 | 1992.5 (14.0) |
| subtype1 | 24 | 1990.2 (13.2) |
| subtype2 | 27 | 1995.3 (11.5) |
| subtype3 | 22 | 1989.4 (17.1) |
| subtype4 | 20 | 1994.8 (14.0) |
Figure S55. Get High-res Image Clustering Approach #4: 'METHLYATION CNMF' versus Clinical Feature #13: 'STOPPEDSMOKINGYEAR'
P value = 0.169 (Chi-square test)
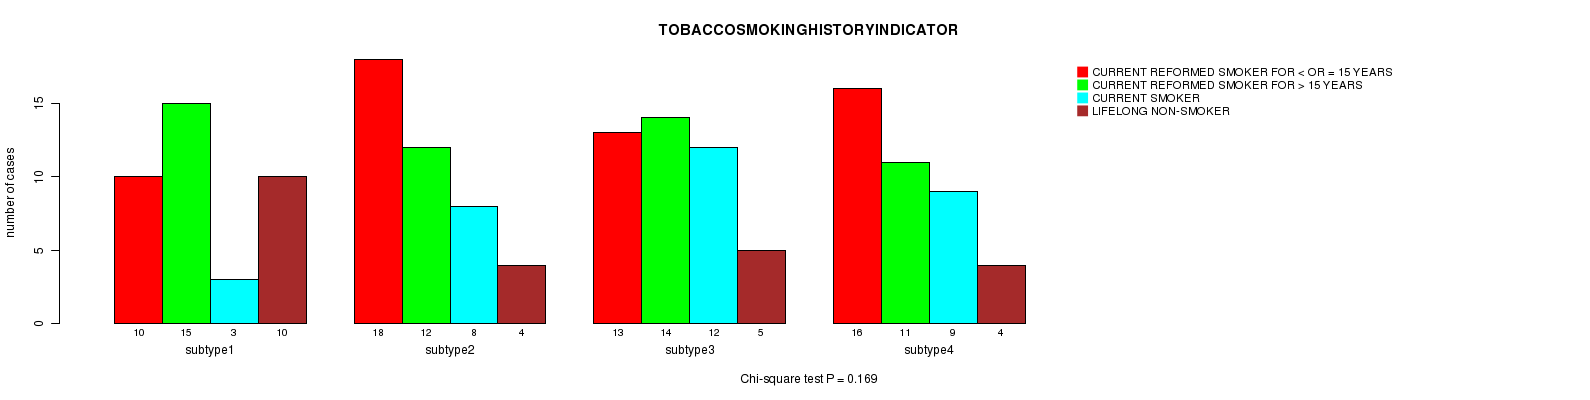
Table S60. Clustering Approach #4: 'METHLYATION CNMF' versus Clinical Feature #14: 'TOBACCOSMOKINGHISTORYINDICATOR'
| nPatients | CURRENT REFORMED SMOKER FOR < OR = 15 YEARS | CURRENT REFORMED SMOKER FOR > 15 YEARS | CURRENT SMOKER | LIFELONG NON-SMOKER |
|---|---|---|---|---|
| ALL | 57 | 52 | 32 | 23 |
| subtype1 | 10 | 15 | 3 | 10 |
| subtype2 | 18 | 12 | 8 | 4 |
| subtype3 | 13 | 14 | 12 | 5 |
| subtype4 | 16 | 11 | 9 | 4 |
Figure S56. Get High-res Image Clustering Approach #4: 'METHLYATION CNMF' versus Clinical Feature #14: 'TOBACCOSMOKINGHISTORYINDICATOR'
P value = 0.299 (ANOVA)
Table S61. Clustering Approach #4: 'METHLYATION CNMF' versus Clinical Feature #15: 'YEAROFTOBACCOSMOKINGONSET'
| nPatients | Mean (Std.Dev) | |
|---|---|---|
| ALL | 84 | 1962.0 (12.4) |
| subtype1 | 17 | 1960.0 (11.2) |
| subtype2 | 26 | 1959.9 (14.3) |
| subtype3 | 23 | 1962.3 (12.1) |
| subtype4 | 18 | 1966.6 (10.2) |
Figure S57. Get High-res Image Clustering Approach #4: 'METHLYATION CNMF' versus Clinical Feature #15: 'YEAROFTOBACCOSMOKINGONSET'
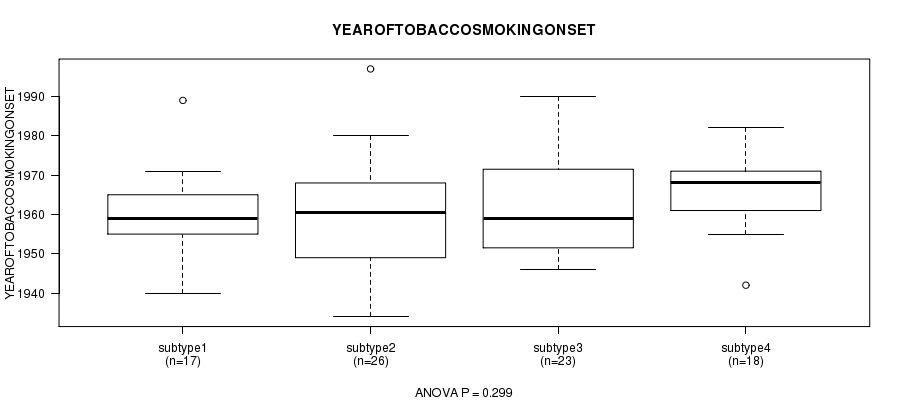
Table S62. Get Full Table Description of clustering approach #5: 'RNAseq CNMF subtypes'
| Cluster Labels | 1 | 2 | 3 |
|---|---|---|---|
| Number of samples | 65 | 79 | 79 |
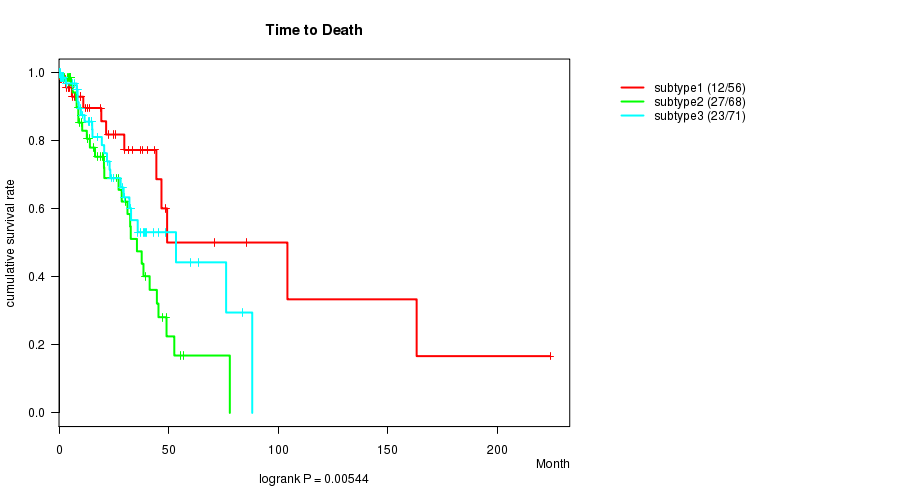
P value = 0.00544 (logrank test)
Table S63. Clustering Approach #5: 'RNAseq CNMF subtypes' versus Clinical Feature #1: 'Time to Death'
| nPatients | nDeath | Duration Range (Median), Month | |
|---|---|---|---|
| ALL | 195 | 62 | 0.0 - 224.0 (13.9) |
| subtype1 | 56 | 12 | 0.1 - 224.0 (10.4) |
| subtype2 | 68 | 27 | 0.0 - 77.9 (12.8) |
| subtype3 | 71 | 23 | 0.1 - 88.1 (17.5) |
Figure S58. Get High-res Image Clustering Approach #5: 'RNAseq CNMF subtypes' versus Clinical Feature #1: 'Time to Death'
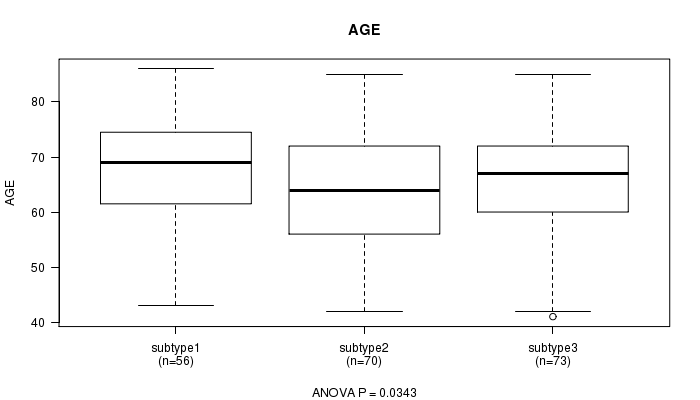
P value = 0.0343 (ANOVA)
Table S64. Clustering Approach #5: 'RNAseq CNMF subtypes' versus Clinical Feature #2: 'AGE'
| nPatients | Mean (Std.Dev) | |
|---|---|---|
| ALL | 199 | 65.9 (9.7) |
| subtype1 | 56 | 68.0 (8.6) |
| subtype2 | 70 | 63.7 (10.5) |
| subtype3 | 73 | 66.5 (9.2) |
Figure S59. Get High-res Image Clustering Approach #5: 'RNAseq CNMF subtypes' versus Clinical Feature #2: 'AGE'
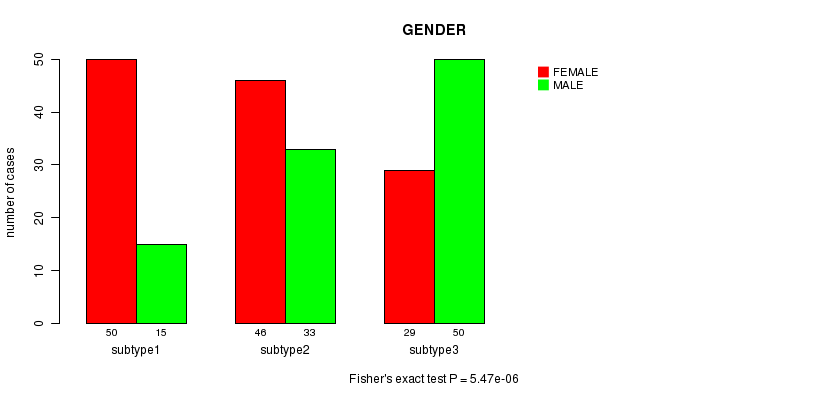
P value = 5.47e-06 (Fisher's exact test)
Table S65. Clustering Approach #5: 'RNAseq CNMF subtypes' versus Clinical Feature #3: 'GENDER'
| nPatients | FEMALE | MALE |
|---|---|---|
| ALL | 125 | 98 |
| subtype1 | 50 | 15 |
| subtype2 | 46 | 33 |
| subtype3 | 29 | 50 |
Figure S60. Get High-res Image Clustering Approach #5: 'RNAseq CNMF subtypes' versus Clinical Feature #3: 'GENDER'
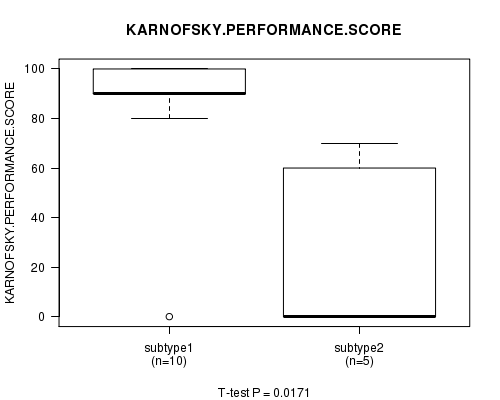
P value = 0.0171 (ANOVA)
Table S66. Clustering Approach #5: 'RNAseq CNMF subtypes' versus Clinical Feature #4: 'KARNOFSKY.PERFORMANCE.SCORE'
| nPatients | Mean (Std.Dev) | |
|---|---|---|
| ALL | 17 | 67.1 (39.8) |
| subtype1 | 10 | 84.0 (30.3) |
| subtype2 | 5 | 26.0 (35.8) |
| subtype3 | 2 | 85.0 (7.1) |
Figure S61. Get High-res Image Clustering Approach #5: 'RNAseq CNMF subtypes' versus Clinical Feature #4: 'KARNOFSKY.PERFORMANCE.SCORE'
P value = 0.00697 (Chi-square test)
Table S67. Clustering Approach #5: 'RNAseq CNMF subtypes' versus Clinical Feature #5: 'HISTOLOGICAL.TYPE'
| nPatients | LUNG ACINAR ADENOCARCINOMA | LUNG ADENOCARCINOMA MIXED SUBTYPE | LUNG ADENOCARCINOMA- NOT OTHERWISE SPECIFIED (NOS) | LUNG BRONCHIOLOALVEOLAR CARCINOMA MUCINOUS | LUNG BRONCHIOLOALVEOLAR CARCINOMA NONMUCINOUS | LUNG MICROPAPILLARY ADENOCARCINOMA | LUNG MUCINOUS ADENOCARCINOMA | LUNG PAPILLARY ADENOCARCINOMA | MUCINOUS (COLLOID) ADENOCARCINOMA |
|---|---|---|---|---|---|---|---|---|---|
| ALL | 5 | 54 | 136 | 3 | 10 | 2 | 1 | 8 | 4 |
| subtype1 | 3 | 11 | 41 | 2 | 6 | 1 | 0 | 1 | 0 |
| subtype2 | 1 | 14 | 57 | 0 | 3 | 1 | 0 | 3 | 0 |
| subtype3 | 1 | 29 | 38 | 1 | 1 | 0 | 1 | 4 | 4 |
Figure S62. Get High-res Image Clustering Approach #5: 'RNAseq CNMF subtypes' versus Clinical Feature #5: 'HISTOLOGICAL.TYPE'

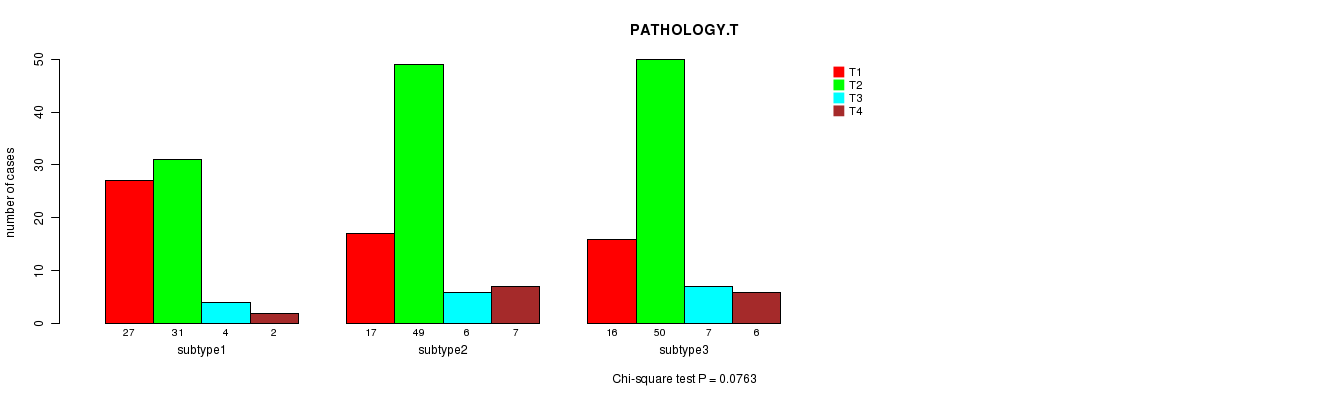
P value = 0.0763 (Chi-square test)
Table S68. Clustering Approach #5: 'RNAseq CNMF subtypes' versus Clinical Feature #6: 'PATHOLOGY.T'
| nPatients | T1 | T2 | T3 | T4 |
|---|---|---|---|---|
| ALL | 60 | 130 | 17 | 15 |
| subtype1 | 27 | 31 | 4 | 2 |
| subtype2 | 17 | 49 | 6 | 7 |
| subtype3 | 16 | 50 | 7 | 6 |
Figure S63. Get High-res Image Clustering Approach #5: 'RNAseq CNMF subtypes' versus Clinical Feature #6: 'PATHOLOGY.T'
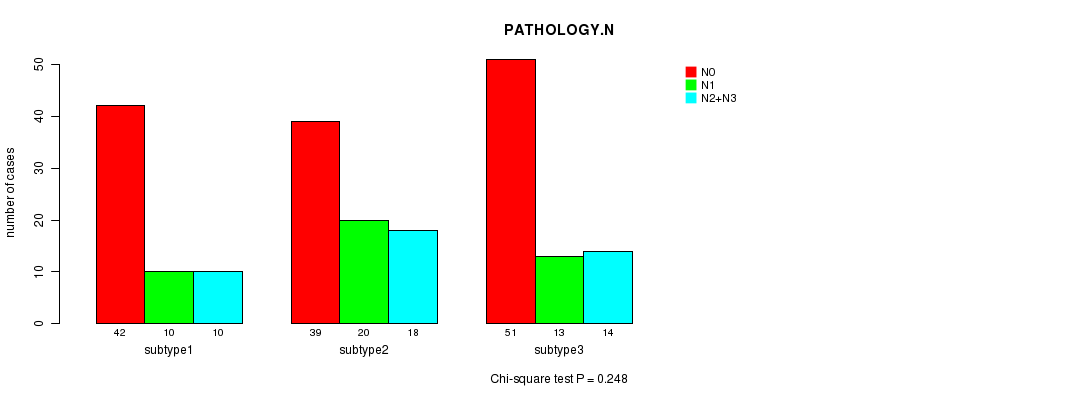
P value = 0.248 (Chi-square test)
Table S69. Clustering Approach #5: 'RNAseq CNMF subtypes' versus Clinical Feature #7: 'PATHOLOGY.N'
| nPatients | N0 | N1 | N2+N3 |
|---|---|---|---|
| ALL | 132 | 43 | 42 |
| subtype1 | 42 | 10 | 10 |
| subtype2 | 39 | 20 | 18 |
| subtype3 | 51 | 13 | 14 |
Figure S64. Get High-res Image Clustering Approach #5: 'RNAseq CNMF subtypes' versus Clinical Feature #7: 'PATHOLOGY.N'
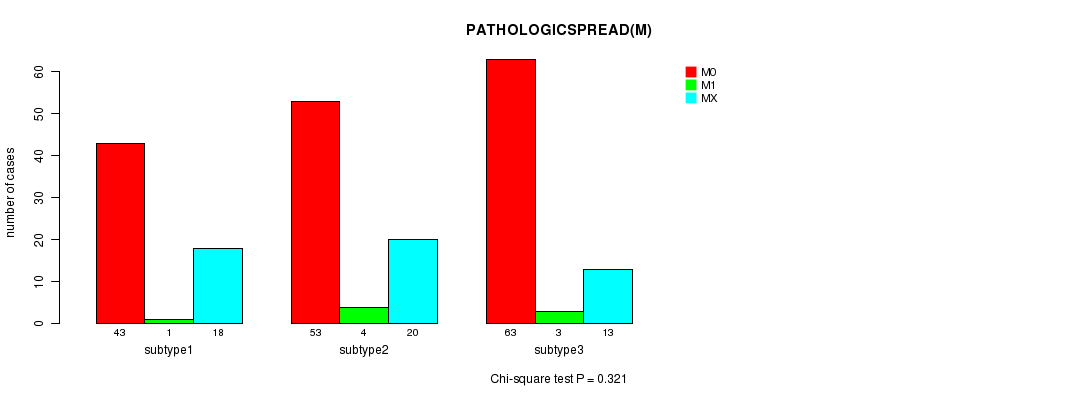
P value = 0.321 (Chi-square test)
Table S70. Clustering Approach #5: 'RNAseq CNMF subtypes' versus Clinical Feature #8: 'PATHOLOGICSPREAD(M)'
| nPatients | M0 | M1 | MX |
|---|---|---|---|
| ALL | 159 | 8 | 51 |
| subtype1 | 43 | 1 | 18 |
| subtype2 | 53 | 4 | 20 |
| subtype3 | 63 | 3 | 13 |
Figure S65. Get High-res Image Clustering Approach #5: 'RNAseq CNMF subtypes' versus Clinical Feature #8: 'PATHOLOGICSPREAD(M)'
P value = 0.213 (Chi-square test)
Table S71. Clustering Approach #5: 'RNAseq CNMF subtypes' versus Clinical Feature #9: 'TUMOR.STAGE'
| nPatients | I | II | III | IV |
|---|---|---|---|---|
| ALL | 115 | 47 | 47 | 9 |
| subtype1 | 40 | 11 | 10 | 1 |
| subtype2 | 32 | 19 | 21 | 5 |
| subtype3 | 43 | 17 | 16 | 3 |
Figure S66. Get High-res Image Clustering Approach #5: 'RNAseq CNMF subtypes' versus Clinical Feature #9: 'TUMOR.STAGE'
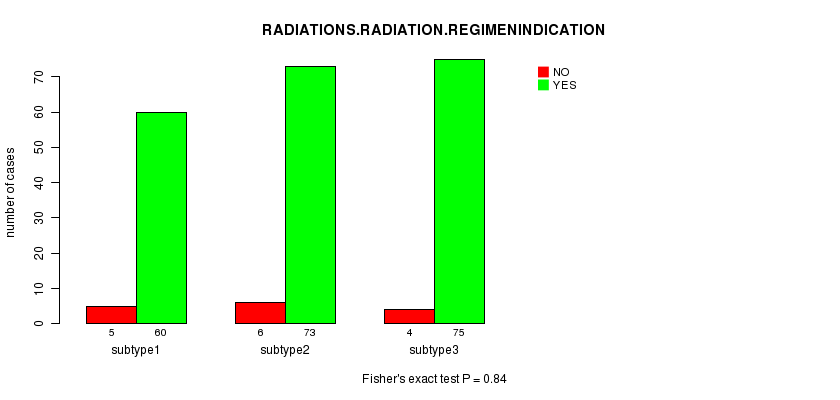
P value = 0.84 (Fisher's exact test)
Table S72. Clustering Approach #5: 'RNAseq CNMF subtypes' versus Clinical Feature #10: 'RADIATIONS.RADIATION.REGIMENINDICATION'
| nPatients | NO | YES |
|---|---|---|
| ALL | 15 | 208 |
| subtype1 | 5 | 60 |
| subtype2 | 6 | 73 |
| subtype3 | 4 | 75 |
Figure S67. Get High-res Image Clustering Approach #5: 'RNAseq CNMF subtypes' versus Clinical Feature #10: 'RADIATIONS.RADIATION.REGIMENINDICATION'
P value = 0.103 (Fisher's exact test)
Table S73. Clustering Approach #5: 'RNAseq CNMF subtypes' versus Clinical Feature #11: 'NEOADJUVANT.THERAPY'
| nPatients | NO | YES |
|---|---|---|
| ALL | 36 | 187 |
| subtype1 | 10 | 55 |
| subtype2 | 18 | 61 |
| subtype3 | 8 | 71 |
Figure S68. Get High-res Image Clustering Approach #5: 'RNAseq CNMF subtypes' versus Clinical Feature #11: 'NEOADJUVANT.THERAPY'

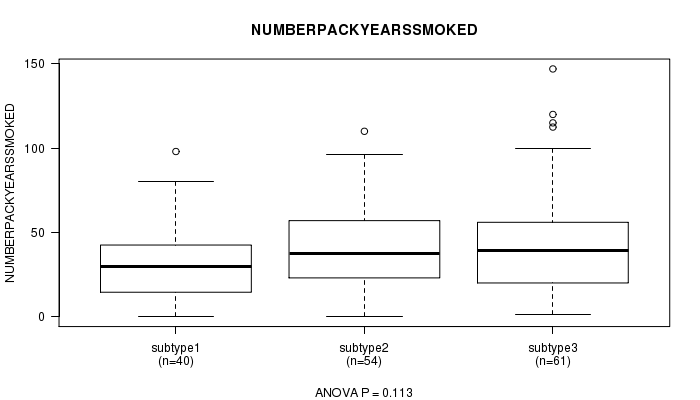
P value = 0.113 (ANOVA)
Table S74. Clustering Approach #5: 'RNAseq CNMF subtypes' versus Clinical Feature #12: 'NUMBERPACKYEARSSMOKED'
| nPatients | Mean (Std.Dev) | |
|---|---|---|
| ALL | 155 | 40.0 (26.7) |
| subtype1 | 40 | 32.6 (22.0) |
| subtype2 | 54 | 41.4 (24.7) |
| subtype3 | 61 | 43.7 (30.3) |
Figure S69. Get High-res Image Clustering Approach #5: 'RNAseq CNMF subtypes' versus Clinical Feature #12: 'NUMBERPACKYEARSSMOKED'
P value = 0.81 (ANOVA)
Table S75. Clustering Approach #5: 'RNAseq CNMF subtypes' versus Clinical Feature #13: 'STOPPEDSMOKINGYEAR'
| nPatients | Mean (Std.Dev) | |
|---|---|---|
| ALL | 110 | 1991.8 (14.2) |
| subtype1 | 35 | 1990.7 (14.4) |
| subtype2 | 31 | 1993.0 (14.7) |
| subtype3 | 44 | 1991.7 (13.8) |
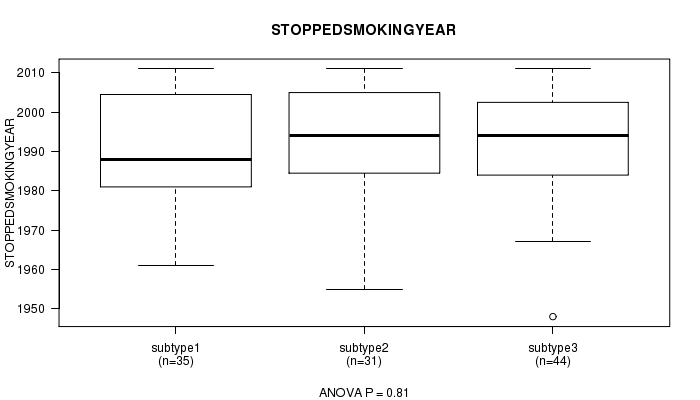
Figure S70. Get High-res Image Clustering Approach #5: 'RNAseq CNMF subtypes' versus Clinical Feature #13: 'STOPPEDSMOKINGYEAR'
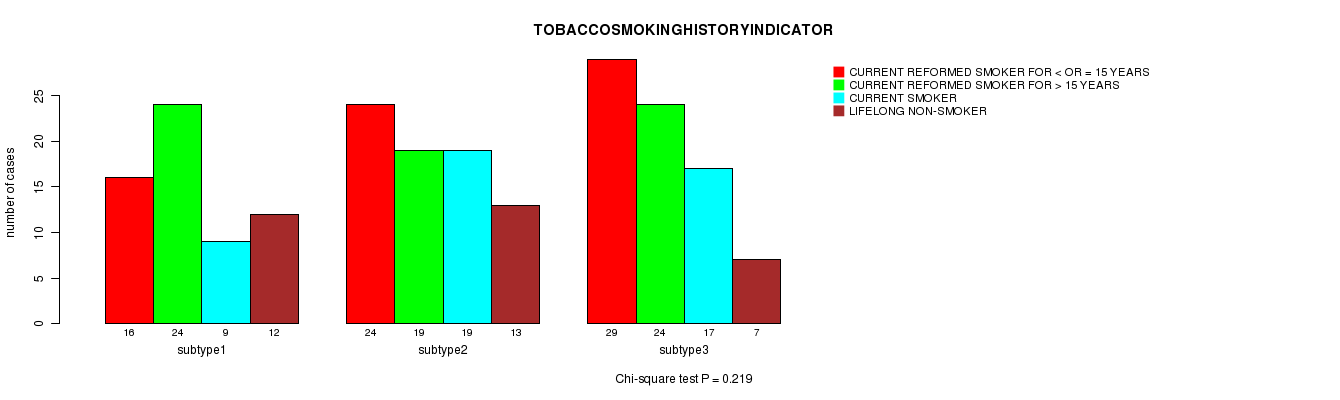
P value = 0.219 (Chi-square test)
Table S76. Clustering Approach #5: 'RNAseq CNMF subtypes' versus Clinical Feature #14: 'TOBACCOSMOKINGHISTORYINDICATOR'
| nPatients | CURRENT REFORMED SMOKER FOR < OR = 15 YEARS | CURRENT REFORMED SMOKER FOR > 15 YEARS | CURRENT SMOKER | LIFELONG NON-SMOKER |
|---|---|---|---|---|
| ALL | 69 | 67 | 45 | 32 |
| subtype1 | 16 | 24 | 9 | 12 |
| subtype2 | 24 | 19 | 19 | 13 |
| subtype3 | 29 | 24 | 17 | 7 |
Figure S71. Get High-res Image Clustering Approach #5: 'RNAseq CNMF subtypes' versus Clinical Feature #14: 'TOBACCOSMOKINGHISTORYINDICATOR'
P value = 0.504 (ANOVA)
Table S77. Clustering Approach #5: 'RNAseq CNMF subtypes' versus Clinical Feature #15: 'YEAROFTOBACCOSMOKINGONSET'
| nPatients | Mean (Std.Dev) | |
|---|---|---|
| ALL | 105 | 1962.0 (12.8) |
| subtype1 | 29 | 1963.0 (11.1) |
| subtype2 | 33 | 1963.4 (13.7) |
| subtype3 | 43 | 1960.2 (13.2) |
Figure S72. Get High-res Image Clustering Approach #5: 'RNAseq CNMF subtypes' versus Clinical Feature #15: 'YEAROFTOBACCOSMOKINGONSET'
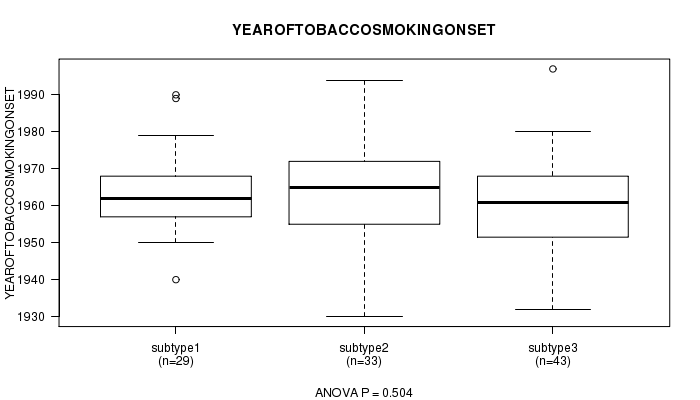
Table S78. Get Full Table Description of clustering approach #6: 'RNAseq cHierClus subtypes'
| Cluster Labels | 1 | 2 | 3 |
|---|---|---|---|
| Number of samples | 38 | 51 | 134 |
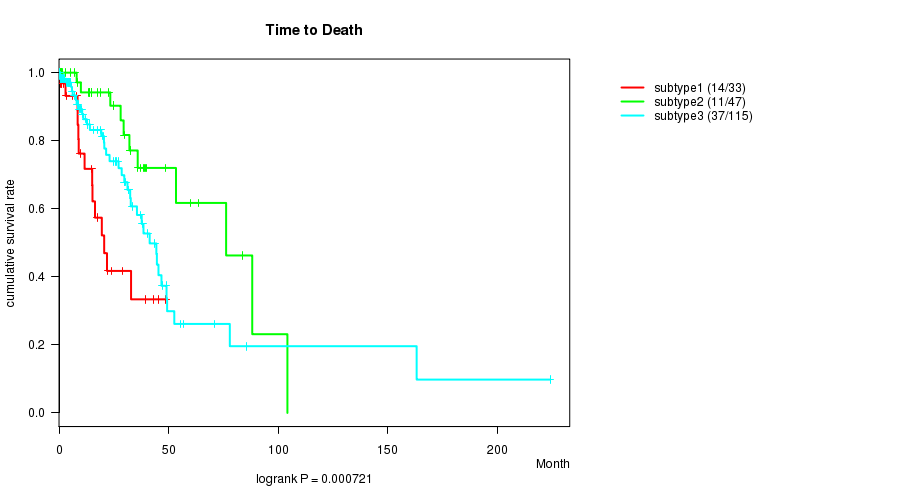
P value = 0.000721 (logrank test)
Table S79. Clustering Approach #6: 'RNAseq cHierClus subtypes' versus Clinical Feature #1: 'Time to Death'
| nPatients | nDeath | Duration Range (Median), Month | |
|---|---|---|---|
| ALL | 195 | 62 | 0.0 - 224.0 (13.9) |
| subtype1 | 33 | 14 | 0.1 - 48.5 (11.6) |
| subtype2 | 47 | 11 | 0.2 - 104.2 (23.4) |
| subtype3 | 115 | 37 | 0.0 - 224.0 (12.3) |
Figure S73. Get High-res Image Clustering Approach #6: 'RNAseq cHierClus subtypes' versus Clinical Feature #1: 'Time to Death'
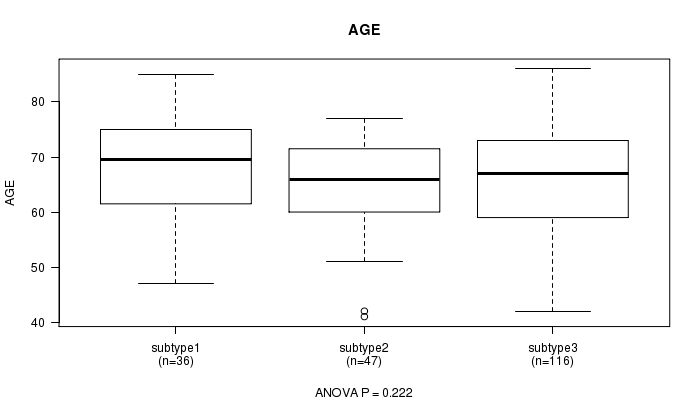
P value = 0.222 (ANOVA)
Table S80. Clustering Approach #6: 'RNAseq cHierClus subtypes' versus Clinical Feature #2: 'AGE'
| nPatients | Mean (Std.Dev) | |
|---|---|---|
| ALL | 199 | 65.9 (9.7) |
| subtype1 | 36 | 68.4 (9.7) |
| subtype2 | 47 | 65.0 (8.5) |
| subtype3 | 116 | 65.6 (10.0) |
Figure S74. Get High-res Image Clustering Approach #6: 'RNAseq cHierClus subtypes' versus Clinical Feature #2: 'AGE'
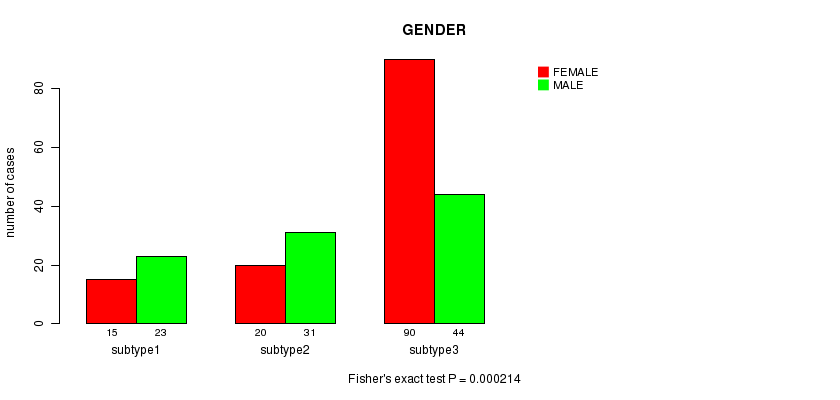
P value = 0.000214 (Fisher's exact test)
Table S81. Clustering Approach #6: 'RNAseq cHierClus subtypes' versus Clinical Feature #3: 'GENDER'
| nPatients | FEMALE | MALE |
|---|---|---|
| ALL | 125 | 98 |
| subtype1 | 15 | 23 |
| subtype2 | 20 | 31 |
| subtype3 | 90 | 44 |
Figure S75. Get High-res Image Clustering Approach #6: 'RNAseq cHierClus subtypes' versus Clinical Feature #3: 'GENDER'
P value = 0.065 (ANOVA)
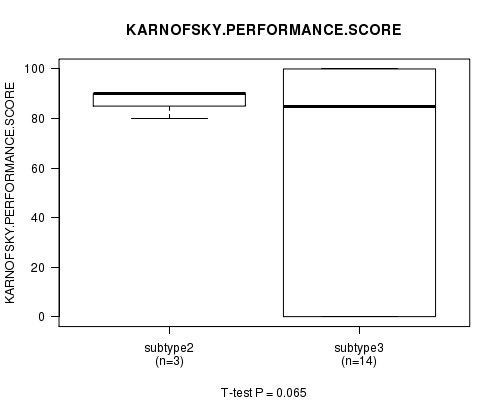
Table S82. Clustering Approach #6: 'RNAseq cHierClus subtypes' versus Clinical Feature #4: 'KARNOFSKY.PERFORMANCE.SCORE'
| nPatients | Mean (Std.Dev) | |
|---|---|---|
| ALL | 17 | 67.1 (39.8) |
| subtype2 | 3 | 86.7 (5.8) |
| subtype3 | 14 | 62.9 (42.9) |
Figure S76. Get High-res Image Clustering Approach #6: 'RNAseq cHierClus subtypes' versus Clinical Feature #4: 'KARNOFSKY.PERFORMANCE.SCORE'
P value = 0.00148 (Chi-square test)
Table S83. Clustering Approach #6: 'RNAseq cHierClus subtypes' versus Clinical Feature #5: 'HISTOLOGICAL.TYPE'
| nPatients | LUNG ACINAR ADENOCARCINOMA | LUNG ADENOCARCINOMA MIXED SUBTYPE | LUNG ADENOCARCINOMA- NOT OTHERWISE SPECIFIED (NOS) | LUNG BRONCHIOLOALVEOLAR CARCINOMA MUCINOUS | LUNG BRONCHIOLOALVEOLAR CARCINOMA NONMUCINOUS | LUNG MICROPAPILLARY ADENOCARCINOMA | LUNG MUCINOUS ADENOCARCINOMA | LUNG PAPILLARY ADENOCARCINOMA | MUCINOUS (COLLOID) ADENOCARCINOMA |
|---|---|---|---|---|---|---|---|---|---|
| ALL | 5 | 54 | 136 | 3 | 10 | 2 | 1 | 8 | 4 |
| subtype1 | 2 | 11 | 17 | 2 | 0 | 0 | 1 | 2 | 3 |
| subtype2 | 0 | 19 | 28 | 0 | 1 | 0 | 0 | 2 | 1 |
| subtype3 | 3 | 24 | 91 | 1 | 9 | 2 | 0 | 4 | 0 |
Figure S77. Get High-res Image Clustering Approach #6: 'RNAseq cHierClus subtypes' versus Clinical Feature #5: 'HISTOLOGICAL.TYPE'

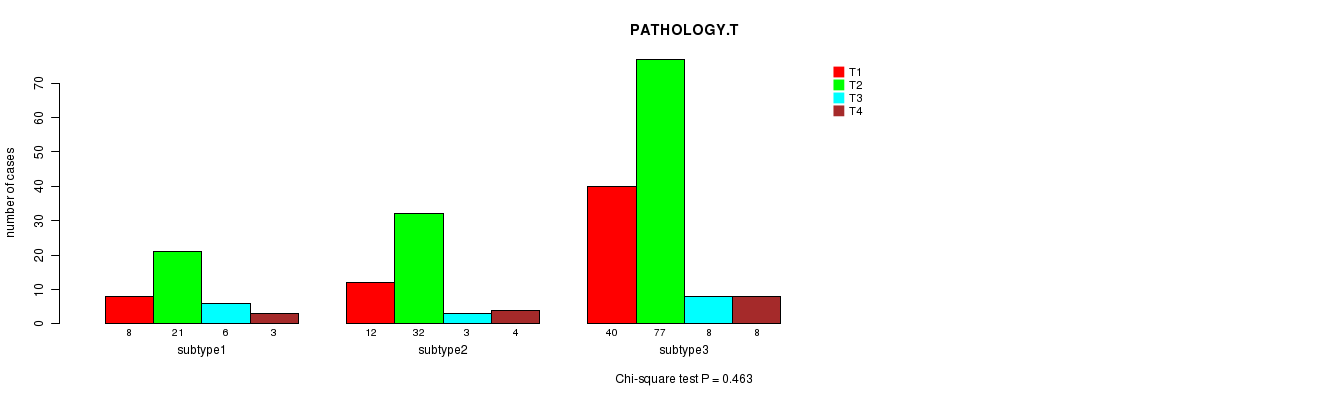
P value = 0.463 (Chi-square test)
Table S84. Clustering Approach #6: 'RNAseq cHierClus subtypes' versus Clinical Feature #6: 'PATHOLOGY.T'
| nPatients | T1 | T2 | T3 | T4 |
|---|---|---|---|---|
| ALL | 60 | 130 | 17 | 15 |
| subtype1 | 8 | 21 | 6 | 3 |
| subtype2 | 12 | 32 | 3 | 4 |
| subtype3 | 40 | 77 | 8 | 8 |
Figure S78. Get High-res Image Clustering Approach #6: 'RNAseq cHierClus subtypes' versus Clinical Feature #6: 'PATHOLOGY.T'
P value = 0.32 (Chi-square test)
Table S85. Clustering Approach #6: 'RNAseq cHierClus subtypes' versus Clinical Feature #7: 'PATHOLOGY.N'
| nPatients | N0 | N1 | N2+N3 |
|---|---|---|---|
| ALL | 132 | 43 | 42 |
| subtype1 | 19 | 9 | 10 |
| subtype2 | 36 | 7 | 7 |
| subtype3 | 77 | 27 | 25 |
Figure S79. Get High-res Image Clustering Approach #6: 'RNAseq cHierClus subtypes' versus Clinical Feature #7: 'PATHOLOGY.N'

P value = 0.556 (Chi-square test)
Table S86. Clustering Approach #6: 'RNAseq cHierClus subtypes' versus Clinical Feature #8: 'PATHOLOGICSPREAD(M)'
| nPatients | M0 | M1 | MX |
|---|---|---|---|
| ALL | 159 | 8 | 51 |
| subtype1 | 29 | 1 | 8 |
| subtype2 | 41 | 2 | 8 |
| subtype3 | 89 | 5 | 35 |
Figure S80. Get High-res Image Clustering Approach #6: 'RNAseq cHierClus subtypes' versus Clinical Feature #8: 'PATHOLOGICSPREAD(M)'

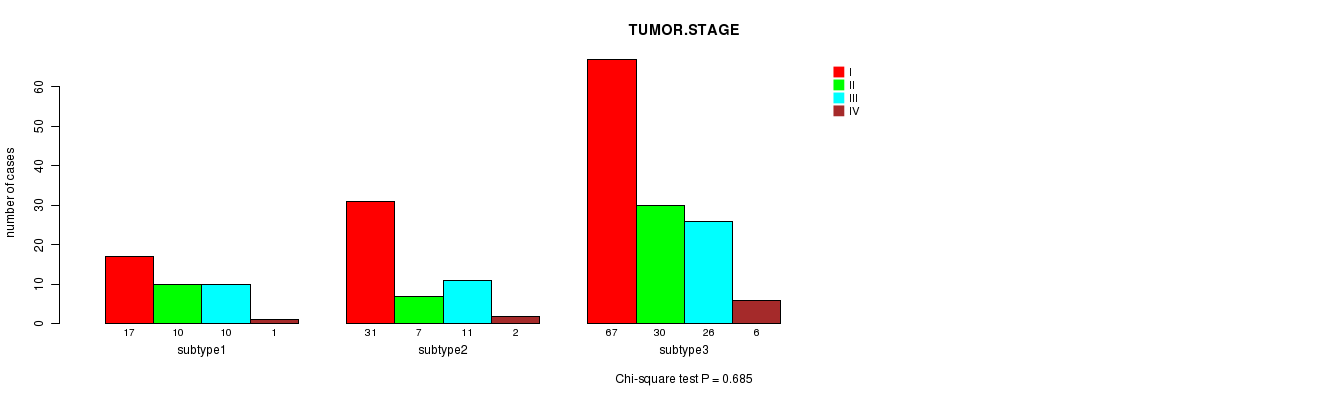
P value = 0.685 (Chi-square test)
Table S87. Clustering Approach #6: 'RNAseq cHierClus subtypes' versus Clinical Feature #9: 'TUMOR.STAGE'
| nPatients | I | II | III | IV |
|---|---|---|---|---|
| ALL | 115 | 47 | 47 | 9 |
| subtype1 | 17 | 10 | 10 | 1 |
| subtype2 | 31 | 7 | 11 | 2 |
| subtype3 | 67 | 30 | 26 | 6 |
Figure S81. Get High-res Image Clustering Approach #6: 'RNAseq cHierClus subtypes' versus Clinical Feature #9: 'TUMOR.STAGE'
P value = 0.933 (Fisher's exact test)
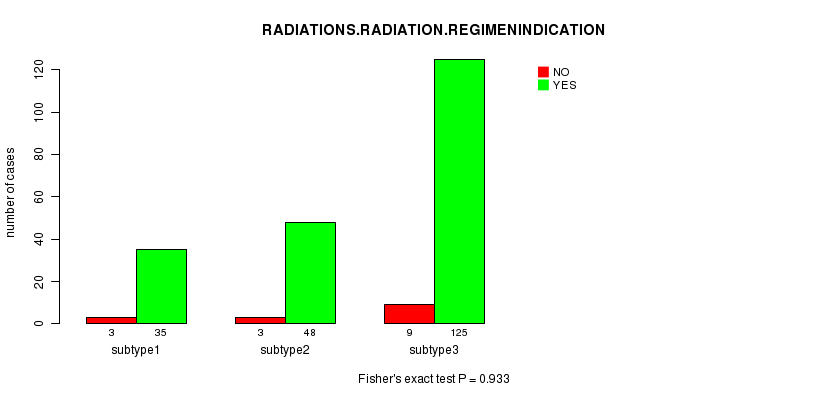
Table S88. Clustering Approach #6: 'RNAseq cHierClus subtypes' versus Clinical Feature #10: 'RADIATIONS.RADIATION.REGIMENINDICATION'
| nPatients | NO | YES |
|---|---|---|
| ALL | 15 | 208 |
| subtype1 | 3 | 35 |
| subtype2 | 3 | 48 |
| subtype3 | 9 | 125 |
Figure S82. Get High-res Image Clustering Approach #6: 'RNAseq cHierClus subtypes' versus Clinical Feature #10: 'RADIATIONS.RADIATION.REGIMENINDICATION'
P value = 0.0574 (Fisher's exact test)
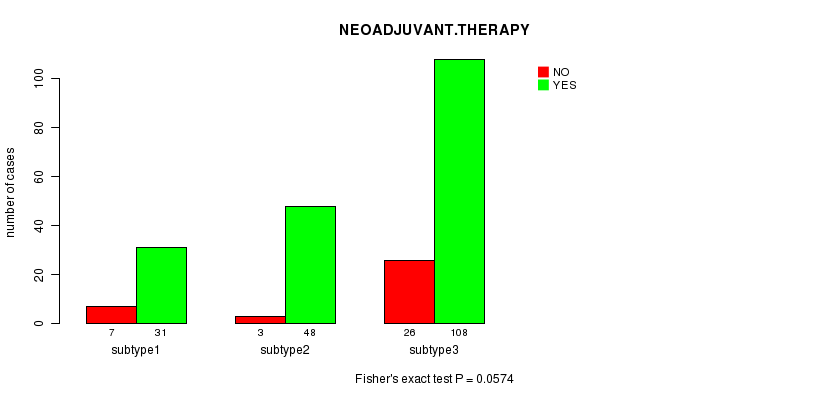
Table S89. Clustering Approach #6: 'RNAseq cHierClus subtypes' versus Clinical Feature #11: 'NEOADJUVANT.THERAPY'
| nPatients | NO | YES |
|---|---|---|
| ALL | 36 | 187 |
| subtype1 | 7 | 31 |
| subtype2 | 3 | 48 |
| subtype3 | 26 | 108 |
Figure S83. Get High-res Image Clustering Approach #6: 'RNAseq cHierClus subtypes' versus Clinical Feature #11: 'NEOADJUVANT.THERAPY'
P value = 0.81 (ANOVA)
Table S90. Clustering Approach #6: 'RNAseq cHierClus subtypes' versus Clinical Feature #12: 'NUMBERPACKYEARSSMOKED'
| nPatients | Mean (Std.Dev) | |
|---|---|---|
| ALL | 155 | 40.0 (26.7) |
| subtype1 | 30 | 38.7 (26.7) |
| subtype2 | 41 | 42.3 (32.3) |
| subtype3 | 84 | 39.4 (23.8) |
Figure S84. Get High-res Image Clustering Approach #6: 'RNAseq cHierClus subtypes' versus Clinical Feature #12: 'NUMBERPACKYEARSSMOKED'

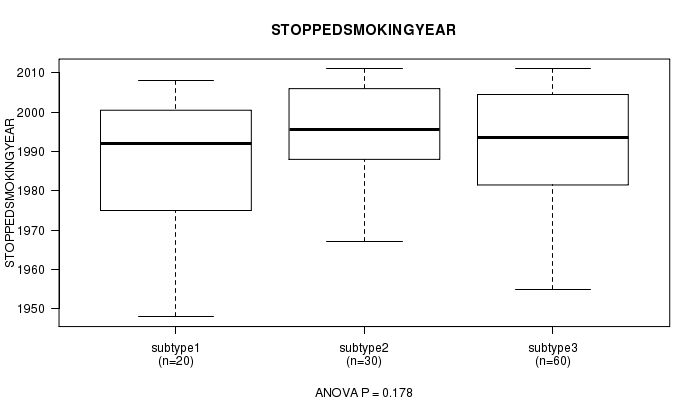
P value = 0.178 (ANOVA)
Table S91. Clustering Approach #6: 'RNAseq cHierClus subtypes' versus Clinical Feature #13: 'STOPPEDSMOKINGYEAR'
| nPatients | Mean (Std.Dev) | |
|---|---|---|
| ALL | 110 | 1991.8 (14.2) |
| subtype1 | 20 | 1988.2 (16.0) |
| subtype2 | 30 | 1995.5 (11.8) |
| subtype3 | 60 | 1991.1 (14.4) |
Figure S85. Get High-res Image Clustering Approach #6: 'RNAseq cHierClus subtypes' versus Clinical Feature #13: 'STOPPEDSMOKINGYEAR'
P value = 0.319 (Chi-square test)
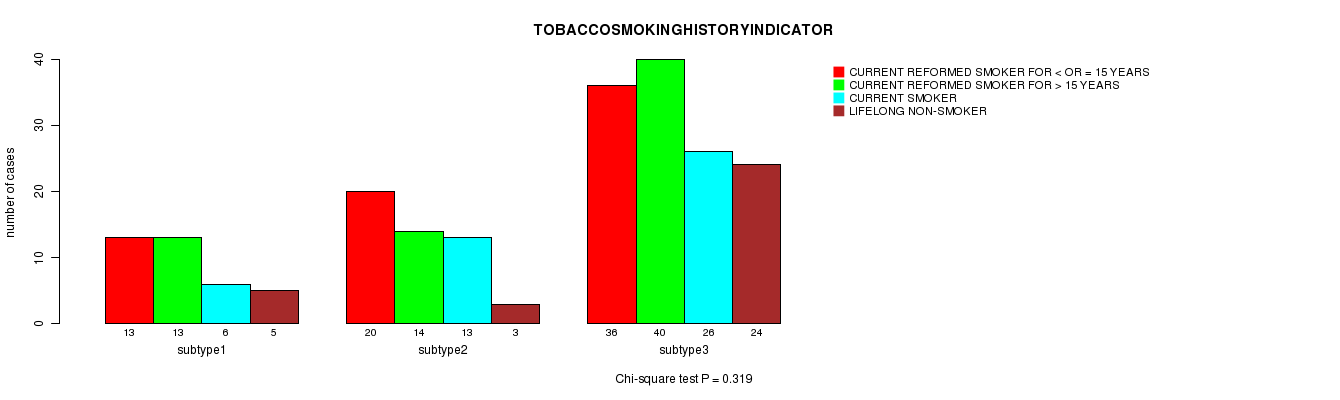
Table S92. Clustering Approach #6: 'RNAseq cHierClus subtypes' versus Clinical Feature #14: 'TOBACCOSMOKINGHISTORYINDICATOR'
| nPatients | CURRENT REFORMED SMOKER FOR < OR = 15 YEARS | CURRENT REFORMED SMOKER FOR > 15 YEARS | CURRENT SMOKER | LIFELONG NON-SMOKER |
|---|---|---|---|---|
| ALL | 69 | 67 | 45 | 32 |
| subtype1 | 13 | 13 | 6 | 5 |
| subtype2 | 20 | 14 | 13 | 3 |
| subtype3 | 36 | 40 | 26 | 24 |
Figure S86. Get High-res Image Clustering Approach #6: 'RNAseq cHierClus subtypes' versus Clinical Feature #14: 'TOBACCOSMOKINGHISTORYINDICATOR'
P value = 0.521 (ANOVA)
Table S93. Clustering Approach #6: 'RNAseq cHierClus subtypes' versus Clinical Feature #15: 'YEAROFTOBACCOSMOKINGONSET'
| nPatients | Mean (Std.Dev) | |
|---|---|---|
| ALL | 105 | 1962.0 (12.8) |
| subtype1 | 16 | 1964.3 (17.1) |
| subtype2 | 32 | 1960.1 (11.5) |
| subtype3 | 57 | 1962.4 (12.2) |
Figure S87. Get High-res Image Clustering Approach #6: 'RNAseq cHierClus subtypes' versus Clinical Feature #15: 'YEAROFTOBACCOSMOKINGONSET'

Table S94. Get Full Table Description of clustering approach #7: 'MIRseq CNMF subtypes'
| Cluster Labels | 1 | 2 | 3 |
|---|---|---|---|
| Number of samples | 77 | 92 | 54 |
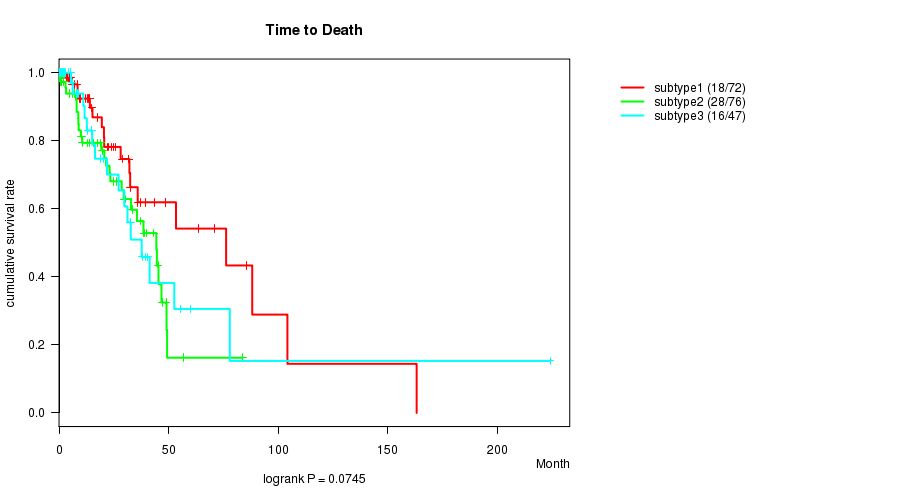
P value = 0.0745 (logrank test)
Table S95. Clustering Approach #7: 'MIRseq CNMF subtypes' versus Clinical Feature #1: 'Time to Death'
| nPatients | nDeath | Duration Range (Median), Month | |
|---|---|---|---|
| ALL | 195 | 62 | 0.0 - 224.0 (13.9) |
| subtype1 | 72 | 18 | 0.1 - 163.1 (13.8) |
| subtype2 | 76 | 28 | 0.1 - 83.8 (17.4) |
| subtype3 | 47 | 16 | 0.0 - 224.0 (12.7) |
Figure S88. Get High-res Image Clustering Approach #7: 'MIRseq CNMF subtypes' versus Clinical Feature #1: 'Time to Death'
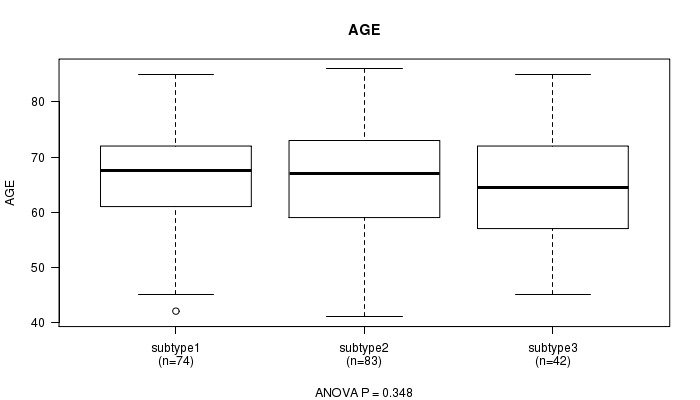
P value = 0.348 (ANOVA)
Table S96. Clustering Approach #7: 'MIRseq CNMF subtypes' versus Clinical Feature #2: 'AGE'
| nPatients | Mean (Std.Dev) | |
|---|---|---|
| ALL | 199 | 65.9 (9.7) |
| subtype1 | 74 | 67.0 (8.9) |
| subtype2 | 83 | 65.9 (10.0) |
| subtype3 | 42 | 64.3 (10.4) |
Figure S89. Get High-res Image Clustering Approach #7: 'MIRseq CNMF subtypes' versus Clinical Feature #2: 'AGE'
P value = 0.659 (Fisher's exact test)
Table S97. Clustering Approach #7: 'MIRseq CNMF subtypes' versus Clinical Feature #3: 'GENDER'
| nPatients | FEMALE | MALE |
|---|---|---|
| ALL | 125 | 98 |
| subtype1 | 40 | 37 |
| subtype2 | 53 | 39 |
| subtype3 | 32 | 22 |
Figure S90. Get High-res Image Clustering Approach #7: 'MIRseq CNMF subtypes' versus Clinical Feature #3: 'GENDER'

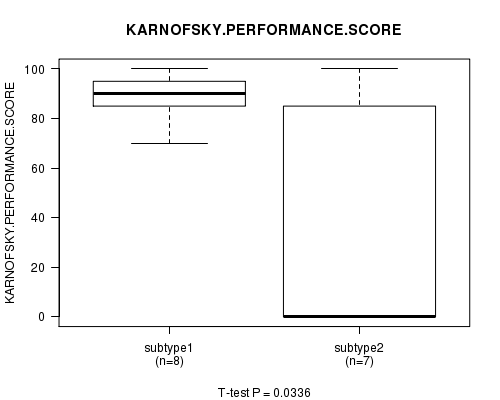
P value = 0.0336 (ANOVA)
Table S98. Clustering Approach #7: 'MIRseq CNMF subtypes' versus Clinical Feature #4: 'KARNOFSKY.PERFORMANCE.SCORE'
| nPatients | Mean (Std.Dev) | |
|---|---|---|
| ALL | 17 | 67.1 (39.8) |
| subtype1 | 8 | 88.8 (9.9) |
| subtype2 | 7 | 38.6 (48.5) |
| subtype3 | 2 | 80.0 (28.3) |
Figure S91. Get High-res Image Clustering Approach #7: 'MIRseq CNMF subtypes' versus Clinical Feature #4: 'KARNOFSKY.PERFORMANCE.SCORE'
P value = 0.0143 (Chi-square test)
Table S99. Clustering Approach #7: 'MIRseq CNMF subtypes' versus Clinical Feature #5: 'HISTOLOGICAL.TYPE'
| nPatients | LUNG ACINAR ADENOCARCINOMA | LUNG ADENOCARCINOMA MIXED SUBTYPE | LUNG ADENOCARCINOMA- NOT OTHERWISE SPECIFIED (NOS) | LUNG BRONCHIOLOALVEOLAR CARCINOMA MUCINOUS | LUNG BRONCHIOLOALVEOLAR CARCINOMA NONMUCINOUS | LUNG MICROPAPILLARY ADENOCARCINOMA | LUNG MUCINOUS ADENOCARCINOMA | LUNG PAPILLARY ADENOCARCINOMA | MUCINOUS (COLLOID) ADENOCARCINOMA |
|---|---|---|---|---|---|---|---|---|---|
| ALL | 5 | 54 | 136 | 3 | 10 | 2 | 1 | 8 | 4 |
| subtype1 | 3 | 23 | 36 | 2 | 6 | 0 | 1 | 5 | 1 |
| subtype2 | 1 | 26 | 60 | 0 | 3 | 0 | 0 | 1 | 1 |
| subtype3 | 1 | 5 | 40 | 1 | 1 | 2 | 0 | 2 | 2 |
Figure S92. Get High-res Image Clustering Approach #7: 'MIRseq CNMF subtypes' versus Clinical Feature #5: 'HISTOLOGICAL.TYPE'
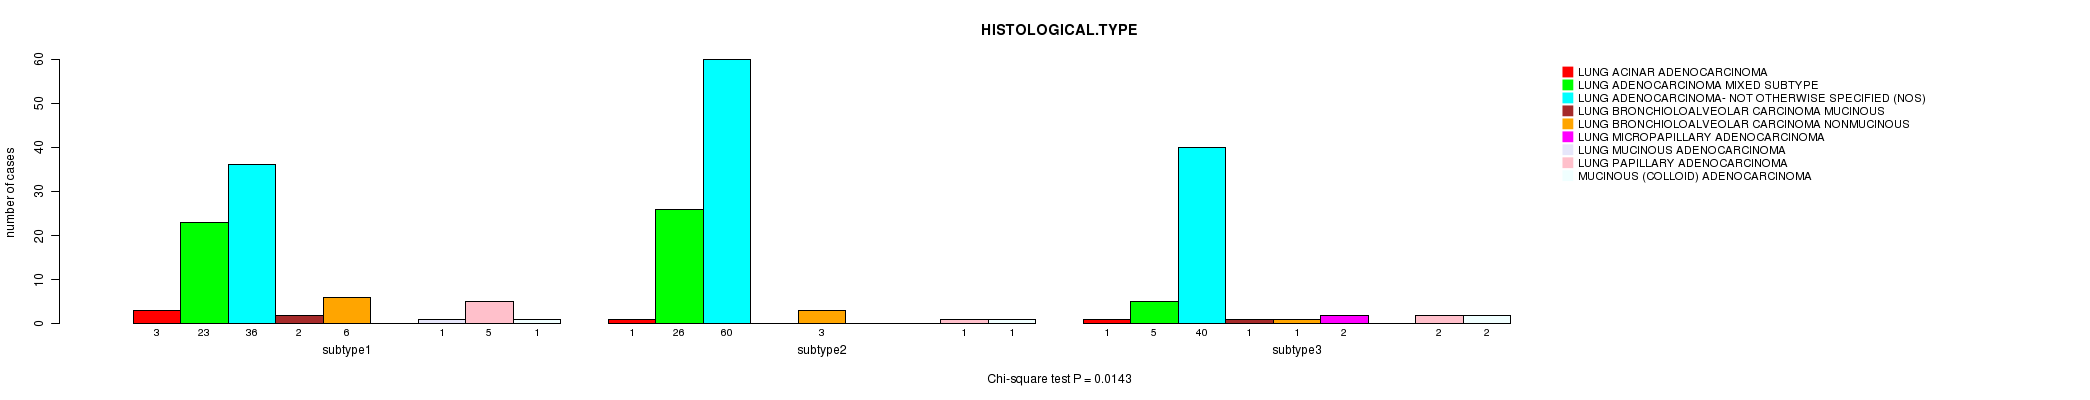
P value = 0.601 (Chi-square test)
Table S100. Clustering Approach #7: 'MIRseq CNMF subtypes' versus Clinical Feature #6: 'PATHOLOGY.T'
| nPatients | T1 | T2 | T3 | T4 |
|---|---|---|---|---|
| ALL | 60 | 130 | 17 | 15 |
| subtype1 | 25 | 39 | 5 | 7 |
| subtype2 | 23 | 55 | 8 | 6 |
| subtype3 | 12 | 36 | 4 | 2 |
Figure S93. Get High-res Image Clustering Approach #7: 'MIRseq CNMF subtypes' versus Clinical Feature #6: 'PATHOLOGY.T'

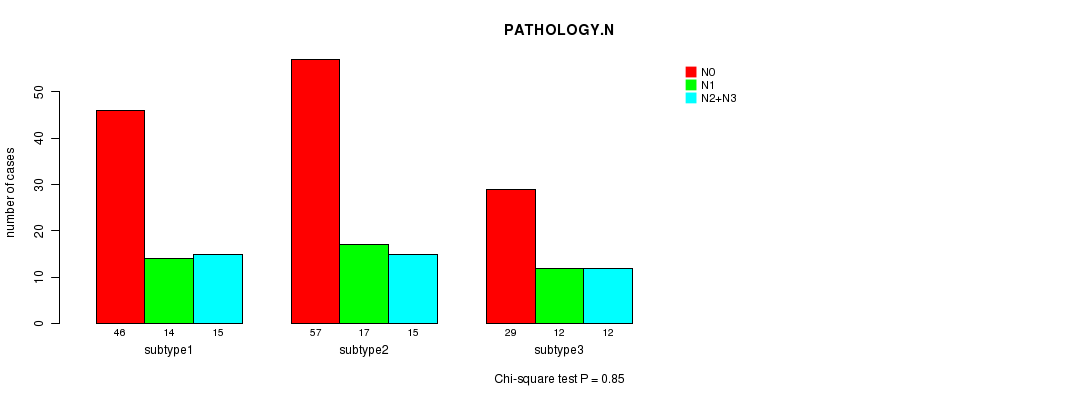
P value = 0.85 (Chi-square test)
Table S101. Clustering Approach #7: 'MIRseq CNMF subtypes' versus Clinical Feature #7: 'PATHOLOGY.N'
| nPatients | N0 | N1 | N2+N3 |
|---|---|---|---|
| ALL | 132 | 43 | 42 |
| subtype1 | 46 | 14 | 15 |
| subtype2 | 57 | 17 | 15 |
| subtype3 | 29 | 12 | 12 |
Figure S94. Get High-res Image Clustering Approach #7: 'MIRseq CNMF subtypes' versus Clinical Feature #7: 'PATHOLOGY.N'
P value = 0.119 (Chi-square test)
Table S102. Clustering Approach #7: 'MIRseq CNMF subtypes' versus Clinical Feature #8: 'PATHOLOGICSPREAD(M)'
| nPatients | M0 | M1 | MX |
|---|---|---|---|
| ALL | 159 | 8 | 51 |
| subtype1 | 48 | 4 | 22 |
| subtype2 | 75 | 3 | 14 |
| subtype3 | 36 | 1 | 15 |
Figure S95. Get High-res Image Clustering Approach #7: 'MIRseq CNMF subtypes' versus Clinical Feature #8: 'PATHOLOGICSPREAD(M)'
P value = 0.854 (Chi-square test)
Table S103. Clustering Approach #7: 'MIRseq CNMF subtypes' versus Clinical Feature #9: 'TUMOR.STAGE'
| nPatients | I | II | III | IV |
|---|---|---|---|---|
| ALL | 115 | 47 | 47 | 9 |
| subtype1 | 39 | 15 | 15 | 5 |
| subtype2 | 50 | 20 | 19 | 3 |
| subtype3 | 26 | 12 | 13 | 1 |
Figure S96. Get High-res Image Clustering Approach #7: 'MIRseq CNMF subtypes' versus Clinical Feature #9: 'TUMOR.STAGE'
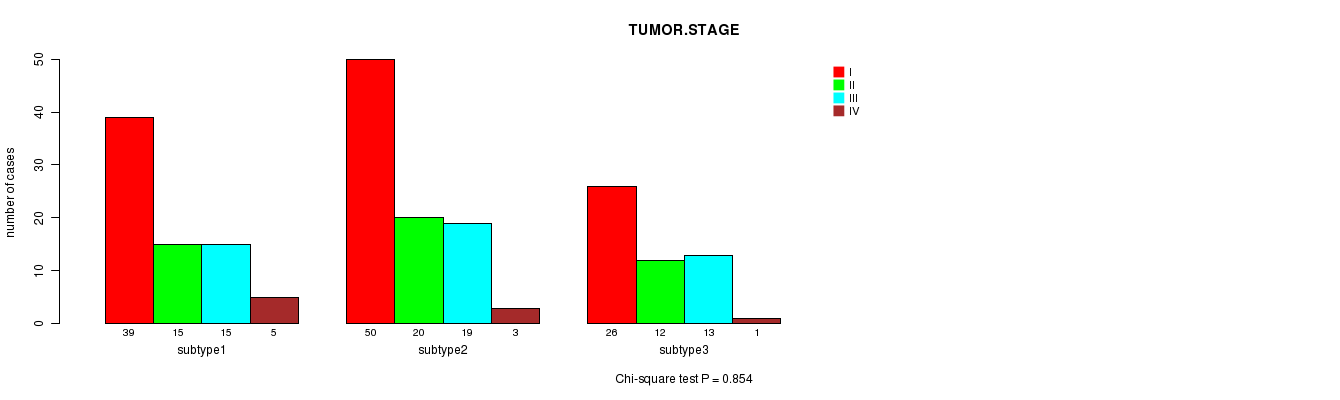
P value = 0.789 (Fisher's exact test)
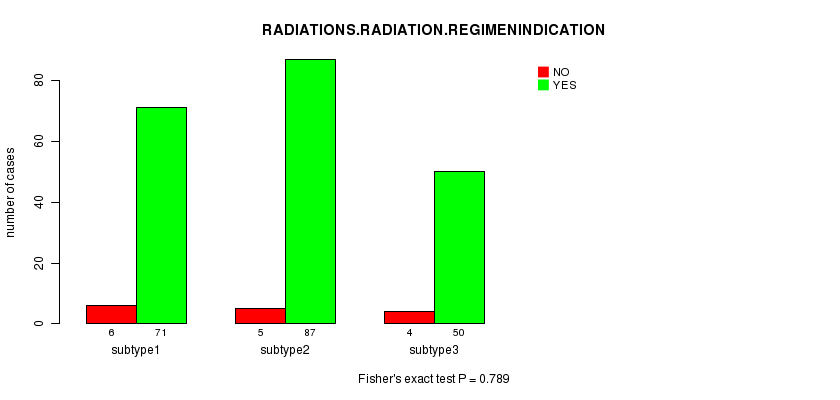
Table S104. Clustering Approach #7: 'MIRseq CNMF subtypes' versus Clinical Feature #10: 'RADIATIONS.RADIATION.REGIMENINDICATION'
| nPatients | NO | YES |
|---|---|---|
| ALL | 15 | 208 |
| subtype1 | 6 | 71 |
| subtype2 | 5 | 87 |
| subtype3 | 4 | 50 |
Figure S97. Get High-res Image Clustering Approach #7: 'MIRseq CNMF subtypes' versus Clinical Feature #10: 'RADIATIONS.RADIATION.REGIMENINDICATION'
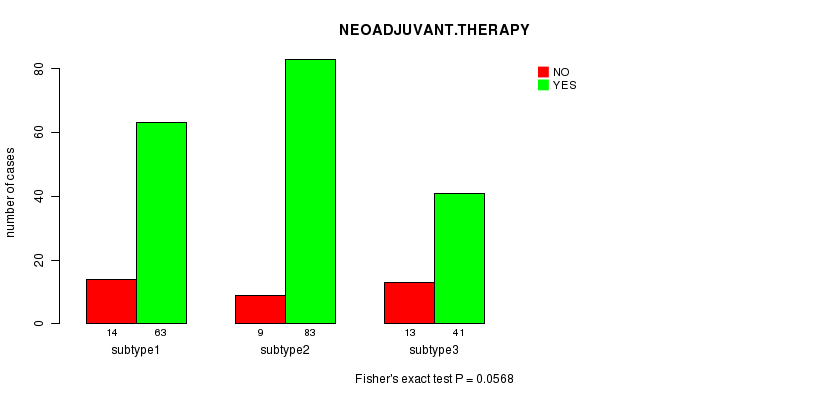
P value = 0.0568 (Fisher's exact test)
Table S105. Clustering Approach #7: 'MIRseq CNMF subtypes' versus Clinical Feature #11: 'NEOADJUVANT.THERAPY'
| nPatients | NO | YES |
|---|---|---|
| ALL | 36 | 187 |
| subtype1 | 14 | 63 |
| subtype2 | 9 | 83 |
| subtype3 | 13 | 41 |
Figure S98. Get High-res Image Clustering Approach #7: 'MIRseq CNMF subtypes' versus Clinical Feature #11: 'NEOADJUVANT.THERAPY'
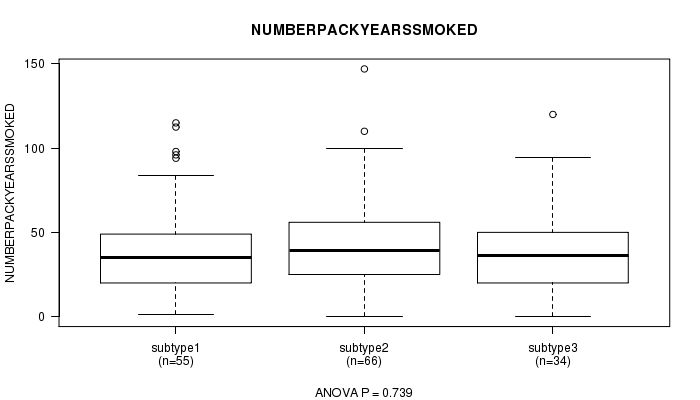
P value = 0.739 (ANOVA)
Table S106. Clustering Approach #7: 'MIRseq CNMF subtypes' versus Clinical Feature #12: 'NUMBERPACKYEARSSMOKED'
| nPatients | Mean (Std.Dev) | |
|---|---|---|
| ALL | 155 | 40.0 (26.7) |
| subtype1 | 55 | 39.5 (28.0) |
| subtype2 | 66 | 41.8 (26.6) |
| subtype3 | 34 | 37.5 (25.0) |
Figure S99. Get High-res Image Clustering Approach #7: 'MIRseq CNMF subtypes' versus Clinical Feature #12: 'NUMBERPACKYEARSSMOKED'
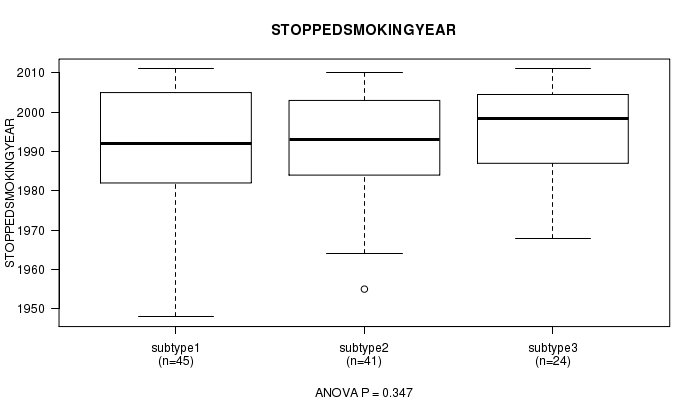
P value = 0.347 (ANOVA)
Table S107. Clustering Approach #7: 'MIRseq CNMF subtypes' versus Clinical Feature #13: 'STOPPEDSMOKINGYEAR'
| nPatients | Mean (Std.Dev) | |
|---|---|---|
| ALL | 110 | 1991.8 (14.2) |
| subtype1 | 45 | 1990.8 (15.5) |
| subtype2 | 41 | 1990.7 (13.7) |
| subtype3 | 24 | 1995.5 (12.1) |
Figure S100. Get High-res Image Clustering Approach #7: 'MIRseq CNMF subtypes' versus Clinical Feature #13: 'STOPPEDSMOKINGYEAR'
P value = 0.249 (Chi-square test)
Table S108. Clustering Approach #7: 'MIRseq CNMF subtypes' versus Clinical Feature #14: 'TOBACCOSMOKINGHISTORYINDICATOR'
| nPatients | CURRENT REFORMED SMOKER FOR < OR = 15 YEARS | CURRENT REFORMED SMOKER FOR > 15 YEARS | CURRENT SMOKER | LIFELONG NON-SMOKER |
|---|---|---|---|---|
| ALL | 69 | 67 | 45 | 32 |
| subtype1 | 26 | 24 | 15 | 7 |
| subtype2 | 23 | 30 | 22 | 13 |
| subtype3 | 20 | 13 | 8 | 12 |
Figure S101. Get High-res Image Clustering Approach #7: 'MIRseq CNMF subtypes' versus Clinical Feature #14: 'TOBACCOSMOKINGHISTORYINDICATOR'

P value = 0.197 (ANOVA)
Table S109. Clustering Approach #7: 'MIRseq CNMF subtypes' versus Clinical Feature #15: 'YEAROFTOBACCOSMOKINGONSET'
| nPatients | Mean (Std.Dev) | |
|---|---|---|
| ALL | 105 | 1962.0 (12.8) |
| subtype1 | 42 | 1959.3 (13.9) |
| subtype2 | 41 | 1963.5 (12.6) |
| subtype3 | 22 | 1964.4 (10.3) |
Figure S102. Get High-res Image Clustering Approach #7: 'MIRseq CNMF subtypes' versus Clinical Feature #15: 'YEAROFTOBACCOSMOKINGONSET'
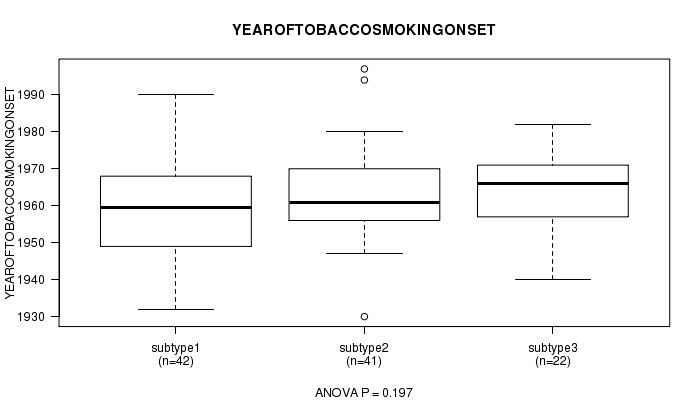
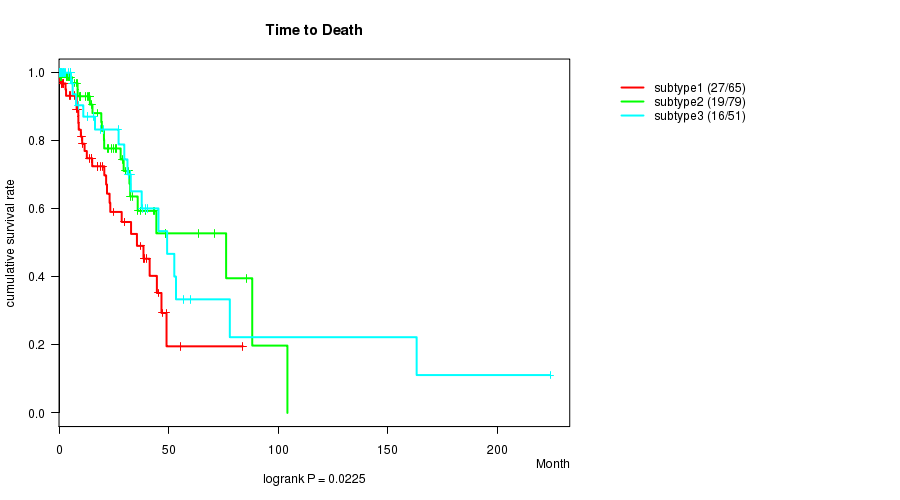
Table S110. Get Full Table Description of clustering approach #8: 'MIRseq cHierClus subtypes'
| Cluster Labels | 1 | 2 | 3 |
|---|---|---|---|
| Number of samples | 79 | 84 | 60 |
P value = 0.0225 (logrank test)
Table S111. Clustering Approach #8: 'MIRseq cHierClus subtypes' versus Clinical Feature #1: 'Time to Death'
| nPatients | nDeath | Duration Range (Median), Month | |
|---|---|---|---|
| ALL | 195 | 62 | 0.0 - 224.0 (13.9) |
| subtype1 | 65 | 27 | 0.1 - 83.8 (15.0) |
| subtype2 | 79 | 19 | 0.1 - 104.2 (13.9) |
| subtype3 | 51 | 16 | 0.0 - 224.0 (13.0) |
Figure S103. Get High-res Image Clustering Approach #8: 'MIRseq cHierClus subtypes' versus Clinical Feature #1: 'Time to Death'
P value = 0.152 (ANOVA)
Table S112. Clustering Approach #8: 'MIRseq cHierClus subtypes' versus Clinical Feature #2: 'AGE'
| nPatients | Mean (Std.Dev) | |
|---|---|---|
| ALL | 199 | 65.9 (9.7) |
| subtype1 | 70 | 65.9 (10.9) |
| subtype2 | 82 | 67.2 (9.0) |
| subtype3 | 47 | 63.8 (8.6) |
Figure S104. Get High-res Image Clustering Approach #8: 'MIRseq cHierClus subtypes' versus Clinical Feature #2: 'AGE'

P value = 0.0696 (Fisher's exact test)
Table S113. Clustering Approach #8: 'MIRseq cHierClus subtypes' versus Clinical Feature #3: 'GENDER'
| nPatients | FEMALE | MALE |
|---|---|---|
| ALL | 125 | 98 |
| subtype1 | 39 | 40 |
| subtype2 | 45 | 39 |
| subtype3 | 41 | 19 |
Figure S105. Get High-res Image Clustering Approach #8: 'MIRseq cHierClus subtypes' versus Clinical Feature #3: 'GENDER'

P value = 0.596 (ANOVA)
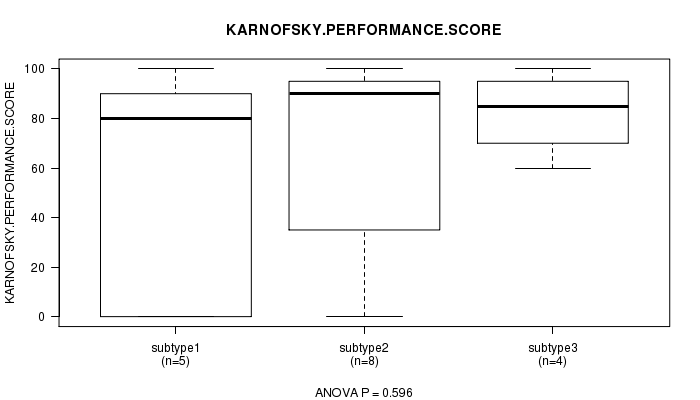
Table S114. Clustering Approach #8: 'MIRseq cHierClus subtypes' versus Clinical Feature #4: 'KARNOFSKY.PERFORMANCE.SCORE'
| nPatients | Mean (Std.Dev) | |
|---|---|---|
| ALL | 17 | 67.1 (39.8) |
| subtype1 | 5 | 54.0 (49.8) |
| subtype2 | 8 | 67.5 (42.7) |
| subtype3 | 4 | 82.5 (17.1) |
Figure S106. Get High-res Image Clustering Approach #8: 'MIRseq cHierClus subtypes' versus Clinical Feature #4: 'KARNOFSKY.PERFORMANCE.SCORE'
P value = 0.122 (Chi-square test)
Table S115. Clustering Approach #8: 'MIRseq cHierClus subtypes' versus Clinical Feature #5: 'HISTOLOGICAL.TYPE'
| nPatients | LUNG ACINAR ADENOCARCINOMA | LUNG ADENOCARCINOMA MIXED SUBTYPE | LUNG ADENOCARCINOMA- NOT OTHERWISE SPECIFIED (NOS) | LUNG BRONCHIOLOALVEOLAR CARCINOMA MUCINOUS | LUNG BRONCHIOLOALVEOLAR CARCINOMA NONMUCINOUS | LUNG MICROPAPILLARY ADENOCARCINOMA | LUNG MUCINOUS ADENOCARCINOMA | LUNG PAPILLARY ADENOCARCINOMA | MUCINOUS (COLLOID) ADENOCARCINOMA |
|---|---|---|---|---|---|---|---|---|---|
| ALL | 5 | 54 | 136 | 3 | 10 | 2 | 1 | 8 | 4 |
| subtype1 | 1 | 23 | 52 | 0 | 2 | 0 | 0 | 0 | 1 |
| subtype2 | 2 | 23 | 43 | 2 | 6 | 0 | 1 | 5 | 2 |
| subtype3 | 2 | 8 | 41 | 1 | 2 | 2 | 0 | 3 | 1 |
Figure S107. Get High-res Image Clustering Approach #8: 'MIRseq cHierClus subtypes' versus Clinical Feature #5: 'HISTOLOGICAL.TYPE'
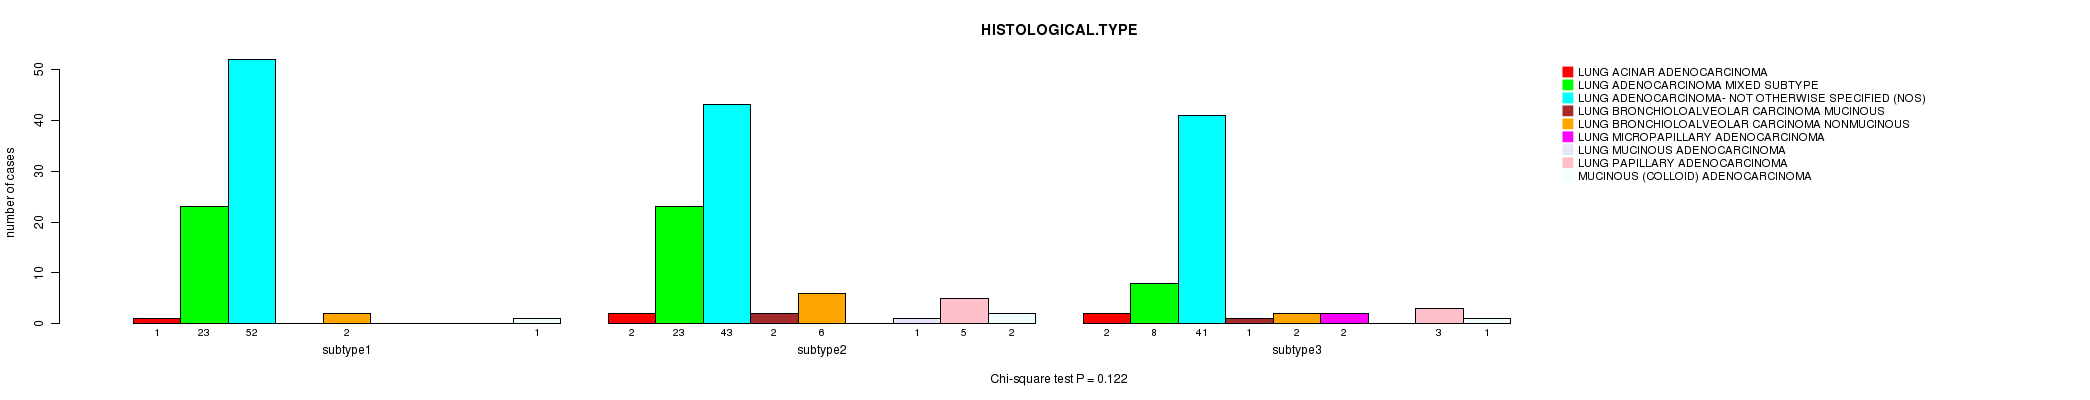
P value = 0.34 (Chi-square test)
Table S116. Clustering Approach #8: 'MIRseq cHierClus subtypes' versus Clinical Feature #6: 'PATHOLOGY.T'
| nPatients | T1 | T2 | T3 | T4 |
|---|---|---|---|---|
| ALL | 60 | 130 | 17 | 15 |
| subtype1 | 16 | 48 | 9 | 6 |
| subtype2 | 27 | 44 | 5 | 7 |
| subtype3 | 17 | 38 | 3 | 2 |
Figure S108. Get High-res Image Clustering Approach #8: 'MIRseq cHierClus subtypes' versus Clinical Feature #6: 'PATHOLOGY.T'

P value = 0.876 (Chi-square test)
Table S117. Clustering Approach #8: 'MIRseq cHierClus subtypes' versus Clinical Feature #7: 'PATHOLOGY.N'
| nPatients | N0 | N1 | N2+N3 |
|---|---|---|---|
| ALL | 132 | 43 | 42 |
| subtype1 | 46 | 15 | 16 |
| subtype2 | 52 | 15 | 13 |
| subtype3 | 34 | 13 | 13 |
Figure S109. Get High-res Image Clustering Approach #8: 'MIRseq cHierClus subtypes' versus Clinical Feature #7: 'PATHOLOGY.N'
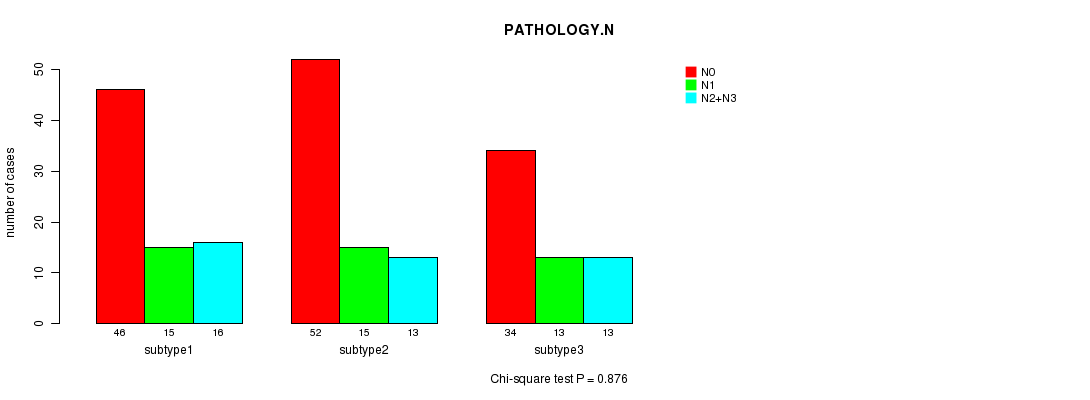
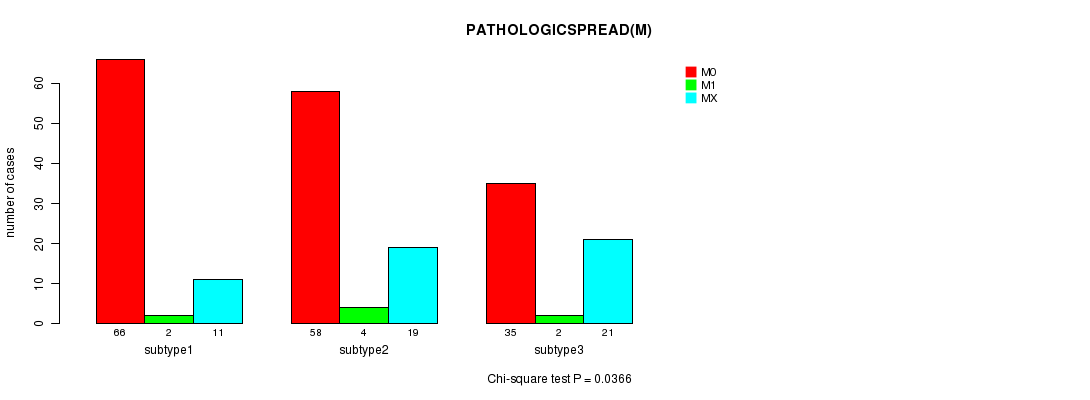
P value = 0.0366 (Chi-square test)
Table S118. Clustering Approach #8: 'MIRseq cHierClus subtypes' versus Clinical Feature #8: 'PATHOLOGICSPREAD(M)'
| nPatients | M0 | M1 | MX |
|---|---|---|---|
| ALL | 159 | 8 | 51 |
| subtype1 | 66 | 2 | 11 |
| subtype2 | 58 | 4 | 19 |
| subtype3 | 35 | 2 | 21 |
Figure S110. Get High-res Image Clustering Approach #8: 'MIRseq cHierClus subtypes' versus Clinical Feature #8: 'PATHOLOGICSPREAD(M)'
P value = 0.683 (Chi-square test)
Table S119. Clustering Approach #8: 'MIRseq cHierClus subtypes' versus Clinical Feature #9: 'TUMOR.STAGE'
| nPatients | I | II | III | IV |
|---|---|---|---|---|
| ALL | 115 | 47 | 47 | 9 |
| subtype1 | 38 | 19 | 20 | 2 |
| subtype2 | 47 | 15 | 14 | 5 |
| subtype3 | 30 | 13 | 13 | 2 |
Figure S111. Get High-res Image Clustering Approach #8: 'MIRseq cHierClus subtypes' versus Clinical Feature #9: 'TUMOR.STAGE'
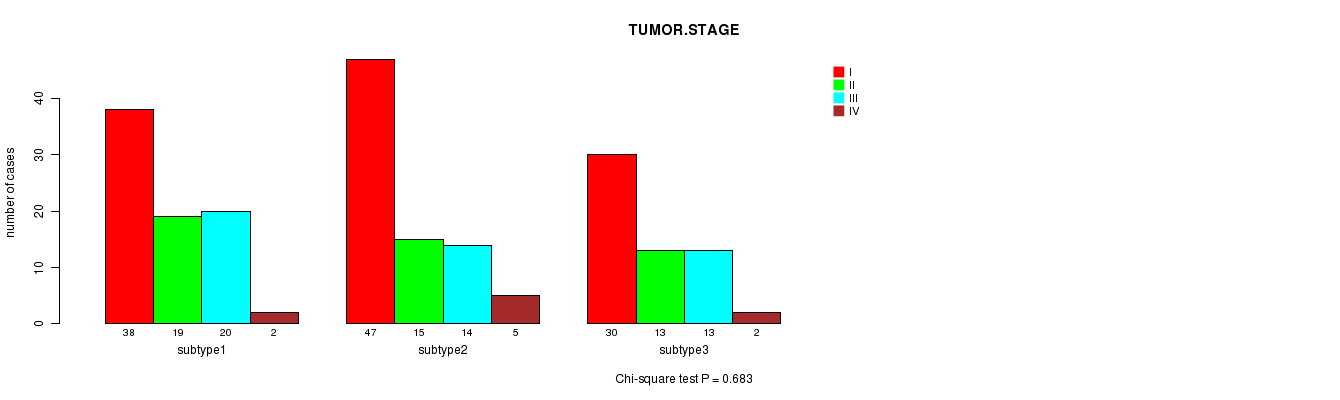
P value = 0.443 (Fisher's exact test)
Table S120. Clustering Approach #8: 'MIRseq cHierClus subtypes' versus Clinical Feature #10: 'RADIATIONS.RADIATION.REGIMENINDICATION'
| nPatients | NO | YES |
|---|---|---|
| ALL | 15 | 208 |
| subtype1 | 7 | 72 |
| subtype2 | 6 | 78 |
| subtype3 | 2 | 58 |
Figure S112. Get High-res Image Clustering Approach #8: 'MIRseq cHierClus subtypes' versus Clinical Feature #10: 'RADIATIONS.RADIATION.REGIMENINDICATION'
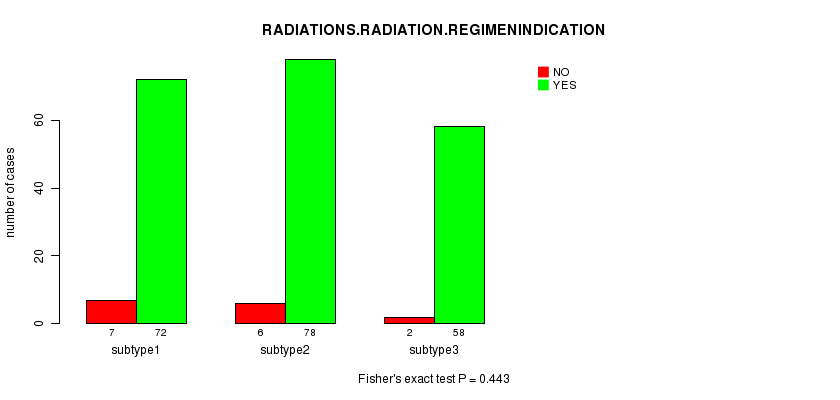
P value = 0.872 (Fisher's exact test)
Table S121. Clustering Approach #8: 'MIRseq cHierClus subtypes' versus Clinical Feature #11: 'NEOADJUVANT.THERAPY'
| nPatients | NO | YES |
|---|---|---|
| ALL | 36 | 187 |
| subtype1 | 12 | 67 |
| subtype2 | 13 | 71 |
| subtype3 | 11 | 49 |
Figure S113. Get High-res Image Clustering Approach #8: 'MIRseq cHierClus subtypes' versus Clinical Feature #11: 'NEOADJUVANT.THERAPY'

P value = 0.523 (ANOVA)
Table S122. Clustering Approach #8: 'MIRseq cHierClus subtypes' versus Clinical Feature #12: 'NUMBERPACKYEARSSMOKED'
| nPatients | Mean (Std.Dev) | |
|---|---|---|
| ALL | 155 | 40.0 (26.7) |
| subtype1 | 62 | 40.2 (26.7) |
| subtype2 | 57 | 42.5 (30.0) |
| subtype3 | 36 | 36.0 (20.3) |
Figure S114. Get High-res Image Clustering Approach #8: 'MIRseq cHierClus subtypes' versus Clinical Feature #12: 'NUMBERPACKYEARSSMOKED'
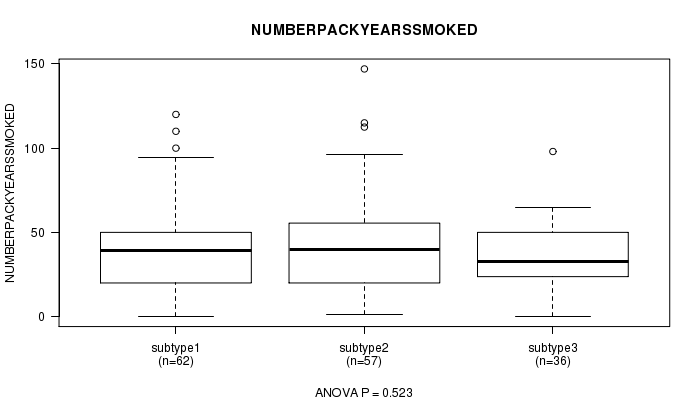
P value = 0.485 (ANOVA)
Table S123. Clustering Approach #8: 'MIRseq cHierClus subtypes' versus Clinical Feature #13: 'STOPPEDSMOKINGYEAR'
| nPatients | Mean (Std.Dev) | |
|---|---|---|
| ALL | 110 | 1991.8 (14.2) |
| subtype1 | 35 | 1990.9 (14.2) |
| subtype2 | 48 | 1990.8 (15.4) |
| subtype3 | 27 | 1994.6 (11.9) |
Figure S115. Get High-res Image Clustering Approach #8: 'MIRseq cHierClus subtypes' versus Clinical Feature #13: 'STOPPEDSMOKINGYEAR'
P value = 0.204 (Chi-square test)
Table S124. Clustering Approach #8: 'MIRseq cHierClus subtypes' versus Clinical Feature #14: 'TOBACCOSMOKINGHISTORYINDICATOR'
| nPatients | CURRENT REFORMED SMOKER FOR < OR = 15 YEARS | CURRENT REFORMED SMOKER FOR > 15 YEARS | CURRENT SMOKER | LIFELONG NON-SMOKER |
|---|---|---|---|---|
| ALL | 69 | 67 | 45 | 32 |
| subtype1 | 22 | 21 | 22 | 11 |
| subtype2 | 28 | 28 | 15 | 8 |
| subtype3 | 19 | 18 | 8 | 13 |
Figure S116. Get High-res Image Clustering Approach #8: 'MIRseq cHierClus subtypes' versus Clinical Feature #14: 'TOBACCOSMOKINGHISTORYINDICATOR'
P value = 0.351 (ANOVA)
Table S125. Clustering Approach #8: 'MIRseq cHierClus subtypes' versus Clinical Feature #15: 'YEAROFTOBACCOSMOKINGONSET'
| nPatients | Mean (Std.Dev) | |
|---|---|---|
| ALL | 105 | 1962.0 (12.8) |
| subtype1 | 38 | 1962.7 (13.1) |
| subtype2 | 46 | 1960.1 (13.1) |
| subtype3 | 21 | 1964.8 (11.3) |
Figure S117. Get High-res Image Clustering Approach #8: 'MIRseq cHierClus subtypes' versus Clinical Feature #15: 'YEAROFTOBACCOSMOKINGONSET'
-
Cluster data file = LUAD.mergedcluster.txt
-
Clinical data file = LUAD.clin.merged.picked.txt
-
Number of patients = 223
-
Number of clustering approaches = 8
-
Number of selected clinical features = 15
-
Exclude small clusters that include fewer than K patients, K = 3
consensus non-negative matrix factorization clustering approach (Brunet et al. 2004)
Resampling-based clustering method (Monti et al. 2003)
For survival clinical features, the Kaplan-Meier survival curves of tumors with and without gene mutations were plotted and the statistical significance P values were estimated by logrank test (Bland and Altman 2004) using the 'survdiff' function in R
For continuous numerical clinical features, two-tailed Student's t test with unequal variance (Lehmann and Romano 2005) was applied to compare the clinical values between two tumor subtypes using 't.test' function in R
For binary clinical features, two-tailed Fisher's exact tests (Fisher 1922) were used to estimate the P values using the 'fisher.test' function in R
For multi-class clinical features (nominal or ordinal), Chi-square tests (Greenwood and Nikulin 1996) were used to estimate the P values using the 'chisq.test' function in R
For continuous numerical clinical features, one-way analysis of variance (Howell 2002) was applied to compare the clinical values between tumor subtypes using 'anova' function in R
This is an experimental feature. The full results of the analysis summarized in this report can be downloaded from the TCGA Data Coordination Center.