This pipeline computes the correlation between significantly recurrent gene mutations and selected clinical features.
Testing the association between mutation status of 149 genes and 3 clinical features across 126 patients, 2 significant findings detected with Q value < 0.25.
-
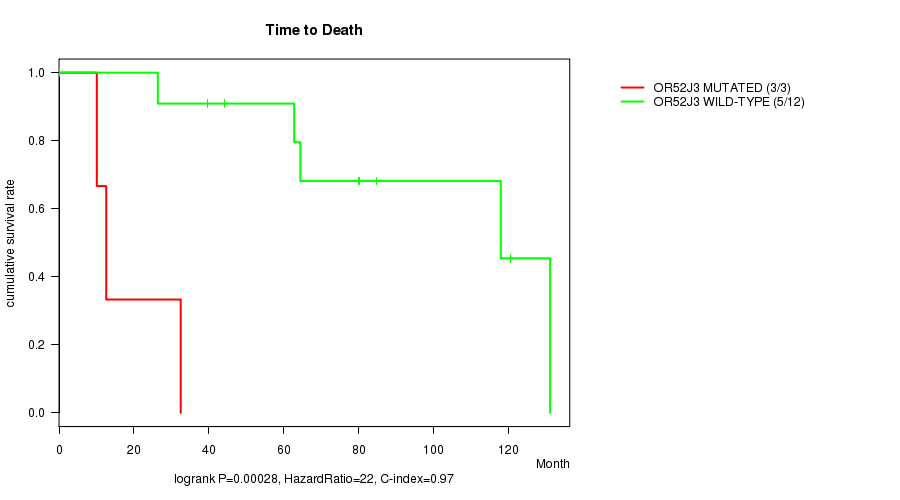
OR52J3 mutation correlated to 'Time to Death'.
-
TRAT1 mutation correlated to 'Time to Death'.
Table 1. Get Full Table Overview of the association between mutation status of 149 genes and 3 clinical features. Shown in the table are P values (Q values). Thresholded by Q value < 0.25, 2 significant findings detected.
|
Clinical Features |
Time to Death |
AGE | GENDER | ||
| nMutated (%) | nWild-Type | logrank test | t-test | Fisher's exact test | |
| OR52J3 | 8 (6%) | 118 |
0.00028 (0.0521) |
0.4 (1.00) |
1 (1.00) |
| TRAT1 | 9 (7%) | 117 |
0.000994 (0.184) |
0.534 (1.00) |
0.723 (1.00) |
| BRAF | 65 (52%) | 61 |
0.512 (1.00) |
0.693 (1.00) |
1 (1.00) |
| NRAS | 37 (29%) | 89 |
0.158 (1.00) |
0.706 (1.00) |
1 (1.00) |
| CDKN2A | 20 (16%) | 106 |
0.562 (1.00) |
0.318 (1.00) |
0.802 (1.00) |
| TP53 | 22 (17%) | 104 |
0.635 (1.00) |
||
| PTEN | 8 (6%) | 118 |
0.462 (1.00) |
||
| ACSM2B | 26 (21%) | 100 |
0.00274 (0.504) |
||
| LCE1B | 8 (6%) | 118 |
0.462 (1.00) |
||
| CADM2 | 13 (10%) | 113 |
0.767 (1.00) |
||
| NAP1L2 | 12 (10%) | 114 |
0.757 (1.00) |
||
| RAC1 | 9 (7%) | 117 |
0.485 (1.00) |
||
| MUC7 | 9 (7%) | 117 |
1 (1.00) |
||
| OR51S1 | 15 (12%) | 111 |
0.781 (1.00) |
||
| FUT9 | 13 (10%) | 113 |
1 (1.00) |
||
| PPP6C | 12 (10%) | 114 |
1 (1.00) |
||
| USP29 | 23 (18%) | 103 |
0.339 (1.00) |
||
| RPTN | 21 (17%) | 105 |
0.808 (1.00) |
||
| TAF1A | 7 (6%) | 119 |
0.705 (1.00) |
||
| CDH9 | 22 (17%) | 104 |
1 (1.00) |
||
| GRXCR1 | 12 (10%) | 114 |
1 (1.00) |
||
| HIST1H2AA | 7 (6%) | 119 |
0.705 (1.00) |
||
| ZNF679 | 13 (10%) | 113 |
0.767 (1.00) |
||
| C8A | 17 (13%) | 109 |
0.0289 (1.00) |
||
| RBM11 | 9 (7%) | 117 |
1 (1.00) |
||
| ZNF479 | 11 (9%) | 115 |
0.159 (1.00) |
0.988 (1.00) |
0.528 (1.00) |
| GFRAL | 18 (14%) | 108 |
1 (1.00) |
||
| DDX3X | 15 (12%) | 111 |
0.253 (1.00) |
||
| OR4M2 | 13 (10%) | 113 |
1 (1.00) |
||
| FRG2B | 10 (8%) | 116 |
0.495 (1.00) |
||
| PDE1A | 23 (18%) | 103 |
1 (1.00) |
||
| PRB2 | 18 (14%) | 108 |
0.0681 (1.00) |
||
| LUZP2 | 9 (7%) | 117 |
1 (1.00) |
||
| NRK | 18 (14%) | 108 |
1 (1.00) |
||
| PARM1 | 10 (8%) | 116 |
0.745 (1.00) |
||
| SLC38A4 | 14 (11%) | 112 |
0.254 (1.00) |
||
| PRAMEF11 | 11 (9%) | 115 |
1 (1.00) |
||
| USP17L2 | 13 (10%) | 113 |
0.371 (1.00) |
||
| PRB1 | 10 (8%) | 116 |
0.324 (1.00) |
||
| CYLC2 | 15 (12%) | 111 |
1 (1.00) |
||
| DSG3 | 31 (25%) | 95 |
0.755 (1.00) |
0.00824 (1.00) |
0.67 (1.00) |
| VEGFC | 9 (7%) | 117 |
1 (1.00) |
||
| IL32 | 3 (2%) | 123 |
0.553 (1.00) |
||
| LILRB4 | 18 (14%) | 108 |
0.598 (1.00) |
||
| GLRB | 13 (10%) | 113 |
0.767 (1.00) |
||
| STXBP5L | 27 (21%) | 99 |
0.0321 (1.00) |
0.894 (1.00) |
0.823 (1.00) |
| GML | 6 (5%) | 120 |
0.414 (1.00) |
||
| TLL1 | 27 (21%) | 99 |
0.00458 (0.838) |
0.27 (1.00) |
0.261 (1.00) |
| DEFB118 | 5 (4%) | 121 |
1 (1.00) |
||
| GK2 | 15 (12%) | 111 |
0.00965 (1.00) |
0.525 (1.00) |
0.781 (1.00) |
| OR5J2 | 10 (8%) | 116 |
0.168 (1.00) |
||
| LIN7A | 7 (6%) | 119 |
1 (1.00) |
||
| MUM1L1 | 10 (8%) | 116 |
1 (1.00) |
||
| MARCH11 | 6 (5%) | 120 |
1 (1.00) |
||
| PSG4 | 12 (10%) | 114 |
0.757 (1.00) |
||
| ZIM3 | 10 (8%) | 116 |
0.745 (1.00) |
||
| CLEC14A | 11 (9%) | 115 |
0.326 (1.00) |
||
| OR5H2 | 10 (8%) | 116 |
0.495 (1.00) |
||
| TCEB3C | 19 (15%) | 107 |
0.0679 (1.00) |
||
| PRB4 | 13 (10%) | 113 |
0.88 (1.00) |
0.707 (1.00) |
0.767 (1.00) |
| KLHL4 | 14 (11%) | 112 |
0.37 (1.00) |
0.00656 (1.00) |
0.377 (1.00) |
| HBD | 8 (6%) | 118 |
0.462 (1.00) |
||
| FAM19A1 | 6 (5%) | 120 |
0.668 (1.00) |
||
| LRRIQ4 | 11 (9%) | 115 |
0.528 (1.00) |
||
| SPINK13 | 4 (3%) | 122 |
1 (1.00) |
||
| SNAP91 | 13 (10%) | 113 |
0.767 (1.00) |
||
| LONRF2 | 10 (8%) | 116 |
0.745 (1.00) |
||
| CLCC1 | 7 (6%) | 119 |
1 (1.00) |
||
| KIAA1257 | 7 (6%) | 119 |
0.421 (1.00) |
||
| SIGLEC14 | 5 (4%) | 121 |
0.158 (1.00) |
||
| SPANXN2 | 12 (10%) | 114 |
0.112 (1.00) |
0.533 (1.00) |
|
| DEFB112 | 5 (4%) | 121 |
1 (1.00) |
||
| CD2 | 12 (10%) | 114 |
0.353 (1.00) |
||
| HTR3B | 9 (7%) | 117 |
0.153 (1.00) |
||
| KIR2DL1 | 8 (6%) | 118 |
1 (1.00) |
||
| OR4N2 | 16 (13%) | 110 |
0.433 (1.00) |
0.912 (1.00) |
0.0492 (1.00) |
| ST18 | 26 (21%) | 100 |
1 (1.00) |
||
| TUBB8 | 7 (6%) | 119 |
1 (1.00) |
||
| C2ORF40 | 3 (2%) | 123 |
1 (1.00) |
||
| PRR23B | 8 (6%) | 118 |
1 (1.00) |
||
| TFEC | 12 (10%) | 114 |
0.757 (1.00) |
||
| SGCZ | 14 (11%) | 112 |
1 (1.00) |
||
| TRIM58 | 9 (7%) | 117 |
1 (1.00) |
||
| ANXA10 | 8 (6%) | 118 |
0.986 (1.00) |
0.229 (1.00) |
0.709 (1.00) |
| ZNF844 | 3 (2%) | 123 |
0.553 (1.00) |
||
| SLC14A1 | 10 (8%) | 116 |
0.0133 (1.00) |
||
| C9 | 11 (9%) | 115 |
0.528 (1.00) |
||
| DSG1 | 18 (14%) | 108 |
0.798 (1.00) |
||
| CCDC11 | 13 (10%) | 113 |
1 (1.00) |
||
| MKX | 10 (8%) | 116 |
0.463 (1.00) |
0.176 (1.00) |
0.745 (1.00) |
| OR7D2 | 12 (10%) | 114 |
0.533 (1.00) |
||
| STARD6 | 5 (4%) | 121 |
1 (1.00) |
||
| SPATA8 | 3 (2%) | 123 |
0.553 (1.00) |
||
| GRXCR2 | 11 (9%) | 115 |
1 (1.00) |
||
| OR4A15 | 14 (11%) | 112 |
0.0816 (1.00) |
||
| C4ORF22 | 8 (6%) | 118 |
0.709 (1.00) |
||
| CCDC54 | 10 (8%) | 116 |
0.324 (1.00) |
||
| CRISP2 | 7 (6%) | 119 |
0.705 (1.00) |
||
| MOG | 5 (4%) | 121 |
0.652 (1.00) |
||
| NMS | 7 (6%) | 119 |
0.705 (1.00) |
||
| DEFB115 | 5 (4%) | 121 |
0.158 (1.00) |
||
| UGT2A3 | 12 (10%) | 114 |
0.533 (1.00) |
||
| ZNF98 | 12 (10%) | 114 |
0.757 (1.00) |
||
| ADH1C | 21 (17%) | 105 |
0.466 (1.00) |
||
| HBG2 | 6 (5%) | 120 |
1 (1.00) |
||
| HHLA2 | 9 (7%) | 117 |
1 (1.00) |
||
| IDH1 | 7 (6%) | 119 |
0.257 (1.00) |
||
| OR2L3 | 8 (6%) | 118 |
0.256 (1.00) |
||
| OR4F6 | 9 (7%) | 117 |
0.485 (1.00) |
||
| B2M | 4 (3%) | 122 |
0.296 (1.00) |
||
| ARID2 | 19 (15%) | 107 |
0.44 (1.00) |
||
| LOC649330 | 15 (12%) | 111 |
0.00458 (0.838) |
0.321 (1.00) |
1 (1.00) |
| OR5AC2 | 13 (10%) | 113 |
0.767 (1.00) |
||
| OR5H14 | 6 (5%) | 120 |
0.0852 (1.00) |
||
| SPAG16 | 9 (7%) | 117 |
0.485 (1.00) |
||
| SPRY3 | 7 (6%) | 119 |
1 (1.00) |
||
| STK31 | 22 (17%) | 104 |
1 (1.00) |
||
| TACR3 | 13 (10%) | 113 |
0.767 (1.00) |
||
| SERPINB4 | 16 (13%) | 110 |
0.165 (1.00) |
||
| TSGA13 | 5 (4%) | 121 |
0.158 (1.00) |
||
| GIMAP7 | 10 (8%) | 116 |
0.324 (1.00) |
||
| SDR16C5 | 17 (13%) | 109 |
0.597 (1.00) |
||
| SPOCK3 | 16 (13%) | 110 |
0.0492 (1.00) |
||
| TRHR | 14 (11%) | 112 |
1 (1.00) |
||
| CD96 | 8 (6%) | 118 |
1 (1.00) |
||
| CLEC4E | 9 (7%) | 117 |
0.285 (1.00) |
||
| TPTE | 32 (25%) | 94 |
0.834 (1.00) |
||
| MCART6 | 7 (6%) | 119 |
1 (1.00) |
||
| OR2W1 | 11 (9%) | 115 |
0.207 (1.00) |
||
| MORF4 | 10 (8%) | 116 |
0.745 (1.00) |
||
| RGS18 | 5 (4%) | 121 |
0.158 (1.00) |
||
| BAGE2 | 9 (7%) | 117 |
0.723 (1.00) |
||
| KIAA1644 | 4 (3%) | 122 |
1 (1.00) |
||
| AGXT2 | 13 (10%) | 113 |
0.767 (1.00) |
||
| CLDN4 | 5 (4%) | 121 |
1 (1.00) |
||
| CDH10 | 20 (16%) | 106 |
0.617 (1.00) |
||
| VWC2L | 11 (9%) | 115 |
1 (1.00) |
||
| ABRA | 10 (8%) | 116 |
0.324 (1.00) |
||
| ARPP21 | 22 (17%) | 104 |
0.0151 (1.00) |
0.891 (1.00) |
0.0548 (1.00) |
| NR1H4 | 7 (6%) | 119 |
0.421 (1.00) |
||
| GZMA | 8 (6%) | 118 |
0.709 (1.00) |
||
| DGAT2L6 | 8 (6%) | 118 |
1 (1.00) |
||
| TMCO5A | 6 (5%) | 120 |
0.414 (1.00) |
||
| KRT26 | 7 (6%) | 119 |
1 (1.00) |
||
| CCNE2 | 7 (6%) | 119 |
0.705 (1.00) |
||
| CCK | 3 (2%) | 123 |
1 (1.00) |
||
| ADAMTS20 | 29 (23%) | 97 |
0.281 (1.00) |
||
| MPP7 | 15 (12%) | 111 |
0.262 (1.00) |
0.282 (1.00) |
1 (1.00) |
| FAM155A | 8 (6%) | 118 |
0.14 (1.00) |
P value = 0.00028 (logrank test), Q value = 0.052
Table S1. Gene #60: 'OR52J3 MUTATION STATUS' versus Clinical Feature #1: 'Time to Death'
| nPatients | nDeath | Duration Range (Median), Month | |
|---|---|---|---|
| ALL | 15 | 8 | 0.2 - 131.1 (62.8) |
| OR52J3 MUTATED | 3 | 3 | 10.1 - 32.5 (12.6) |
| OR52J3 WILD-TYPE | 12 | 5 | 0.2 - 131.1 (72.2) |
Figure S1. Get High-res Image Gene #60: 'OR52J3 MUTATION STATUS' versus Clinical Feature #1: 'Time to Death'
P value = 0.000994 (logrank test), Q value = 0.18
Table S2. Gene #82: 'TRAT1 MUTATION STATUS' versus Clinical Feature #1: 'Time to Death'
| nPatients | nDeath | Duration Range (Median), Month | |
|---|---|---|---|
| ALL | 15 | 8 | 0.2 - 131.1 (62.8) |
| TRAT1 MUTATED | 3 | 3 | 10.1 - 32.5 (26.4) |
| TRAT1 WILD-TYPE | 12 | 5 | 0.2 - 131.1 (72.2) |
Figure S2. Get High-res Image Gene #82: 'TRAT1 MUTATION STATUS' versus Clinical Feature #1: 'Time to Death'

-
Mutation data file = SKCM-TM.mutsig.cluster.txt
-
Clinical data file = SKCM.clin.merged.picked.txt
-
Number of patients = 126
-
Number of significantly mutated genes = 149
-
Number of selected clinical features = 3
-
Exclude genes that fewer than K tumors have mutations, K = 3
For survival clinical features, the Kaplan-Meier survival curves of tumors with and without gene mutations were plotted and the statistical significance P values were estimated by logrank test (Bland and Altman 2004) using the 'survdiff' function in R
For continuous numerical clinical features, two-tailed Student's t test with unequal variance (Lehmann and Romano 2005) was applied to compare the clinical values between tumors with and without gene mutations using 't.test' function in R
For binary or multi-class clinical features (nominal or ordinal), two-tailed Fisher's exact tests (Fisher 1922) were used to estimate the P values using the 'fisher.test' function in R
For multiple hypothesis correction, Q value is the False Discovery Rate (FDR) analogue of the P value (Benjamini and Hochberg 1995), defined as the minimum FDR at which the test may be called significant. We used the 'Benjamini and Hochberg' method of 'p.adjust' function in R to convert P values into Q values.
This is an experimental feature. The full results of the analysis summarized in this report can be downloaded from the TCGA Data Coordination Center.