(NRAS_Hotspot_Mutants cohort)
This pipeline uses various statistical tests to identify genes whose promoter methylation levels correlated to selected clinical features.
Testing the association between 17071 genes and 6 clinical features across 42 samples, statistically thresholded by Q value < 0.05, 3 clinical features related to at least one genes.
-
2 genes correlated to 'PRIMARY.SITE.OF.DISEASE'.
-
SNX1 , ARCN1
-
11 genes correlated to 'LYMPH.NODE.METASTASIS'.
-
NUBP2 , PPCS , CRTC2 , RTKN2 , FOXL2 , ...
-
26 genes correlated to 'NEOPLASM.DISEASESTAGE'.
-
C20ORF27 , ABCA7 , PLS1 , DPEP1 , RABAC1 , ...
-
No genes correlated to 'Time to Death', 'AGE', and 'GENDER'.
Complete statistical result table is provided in Supplement Table 1
Table 1. Get Full Table This table shows the clinical features, statistical methods used, and the number of genes that are significantly associated with each clinical feature at Q value < 0.05.
| Clinical feature | Statistical test | Significant genes | Associated with | Associated with | ||
|---|---|---|---|---|---|---|
| Time to Death | Cox regression test | N=0 | ||||
| AGE | Spearman correlation test | N=0 | ||||
| PRIMARY SITE OF DISEASE | ANOVA test | N=2 | ||||
| GENDER | t test | N=0 | ||||
| LYMPH NODE METASTASIS | ANOVA test | N=11 | ||||
| NEOPLASM DISEASESTAGE | ANOVA test | N=26 |
Table S1. Basic characteristics of clinical feature: 'Time to Death'
| Time to Death | Duration (Months) | 2.6-314.5 (median=48.9) |
| censored | N = 20 | |
| death | N = 22 | |
| Significant markers | N = 0 |
Table S2. Basic characteristics of clinical feature: 'AGE'
| AGE | Mean (SD) | 58.07 (15) |
| Significant markers | N = 0 |
Table S3. Basic characteristics of clinical feature: 'PRIMARY.SITE.OF.DISEASE'
| PRIMARY.SITE.OF.DISEASE | Labels | N |
| DISTANT METASTASIS | 8 | |
| REGIONAL CUTANEOUS OR SUBCUTANEOUS TISSUE (INCLUDES SATELLITE AND IN-TRANSIT METASTASIS) | 9 | |
| REGIONAL LYMPH NODE | 25 | |
| Significant markers | N = 2 |
Table S4. Get Full Table List of 2 genes differentially expressed by 'PRIMARY.SITE.OF.DISEASE'
| ANOVA_P | Q | |
|---|---|---|
| SNX1 | 1.93e-07 | 0.00329 |
| ARCN1 | 2.202e-06 | 0.0376 |
Figure S1. Get High-res Image As an example, this figure shows the association of SNX1 to 'PRIMARY.SITE.OF.DISEASE'. P value = 1.93e-07 with ANOVA analysis.
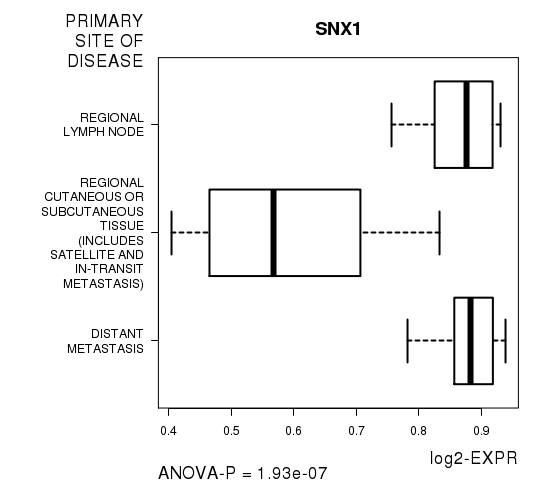
Table S5. Basic characteristics of clinical feature: 'GENDER'
| GENDER | Labels | N |
| FEMALE | 15 | |
| MALE | 27 | |
| Significant markers | N = 0 |
Table S6. Basic characteristics of clinical feature: 'LYMPH.NODE.METASTASIS'
| LYMPH.NODE.METASTASIS | Labels | N |
| N0 | 26 | |
| N1A | 3 | |
| N1B | 4 | |
| N2A | 1 | |
| N2B | 2 | |
| N3 | 3 | |
| Significant markers | N = 11 |
Table S7. Get Full Table List of top 10 genes differentially expressed by 'LYMPH.NODE.METASTASIS'
| ANOVA_P | Q | |
|---|---|---|
| NUBP2 | 3.288e-21 | 5.61e-17 |
| PPCS | 2.783e-15 | 4.75e-11 |
| CRTC2 | 2.365e-11 | 4.04e-07 |
| RTKN2 | 9.674e-09 | 0.000165 |
| FOXL2 | 1.025e-07 | 0.00175 |
| IL20RB | 1.811e-07 | 0.00309 |
| AKR7L | 2.994e-07 | 0.00511 |
| PRG2 | 4.733e-07 | 0.00808 |
| ZAR1L | 1.363e-06 | 0.0233 |
| TFIP11 | 1.676e-06 | 0.0286 |
Figure S2. Get High-res Image As an example, this figure shows the association of NUBP2 to 'LYMPH.NODE.METASTASIS'. P value = 3.29e-21 with ANOVA analysis.
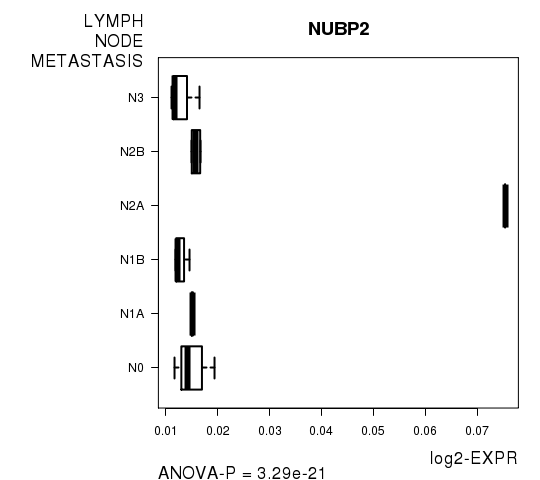
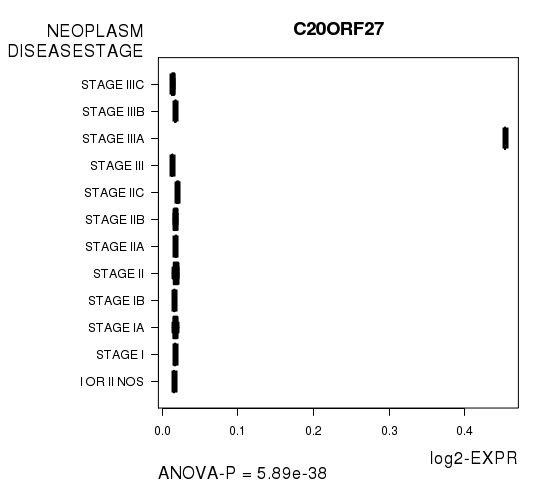
Table S8. Basic characteristics of clinical feature: 'NEOPLASM.DISEASESTAGE'
| NEOPLASM.DISEASESTAGE | Labels | N |
| I OR II NOS | 1 | |
| STAGE I | 3 | |
| STAGE IA | 4 | |
| STAGE IB | 5 | |
| STAGE II | 4 | |
| STAGE IIA | 3 | |
| STAGE IIB | 4 | |
| STAGE IIC | 2 | |
| STAGE III | 1 | |
| STAGE IIIA | 1 | |
| STAGE IIIB | 6 | |
| STAGE IIIC | 5 | |
| Significant markers | N = 26 |
Table S9. Get Full Table List of top 10 genes differentially expressed by 'NEOPLASM.DISEASESTAGE'
| ANOVA_P | Q | |
|---|---|---|
| C20ORF27 | 5.893e-38 | 1.01e-33 |
| ABCA7 | 2.412e-29 | 4.12e-25 |
| PLS1 | 4.38e-24 | 7.48e-20 |
| DPEP1 | 4.515e-19 | 7.71e-15 |
| RABAC1 | 1.64e-16 | 2.8e-12 |
| DYSFIP1 | 1.798e-16 | 3.07e-12 |
| APCDD1L | 3.935e-16 | 6.71e-12 |
| ZNF350 | 2.633e-15 | 4.49e-11 |
| KIAA0146 | 3.187e-15 | 5.44e-11 |
| TULP2 | 1.062e-14 | 1.81e-10 |
Figure S3. Get High-res Image As an example, this figure shows the association of C20ORF27 to 'NEOPLASM.DISEASESTAGE'. P value = 5.89e-38 with ANOVA analysis.
-
Expresson data file = SKCM-NRAS_Hotspot_Mutants.meth.for_correlation.filtered_data.txt
-
Clinical data file = SKCM-NRAS_Hotspot_Mutants.clin.merged.picked.txt
-
Number of patients = 42
-
Number of genes = 17071
-
Number of clinical features = 6
For survival clinical features, Wald's test in univariate Cox regression analysis with proportional hazards model (Andersen and Gill 1982) was used to estimate the P values using the 'coxph' function in R. Kaplan-Meier survival curves were plot using the four quartile subgroups of patients based on expression levels
For continuous numerical clinical features, Spearman's rank correlation coefficients (Spearman 1904) and two-tailed P values were estimated using 'cor.test' function in R
For multi-class clinical features (ordinal or nominal), one-way analysis of variance (Howell 2002) was applied to compare the log2-expression levels between different clinical classes using 'anova' function in R
For two-class clinical features, two-tailed Student's t test with unequal variance (Lehmann and Romano 2005) was applied to compare the log2-expression levels between the two clinical classes using 't.test' function in R
For multiple hypothesis correction, Q value is the False Discovery Rate (FDR) analogue of the P value (Benjamini and Hochberg 1995), defined as the minimum FDR at which the test may be called significant. We used the 'Benjamini and Hochberg' method of 'p.adjust' function in R to convert P values into Q values.
This is an experimental feature. The full results of the analysis summarized in this report can be downloaded from the TCGA Data Coordination Center.