This report serves to describe the mutational landscape and properties of a given individual set, as well as rank genes and genesets according to mutational significance. MutSig v2.0 was used to generate the results found in this report.
-
Working with individual set: THCA-Mut_RAS
-
Number of patients in set: 52
The input for this pipeline is a set of individuals with the following files associated for each:
-
An annotated .maf file describing the mutations called for the respective individual, and their properties.
-
A .wig file that contains information about the coverage of the sample.
-
MAF used for this analysis:THCA-Mut_RAS.final_analysis_set.maf
-
Significantly mutated genes (q ≤ 0.1): 4
-
Mutations seen in COSMIC: 53
-
Significantly mutated genes in COSMIC territory: 3
-
Genes with clustered mutations (≤ 3 aa apart): 5
-
Significantly mutated genesets: 80
-
Significantly mutated genesets: (excluding sig. mutated genes):0
-
Read 52 MAFs of type "Broad"
-
Total number of mutations in input MAFs: 924
-
After removing 7 noncoding mutations: 917
-
After collapsing adjacent/redundant mutations: 868
-
Number of mutations before filtering: 868
-
After removing 37 mutations outside gene set: 831
Table 1. Get Full Table Table representing breakdown of mutations by type.
| type | count |
|---|---|
| Frame_Shift_Del | 27 |
| Frame_Shift_Ins | 3 |
| In_Frame_Del | 4 |
| Missense_Mutation | 543 |
| Nonsense_Mutation | 34 |
| Nonstop_Mutation | 1 |
| Silent | 189 |
| Splice_Site | 30 |
| Total | 831 |
Table 2. Get Full Table A breakdown of mutation rates per category discovered for this individual set.
| category | n | N | rate | rate_per_mb | relative_rate | exp_ns_s_ratio |
|---|---|---|---|---|---|---|
| *CpG->T | 121 | 84478677 | 1.4e-06 | 1.4 | 3.4 | 2.1 |
| *Cp(A/C/T)->T | 90 | 691246206 | 1.3e-07 | 0.13 | 0.31 | 1.7 |
| A->G | 145 | 744150021 | 1.9e-07 | 0.19 | 0.46 | 2.3 |
| transver | 187 | 1519874904 | 1.2e-07 | 0.12 | 0.29 | 5 |
| indel+null | 99 | 1519874904 | 6.5e-08 | 0.065 | 0.15 | NaN |
| double_null | 0 | 1519874904 | 0 | 0 | 0 | NaN |
| Total | 642 | 1519874904 | 4.2e-07 | 0.42 | 1 | 3.5 |
The x axis represents the samples. The y axis represents the exons, one row per exon, and they are sorted by average coverage across samples. For exons with exactly the same average coverage, they are sorted next by the %GC of the exon. (The secondary sort is especially useful for the zero-coverage exons at the bottom).
Figure 1.
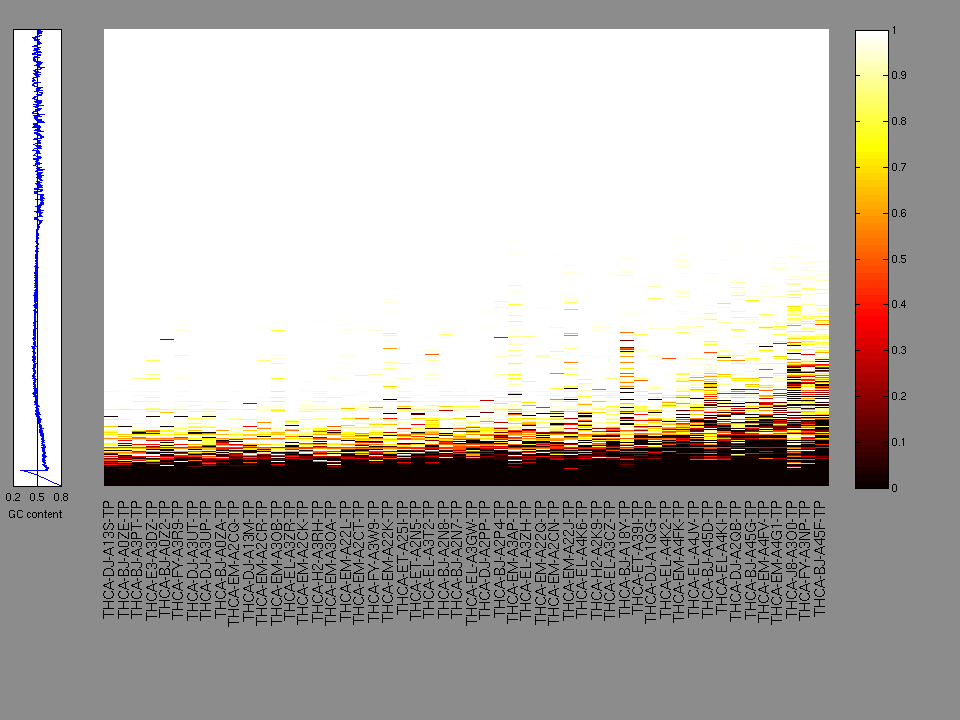
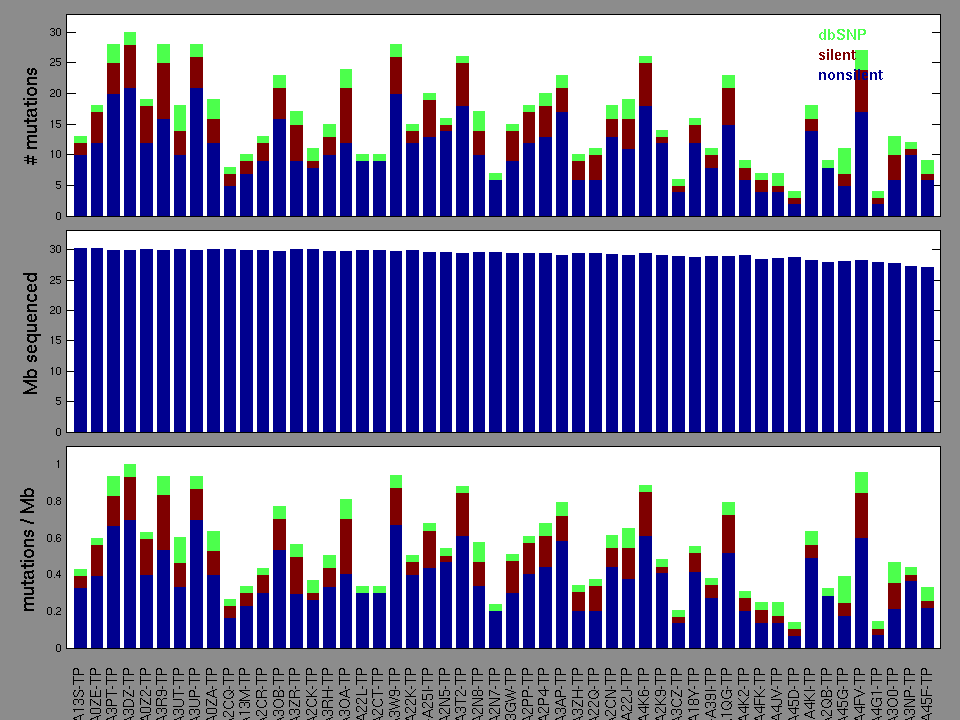
Figure 2. Patients counts and rates file used to generate this plot: THCA-Mut_RAS.patients.counts_and_rates.txt
The mutation spectrum is depicted in the lego plots below in which the 96 possible mutation types are subdivided into six large blocks, color-coded to reflect the base substitution type. Each large block is further subdivided into the 16 possible pairs of 5' and 3' neighbors, as listed in the 4x4 trinucleotide context legend. The height of each block corresponds to the mutation frequency for that kind of mutation (counts of mutations normalized by the base coverage in a given bin). The shape of the spectrum is a signature for dominant mutational mechanisms in different tumor types.
Figure 3. Get High-res Image SNV Mutation rate lego plot for entire set. Each bin is normalized by base coverage for that bin. Colors represent the six SNV types on the upper right. The three-base context for each mutation is labeled in the 4x4 legend on the lower right. The fractional breakdown of SNV counts is shown in the pie chart on the upper left. If this figure is blank, not enough information was provided in the MAF to generate it.
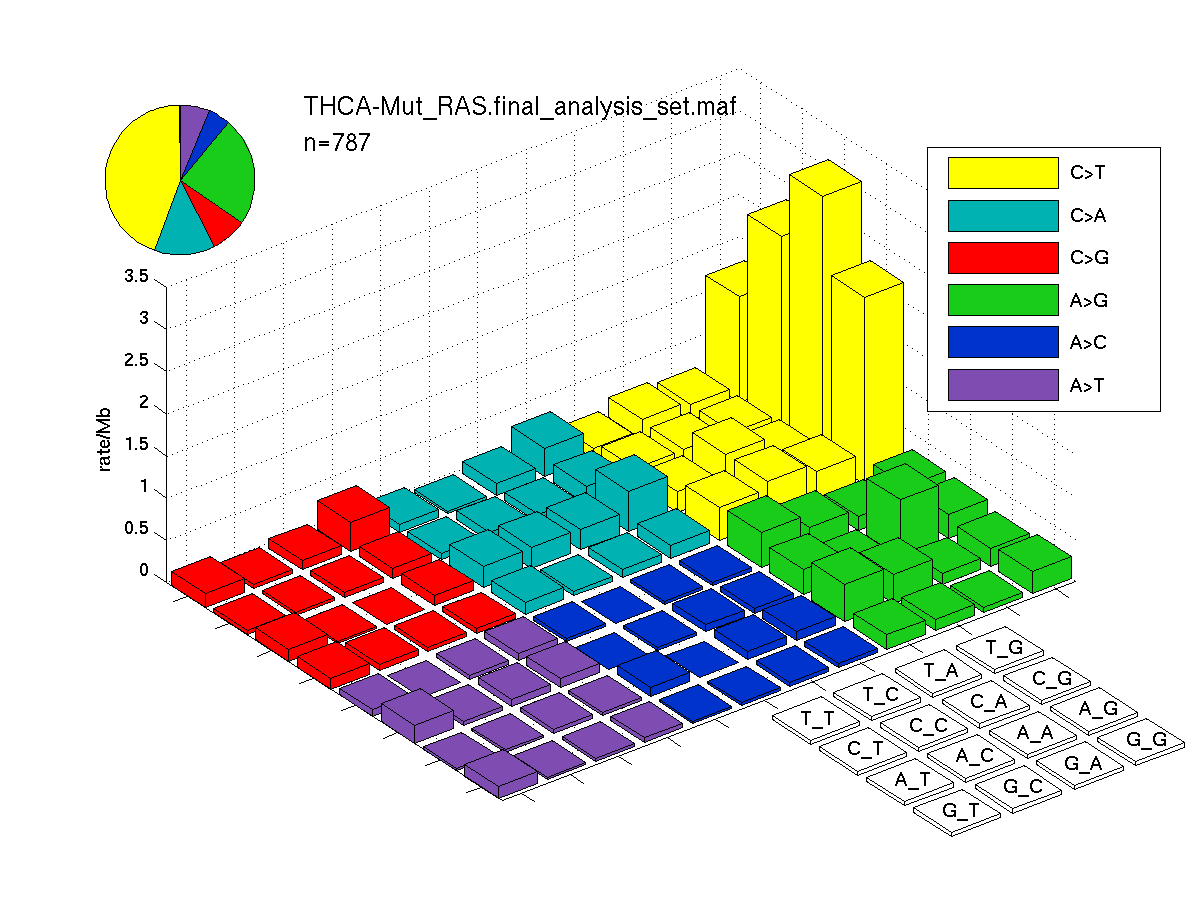
Figure 4. Get High-res Image SNV Mutation rate lego plots for 4 slices of mutation allele fraction (0<=AF<0.1, 0.1<=AF<0.25, 0.25<=AF<0.5, & 0.5<=AF) . The color code and three-base context legends are the same as the previous figure. If this figure is blank, not enough information was provided in the MAF to generate it.
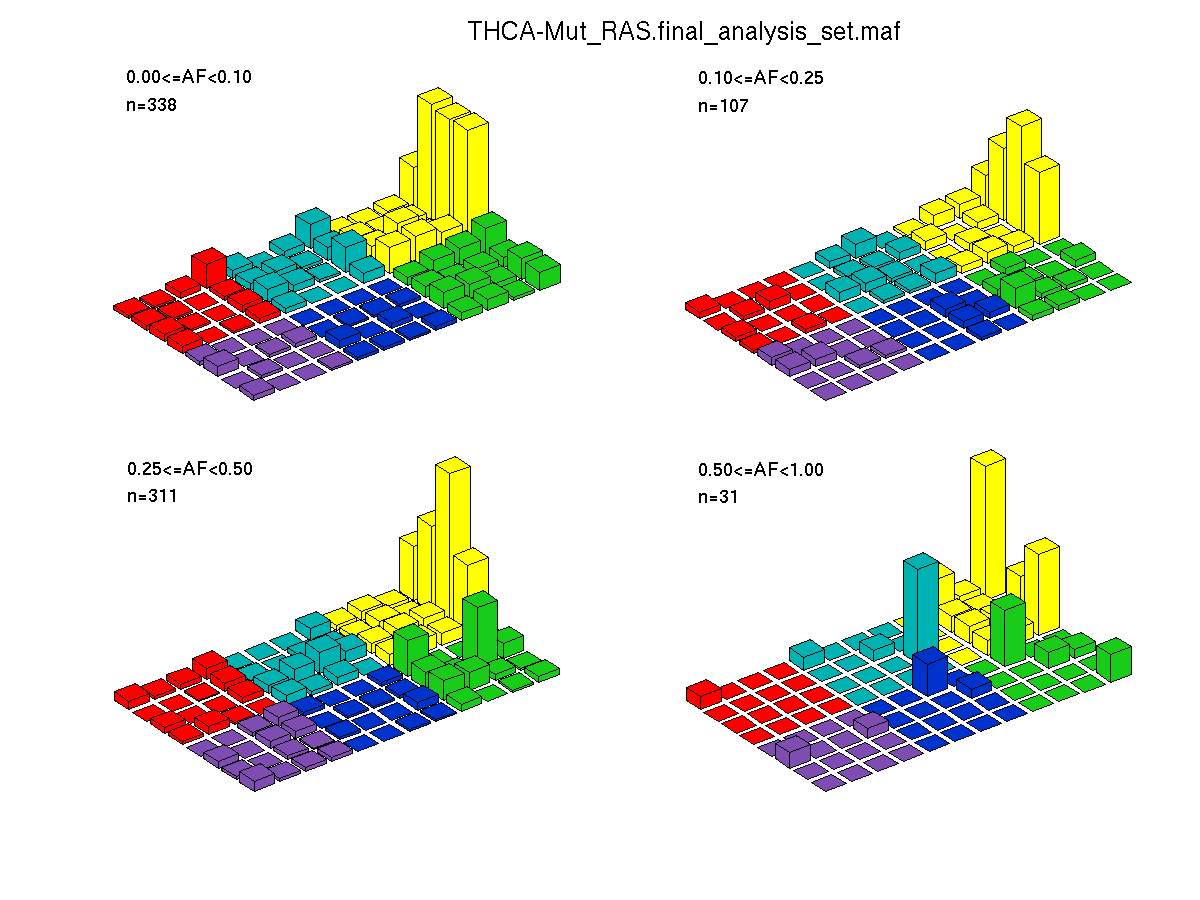
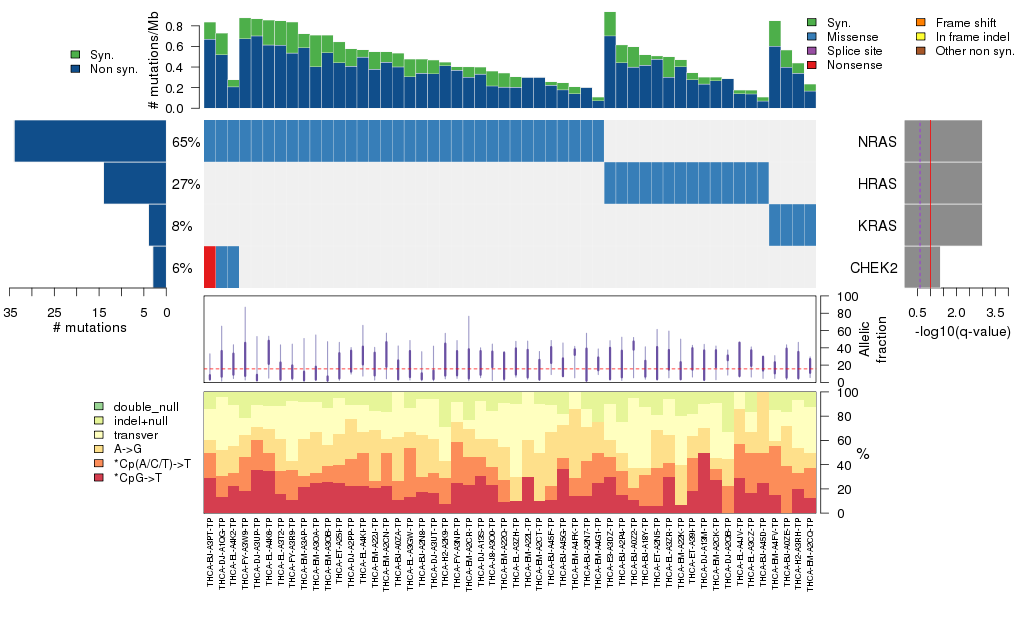
Figure 5. Get High-res Image The matrix in the center of the figure represents individual mutations in patient samples, color-coded by type of mutation, for the significantly mutated genes. The rate of synonymous and non-synonymous mutations is displayed at the top of the matrix. The barplot on the left of the matrix shows the number of mutations in each gene. The percentages represent the fraction of tumors with at least one mutation in the specified gene. The barplot to the right of the matrix displays the q-values for the most significantly mutated genes. The purple boxplots below the matrix (only displayed if required columns are present in the provided MAF) represent the distributions of allelic fractions observed in each sample. The plot at the bottom represents the base substitution distribution of individual samples, using the same categories that were used to calculate significance.
Column Descriptions:
-
N = number of sequenced bases in this gene across the individual set
-
n = number of (nonsilent) mutations in this gene across the individual set
-
npat = number of patients (individuals) with at least one nonsilent mutation
-
nsite = number of unique sites having a non-silent mutation
-
nsil = number of silent mutations in this gene across the individual set
-
n1 = number of nonsilent mutations of type: *CpG->T
-
n2 = number of nonsilent mutations of type: *Cp(A/C/T)->T
-
n3 = number of nonsilent mutations of type: A->G
-
n4 = number of nonsilent mutations of type: transver
-
n5 = number of nonsilent mutations of type: indel+null
-
n6 = number of nonsilent mutations of type: double_null
-
p_classic = p-value for the observed amount of nonsilent mutations being elevated in this gene
-
p_ns_s = p-value for the observed nonsilent/silent ratio being elevated in this gene
-
p_cons = p-value for enrichment of mutations at evolutionarily most-conserved sites in gene
-
p_joint = p-value for clustering + conservation
-
p = p-value (overall)
-
q = q-value, False Discovery Rate (Benjamini-Hochberg procedure)
Table 3. Get Full Table A Ranked List of Significantly Mutated Genes. Number of significant genes found: 4. Number of genes displayed: 35. Click on a gene name to display its stick figure depicting the distribution of mutations and mutation types across the chosen gene (this feature may not be available for all significant genes).
| rank | gene | description | N | n | npat | nsite | nsil | n1 | n2 | n3 | n4 | n5 | n6 | p_classic | p_ns_s | p_clust | p_cons | p_joint | p | q |
|---|---|---|---|---|---|---|---|---|---|---|---|---|---|---|---|---|---|---|---|---|
| 1 | NRAS | neuroblastoma RAS viral (v-ras) oncogene homolog | 30461 | 34 | 34 | 2 | 0 | 0 | 0 | 27 | 7 | 0 | 0 | 3.4e-15 | 8.8e-06 | 0 | 0.00022 | 0 | <1.00e-15 | <9.04e-12 |
| 2 | HRAS | v-Ha-ras Harvey rat sarcoma viral oncogene homolog | 33709 | 14 | 14 | 2 | 0 | 0 | 0 | 11 | 3 | 0 | 0 | 4.2e-15 | 0.094 | 0 | 0.00014 | 0 | <1.00e-15 | <9.04e-12 |
| 3 | KRAS | v-Ki-ras2 Kirsten rat sarcoma viral oncogene homolog | 35034 | 4 | 4 | 3 | 0 | 0 | 0 | 1 | 3 | 0 | 0 | 9.6e-10 | 0.41 | 0.037 | 0.003 | 0.0023 | 6.23e-11 | 3.75e-07 |
| 4 | CHEK2 | CHK2 checkpoint homolog (S. pombe) | 81086 | 3 | 3 | 3 | 0 | 0 | 0 | 0 | 2 | 1 | 0 | 4.3e-06 | 0.6 | 0.044 | 0.67 | 0.13 | 8.80e-06 | 0.0398 |
| 5 | EFCAB1 | EF-hand calcium binding domain 1 | 33293 | 1 | 1 | 1 | 0 | 1 | 0 | 0 | 0 | 0 | 0 | 0.0001 | 0.86 | NaN | NaN | NaN | 0.000105 | 0.372 |
| 6 | DNAJC11 | DnaJ (Hsp40) homolog, subfamily C, member 11 | 87491 | 2 | 2 | 2 | 0 | 0 | 0 | 1 | 1 | 0 | 0 | 0.00028 | 0.61 | 0.012 | 0.14 | 0.035 | 0.000123 | 0.372 |
| 7 | KRTAP4-12 | keratin associated protein 4-12 | 30663 | 1 | 1 | 1 | 0 | 1 | 0 | 0 | 0 | 0 | 0 | 0.00023 | 1 | NaN | NaN | NaN | 0.000230 | 0.501 |
| 8 | UNC50 | unc-50 homolog (C. elegans) | 40497 | 1 | 1 | 1 | 0 | 1 | 0 | 0 | 0 | 0 | 0 | 0.00028 | 0.72 | NaN | NaN | NaN | 0.000278 | 0.501 |
| 9 | FAM131C | family with sequence similarity 131, member C | 27503 | 1 | 1 | 1 | 0 | 0 | 0 | 0 | 0 | 1 | 0 | 0.00028 | 0.58 | NaN | NaN | NaN | 0.000280 | 0.501 |
| 10 | TG | thyroglobulin | 435860 | 3 | 3 | 3 | 1 | 0 | 0 | 1 | 1 | 1 | 0 | 0.000094 | 0.81 | 0.17 | 0.97 | 0.3 | 0.000320 | 0.501 |
| 11 | RBM7 | RNA binding motif protein 7 | 42503 | 1 | 1 | 1 | 0 | 1 | 0 | 0 | 0 | 0 | 0 | 0.00032 | 0.71 | NaN | NaN | NaN | 0.000324 | 0.501 |
| 12 | EEF1A1 | eukaryotic translation elongation factor 1 alpha 1 | 69958 | 2 | 2 | 2 | 0 | 0 | 0 | 1 | 0 | 1 | 0 | 0.000052 | 0.67 | 0.38 | 0.99 | 0.56 | 0.000332 | 0.501 |
| 13 | PCDHGC5 | protocadherin gamma subfamily C, 5 | 150148 | 2 | 2 | 2 | 1 | 0 | 0 | 1 | 1 | 0 | 0 | 0.00037 | 0.79 | NaN | NaN | NaN | 0.000373 | 0.519 |
| 14 | HOXA1 | homeobox A1 | 52824 | 1 | 1 | 1 | 0 | 0 | 0 | 1 | 0 | 0 | 0 | 0.00049 | 0.78 | NaN | NaN | NaN | 0.000489 | 0.632 |
| 15 | SLA | Src-like-adaptor | 42997 | 2 | 2 | 2 | 0 | 0 | 0 | 1 | 0 | 1 | 0 | 0.000058 | 0.76 | 0.69 | 0.9 | 1 | 0.000628 | 0.721 |
| 16 | OR5T2 | olfactory receptor, family 5, subfamily T, member 2 | 55921 | 1 | 1 | 1 | 0 | 1 | 0 | 0 | 0 | 0 | 0 | 0.00064 | 0.64 | NaN | NaN | NaN | 0.000638 | 0.721 |
| 17 | GIP | gastric inhibitory polypeptide | 22398 | 1 | 1 | 1 | 0 | 0 | 1 | 0 | 0 | 0 | 0 | 0.00073 | 0.55 | NaN | NaN | NaN | 0.000733 | 0.779 |
| 18 | CACNA2D1 | calcium channel, voltage-dependent, alpha 2/delta subunit 1 | 159056 | 2 | 2 | 2 | 0 | 0 | 0 | 0 | 1 | 1 | 0 | 0.00069 | 0.85 | 0.098 | 0.13 | 0.12 | 0.000862 | 0.805 |
| 19 | GRAMD2 | GRAM domain containing 2 | 55493 | 2 | 2 | 2 | 0 | 0 | 0 | 1 | 1 | 0 | 0 | 0.00015 | 0.63 | 0.65 | 0.21 | 0.55 | 0.000872 | 0.805 |
| 20 | NBPF14 | neuroblastoma breakpoint family, member 14 | 80732 | 1 | 1 | 1 | 0 | 0 | 0 | 0 | 0 | 1 | 0 | 0.00096 | 1 | NaN | NaN | NaN | 0.000963 | 0.805 |
| 21 | XPNPEP1 | X-prolyl aminopeptidase (aminopeptidase P) 1, soluble | 100645 | 1 | 1 | 1 | 0 | 1 | 0 | 0 | 0 | 0 | 0 | 0.00097 | 0.67 | NaN | NaN | NaN | 0.000970 | 0.805 |
| 22 | SH2D6 | SH2 domain containing 6 | 21841 | 1 | 1 | 1 | 0 | 0 | 1 | 0 | 0 | 0 | 0 | 0.00098 | 0.6 | NaN | NaN | NaN | 0.000980 | 0.805 |
| 23 | KRTAP8-1 | keratin associated protein 8-1 | 10119 | 1 | 1 | 1 | 0 | 0 | 1 | 0 | 0 | 0 | 0 | 0.001 | 0.62 | NaN | NaN | NaN | 0.00102 | 0.805 |
| 24 | DEFB119 | defensin, beta 119 | 26877 | 1 | 1 | 1 | 0 | 1 | 0 | 0 | 0 | 0 | 0 | 0.0011 | 0.9 | NaN | NaN | NaN | 0.00110 | 0.830 |
| 25 | MPV17L | MPV17 mitochondrial membrane protein-like | 13553 | 1 | 1 | 1 | 0 | 0 | 0 | 0 | 0 | 1 | 0 | 0.0013 | 1 | NaN | NaN | NaN | 0.00126 | 0.876 |
| 26 | KIR3DL2 | killer cell immunoglobulin-like receptor, three domains, long cytoplasmic tail, 2 | 45653 | 1 | 1 | 1 | 0 | 1 | 0 | 0 | 0 | 0 | 0 | 0.0014 | 0.67 | NaN | NaN | NaN | 0.00141 | 0.876 |
| 27 | B3GNT3 | UDP-GlcNAc:betaGal beta-1,3-N-acetylglucosaminyltransferase 3 | 58398 | 1 | 1 | 1 | 0 | 0 | 0 | 0 | 1 | 0 | 0 | 0.0015 | 0.81 | NaN | NaN | NaN | 0.00149 | 0.876 |
| 28 | ZC3H15 | zinc finger CCCH-type containing 15 | 61278 | 1 | 1 | 1 | 0 | 0 | 0 | 0 | 0 | 1 | 0 | 0.0016 | 1 | NaN | NaN | NaN | 0.00159 | 0.876 |
| 29 | ASPSCR1 | alveolar soft part sarcoma chromosome region, candidate 1 | 70268 | 1 | 1 | 1 | 1 | 0 | 0 | 0 | 0 | 1 | 0 | 0.0016 | 1 | NaN | NaN | NaN | 0.00159 | 0.876 |
| 30 | OR4X1 | olfactory receptor, family 4, subfamily X, member 1 | 47541 | 1 | 1 | 1 | 0 | 0 | 1 | 0 | 0 | 0 | 0 | 0.0016 | 0.55 | NaN | NaN | NaN | 0.00162 | 0.876 |
| 31 | ERG | v-ets erythroblastosis virus E26 oncogene homolog (avian) | 75348 | 1 | 1 | 1 | 0 | 0 | 0 | 0 | 1 | 0 | 0 | 0.0016 | 0.84 | NaN | NaN | NaN | 0.00164 | 0.876 |
| 32 | SUOX | sulfite oxidase | 85799 | 1 | 1 | 1 | 0 | 0 | 0 | 0 | 0 | 1 | 0 | 0.0017 | 1 | NaN | NaN | NaN | 0.00167 | 0.876 |
| 33 | LRP10 | low density lipoprotein receptor-related protein 10 | 112525 | 1 | 1 | 1 | 0 | 0 | 0 | 0 | 0 | 1 | 0 | 0.0017 | 0.61 | NaN | NaN | NaN | 0.00173 | 0.876 |
| 34 | MED31 | mediator complex subunit 31 | 20876 | 1 | 1 | 1 | 0 | 0 | 0 | 0 | 1 | 0 | 0 | 0.0018 | 0.88 | NaN | NaN | NaN | 0.00177 | 0.876 |
| 35 | RAP1A | RAP1A, member of RAS oncogene family | 29510 | 1 | 1 | 1 | 0 | 0 | 1 | 0 | 0 | 0 | 0 | 0.0018 | 0.66 | NaN | NaN | NaN | 0.00178 | 0.876 |
Figure S1. This figure depicts the distribution of mutations and mutation types across the NRAS significant gene.
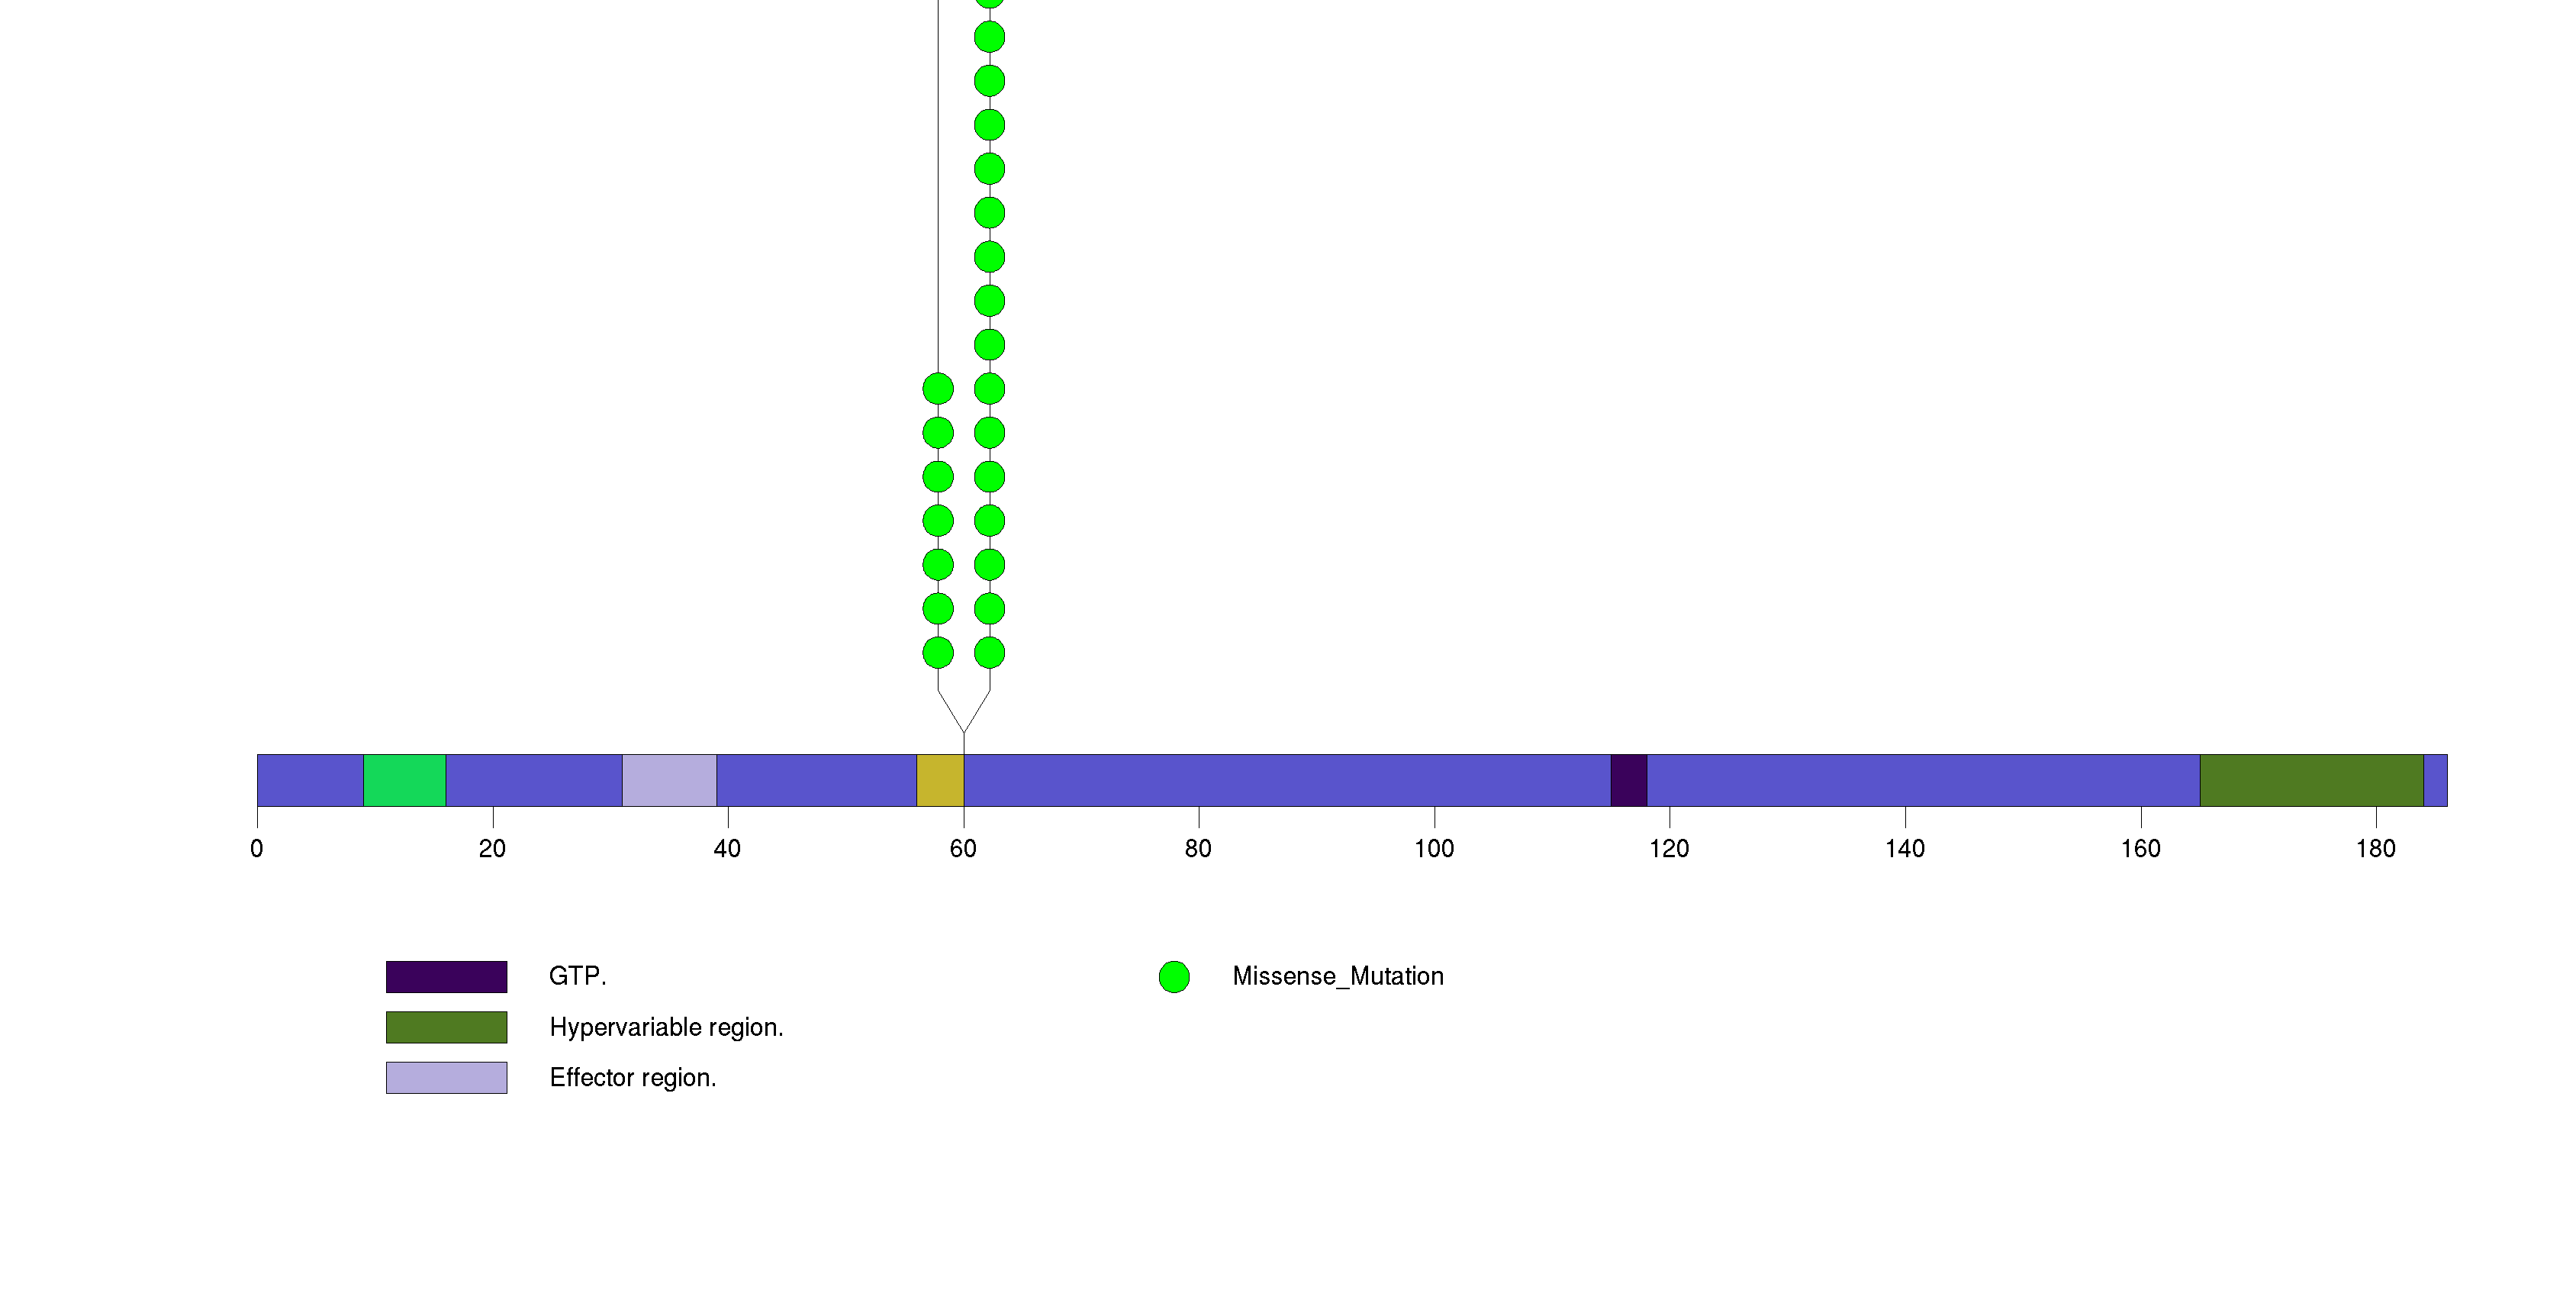
Figure S2. This figure depicts the distribution of mutations and mutation types across the HRAS significant gene.
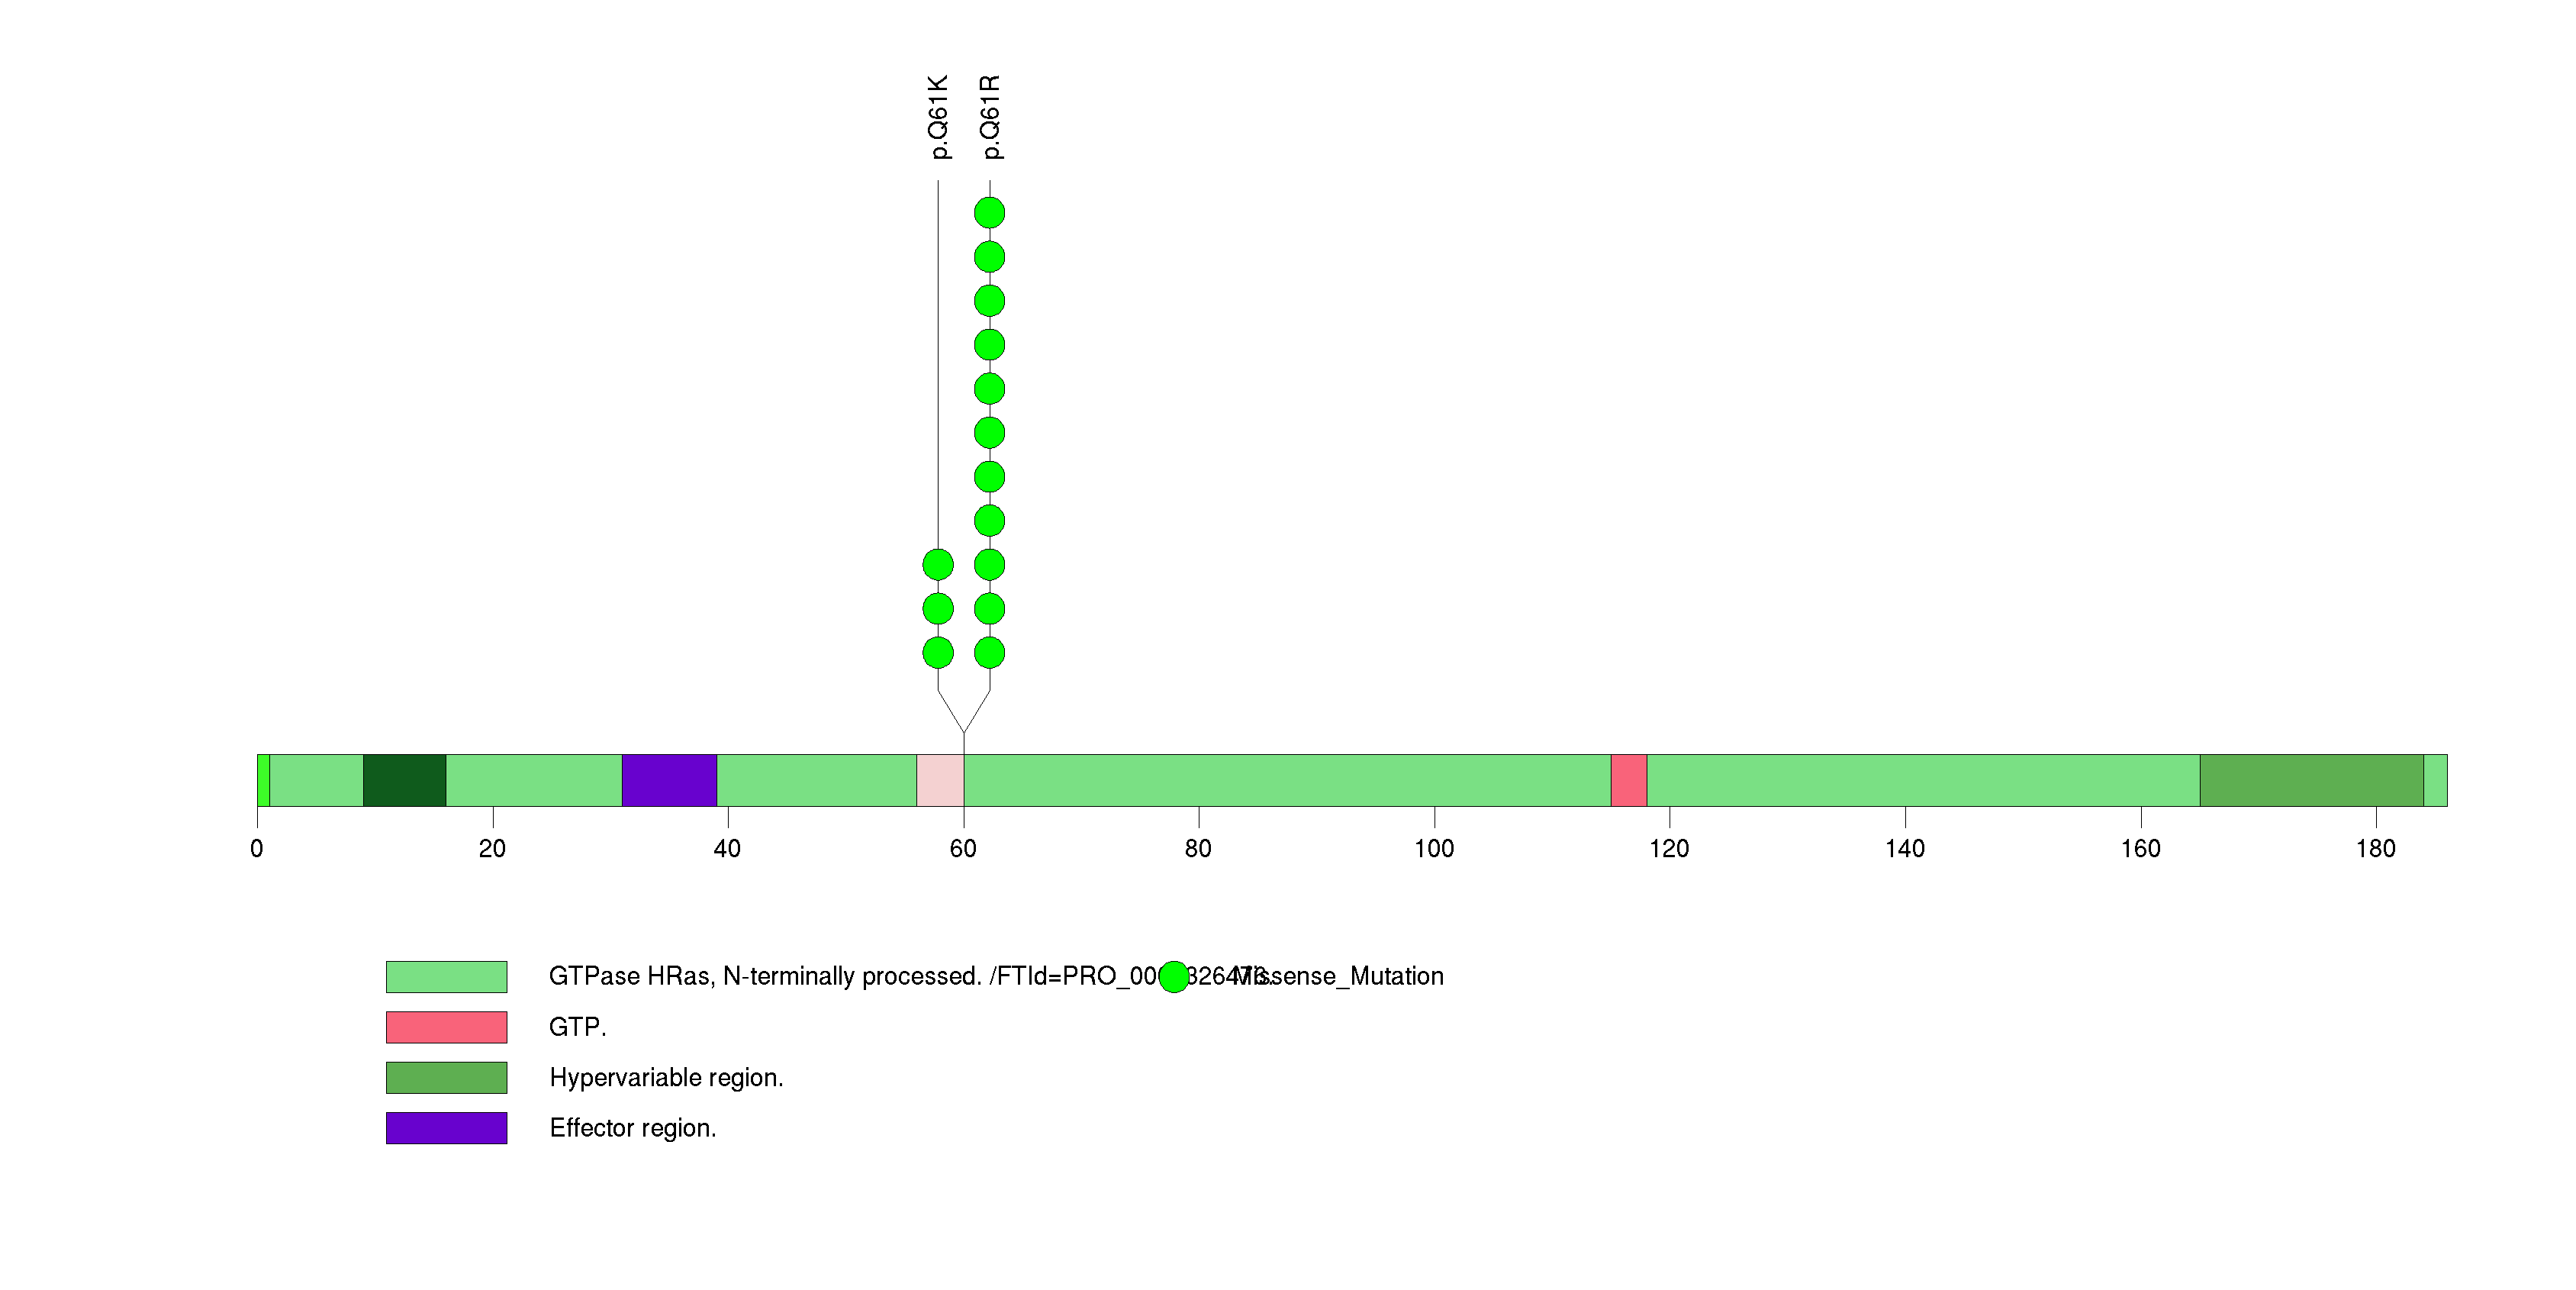
Figure S3. This figure depicts the distribution of mutations and mutation types across the KRAS significant gene.
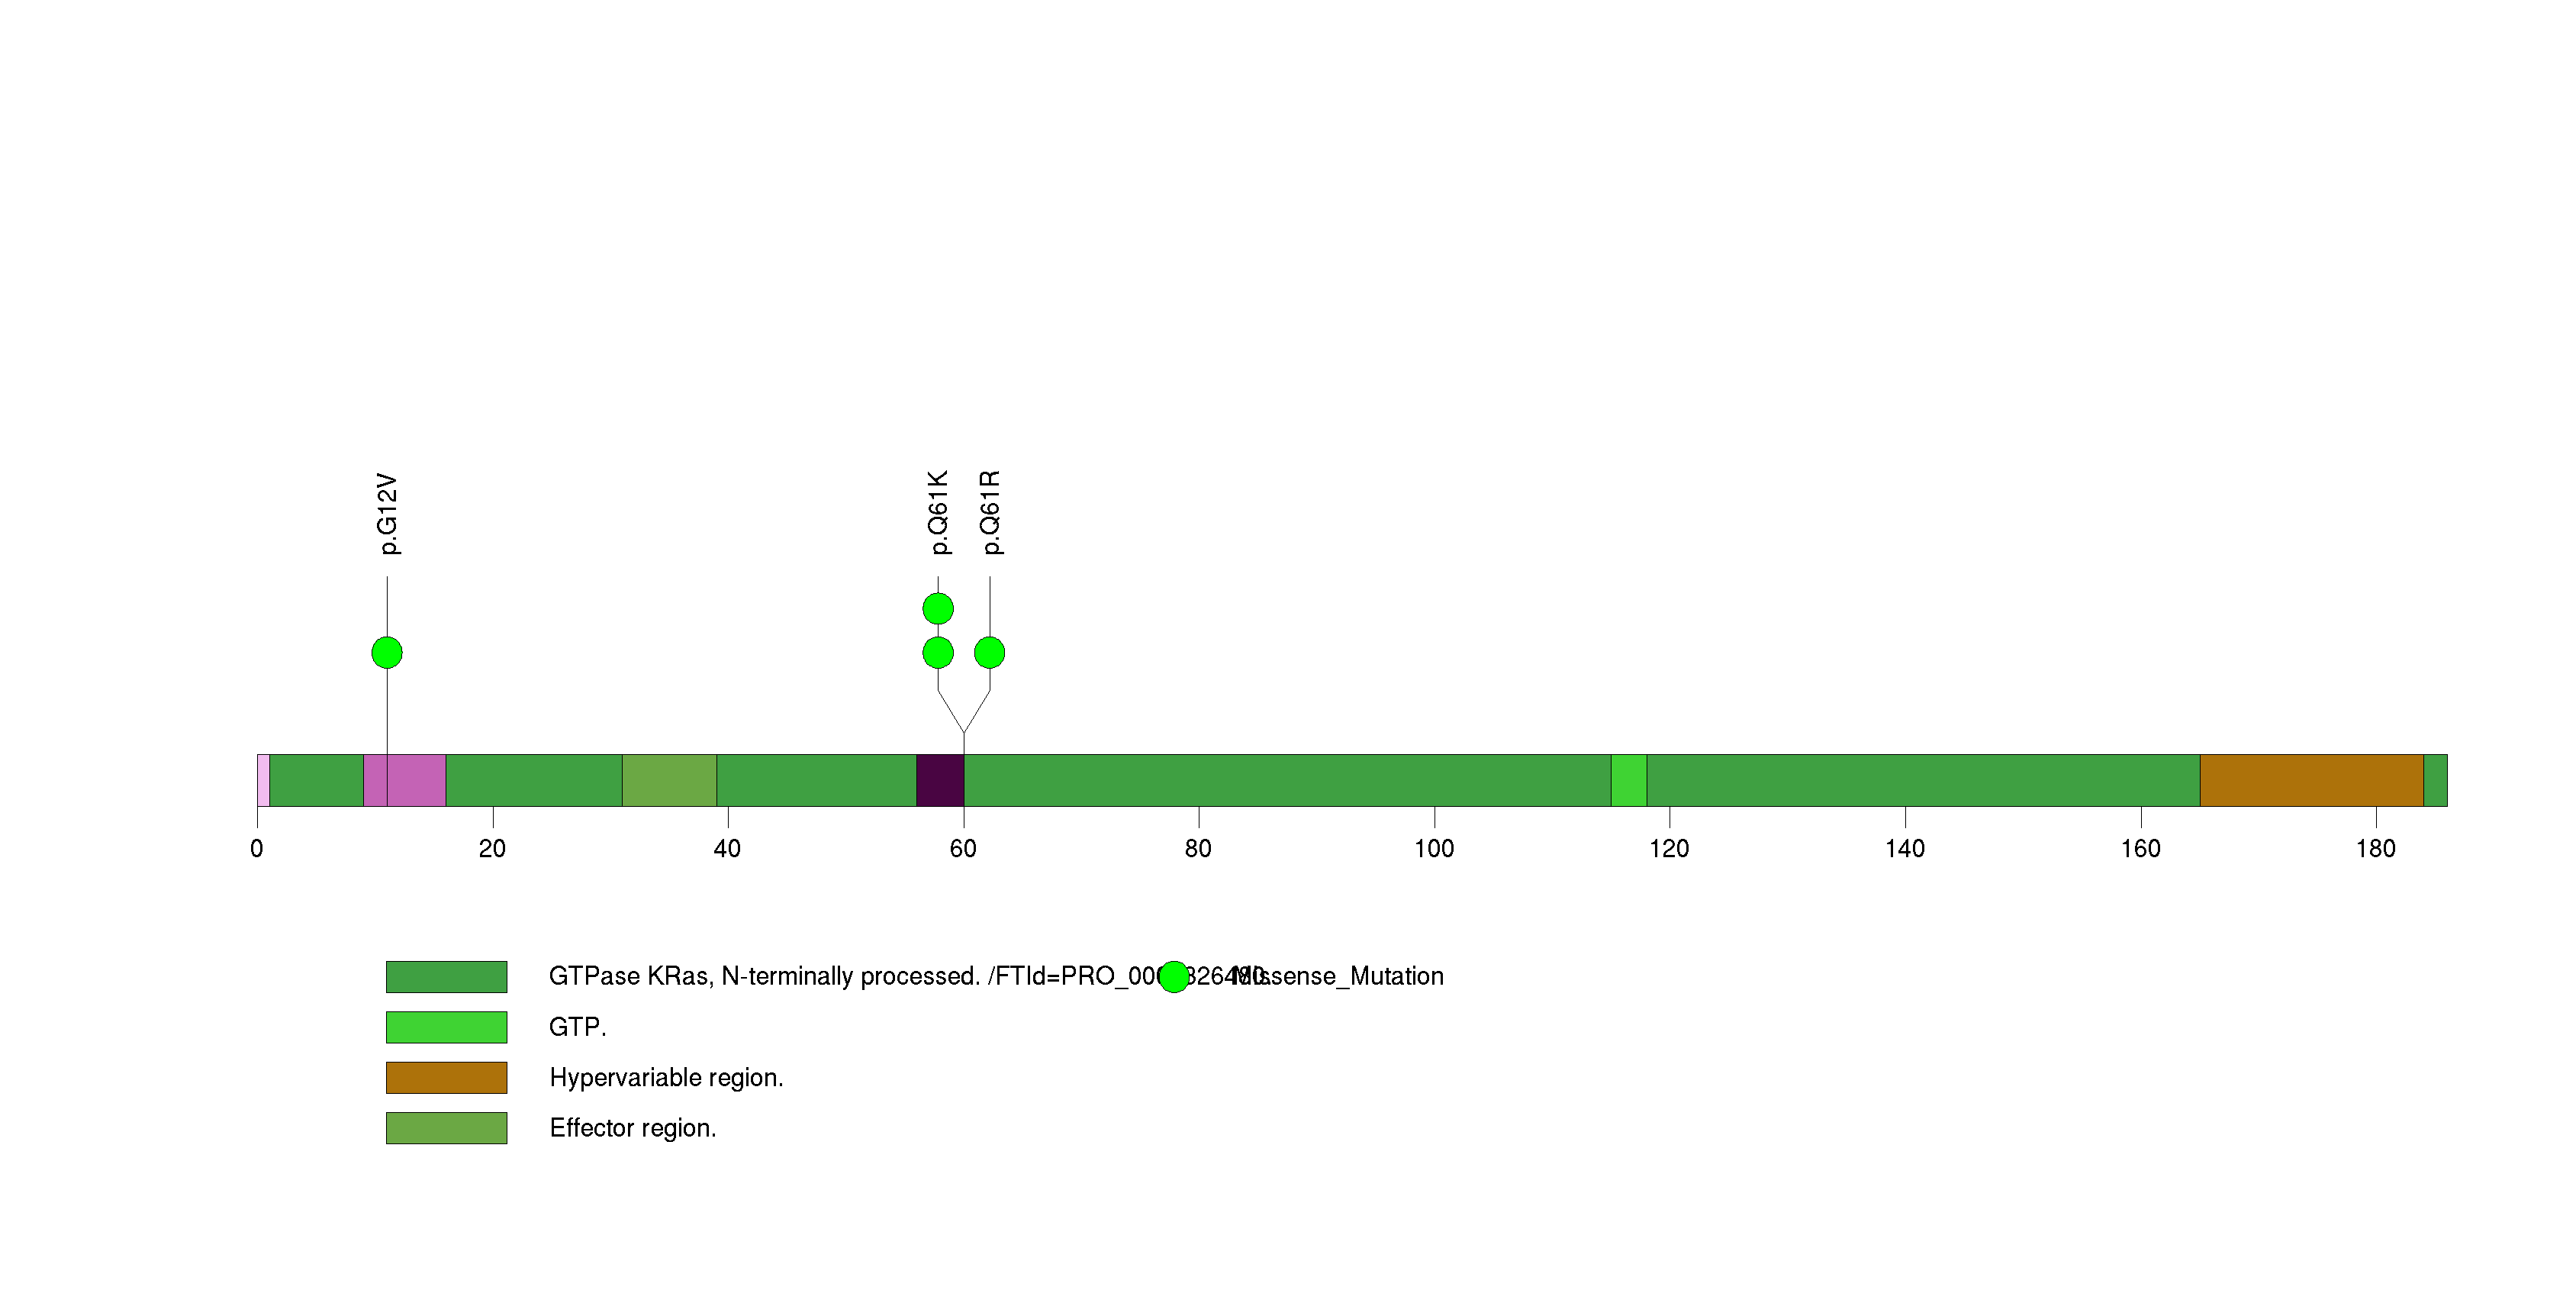
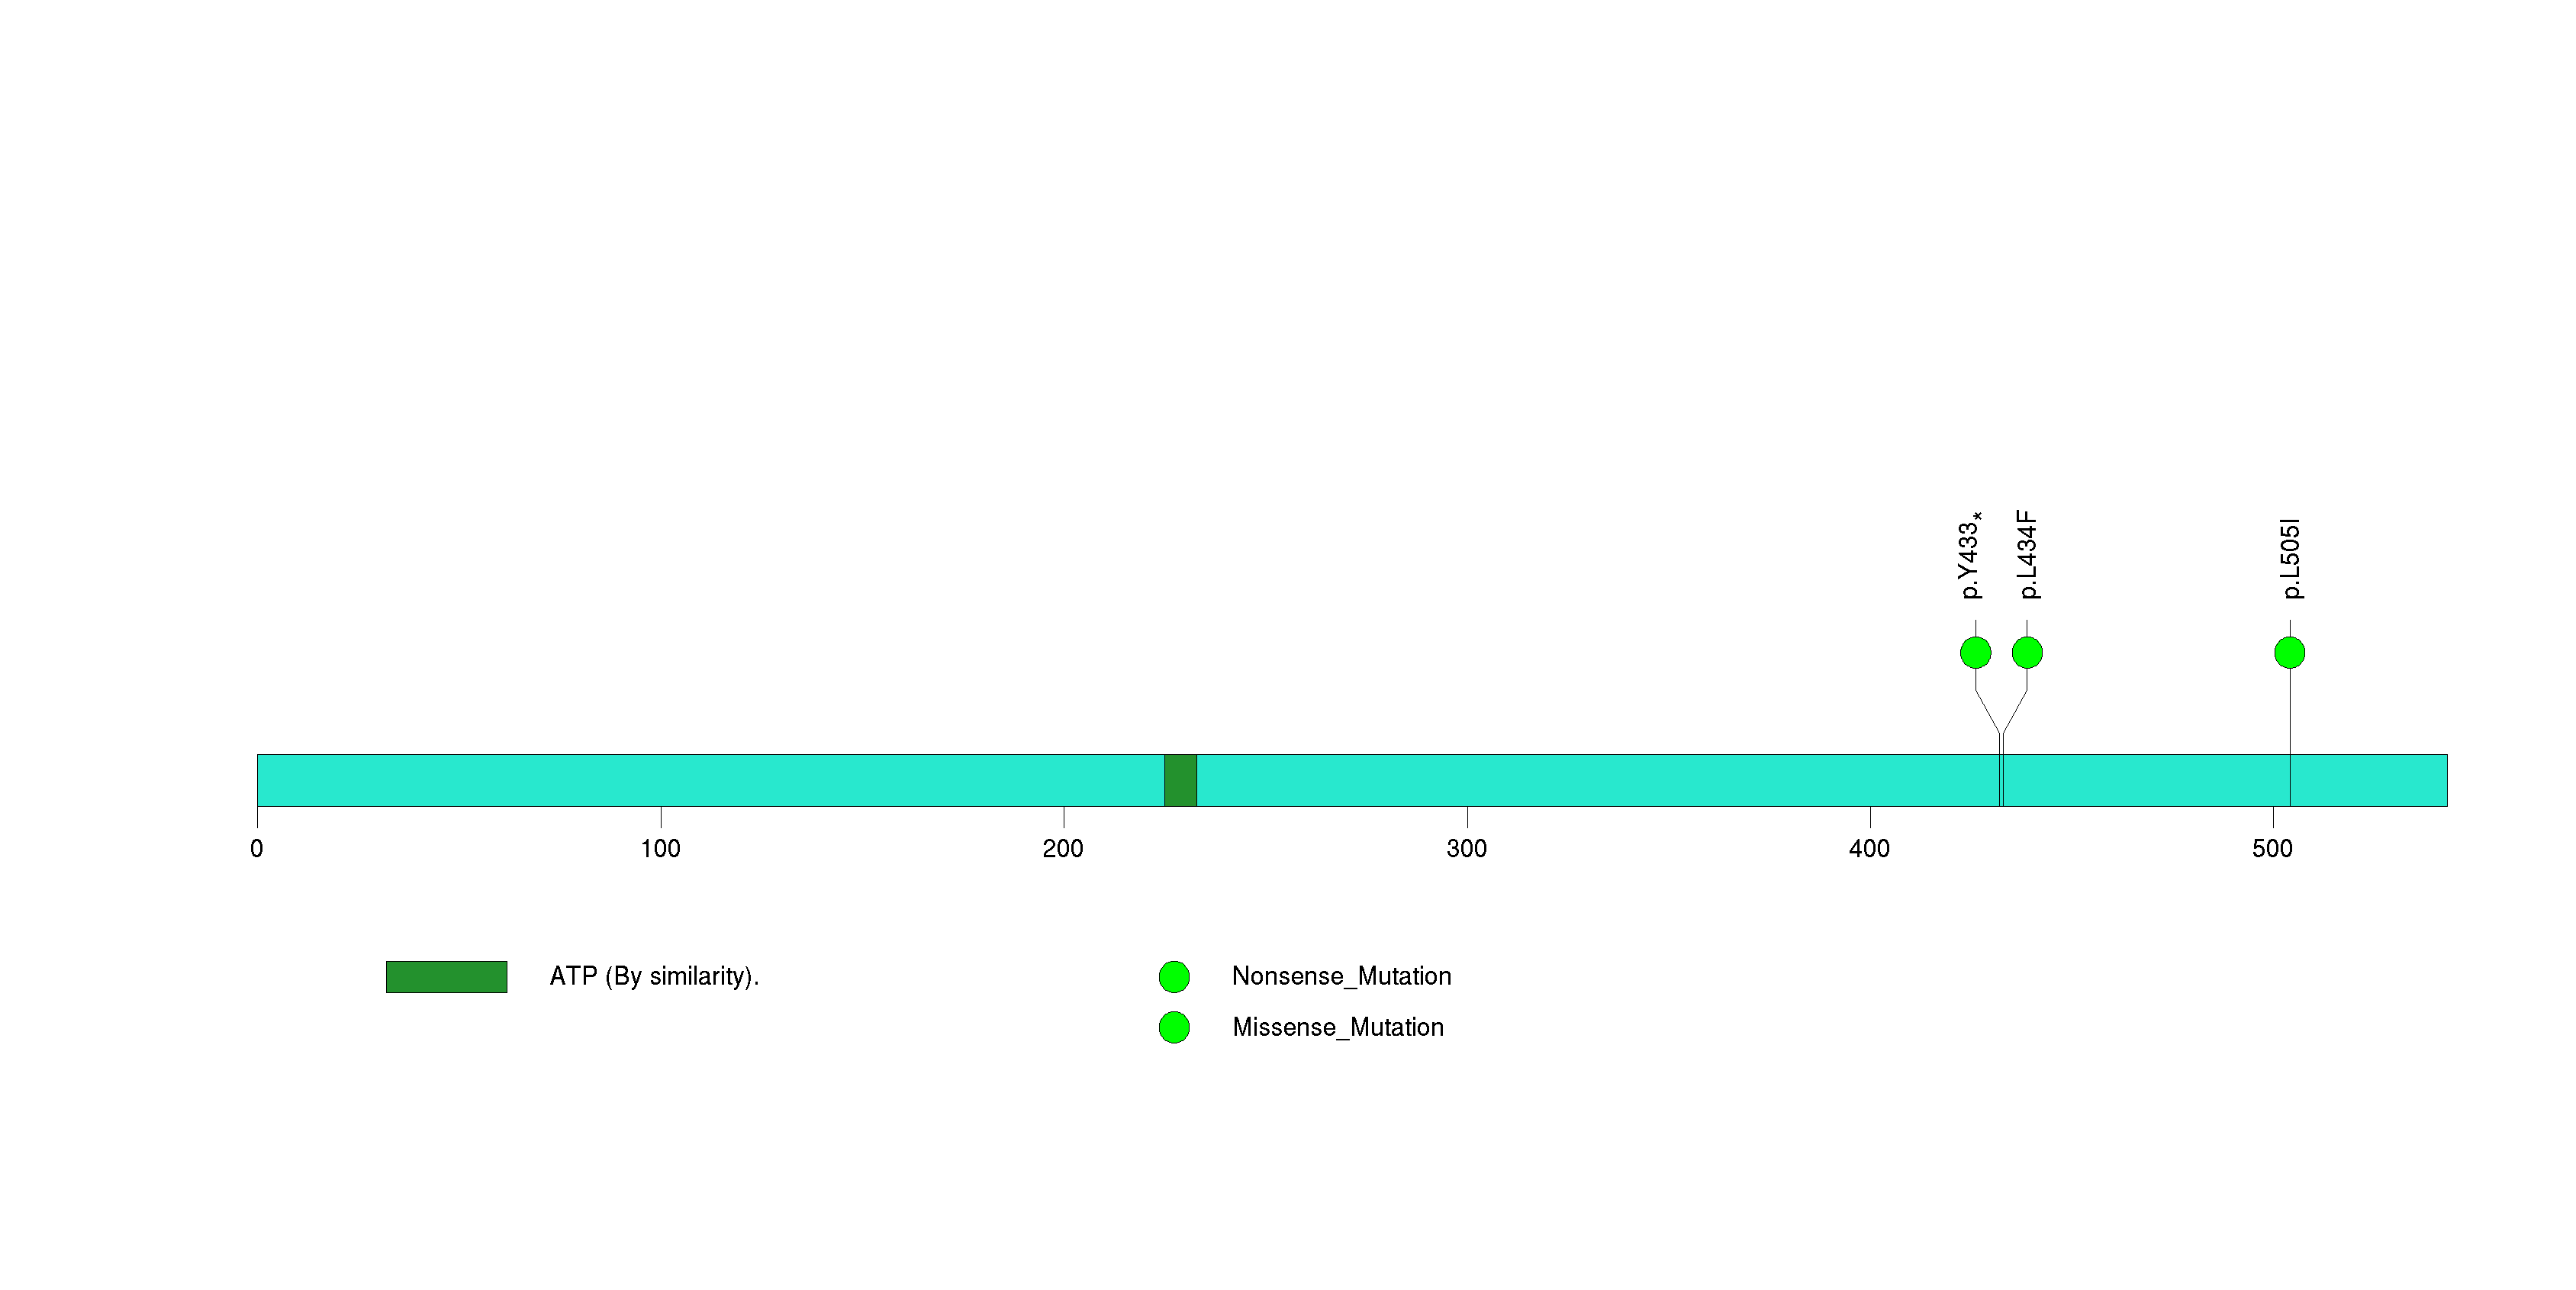
Figure S4. This figure depicts the distribution of mutations and mutation types across the CHEK2 significant gene.
In this analysis, COSMIC is used as a filter to increase power by restricting the territory of each gene. Cosmic version: v48.
Table 4. Get Full Table Significantly mutated genes (COSMIC territory only). To access the database please go to: COSMIC. Number of significant genes found: 3. Number of genes displayed: 10
| rank | gene | description | n | cos | n_cos | N_cos | cos_ev | p | q |
|---|---|---|---|---|---|---|---|---|---|
| 1 | HRAS | v-Ha-ras Harvey rat sarcoma viral oncogene homolog | 14 | 19 | 14 | 988 | 2912 | 3.9e-14 | 1.5e-10 |
| 2 | NRAS | neuroblastoma RAS viral (v-ras) oncogene homolog | 34 | 33 | 34 | 1716 | 44132 | 6.8e-14 | 1.5e-10 |
| 3 | KRAS | v-Ki-ras2 Kirsten rat sarcoma viral oncogene homolog | 4 | 52 | 4 | 2704 | 15018 | 1.8e-13 | 2.7e-10 |
| 4 | BRAF | v-raf murine sarcoma viral oncogene homolog B1 | 1 | 89 | 1 | 4628 | 14374 | 0.002 | 1 |
| 5 | A4GNT | alpha-1,4-N-acetylglucosaminyltransferase | 0 | 0 | 0 | 0 | 0 | 1 | 1 |
| 6 | AACS | acetoacetyl-CoA synthetase | 0 | 0 | 0 | 0 | 0 | 1 | 1 |
| 7 | ABCA9 | ATP-binding cassette, sub-family A (ABC1), member 9 | 0 | 0 | 0 | 0 | 0 | 1 | 1 |
| 8 | ABCC10 | ATP-binding cassette, sub-family C (CFTR/MRP), member 10 | 0 | 0 | 0 | 0 | 0 | 1 | 1 |
| 9 | ABCF2 | ATP-binding cassette, sub-family F (GCN20), member 2 | 0 | 0 | 0 | 0 | 0 | 1 | 1 |
| 10 | ABHD2 | abhydrolase domain containing 2 | 0 | 0 | 0 | 0 | 0 | 1 | 1 |
Note:
n - number of (nonsilent) mutations in this gene across the individual set.
cos = number of unique mutated sites in this gene in COSMIC
n_cos = overlap between n and cos.
N_cos = number of individuals times cos.
cos_ev = total evidence: number of reports in COSMIC for mutations seen in this gene.
p = p-value for seeing the observed amount of overlap in this gene)
q = q-value, False Discovery Rate (Benjamini-Hochberg procedure)
Table 5. Get Full Table Genes with Clustered Mutations
| num | gene | desc | n | mindist | nmuts0 | nmuts3 | nmuts12 | npairs0 | npairs3 | npairs12 |
|---|---|---|---|---|---|---|---|---|---|---|
| 336 | NRAS | neuroblastoma RAS viral (v-ras) oncogene homolog | 34 | 0 | 561 | 561 | 561 | 561 | 561 | 561 |
| 218 | HRAS | v-Ha-ras Harvey rat sarcoma viral oncogene homolog | 14 | 0 | 91 | 91 | 91 | 91 | 91 | 91 |
| 123 | DGCR8 | DiGeorge syndrome critical region gene 8 | 2 | 0 | 1 | 1 | 1 | 1 | 1 | 1 |
| 85 | CHEK2 | CHK2 checkpoint homolog (S. pombe) | 3 | 1 | 0 | 1 | 1 | 0 | 1 | 1 |
| 140 | DNAJC11 | DnaJ (Hsp40) homolog, subfamily C, member 11 | 2 | 1 | 0 | 1 | 1 | 0 | 1 | 1 |
| 261 | KRAS | v-Ki-ras2 Kirsten rat sarcoma viral oncogene homolog | 4 | 49 | 0 | 0 | 0 | 0 | 0 | 0 |
| 121 | DENND5B | DENN/MADD domain containing 5B | 2 | 82 | 0 | 0 | 0 | 0 | 0 | 0 |
| 112 | CYB5R4 | cytochrome b5 reductase 4 | 2 | 138 | 0 | 0 | 0 | 0 | 0 | 0 |
| 204 | GRAMD2 | GRAM domain containing 2 | 2 | 142 | 0 | 0 | 0 | 0 | 0 | 0 |
| 216 | HMCN1 | hemicentin 1 | 2 | 248 | 0 | 0 | 0 | 0 | 0 | 0 |
Note:
n - number of mutations in this gene in the individual set.
mindist - distance (in aa) between closest pair of mutations in this gene
npairs3 - how many pairs of mutations are within 3 aa of each other.
npairs12 - how many pairs of mutations are within 12 aa of each other.
Table 6. Get Full Table A Ranked List of Significantly Mutated Genesets. (Source: MSigDB GSEA Cannonical Pathway Set).Number of significant genesets found: 80. Number of genesets displayed: 10
| rank | geneset | description | genes | N_genes | mut_tally | N | n | npat | nsite | nsil | n1 | n2 | n3 | n4 | n5 | n6 | p_ns_s | p | q |
|---|---|---|---|---|---|---|---|---|---|---|---|---|---|---|---|---|---|---|---|
| 1 | HSA04662_B_CELL_RECEPTOR_SIGNALING_PATHWAY | Genes involved in B cell receptor signaling pathway | AKT1, AKT2, AKT3, BCL10, BLNK, BTK, CARD11, CD19, CD22, CD72, CD79A, CD79B, CD81, CHP, CHUK, CR2, FCGR2B, FOS, GSK3B, HRAS, IFITM1, IKBKB, IKBKG, INPP5D, JUN, KRAS, LILRB3, LYN, MALT1, NFAT5, NFATC1, NFATC2, NFATC3, NFATC4, NFKB1, NFKB2, NFKBIA, NFKBIB, NFKBIE, NRAS, PIK3CA, PIK3CB, PIK3CD, PIK3CG, PIK3R1, PIK3R2, PIK3R3, PIK3R5, PLCG2, PPP3CA, PPP3CB, PPP3CC, PPP3R1, PPP3R2, PRKCB1, PTPN6, RAC1, RAC2, RAC3, RASGRP3, SYK, VAV1, VAV2, VAV3 | 62 | HRAS(14), KRAS(4), NRAS(34) | 5745523 | 52 | 52 | 7 | 2 | 0 | 0 | 39 | 13 | 0 | 0 | 0.000021 | <1.00e-15 | <1.27e-13 |
| 2 | HSA04720_LONG_TERM_POTENTIATION | Genes involved in long-term potentiation | ADCY1, ADCY8, ARAF, ATF4, BRAF, CACNA1C, CALM1, CALM2, CALM3, CALML3, CALML6, CAMK2A, CAMK2B, CAMK2D, CAMK2G, CAMK4, CHP, CREBBP, EP300, GNAQ, GRIA1, GRIA2, GRIN1, GRIN2A, GRIN2B, GRIN2C, GRIN2D, GRM1, GRM5, HRAS, ITPR1, ITPR2, ITPR3, KRAS, MAP2K1, MAP2K2, MAPK1, MAPK3, NRAS, PLCB1, PLCB2, PLCB3, PLCB4, PPP1CA, PPP1CB, PPP1CC, PPP1R12A, PPP1R1A, PPP3CA, PPP3CB, PPP3CC, PPP3R1, PPP3R2, PRKACA, PRKACB, PRKACG, PRKCA, PRKCB1, PRKCG, PRKX, PRKY, RAF1, RAP1A, RAP1B, RAPGEF3, RPS6KA1, RPS6KA2, RPS6KA3, RPS6KA6 | 67 | BRAF(1), GRIA1(1), GRIA2(1), HRAS(14), ITPR1(1), KRAS(4), NRAS(34), PLCB3(1), RAP1A(1) | 7663435 | 58 | 52 | 13 | 1 | 1 | 1 | 39 | 16 | 1 | 0 | 1.7e-06 | <1.00e-15 | <1.27e-13 |
| 3 | HSA04650_NATURAL_KILLER_CELL_MEDIATED_CYTOTOXICITY | Genes involved in natural killer cell mediated cytotoxicity | ARAF, BID, BRAF, CASP3, CD244, CD247, CD48, CHP, CSF2, FAS, FASLG, FCER1G, FCGR3A, FCGR3B, FYN, GRB2, GZMB, HCST, HLA-A, HLA-B, HLA-C, HLA-E, HLA-G, HRAS, ICAM1, ICAM2, IFNA1, IFNA10, IFNA13, IFNA14, IFNA16, IFNA17, IFNA2, IFNA21, IFNA4, IFNA5, IFNA6, IFNA7, IFNA8, IFNAR1, IFNAR2, IFNB1, IFNG, IFNGR1, IFNGR2, ITGAL, ITGB2, KIR2DL1, KIR2DL2, KIR2DL3, KIR2DL4, KIR2DL5A, KIR2DS1, KIR2DS2, KIR3DL1, KIR3DL2, KLRC1, KLRC2, KLRC3, KLRD1, KLRK1, KRAS, LAT, LCK, LCP2, LOC652578, MAP2K1, MAP2K2, MAPK1, MAPK3, MICA, MICB, NCR1, NCR2, NCR3, NFAT5, NFATC1, NFATC2, NFATC3, NFATC4, NRAS, PAK1, PIK3CA, PIK3CB, PIK3CD, PIK3CG, PIK3R1, PIK3R2, PIK3R3, PIK3R5, PLCG1, PLCG2, PPP3CA, PPP3CB, PPP3CC, PPP3R1, PPP3R2, PRF1, PRKCA, PRKCB1, PRKCG, PTK2B, PTPN11, PTPN6, RAC1, RAC2, RAC3, RAF1, SH2D1A, SH2D1B, SH3BP2, SHC1, SHC2, SHC3, SHC4, SOS1, SOS2, SYK, TNF, TNFRSF10A, TNFRSF10B, TNFRSF10C, TNFRSF10D, TNFSF10, TYROBP, ULBP1, ULBP2, ULBP3, VAV1, VAV2, VAV3, ZAP70 | 126 | BRAF(1), HRAS(14), KIR3DL2(1), KRAS(4), NRAS(34), PTK2B(1) | 8769852 | 55 | 52 | 10 | 1 | 1 | 1 | 39 | 14 | 0 | 0 | 1.2e-06 | 1.11e-15 | 1.27e-13 |
| 4 | CDMACPATHWAY | Cadmium 2+ promotes cell proliferation in cultured macrophages by entering the cell via calcium channels and activating the MAP kinase pathway. | CUZD1, FOS, HRAS, JUN, MAP2K1, MAPK1, MAPK3, MYC, NFKB1, NFKBIA, PLCB1, PRKCA, PRKCB1, RAF1, RELA, TNF | 15 | HRAS(14) | 1198405 | 14 | 14 | 2 | 0 | 0 | 0 | 11 | 3 | 0 | 0 | 0.016 | 1.33e-15 | 1.27e-13 |
| 5 | G_PROTEIN_SIGNALING | ADCY1, ADCY2, ADCY3, ADCY4, ADCY5, ADCY6, ADCY7, ADCY8, ADCY9, AKAP1, AKAP10, AKAP11, AKAP12, AKAP2, PALM2_AKAP2, AKAP3, AKAP4, AKAP5, AKAP6, AKAP7, AKAP8, AKAP9, ARHGEF1, CALM1, CALM2, CALM3, CHMP1B, GNA11, GNA12, GNA13, GNA14, GNA15, GNAI2, GNAI3, GNAL, GNAO1, GNAQ, GNAZ, GNB1, GNB2, GNB3, GNB5, GNG10, GNG10, LOC552891, GNG12, GNG13, GNG3, GNG4, GNG5, GNG7, GNGT1, GNGT2, HRAS, IL18BP, ITPR1, KCNJ3, KRAS, MGC11266, NRAS, PALM2, PALM2_AKAP2, PALM2_AKAP2, PDE1A, PDE1B, PDE1C, PDE4A, PDE4B, PDE4C, PDE4D, PDE7A, PDE7B, PDE8A, PDE8B, PLCB3, PPP3CA, PPP3CC, PRKACA, PRKACB, PRKACG, PRKAR1A, PRKAR1B, PRKAR2A, PRKAR2B, PRKCA, PRKCB1, PRKCD, PRKCE, PRKCG, PRKCH, PRKCI, PRKCQ, PRKCZ, PRKD1, PRKD3, RHOA, RRAS, SARA1, SLC9A1, USP5 | 92 | ADCY3(1), ADCY9(1), AKAP11(1), HRAS(14), ITPR1(1), KRAS(4), NRAS(34), PDE1A(1), PLCB3(1), PRKD1(1), USP5(1) | 9015632 | 60 | 52 | 15 | 2 | 0 | 0 | 39 | 18 | 3 | 0 | 6.4e-06 | 2.00e-15 | 1.27e-13 | |
| 6 | HSA04660_T_CELL_RECEPTOR_SIGNALING_PATHWAY | Genes involved in T cell receptor signaling pathway | AKT1, AKT2, AKT3, BCL10, CARD11, CBL, CBLB, CBLC, CD247, CD28, CD3D, CD3E, CD3G, CD4, CD40LG, CD8A, CD8B, CDC42, CDK4, CHP, CHUK, CSF2, CTLA4, FOS, FYN, GRAP2, GRB2, HRAS, ICOS, IFNG, IKBKB, IKBKG, IL10, IL2, IL4, IL5, ITK, JUN, KRAS, LAT, LCK, LCP2, MALT1, MAP3K14, MAP3K8, NCK1, NCK2, NFAT5, NFATC1, NFATC2, NFATC3, NFATC4, NFKB1, NFKB2, NFKBIA, NFKBIB, NFKBIE, NRAS, PAK1, PAK2, PAK3, PAK4, PAK6, PAK7, PDCD1, PDK1, PIK3CA, PIK3CB, PIK3CD, PIK3CG, PIK3R1, PIK3R2, PIK3R3, PIK3R5, PLCG1, PPP3CA, PPP3CB, PPP3CC, PPP3R1, PPP3R2, PRKCQ, PTPN6, PTPRC, RASGRP1, RHOA, SOS1, SOS2, TEC, TNF, VAV1, VAV2, VAV3, ZAP70 | 92 | HRAS(14), KRAS(4), NRAS(34) | 7823189 | 52 | 52 | 7 | 2 | 0 | 0 | 39 | 13 | 0 | 0 | 0.000012 | 2.55e-15 | 1.27e-13 |
| 7 | HSA04012_ERBB_SIGNALING_PATHWAY | Genes involved in ErbB signaling pathway | ABL1, ABL2, AKT1, AKT2, AKT3, ARAF, AREG, BAD, BRAF, BTC, CAMK2A, CAMK2B, CAMK2D, CAMK2G, CBL, CBLB, CBLC, CDKN1A, CDKN1B, CRK, CRKL, EGF, EGFR, EIF4EBP1, ELK1, ERBB2, ERBB3, ERBB4, EREG, FRAP1, GAB1, GRB2, GSK3B, HBEGF, HRAS, JUN, KRAS, MAP2K1, MAP2K2, MAP2K4, MAP2K7, MAPK1, MAPK10, MAPK3, MAPK8, MAPK9, MYC, NCK1, NCK2, NRAS, NRG1, NRG2, NRG3, NRG4, PAK1, PAK2, PAK3, PAK4, PAK6, PAK7, PIK3CA, PIK3CB, PIK3CD, PIK3CG, PIK3R1, PIK3R2, PIK3R3, PIK3R5, PLCG1, PLCG2, PRKCA, PRKCB1, PRKCG, PTK2, RAF1, RPS6KB1, RPS6KB2, SHC1, SHC2, SHC3, SHC4, SOS1, SOS2, SRC, STAT5A, STAT5B, TGFA | 85 | BRAF(1), HRAS(14), KRAS(4), NRAS(34) | 7967801 | 53 | 52 | 8 | 1 | 0 | 0 | 39 | 14 | 0 | 0 | 1.9e-06 | 2.66e-15 | 1.27e-13 |
| 8 | HSA04664_FC_EPSILON_RI_SIGNALING_PATHWAY | Genes involved in Fc epsilon RI signaling pathway | AKT1, AKT2, AKT3, BTK, CSF2, FCER1A, FCER1G, FYN, GAB2, GRB2, HRAS, IL13, IL3, IL4, IL5, INPP5D, KRAS, LAT, LCP2, LYN, MAP2K1, MAP2K2, MAP2K3, MAP2K4, MAP2K6, MAP2K7, MAPK1, MAPK10, MAPK11, MAPK12, MAPK13, MAPK14, MAPK3, MAPK8, MAPK9, MS4A2, NRAS, PDK1, PIK3CA, PIK3CB, PIK3CD, PIK3CG, PIK3R1, PIK3R2, PIK3R3, PIK3R5, PLA2G10, PLA2G12A, PLA2G12B, PLA2G1B, PLA2G2A, PLA2G2D, PLA2G2E, PLA2G2F, PLA2G3, PLA2G4A, PLA2G5, PLA2G6, PLCG1, PLCG2, PRKCA, PRKCB1, PRKCD, PRKCE, RAC1, RAC2, RAC3, RAF1, SOS1, SOS2, SYK, TNF, VAV1, VAV2, VAV3 | 74 | HRAS(14), KRAS(4), NRAS(34), PLA2G5(1) | 5557217 | 53 | 52 | 8 | 1 | 0 | 0 | 39 | 14 | 0 | 0 | 5.1e-06 | 3.00e-15 | 1.27e-13 |
| 9 | HSA04530_TIGHT_JUNCTION | Genes involved in tight junction | ACTB, ACTG1, ACTN1, ACTN2, ACTN3, ACTN4, AKT1, AKT2, AKT3, AMOTL1, ASH1L, CASK, CDC42, CDK4, CGN, CLDN1, CLDN10, CLDN11, CLDN14, CLDN15, CLDN16, CLDN17, CLDN18, CLDN19, CLDN2, CLDN20, CLDN22, CLDN23, CLDN3, CLDN4, CLDN5, CLDN6, CLDN7, CLDN8, CLDN9, CRB3, CSDA, CSNK2A1, CSNK2A2, CSNK2B, CTNNA1, CTNNA2, CTNNA3, CTNNB1, CTTN, EPB41, EPB41L1, EPB41L2, EPB41L3, EXOC3, EXOC4, F11R, GNAI1, GNAI2, GNAI3, HCLS1, HRAS, IGSF5, INADL, JAM2, JAM3, KRAS, LLGL1, LLGL2, MAGI1, MAGI2, MAGI3, MLLT4, MPDZ, MPP5, MRAS, MRCL3, MRLC2, MYH1, MYH10, MYH11, MYH13, MYH14, MYH15, MYH2, MYH3, MYH4, MYH6, MYH7, MYH7B, MYH8, MYH9, MYL2, MYL5, MYL7, MYL8P, MYL9, MYLC2PL, MYLPF, NRAS, OCLN, PARD3, PARD6A, PARD6B, PARD6G, PPM1J, PPP2CA, PPP2CB, PPP2R1A, PPP2R1B, PPP2R2A, PPP2R2B, PPP2R2C, PPP2R3A, PPP2R3B, PPP2R4, PRKCA, PRKCB1, PRKCD, PRKCE, PRKCG, PRKCH, PRKCI, PRKCQ, PRKCZ, PTEN, RAB13, RAB3B, RHOA, RRAS, RRAS2, SPTAN1, SRC, SYMPK, TJAP1, TJP1, TJP2, TJP3, VAPA, YES1, ZAK | 131 | AMOTL1(1), EPB41L1(1), HRAS(14), KRAS(4), MYH13(1), NRAS(34), PPM1J(1) | 14972875 | 56 | 52 | 11 | 4 | 2 | 1 | 39 | 14 | 0 | 0 | 0.00018 | 3.11e-15 | 1.27e-13 |
| 10 | HSA04916_MELANOGENESIS | Genes involved in melanogenesis | ADCY1, ADCY2, ADCY3, ADCY4, ADCY5, ADCY6, ADCY7, ADCY8, ADCY9, ASIP, CALM1, CALM2, CALM3, CALML3, CALML6, CAMK2A, CAMK2B, CAMK2D, CAMK2G, CREB1, CREB3, CREB3L1, CREB3L2, CREB3L3, CREB3L4, CREBBP, CTNNB1, DCT, DVL1, DVL2, DVL3, EDN1, EDNRB, EP300, FZD1, FZD10, FZD2, FZD3, FZD4, FZD5, FZD6, FZD7, FZD8, FZD9, GNAI1, GNAI2, GNAI3, GNAO1, GNAQ, GNAS, GSK3B, HRAS, KIT, KITLG, KRAS, LEF1, LOC652788, MAP2K1, MAP2K2, MAPK1, MAPK3, MC1R, MITF, NRAS, PLCB1, PLCB2, PLCB3, PLCB4, POMC, PRKACA, PRKACB, PRKACG, PRKCA, PRKCB1, PRKCG, PRKX, PRKY, RAF1, TCF7, TCF7L1, TCF7L2, TYR, TYRP1, WNT1, WNT10A, WNT10B, WNT11, WNT16, WNT2, WNT2B, WNT3, WNT3A, WNT4, WNT5A, WNT5B, WNT6, WNT7A, WNT7B, WNT8A, WNT8B, WNT9A, WNT9B | 99 | ADCY3(1), ADCY9(1), CREB3L3(1), HRAS(14), KRAS(4), MITF(1), NRAS(34), PLCB3(1), TCF7L1(1), WNT11(1), WNT5B(1) | 8417028 | 60 | 52 | 15 | 1 | 3 | 0 | 40 | 16 | 1 | 0 | 2.2e-06 | 3.11e-15 | 1.27e-13 |
Table 7. Get Full Table A Ranked List of Significantly Mutated Genesets (Excluding Significantly Mutated Genes). Number of significant genesets found: 0. Number of genesets displayed: 10
| rank | geneset | description | genes | N_genes | mut_tally | N | n | npat | nsite | nsil | n1 | n2 | n3 | n4 | n5 | n6 | p_ns_s | p | q |
|---|---|---|---|---|---|---|---|---|---|---|---|---|---|---|---|---|---|---|---|
| 1 | HSA00602_GLYCOSPHINGOLIPID_BIOSYNTHESIS_NEO_LACTOSERIES | Genes involved in glycosphingolipid biosynthesis - neo-lactoseries | ABO, B3GNT1, B3GNT2, B3GNT3, B3GNT4, B3GNT5, B4GALT1, B4GALT2, B4GALT3, B4GALT4, FUT1, FUT2, FUT3, FUT4, FUT5, FUT6, FUT7, FUT9, GCNT2, ST3GAL6, ST8SIA1 | 21 | ABO(1), B3GNT3(1), FUT3(1) | 1247478 | 3 | 3 | 3 | 0 | 1 | 0 | 1 | 1 | 0 | 0 | 0.42 | 0.0056 | 0.96 |
| 2 | HSA01031_GLYCAN_STRUCTURES_BIOSYNTHESIS_2 | Genes involved in glycan structures - biosynthesis 2 | A4GALT, ABO, B3GALNT1, B3GALT1, B3GALT2, B3GALT4, B3GALT5, B3GNT1, B3GNT2, B3GNT3, B3GNT4, B3GNT5, B4GALNT1, B4GALT1, B4GALT2, B4GALT3, B4GALT4, B4GALT6, FUT1, FUT2, FUT3, FUT4, FUT5, FUT6, FUT7, FUT9, GBGT1, GCNT2, PIGA, PIGB, PIGC, PIGF, PIGG, PIGH, PIGK, PIGL, PIGM, PIGN, PIGO, PIGP, PIGQ, PIGS, PIGT, PIGU, PIGV, PIGX, PIGZ, ST3GAL1, ST3GAL2, ST3GAL3, ST3GAL4, ST3GAL5, ST3GAL6, ST6GALNAC3, ST6GALNAC4, ST6GALNAC5, ST6GALNAC6, ST8SIA1, ST8SIA5, UGCG, UGCGL1, UGCGL2 | 60 | ABO(1), B3GNT3(1), FUT3(1), PIGS(1), PIGZ(1) | 3739343 | 5 | 5 | 5 | 0 | 1 | 1 | 2 | 1 | 0 | 0 | 0.18 | 0.0067 | 0.96 |
| 3 | RNA_TRANSCRIPTION_REACTOME | CCNH, CDK7, ERCC3, GTF2A2, GTF2B, GTF2E1, GTF2E2, GTF2F2, GTF2H1, GTF2H2, GTF2H4, ILK, MGC9850, MNAT1, POLR1A, POLR1B, POLR2A, POLR2B, POLR2C, POLR2E, POLR2F, POLR2G, POLR2H, POLR2I, POLR2J, POLR2K, POLR3B, POLR3D, POLR3E, POLR3H, POLR3K, TAF12, TAF13, TAF5, TAF6, TAF7, TAF9, TBP, VARS2L | 36 | GTF2F2(1), POLR1B(2), POLR3B(1) | 2707358 | 4 | 4 | 4 | 0 | 0 | 1 | 0 | 1 | 2 | 0 | 0.37 | 0.0067 | 0.96 | |
| 4 | ARFPATHWAY | Cyclin-dependent kinase inhibitor 2A is a tumor suppressor that induces G1 arrest and can activate the p53 pathway, leading to G2/M arrest. | ABL1, CDKN2A, E2F1, MDM2, MYC, PIK3CA, PIK3R1, POLR1A, POLR1B, POLR1C, POLR1D, RAC1, RB1, TBX2, TP53, TWIST1 | 16 | POLR1B(2), RB1(1) | 1566275 | 3 | 3 | 3 | 0 | 0 | 1 | 0 | 0 | 2 | 0 | 0.44 | 0.009 | 0.96 |
| 5 | BLOOD_GROUP_GLYCOLIPID_BIOSYNTHESIS_LACTOSERIES | ABO, FUT1, FUT2, FUT3, FUT5, FUT6, SIAT6, ST3GAL3 | 7 | ABO(1), FUT3(1) | 392806 | 2 | 2 | 2 | 0 | 1 | 0 | 1 | 0 | 0 | 0 | 0.54 | 0.0096 | 0.96 | |
| 6 | INTRINSICPATHWAY | The intrinsic prothrombin activation pathway is activated by traumatized blood vessels and induces clot formation. | COL4A1, COL4A2, COL4A3, COL4A4, COL4A5, COL4A6, F10, F11, F12, F2, F2R, F5, F8, F9, FGA, FGB, FGG, KLKB1, KNG, PROC, PROS1, SERPINC1, SERPING1 | 22 | COL4A1(1), COL4A4(1), PROC(1), PROS1(2) | 3428221 | 5 | 5 | 5 | 0 | 1 | 0 | 1 | 3 | 0 | 0 | 0.22 | 0.01 | 0.96 |
| 7 | HSA03020_RNA_POLYMERASE | Genes involved in RNA polymerase | POLR1A, POLR1B, POLR1C, POLR1D, POLR2A, POLR2B, POLR2C, POLR2D, POLR2E, POLR2F, POLR2G, POLR2H, POLR2I, POLR2J, POLR2K, POLR2L, POLR3A, POLR3B, POLR3G, POLR3GL, POLR3H, POLR3K, ZNRD1 | 23 | POLR1B(2), POLR3B(1) | 1812320 | 3 | 3 | 3 | 0 | 0 | 0 | 0 | 1 | 2 | 0 | 0.59 | 0.011 | 0.96 |
| 8 | EXTRINSICPATHWAY | The extrinsic prothrombin activation pathway requires the release of thromboplastin from damaged tissues to activate the blood clotting cascade. | F10, F2, F2R, F3, F5, F7, FGA, FGB, FGG, PROC, PROS1, SERPINC1, TFPI | 13 | PROC(1), PROS1(2) | 1263139 | 3 | 3 | 3 | 0 | 0 | 0 | 0 | 3 | 0 | 0 | 0.6 | 0.014 | 0.99 |
| 9 | VALINE_LEUCINE_AND_ISOLEUCINE_BIOSYNTHESIS | BCAT1, IARS, LARS, LARS2, PDHA1, PDHA2, PDHB | 7 | BCAT1(1), LARS(1) | 772351 | 2 | 2 | 2 | 0 | 0 | 0 | 1 | 0 | 1 | 0 | 0.67 | 0.014 | 0.99 | |
| 10 | HSA00601_GLYCOSPHINGOLIPID_BIOSYNTHESIS_LACTOSERIES | Genes involved in glycosphingolipid biosynthesis - lactoseries | ABO, B3GALT1, B3GALT2, B3GALT5, B3GNT5, FUT1, FUT2, FUT3, ST3GAL3, ST3GAL4 | 10 | ABO(1), FUT3(1) | 556767 | 2 | 2 | 2 | 0 | 1 | 0 | 1 | 0 | 0 | 0 | 0.51 | 0.017 | 1 |
In brief, we tabulate the number of mutations and the number of covered bases for each gene. The counts are broken down by mutation context category: four context categories that are discovered by MutSig, and one for indel and 'null' mutations, which include indels, nonsense mutations, splice-site mutations, and non-stop (read-through) mutations. For each gene, we calculate the probability of seeing the observed constellation of mutations, i.e. the product P1 x P2 x ... x Pm, or a more extreme one, given the background mutation rates calculated across the dataset. [1]
In addition to the links below, the full results of the analysis summarized in this report can also be downloaded programmatically using firehose_get, or interactively from either the Broad GDAC website or TCGA Data Coordination Center Portal.