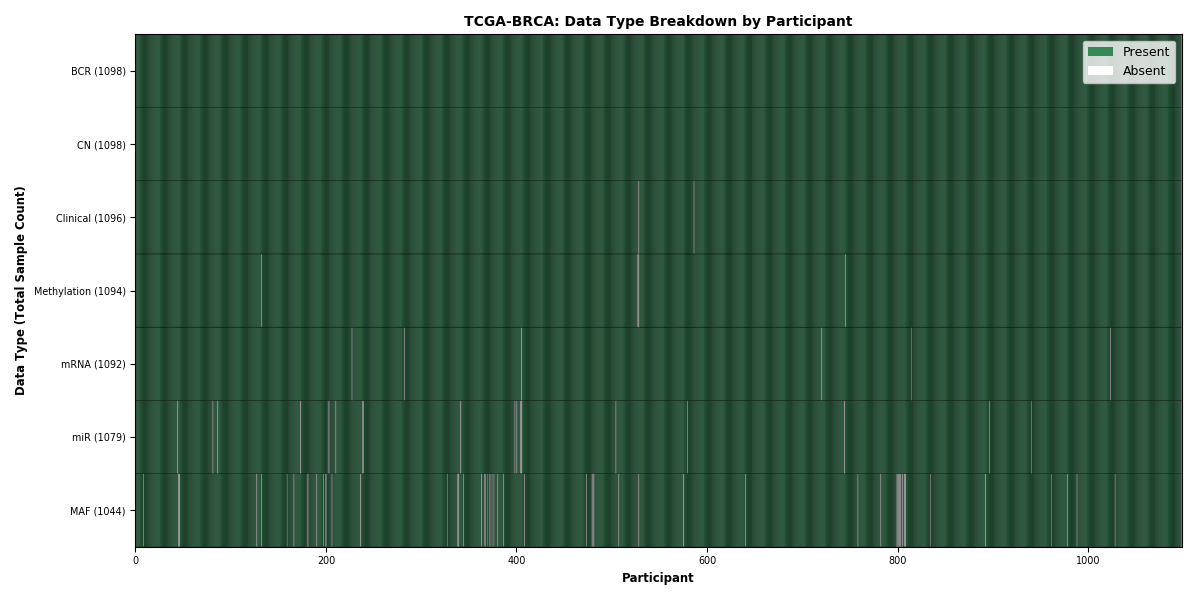
This is a summary of data mirrored from the Genomic Data Commons (GDC) and processed by the GDCtools package. Note that some sample data will be filtered as unsuitable for downstream pipelines, through one of three mechanisms: redactions, replicate filtering, and blacklisting. The report lists the counts and types of the sample data, in both hyperlinked tables and heatmap images; describes the three filtering mechanisms; lists the samples removed by filtering, why they were removed; and (eventually will) catalog how the data have been annotated by the respective projects that submitted them to the GDC.
There were 0 redactions, 0 replicate aliquots, 0 blacklisted aliquots, and 0 FFPE aliquots. The table below represents the sample counts for those samples that were ingested into firehose after filtering out redactions, replicates, and blacklisted data, and segregating FFPEs.
Table 1. This table provides a breakdown of sample counts on a per sample type and, if applicable, per subtype basis. Each count is a link to a table containing a list of the samples that comprise that count and details pertaining to each individual sample (e.g. platform, sequencing center, etc.). Please note, there are usually multiple protocols per data type, so there are typically many more rows than the count implies.
| Sample.Type | BCR | Clinical | CN | mRNA | miR | MAF | Methylation |
|---|---|---|---|---|---|---|---|
| NB | 979 | 977 | 979 | 0 | 0 | 0 | 0 |
| TM | 7 | 7 | 7 | 7 | 7 | 7 | 7 |
| NT | 162 | 161 | 135 | 113 | 104 | 0 | 123 |
| FFPE | 16 | 16 | 11 | 16 | 16 | 15 | 10 |
| TP | 1098 | 1096 | 1092 | 1081 | 1074 | 1040 | 1090 |
| Totals | 1098 | 1096 | 1092 | 1081 | 1074 | 1040 | 1090 |
Table S1.
| TCGA Barcode | Platform | Center | Annotation |
|---|---|---|---|
| TCGA-3C-AAAU | (TODO) -- GDC | clinical__biospecimen | |
| TCGA-3C-AALI | (TODO) -- GDC | clinical__biospecimen | |
| TCGA-3C-AALJ | (TODO) -- GDC | clinical__biospecimen | |
| TCGA-3C-AALK | (TODO) -- GDC | clinical__biospecimen | |
| TCGA-4H-AAAK | (TODO) -- GDC | clinical__biospecimen | |
| TCGA-5L-AAT0 | (TODO) -- GDC | clinical__biospecimen | |
| TCGA-5L-AAT1 | (TODO) -- GDC | clinical__biospecimen | |
| TCGA-5T-A9QA | (TODO) -- GDC | clinical__biospecimen | |
| TCGA-A1-A0SB | (TODO) -- GDC | clinical__biospecimen | |
| TCGA-A1-A0SD | (TODO) -- GDC | clinical__biospecimen | |
| TCGA-A1-A0SE | (TODO) -- GDC | clinical__biospecimen | |
| TCGA-A1-A0SF | (TODO) -- GDC | clinical__biospecimen | |
| TCGA-A1-A0SG | (TODO) -- GDC | clinical__biospecimen | |
| TCGA-A1-A0SH | (TODO) -- GDC | clinical__biospecimen | |
| TCGA-A1-A0SI | (TODO) -- GDC | clinical__biospecimen | |
| TCGA-A1-A0SJ | (TODO) -- GDC | clinical__biospecimen | |
| TCGA-A1-A0SK | (TODO) -- GDC | clinical__biospecimen | |
| TCGA-A1-A0SM | (TODO) -- GDC | clinical__biospecimen | |
| TCGA-A1-A0SN | (TODO) -- GDC | clinical__biospecimen | |
| TCGA-A1-A0SO | (TODO) -- GDC | clinical__biospecimen | |
| TCGA-A1-A0SP | (TODO) -- GDC | clinical__biospecimen | |
| TCGA-A2-A04N | (TODO) -- GDC | clinical__biospecimen | |
| TCGA-A2-A04P | (TODO) -- GDC | clinical__biospecimen | |
| TCGA-A2-A04Q | (TODO) -- GDC | clinical__biospecimen | |
| TCGA-A2-A04R | (TODO) -- GDC | clinical__biospecimen | |
| TCGA-A2-A04T | (TODO) -- GDC | clinical__biospecimen | |
| TCGA-A2-A04U | (TODO) -- GDC | clinical__biospecimen | |
| TCGA-A2-A04V | (TODO) -- GDC | clinical__biospecimen | |
| TCGA-A2-A04W | (TODO) -- GDC | clinical__biospecimen | |
| TCGA-A2-A04X | (TODO) -- GDC | clinical__biospecimen | |
| TCGA-A2-A04Y | (TODO) -- GDC | clinical__biospecimen | |
| TCGA-A2-A0CK | (TODO) -- GDC | clinical__biospecimen | |
| TCGA-A2-A0CL | (TODO) -- GDC | clinical__biospecimen | |
| TCGA-A2-A0CM | (TODO) -- GDC | clinical__biospecimen | |
| TCGA-A2-A0CO | (TODO) -- GDC | clinical__biospecimen | |
| TCGA-A2-A0CP | (TODO) -- GDC | clinical__biospecimen | |
| TCGA-A2-A0CQ | (TODO) -- GDC | clinical__biospecimen | |
| TCGA-A2-A0CR | (TODO) -- GDC | clinical__biospecimen | |
| TCGA-A2-A0CS | (TODO) -- GDC | clinical__biospecimen | |
| TCGA-A2-A0CT | (TODO) -- GDC | clinical__biospecimen | |
| TCGA-A2-A0CU | (TODO) -- GDC | clinical__biospecimen | |
| TCGA-A2-A0CV | (TODO) -- GDC | clinical__biospecimen | |
| TCGA-A2-A0CW | (TODO) -- GDC | clinical__biospecimen | |
| TCGA-A2-A0CX | (TODO) -- GDC | clinical__biospecimen | |
| TCGA-A2-A0CY | (TODO) -- GDC | clinical__biospecimen | |
| TCGA-A2-A0CZ | (TODO) -- GDC | clinical__biospecimen | |
| TCGA-A2-A0D0 | (TODO) -- GDC | clinical__biospecimen | |
| TCGA-A2-A0D1 | (TODO) -- GDC | clinical__biospecimen | |
| TCGA-A2-A0D2 | (TODO) -- GDC | clinical__biospecimen | |
| TCGA-A2-A0D3 | (TODO) -- GDC | clinical__biospecimen | |
| TCGA-A2-A0D4 | (TODO) -- GDC | clinical__biospecimen | |
| TCGA-A2-A0EM | (TODO) -- GDC | clinical__biospecimen | |
| TCGA-A2-A0EN | (TODO) -- GDC | clinical__biospecimen | |
| TCGA-A2-A0EO | (TODO) -- GDC | clinical__biospecimen | |
| TCGA-A2-A0EQ | (TODO) -- GDC | clinical__biospecimen | |
| TCGA-A2-A0ER | (TODO) -- GDC | clinical__biospecimen | |
| TCGA-A2-A0ES | (TODO) -- GDC | clinical__biospecimen | |
| TCGA-A2-A0ET | (TODO) -- GDC | clinical__biospecimen | |
| TCGA-A2-A0EU | (TODO) -- GDC | clinical__biospecimen | |
| TCGA-A2-A0EV | (TODO) -- GDC | clinical__biospecimen | |
| TCGA-A2-A0EW | (TODO) -- GDC | clinical__biospecimen | |
| TCGA-A2-A0EX | (TODO) -- GDC | clinical__biospecimen | |
| TCGA-A2-A0EY | (TODO) -- GDC | clinical__biospecimen | |
| TCGA-A2-A0ST | (TODO) -- GDC | clinical__biospecimen | |
| TCGA-A2-A0SU | (TODO) -- GDC | clinical__biospecimen | |
| TCGA-A2-A0SV | (TODO) -- GDC | clinical__biospecimen | |
| TCGA-A2-A0SW | (TODO) -- GDC | clinical__biospecimen | |
| TCGA-A2-A0SX | (TODO) -- GDC | clinical__biospecimen | |
| TCGA-A2-A0SY | (TODO) -- GDC | clinical__biospecimen | |
| TCGA-A2-A0T0 | (TODO) -- GDC | clinical__biospecimen | |
| TCGA-A2-A0T1 | (TODO) -- GDC | clinical__biospecimen | |
| TCGA-A2-A0T2 | (TODO) -- GDC | clinical__biospecimen | |
| TCGA-A2-A0T3 | (TODO) -- GDC | clinical__biospecimen | |
| TCGA-A2-A0T4 | (TODO) -- GDC | clinical__biospecimen | |
| TCGA-A2-A0T5 | (TODO) -- GDC | clinical__biospecimen | |
| TCGA-A2-A0T6 | (TODO) -- GDC | clinical__biospecimen | |
| TCGA-A2-A0T7 | (TODO) -- GDC | clinical__biospecimen | |
| TCGA-A2-A0YC | (TODO) -- GDC | clinical__biospecimen | |
| TCGA-A2-A0YD | (TODO) -- GDC | clinical__biospecimen | |
| TCGA-A2-A0YE | (TODO) -- GDC | clinical__biospecimen | |
| TCGA-A2-A0YF | (TODO) -- GDC | clinical__biospecimen | |
| TCGA-A2-A0YG | (TODO) -- GDC | clinical__biospecimen | |
| TCGA-A2-A0YH | (TODO) -- GDC | clinical__biospecimen | |
| TCGA-A2-A0YI | (TODO) -- GDC | clinical__biospecimen | |
| TCGA-A2-A0YJ | (TODO) -- GDC | clinical__biospecimen | |
| TCGA-A2-A0YK | (TODO) -- GDC | clinical__biospecimen | |
| TCGA-A2-A0YL | (TODO) -- GDC | clinical__biospecimen | |
| TCGA-A2-A0YM | (TODO) -- GDC | clinical__biospecimen | |
| TCGA-A2-A0YT | (TODO) -- GDC | clinical__biospecimen | |
| TCGA-A2-A1FV | (TODO) -- GDC | clinical__biospecimen | |
| TCGA-A2-A1FW | (TODO) -- GDC | clinical__biospecimen | |
| TCGA-A2-A1FX | (TODO) -- GDC | clinical__biospecimen | |
| TCGA-A2-A1FZ | (TODO) -- GDC | clinical__biospecimen | |
| TCGA-A2-A1G0 | (TODO) -- GDC | clinical__biospecimen | |
| TCGA-A2-A1G1 | (TODO) -- GDC | clinical__biospecimen | |
| TCGA-A2-A1G4 | (TODO) -- GDC | clinical__biospecimen | |
| TCGA-A2-A1G6 | (TODO) -- GDC | clinical__biospecimen | |
| TCGA-A2-A259 | (TODO) -- GDC | clinical__biospecimen | |
| TCGA-A2-A25A | (TODO) -- GDC | clinical__biospecimen | |
| TCGA-A2-A25B | (TODO) -- GDC | clinical__biospecimen | |
| TCGA-A2-A25C | (TODO) -- GDC | clinical__biospecimen | |
| TCGA-A2-A25D | (TODO) -- GDC | clinical__biospecimen | |
| TCGA-A2-A25E | (TODO) -- GDC | clinical__biospecimen | |
| TCGA-A2-A25F | (TODO) -- GDC | clinical__biospecimen | |
| TCGA-A2-A3KC | (TODO) -- GDC | clinical__biospecimen | |
| TCGA-A2-A3KD | (TODO) -- GDC | clinical__biospecimen | |
| TCGA-A2-A3XS | (TODO) -- GDC | clinical__biospecimen | |
| TCGA-A2-A3XT | (TODO) -- GDC | clinical__biospecimen | |
| TCGA-A2-A3XU | (TODO) -- GDC | clinical__biospecimen | |
| TCGA-A2-A3XV | (TODO) -- GDC | clinical__biospecimen | |
| TCGA-A2-A3XW | (TODO) -- GDC | clinical__biospecimen | |
| TCGA-A2-A3XZ | (TODO) -- GDC | clinical__biospecimen | |
| TCGA-A2-A3Y0 | (TODO) -- GDC | clinical__biospecimen | |
| TCGA-A2-A4RW | (TODO) -- GDC | clinical__biospecimen | |
| TCGA-A2-A4RX | (TODO) -- GDC | clinical__biospecimen | |
| TCGA-A2-A4RY | (TODO) -- GDC | clinical__biospecimen | |
| TCGA-A2-A4S0 | (TODO) -- GDC | clinical__biospecimen | |
| TCGA-A2-A4S1 | (TODO) -- GDC | clinical__biospecimen | |
| TCGA-A2-A4S2 | (TODO) -- GDC | clinical__biospecimen | |
| TCGA-A2-A4S3 | (TODO) -- GDC | clinical__biospecimen | |
| TCGA-A7-A0CD | (TODO) -- GDC | clinical__biospecimen | |
| TCGA-A7-A0CE | (TODO) -- GDC | clinical__biospecimen | |
| TCGA-A7-A0CG | (TODO) -- GDC | clinical__biospecimen | |
| TCGA-A7-A0CJ | (TODO) -- GDC | clinical__biospecimen | |
| TCGA-A7-A0D9 | (TODO) -- GDC | clinical__biospecimen | |
| TCGA-A7-A0DA | (TODO) -- GDC | clinical__biospecimen | |
| TCGA-A7-A0DB | (TODO) -- GDC | clinical__biospecimen | |
| TCGA-A7-A0DC | (TODO) -- GDC | clinical__biospecimen | |
| TCGA-A7-A13D | (TODO) -- GDC | clinical__biospecimen | |
| TCGA-A7-A13E | (TODO) -- GDC | clinical__biospecimen | |
| TCGA-A7-A13F | (TODO) -- GDC | clinical__biospecimen | |
| TCGA-A7-A13H | (TODO) -- GDC | clinical__biospecimen | |
| TCGA-A7-A26E | (TODO) -- GDC | clinical__biospecimen | |
| TCGA-A7-A26F | (TODO) -- GDC | clinical__biospecimen | |
| TCGA-A7-A26G | (TODO) -- GDC | clinical__biospecimen | |
| TCGA-A7-A26H | (TODO) -- GDC | clinical__biospecimen | |
| TCGA-A7-A26I | (TODO) -- GDC | clinical__biospecimen | |
| TCGA-A7-A26J | (TODO) -- GDC | clinical__biospecimen | |
| TCGA-A7-A2KD | (TODO) -- GDC | clinical__biospecimen | |
| TCGA-A7-A3IY | (TODO) -- GDC | clinical__biospecimen | |
| TCGA-A7-A3IZ | (TODO) -- GDC | clinical__biospecimen | |
| TCGA-A7-A3J0 | (TODO) -- GDC | clinical__biospecimen | |
| TCGA-A7-A3J1 | (TODO) -- GDC | clinical__biospecimen | |
| TCGA-A7-A3RF | (TODO) -- GDC | clinical__biospecimen | |
| TCGA-A7-A425 | (TODO) -- GDC | clinical__biospecimen | |
| TCGA-A7-A426 | (TODO) -- GDC | clinical__biospecimen | |
| TCGA-A7-A4SA | (TODO) -- GDC | clinical__biospecimen | |
| TCGA-A7-A4SB | (TODO) -- GDC | clinical__biospecimen | |
| TCGA-A7-A4SC | (TODO) -- GDC | clinical__biospecimen | |
| TCGA-A7-A4SD | (TODO) -- GDC | clinical__biospecimen | |
| TCGA-A7-A4SE | (TODO) -- GDC | clinical__biospecimen | |
| TCGA-A7-A4SF | (TODO) -- GDC | clinical__biospecimen | |
| TCGA-A7-A56D | (TODO) -- GDC | clinical__biospecimen | |
| TCGA-A7-A5ZV | (TODO) -- GDC | clinical__biospecimen | |
| TCGA-A7-A5ZW | (TODO) -- GDC | clinical__biospecimen | |
| TCGA-A7-A5ZX | (TODO) -- GDC | clinical__biospecimen | |
| TCGA-A7-A6VV | (TODO) -- GDC | clinical__biospecimen | |
| TCGA-A7-A6VW | (TODO) -- GDC | clinical__biospecimen | |
| TCGA-A7-A6VX | (TODO) -- GDC | clinical__biospecimen | |
| TCGA-A7-A6VY | (TODO) -- GDC | clinical__biospecimen | |
| TCGA-A8-A06N | (TODO) -- GDC | clinical__biospecimen | |
| TCGA-A8-A06O | (TODO) -- GDC | clinical__biospecimen | |
| TCGA-A8-A06P | (TODO) -- GDC | clinical__biospecimen | |
| TCGA-A8-A06Q | (TODO) -- GDC | clinical__biospecimen | |
| TCGA-A8-A06R | (TODO) -- GDC | clinical__biospecimen | |
| TCGA-A8-A06T | (TODO) -- GDC | clinical__biospecimen | |
| TCGA-A8-A06U | (TODO) -- GDC | clinical__biospecimen | |
| TCGA-A8-A06X | (TODO) -- GDC | clinical__biospecimen | |
| TCGA-A8-A06Y | (TODO) -- GDC | clinical__biospecimen | |
| TCGA-A8-A06Z | (TODO) -- GDC | clinical__biospecimen | |
| TCGA-A8-A075 | (TODO) -- GDC | clinical__biospecimen | |
| TCGA-A8-A076 | (TODO) -- GDC | clinical__biospecimen | |
| TCGA-A8-A079 | (TODO) -- GDC | clinical__biospecimen | |
| TCGA-A8-A07B | (TODO) -- GDC | clinical__biospecimen | |
| TCGA-A8-A07C | (TODO) -- GDC | clinical__biospecimen | |
| TCGA-A8-A07E | (TODO) -- GDC | clinical__biospecimen | |
| TCGA-A8-A07F | (TODO) -- GDC | clinical__biospecimen | |
| TCGA-A8-A07G | (TODO) -- GDC | clinical__biospecimen | |
| TCGA-A8-A07I | (TODO) -- GDC | clinical__biospecimen | |
| TCGA-A8-A07J | (TODO) -- GDC | clinical__biospecimen | |
| TCGA-A8-A07L | (TODO) -- GDC | clinical__biospecimen | |
| TCGA-A8-A07O | (TODO) -- GDC | clinical__biospecimen | |
| TCGA-A8-A07P | (TODO) -- GDC | clinical__biospecimen | |
| TCGA-A8-A07R | (TODO) -- GDC | clinical__biospecimen | |
| TCGA-A8-A07U | (TODO) -- GDC | clinical__biospecimen | |
| TCGA-A8-A07W | (TODO) -- GDC | clinical__biospecimen | |
| TCGA-A8-A07Z | (TODO) -- GDC | clinical__biospecimen | |
| TCGA-A8-A081 | (TODO) -- GDC | clinical__biospecimen | |
| TCGA-A8-A082 | (TODO) -- GDC | clinical__biospecimen | |
| TCGA-A8-A083 | (TODO) -- GDC | clinical__biospecimen | |
| TCGA-A8-A084 | (TODO) -- GDC | clinical__biospecimen | |
| TCGA-A8-A085 | (TODO) -- GDC | clinical__biospecimen | |
| TCGA-A8-A086 | (TODO) -- GDC | clinical__biospecimen | |
| TCGA-A8-A08A | (TODO) -- GDC | clinical__biospecimen | |
| TCGA-A8-A08B | (TODO) -- GDC | clinical__biospecimen | |
| TCGA-A8-A08C | (TODO) -- GDC | clinical__biospecimen | |
| TCGA-A8-A08F | (TODO) -- GDC | clinical__biospecimen | |
| TCGA-A8-A08G | (TODO) -- GDC | clinical__biospecimen | |
| TCGA-A8-A08H | (TODO) -- GDC | clinical__biospecimen | |
| TCGA-A8-A08I | (TODO) -- GDC | clinical__biospecimen | |
| TCGA-A8-A08J | (TODO) -- GDC | clinical__biospecimen | |
| TCGA-A8-A08L | (TODO) -- GDC | clinical__biospecimen | |
| TCGA-A8-A08O | (TODO) -- GDC | clinical__biospecimen | |
| TCGA-A8-A08P | (TODO) -- GDC | clinical__biospecimen | |
| TCGA-A8-A08R | (TODO) -- GDC | clinical__biospecimen | |
| TCGA-A8-A08S | (TODO) -- GDC | clinical__biospecimen | |
| TCGA-A8-A08T | (TODO) -- GDC | clinical__biospecimen | |
| TCGA-A8-A08X | (TODO) -- GDC | clinical__biospecimen | |
| TCGA-A8-A08Z | (TODO) -- GDC | clinical__biospecimen | |
| TCGA-A8-A090 | (TODO) -- GDC | clinical__biospecimen | |
| TCGA-A8-A091 | (TODO) -- GDC | clinical__biospecimen | |
| TCGA-A8-A092 | (TODO) -- GDC | clinical__biospecimen | |
| TCGA-A8-A093 | (TODO) -- GDC | clinical__biospecimen | |
| TCGA-A8-A094 | (TODO) -- GDC | clinical__biospecimen | |
| TCGA-A8-A095 | (TODO) -- GDC | clinical__biospecimen | |
| TCGA-A8-A096 | (TODO) -- GDC | clinical__biospecimen | |
| TCGA-A8-A097 | (TODO) -- GDC | clinical__biospecimen | |
| TCGA-A8-A099 | (TODO) -- GDC | clinical__biospecimen | |
| TCGA-A8-A09A | (TODO) -- GDC | clinical__biospecimen | |
| TCGA-A8-A09B | (TODO) -- GDC | clinical__biospecimen | |
| TCGA-A8-A09C | (TODO) -- GDC | clinical__biospecimen | |
| TCGA-A8-A09D | (TODO) -- GDC | clinical__biospecimen | |
| TCGA-A8-A09E | (TODO) -- GDC | clinical__biospecimen | |
| TCGA-A8-A09G | (TODO) -- GDC | clinical__biospecimen | |
| TCGA-A8-A09I | (TODO) -- GDC | clinical__biospecimen | |
| TCGA-A8-A09K | (TODO) -- GDC | clinical__biospecimen | |
| TCGA-A8-A09M | (TODO) -- GDC | clinical__biospecimen | |
| TCGA-A8-A09N | (TODO) -- GDC | clinical__biospecimen | |
| TCGA-A8-A09Q | (TODO) -- GDC | clinical__biospecimen | |
| TCGA-A8-A09R | (TODO) -- GDC | clinical__biospecimen | |
| TCGA-A8-A09T | (TODO) -- GDC | clinical__biospecimen | |
| TCGA-A8-A09V | (TODO) -- GDC | clinical__biospecimen | |
| TCGA-A8-A09W | (TODO) -- GDC | clinical__biospecimen | |
| TCGA-A8-A09X | (TODO) -- GDC | clinical__biospecimen | |
| TCGA-A8-A09Z | (TODO) -- GDC | clinical__biospecimen | |
| TCGA-A8-A0A1 | (TODO) -- GDC | clinical__biospecimen | |
| TCGA-A8-A0A2 | (TODO) -- GDC | clinical__biospecimen | |
| TCGA-A8-A0A4 | (TODO) -- GDC | clinical__biospecimen | |
| TCGA-A8-A0A6 | (TODO) -- GDC | clinical__biospecimen | |
| TCGA-A8-A0A7 | (TODO) -- GDC | clinical__biospecimen | |
| TCGA-A8-A0A9 | (TODO) -- GDC | clinical__biospecimen | |
| TCGA-A8-A0AB | (TODO) -- GDC | clinical__biospecimen | |
| TCGA-A8-A0AD | (TODO) -- GDC | clinical__biospecimen | |
| TCGA-AC-A23C | (TODO) -- GDC | clinical__biospecimen | |
| TCGA-AC-A23E | (TODO) -- GDC | clinical__biospecimen | |
| TCGA-AC-A2B8 | (TODO) -- GDC | clinical__biospecimen | |
| TCGA-AC-A2QH | (TODO) -- GDC | clinical__biospecimen | |
| TCGA-AC-A2QI | (TODO) -- GDC | clinical__biospecimen | |
| TCGA-AC-A3BB | (TODO) -- GDC | clinical__biospecimen | |
| TCGA-AC-A3HN | (TODO) -- GDC | clinical__biospecimen | |
| TCGA-AC-A3OD | (TODO) -- GDC | clinical__biospecimen | |
| TCGA-AC-A3QP | (TODO) -- GDC | clinical__biospecimen | |
| TCGA-AC-A3QQ | (TODO) -- GDC | clinical__biospecimen | |
| TCGA-AC-A3TM | (TODO) -- GDC | clinical__biospecimen | |
| TCGA-AC-A3TN | (TODO) -- GDC | clinical__biospecimen | |
| TCGA-AC-A3W5 | (TODO) -- GDC | clinical__biospecimen | |
| TCGA-AC-A3W6 | (TODO) -- GDC | clinical__biospecimen | |
| TCGA-AC-A3W7 | (TODO) -- GDC | clinical__biospecimen | |
| TCGA-AC-A3YI | (TODO) -- GDC | clinical__biospecimen | |
| TCGA-AC-A3YJ | (TODO) -- GDC | clinical__biospecimen | |
| TCGA-AC-A4ZE | (TODO) -- GDC | clinical__biospecimen | |
| TCGA-AC-A5EH | (TODO) -- GDC | clinical__biospecimen | |
| TCGA-AC-A5EI | (TODO) -- GDC | clinical__biospecimen | |
| TCGA-AC-A5XS | (TODO) -- GDC | clinical__biospecimen | |
| TCGA-AC-A5XU | (TODO) -- GDC | clinical__biospecimen | |
| TCGA-AC-A62V | (TODO) -- GDC | clinical__biospecimen | |
| TCGA-AC-A62X | (TODO) -- GDC | clinical__biospecimen | |
| TCGA-AC-A62Y | (TODO) -- GDC | clinical__biospecimen | |
| TCGA-AC-A6IV | (TODO) -- GDC | clinical__biospecimen | |
| TCGA-AC-A6IW | (TODO) -- GDC | clinical__biospecimen | |
| TCGA-AC-A6IX | (TODO) -- GDC | clinical__biospecimen | |
| TCGA-AC-A6NO | (TODO) -- GDC | clinical__biospecimen | |
| TCGA-AC-A7VB | (TODO) -- GDC | clinical__biospecimen | |
| TCGA-AC-A7VC | (TODO) -- GDC | clinical__biospecimen | |
| TCGA-AC-A8OP | (TODO) -- GDC | clinical__biospecimen | |
| TCGA-AC-A8OQ | (TODO) -- GDC | clinical__biospecimen | |
| TCGA-AC-A8OR | (TODO) -- GDC | clinical__biospecimen | |
| TCGA-AC-A8OS | (TODO) -- GDC | clinical__biospecimen | |
| TCGA-AN-A03X | (TODO) -- GDC | clinical__biospecimen | |
| TCGA-AN-A03Y | (TODO) -- GDC | clinical__biospecimen | |
| TCGA-AN-A041 | (TODO) -- GDC | clinical__biospecimen | |
| TCGA-AN-A046 | (TODO) -- GDC | clinical__biospecimen | |
| TCGA-AN-A049 | (TODO) -- GDC | clinical__biospecimen | |
| TCGA-AN-A04A | (TODO) -- GDC | clinical__biospecimen | |
| TCGA-AN-A04C | (TODO) -- GDC | clinical__biospecimen | |
| TCGA-AN-A04D | (TODO) -- GDC | clinical__biospecimen | |
| TCGA-AN-A0AJ | (TODO) -- GDC | clinical__biospecimen | |
| TCGA-AN-A0AK | (TODO) -- GDC | clinical__biospecimen | |
| TCGA-AN-A0AL | (TODO) -- GDC | clinical__biospecimen | |
| TCGA-AN-A0AM | (TODO) -- GDC | clinical__biospecimen | |
| TCGA-AN-A0AR | (TODO) -- GDC | clinical__biospecimen | |
| TCGA-AN-A0AS | (TODO) -- GDC | clinical__biospecimen | |
| TCGA-AN-A0AT | (TODO) -- GDC | clinical__biospecimen | |
| TCGA-AN-A0FD | (TODO) -- GDC | clinical__biospecimen | |
| TCGA-AN-A0FF | (TODO) -- GDC | clinical__biospecimen | |
| TCGA-AN-A0FJ | (TODO) -- GDC | clinical__biospecimen | |
| TCGA-AN-A0FK | (TODO) -- GDC | clinical__biospecimen | |
| TCGA-AN-A0FL | (TODO) -- GDC | clinical__biospecimen | |
| TCGA-AN-A0FN | (TODO) -- GDC | clinical__biospecimen | |
| TCGA-AN-A0FS | (TODO) -- GDC | clinical__biospecimen | |
| TCGA-AN-A0FT | (TODO) -- GDC | clinical__biospecimen | |
| TCGA-AN-A0FV | (TODO) -- GDC | clinical__biospecimen | |
| TCGA-AN-A0FW | (TODO) -- GDC | clinical__biospecimen | |
| TCGA-AN-A0FX | (TODO) -- GDC | clinical__biospecimen | |
| TCGA-AN-A0FY | (TODO) -- GDC | clinical__biospecimen | |
| TCGA-AN-A0FZ | (TODO) -- GDC | clinical__biospecimen | |
| TCGA-AN-A0G0 | (TODO) -- GDC | clinical__biospecimen | |
| TCGA-AN-A0XL | (TODO) -- GDC | clinical__biospecimen | |
| TCGA-AN-A0XN | (TODO) -- GDC | clinical__biospecimen | |
| TCGA-AN-A0XO | (TODO) -- GDC | clinical__biospecimen | |
| TCGA-AN-A0XP | (TODO) -- GDC | clinical__biospecimen | |
| TCGA-AN-A0XR | (TODO) -- GDC | clinical__biospecimen | |
| TCGA-AN-A0XS | (TODO) -- GDC | clinical__biospecimen | |
| TCGA-AN-A0XT | (TODO) -- GDC | clinical__biospecimen | |
| TCGA-AN-A0XU | (TODO) -- GDC | clinical__biospecimen | |
| TCGA-AN-A0XV | (TODO) -- GDC | clinical__biospecimen | |
| TCGA-AO-A03L | (TODO) -- GDC | clinical__biospecimen | |
| TCGA-AO-A03M | (TODO) -- GDC | clinical__biospecimen | |
| TCGA-AO-A03N | (TODO) -- GDC | clinical__biospecimen | |
| TCGA-AO-A03O | (TODO) -- GDC | clinical__biospecimen | |
| TCGA-AO-A03P | (TODO) -- GDC | clinical__biospecimen | |
| TCGA-AO-A03R | (TODO) -- GDC | clinical__biospecimen | |
| TCGA-AO-A03T | (TODO) -- GDC | clinical__biospecimen | |
| TCGA-AO-A03U | (TODO) -- GDC | clinical__biospecimen | |
| TCGA-AO-A03V | (TODO) -- GDC | clinical__biospecimen | |
| TCGA-AO-A0J2 | (TODO) -- GDC | clinical__biospecimen | |
| TCGA-AO-A0J3 | (TODO) -- GDC | clinical__biospecimen | |
| TCGA-AO-A0J4 | (TODO) -- GDC | clinical__biospecimen | |
| TCGA-AO-A0J5 | (TODO) -- GDC | clinical__biospecimen | |
| TCGA-AO-A0J6 | (TODO) -- GDC | clinical__biospecimen | |
| TCGA-AO-A0J7 | (TODO) -- GDC | clinical__biospecimen | |
| TCGA-AO-A0J8 | (TODO) -- GDC | clinical__biospecimen | |
| TCGA-AO-A0J9 | (TODO) -- GDC | clinical__biospecimen | |
| TCGA-AO-A0JA | (TODO) -- GDC | clinical__biospecimen | |
| TCGA-AO-A0JB | (TODO) -- GDC | clinical__biospecimen | |
| TCGA-AO-A0JC | (TODO) -- GDC | clinical__biospecimen | |
| TCGA-AO-A0JD | (TODO) -- GDC | clinical__biospecimen | |
| TCGA-AO-A0JE | (TODO) -- GDC | clinical__biospecimen | |
| TCGA-AO-A0JF | (TODO) -- GDC | clinical__biospecimen | |
| TCGA-AO-A0JG | (TODO) -- GDC | clinical__biospecimen | |
| TCGA-AO-A0JI | (TODO) -- GDC | clinical__biospecimen | |
| TCGA-AO-A0JJ | (TODO) -- GDC | clinical__biospecimen | |
| TCGA-AO-A0JL | (TODO) -- GDC | clinical__biospecimen | |
| TCGA-AO-A0JM | (TODO) -- GDC | clinical__biospecimen | |
| TCGA-AO-A124 | (TODO) -- GDC | clinical__biospecimen | |
| TCGA-AO-A125 | (TODO) -- GDC | clinical__biospecimen | |
| TCGA-AO-A126 | (TODO) -- GDC | clinical__biospecimen | |
| TCGA-AO-A128 | (TODO) -- GDC | clinical__biospecimen | |
| TCGA-AO-A129 | (TODO) -- GDC | clinical__biospecimen | |
| TCGA-AO-A12A | (TODO) -- GDC | clinical__biospecimen | |
| TCGA-AO-A12B | (TODO) -- GDC | clinical__biospecimen | |
| TCGA-AO-A12C | (TODO) -- GDC | clinical__biospecimen | |
| TCGA-AO-A12D | (TODO) -- GDC | clinical__biospecimen | |
| TCGA-AO-A12F | (TODO) -- GDC | clinical__biospecimen | |
| TCGA-AO-A12G | (TODO) -- GDC | clinical__biospecimen | |
| TCGA-AO-A12H | (TODO) -- GDC | clinical__biospecimen | |
| TCGA-AO-A1KO | (TODO) -- GDC | clinical__biospecimen | |
| TCGA-AO-A1KP | (TODO) -- GDC | clinical__biospecimen | |
| TCGA-AO-A1KR | (TODO) -- GDC | clinical__biospecimen | |
| TCGA-AO-A1KS | (TODO) -- GDC | clinical__biospecimen | |
| TCGA-AO-A1KT | (TODO) -- GDC | clinical__biospecimen | |
| TCGA-AQ-A04H | (TODO) -- GDC | clinical__biospecimen | |
| TCGA-AQ-A04J | (TODO) -- GDC | clinical__biospecimen | |
| TCGA-AQ-A0Y5 | (TODO) -- GDC | clinical__biospecimen | |
| TCGA-AQ-A1H2 | (TODO) -- GDC | clinical__biospecimen | |
| TCGA-AQ-A1H3 | (TODO) -- GDC | clinical__biospecimen | |
| TCGA-AQ-A54N | (TODO) -- GDC | clinical__biospecimen | |
| TCGA-AQ-A54O | (TODO) -- GDC | clinical__biospecimen | |
| TCGA-AQ-A7U7 | (TODO) -- GDC | clinical__biospecimen | |
| TCGA-AR-A0TP | (TODO) -- GDC | clinical__biospecimen | |
| TCGA-AR-A0TQ | (TODO) -- GDC | clinical__biospecimen | |
| TCGA-AR-A0TR | (TODO) -- GDC | clinical__biospecimen | |
| TCGA-AR-A0TS | (TODO) -- GDC | clinical__biospecimen | |
| TCGA-AR-A0TT | (TODO) -- GDC | clinical__biospecimen | |
| TCGA-AR-A0TU | (TODO) -- GDC | clinical__biospecimen | |
| TCGA-AR-A0TV | (TODO) -- GDC | clinical__biospecimen | |
| TCGA-AR-A0TW | (TODO) -- GDC | clinical__biospecimen | |
| TCGA-AR-A0TX | (TODO) -- GDC | clinical__biospecimen | |
| TCGA-AR-A0TY | (TODO) -- GDC | clinical__biospecimen | |
| TCGA-AR-A0TZ | (TODO) -- GDC | clinical__biospecimen | |
| TCGA-AR-A0U0 | (TODO) -- GDC | clinical__biospecimen | |
| TCGA-AR-A0U1 | (TODO) -- GDC | clinical__biospecimen | |
| TCGA-AR-A0U2 | (TODO) -- GDC | clinical__biospecimen | |
| TCGA-AR-A0U3 | (TODO) -- GDC | clinical__biospecimen | |
| TCGA-AR-A0U4 | (TODO) -- GDC | clinical__biospecimen | |
| TCGA-AR-A1AH | (TODO) -- GDC | clinical__biospecimen | |
| TCGA-AR-A1AI | (TODO) -- GDC | clinical__biospecimen | |
| TCGA-AR-A1AJ | (TODO) -- GDC | clinical__biospecimen | |
| TCGA-AR-A1AK | (TODO) -- GDC | clinical__biospecimen | |
| TCGA-AR-A1AL | (TODO) -- GDC | clinical__biospecimen | |
| TCGA-AR-A1AM | (TODO) -- GDC | clinical__biospecimen | |
| TCGA-AR-A1AN | (TODO) -- GDC | clinical__biospecimen | |
| TCGA-AR-A1AO | (TODO) -- GDC | clinical__biospecimen | |
| TCGA-AR-A1AP | (TODO) -- GDC | clinical__biospecimen | |
| TCGA-AR-A1AQ | (TODO) -- GDC | clinical__biospecimen | |
| TCGA-AR-A1AR | (TODO) -- GDC | clinical__biospecimen | |
| TCGA-AR-A1AS | (TODO) -- GDC | clinical__biospecimen | |
| TCGA-AR-A1AT | (TODO) -- GDC | clinical__biospecimen | |
| TCGA-AR-A1AU | (TODO) -- GDC | clinical__biospecimen | |
| TCGA-AR-A1AV | (TODO) -- GDC | clinical__biospecimen | |
| TCGA-AR-A1AW | (TODO) -- GDC | clinical__biospecimen | |
| TCGA-AR-A1AX | (TODO) -- GDC | clinical__biospecimen | |
| TCGA-AR-A1AY | (TODO) -- GDC | clinical__biospecimen | |
| TCGA-AR-A24H | (TODO) -- GDC | clinical__biospecimen | |
| TCGA-AR-A24K | (TODO) -- GDC | clinical__biospecimen | |
| TCGA-AR-A24M | (TODO) -- GDC | clinical__biospecimen | |
| TCGA-AR-A24N | (TODO) -- GDC | clinical__biospecimen | |
| TCGA-AR-A24O | (TODO) -- GDC | clinical__biospecimen | |
| TCGA-AR-A24P | (TODO) -- GDC | clinical__biospecimen | |
| TCGA-AR-A24Q | (TODO) -- GDC | clinical__biospecimen | |
| TCGA-AR-A24R | (TODO) -- GDC | clinical__biospecimen | |
| TCGA-AR-A24S | (TODO) -- GDC | clinical__biospecimen | |
| TCGA-AR-A24V | (TODO) -- GDC | clinical__biospecimen | |
| TCGA-AR-A24W | (TODO) -- GDC | clinical__biospecimen | |
| TCGA-AR-A24X | (TODO) -- GDC | clinical__biospecimen | |
| TCGA-AR-A24Z | (TODO) -- GDC | clinical__biospecimen | |
| TCGA-AR-A250 | (TODO) -- GDC | clinical__biospecimen | |
| TCGA-AR-A251 | (TODO) -- GDC | clinical__biospecimen | |
| TCGA-AR-A252 | (TODO) -- GDC | clinical__biospecimen | |
| TCGA-AR-A254 | (TODO) -- GDC | clinical__biospecimen | |
| TCGA-AR-A255 | (TODO) -- GDC | clinical__biospecimen | |
| TCGA-AR-A256 | (TODO) -- GDC | clinical__biospecimen | |
| TCGA-AR-A2LE | (TODO) -- GDC | clinical__biospecimen | |
| TCGA-AR-A2LH | (TODO) -- GDC | clinical__biospecimen | |
| TCGA-AR-A2LJ | (TODO) -- GDC | clinical__biospecimen | |
| TCGA-AR-A2LK | (TODO) -- GDC | clinical__biospecimen | |
| TCGA-AR-A2LL | (TODO) -- GDC | clinical__biospecimen | |
| TCGA-AR-A2LM | (TODO) -- GDC | clinical__biospecimen | |
| TCGA-AR-A2LN | (TODO) -- GDC | clinical__biospecimen | |
| TCGA-AR-A2LO | (TODO) -- GDC | clinical__biospecimen | |
| TCGA-AR-A2LQ | (TODO) -- GDC | clinical__biospecimen | |
| TCGA-AR-A2LR | (TODO) -- GDC | clinical__biospecimen | |
| TCGA-AR-A5QM | (TODO) -- GDC | clinical__biospecimen | |
| TCGA-AR-A5QN | (TODO) -- GDC | clinical__biospecimen | |
| TCGA-AR-A5QP | (TODO) -- GDC | clinical__biospecimen | |
| TCGA-AR-A5QQ | (TODO) -- GDC | clinical__biospecimen | |
| TCGA-B6-A0I1 | (TODO) -- GDC | clinical__biospecimen | |
| TCGA-B6-A0I2 | (TODO) -- GDC | clinical__biospecimen | |
| TCGA-B6-A0I5 | (TODO) -- GDC | clinical__biospecimen | |
| TCGA-B6-A0I6 | (TODO) -- GDC | clinical__biospecimen | |
| TCGA-B6-A0I8 | (TODO) -- GDC | clinical__biospecimen | |
| TCGA-B6-A0I9 | (TODO) -- GDC | clinical__biospecimen | |
| TCGA-B6-A0IA | (TODO) -- GDC | clinical__biospecimen | |
| TCGA-B6-A0IB | (TODO) -- GDC | clinical__biospecimen | |
| TCGA-B6-A0IC | (TODO) -- GDC | clinical__biospecimen | |
| TCGA-B6-A0IE | (TODO) -- GDC | clinical__biospecimen | |
| TCGA-B6-A0IG | (TODO) -- GDC | clinical__biospecimen | |
| TCGA-B6-A0IH | (TODO) -- GDC | clinical__biospecimen | |
| TCGA-B6-A0IJ | (TODO) -- GDC | clinical__biospecimen | |
| TCGA-B6-A0IK | (TODO) -- GDC | clinical__biospecimen | |
| TCGA-B6-A0IM | (TODO) -- GDC | clinical__biospecimen | |
| TCGA-B6-A0IN | (TODO) -- GDC | clinical__biospecimen | |
| TCGA-B6-A0IO | (TODO) -- GDC | clinical__biospecimen | |
| TCGA-B6-A0IP | (TODO) -- GDC | clinical__biospecimen | |
| TCGA-B6-A0IQ | (TODO) -- GDC | clinical__biospecimen | |
| TCGA-B6-A0RE | (TODO) -- GDC | clinical__biospecimen | |
| TCGA-B6-A0RG | (TODO) -- GDC | clinical__biospecimen | |
| TCGA-B6-A0RH | (TODO) -- GDC | clinical__biospecimen | |
| TCGA-B6-A0RI | (TODO) -- GDC | clinical__biospecimen | |
| TCGA-B6-A0RL | (TODO) -- GDC | clinical__biospecimen | |
| TCGA-B6-A0RM | (TODO) -- GDC | clinical__biospecimen | |
| TCGA-B6-A0RN | (TODO) -- GDC | clinical__biospecimen | |
| TCGA-B6-A0RO | (TODO) -- GDC | clinical__biospecimen | |
| TCGA-B6-A0RP | (TODO) -- GDC | clinical__biospecimen | |
| TCGA-B6-A0RQ | (TODO) -- GDC | clinical__biospecimen | |
| TCGA-B6-A0RS | (TODO) -- GDC | clinical__biospecimen | |
| TCGA-B6-A0RT | (TODO) -- GDC | clinical__biospecimen | |
| TCGA-B6-A0RU | (TODO) -- GDC | clinical__biospecimen | |
| TCGA-B6-A0RV | (TODO) -- GDC | clinical__biospecimen | |
| TCGA-B6-A0WS | (TODO) -- GDC | clinical__biospecimen | |
| TCGA-B6-A0WT | (TODO) -- GDC | clinical__biospecimen | |
| TCGA-B6-A0WV | (TODO) -- GDC | clinical__biospecimen | |
| TCGA-B6-A0WX | (TODO) -- GDC | clinical__biospecimen | |
| TCGA-B6-A0WY | (TODO) -- GDC | clinical__biospecimen | |
| TCGA-B6-A0WZ | (TODO) -- GDC | clinical__biospecimen | |
| TCGA-B6-A0X0 | (TODO) -- GDC | clinical__biospecimen | |
| TCGA-B6-A0X1 | (TODO) -- GDC | clinical__biospecimen | |
| TCGA-B6-A0X4 | (TODO) -- GDC | clinical__biospecimen | |
| TCGA-B6-A0X5 | (TODO) -- GDC | clinical__biospecimen | |
| TCGA-B6-A0X7 | (TODO) -- GDC | clinical__biospecimen | |
| TCGA-B6-A1KC | (TODO) -- GDC | clinical__biospecimen | |
| TCGA-B6-A1KF | (TODO) -- GDC | clinical__biospecimen | |
| TCGA-B6-A1KI | (TODO) -- GDC | clinical__biospecimen | |
| TCGA-B6-A1KN | (TODO) -- GDC | clinical__biospecimen | |
| TCGA-B6-A2IU | (TODO) -- GDC | clinical__biospecimen | |
| TCGA-B6-A3ZX | (TODO) -- GDC | clinical__biospecimen | |
| TCGA-B6-A401 | (TODO) -- GDC | clinical__biospecimen | |
| TCGA-B6-A408 | (TODO) -- GDC | clinical__biospecimen | |
| TCGA-B6-A409 | (TODO) -- GDC | clinical__biospecimen | |
| TCGA-B6-A40C | (TODO) -- GDC | clinical__biospecimen | |
| TCGA-BH-A0AV | (TODO) -- GDC | clinical__biospecimen | |
| TCGA-BH-A0AW | (TODO) -- GDC | clinical__biospecimen | |
| TCGA-BH-A0AY | (TODO) -- GDC | clinical__biospecimen | |
| TCGA-BH-A0B0 | (TODO) -- GDC | clinical__biospecimen | |
| TCGA-BH-A0B1 | (TODO) -- GDC | clinical__biospecimen | |
| TCGA-BH-A0B2 | (TODO) -- GDC | clinical__biospecimen | |
| TCGA-BH-A0B3 | (TODO) -- GDC | clinical__biospecimen | |
| TCGA-BH-A0B4 | (TODO) -- GDC | clinical__biospecimen | |
| TCGA-BH-A0B6 | (TODO) -- GDC | clinical__biospecimen | |
| TCGA-BH-A0B7 | (TODO) -- GDC | clinical__biospecimen | |
| TCGA-BH-A0B8 | (TODO) -- GDC | clinical__biospecimen | |
| TCGA-BH-A0B9 | (TODO) -- GDC | clinical__biospecimen | |
| TCGA-BH-A0BA | (TODO) -- GDC | clinical__biospecimen | |
| TCGA-BH-A0BC | (TODO) -- GDC | clinical__biospecimen | |
| TCGA-BH-A0BD | (TODO) -- GDC | clinical__biospecimen | |
| TCGA-BH-A0BG | (TODO) -- GDC | clinical__biospecimen | |
| TCGA-BH-A0BJ | (TODO) -- GDC | clinical__biospecimen | |
| TCGA-BH-A0BL | (TODO) -- GDC | clinical__biospecimen | |
| TCGA-BH-A0BM | (TODO) -- GDC | clinical__biospecimen | |
| TCGA-BH-A0BO | (TODO) -- GDC | clinical__biospecimen | |
| TCGA-BH-A0BP | (TODO) -- GDC | clinical__biospecimen | |
| TCGA-BH-A0BR | (TODO) -- GDC | clinical__biospecimen | |
| TCGA-BH-A0BV | (TODO) -- GDC | clinical__biospecimen | |
| TCGA-BH-A0BW | (TODO) -- GDC | clinical__biospecimen | |
| TCGA-BH-A0C0 | (TODO) -- GDC | clinical__biospecimen | |
| TCGA-BH-A0C1 | (TODO) -- GDC | clinical__biospecimen | |
| TCGA-BH-A0C7 | (TODO) -- GDC | clinical__biospecimen | |
| TCGA-BH-A0DE | (TODO) -- GDC | clinical__biospecimen | |
| TCGA-BH-A0DH | (TODO) -- GDC | clinical__biospecimen | |
| TCGA-BH-A0DK | (TODO) -- GDC | clinical__biospecimen | |
| TCGA-BH-A0DL | (TODO) -- GDC | clinical__biospecimen | |
| TCGA-BH-A0DP | (TODO) -- GDC | clinical__biospecimen | |
| TCGA-BH-A0DQ | (TODO) -- GDC | clinical__biospecimen | |
| TCGA-BH-A0DS | (TODO) -- GDC | clinical__biospecimen | |
| TCGA-BH-A0DX | (TODO) -- GDC | clinical__biospecimen | |
| TCGA-BH-A0DZ | (TODO) -- GDC | clinical__biospecimen | |
| TCGA-BH-A0E0 | (TODO) -- GDC | clinical__biospecimen | |
| TCGA-BH-A0E1 | (TODO) -- GDC | clinical__biospecimen | |
| TCGA-BH-A0E2 | (TODO) -- GDC | clinical__biospecimen | |
| TCGA-BH-A0E6 | (TODO) -- GDC | clinical__biospecimen | |
| TCGA-BH-A0E7 | (TODO) -- GDC | clinical__biospecimen | |
| TCGA-BH-A0E9 | (TODO) -- GDC | clinical__biospecimen | |
| TCGA-BH-A0EA | (TODO) -- GDC | clinical__biospecimen | |
| TCGA-BH-A0EB | (TODO) -- GDC | clinical__biospecimen | |
| TCGA-BH-A0EE | (TODO) -- GDC | clinical__biospecimen | |
| TCGA-BH-A0EI | (TODO) -- GDC | clinical__biospecimen | |
| TCGA-BH-A0GY | (TODO) -- GDC | clinical__biospecimen | |
| TCGA-BH-A0GZ | (TODO) -- GDC | clinical__biospecimen | |
| TCGA-BH-A0H0 | (TODO) -- GDC | clinical__biospecimen | |
| TCGA-BH-A0H5 | (TODO) -- GDC | clinical__biospecimen | |
| TCGA-BH-A0H6 | (TODO) -- GDC | clinical__biospecimen | |
| TCGA-BH-A0H7 | (TODO) -- GDC | clinical__biospecimen | |
| TCGA-BH-A0H9 | (TODO) -- GDC | clinical__biospecimen | |
| TCGA-BH-A0HB | (TODO) -- GDC | clinical__biospecimen | |
| TCGA-BH-A0HF | (TODO) -- GDC | clinical__biospecimen | |
| TCGA-BH-A0HI | (TODO) -- GDC | clinical__biospecimen | |
| TCGA-BH-A0HK | (TODO) -- GDC | clinical__biospecimen | |
| TCGA-BH-A0HL | (TODO) -- GDC | clinical__biospecimen | |
| TCGA-BH-A0HN | (TODO) -- GDC | clinical__biospecimen | |
| TCGA-BH-A0HO | (TODO) -- GDC | clinical__biospecimen | |
| TCGA-BH-A0HP | (TODO) -- GDC | clinical__biospecimen | |
| TCGA-BH-A0HQ | (TODO) -- GDC | clinical__biospecimen | |
| TCGA-BH-A0HU | (TODO) -- GDC | clinical__biospecimen | |
| TCGA-BH-A0HW | (TODO) -- GDC | clinical__biospecimen | |
| TCGA-BH-A0HX | (TODO) -- GDC | clinical__biospecimen | |
| TCGA-BH-A0HY | (TODO) -- GDC | clinical__biospecimen | |
| TCGA-BH-A0RX | (TODO) -- GDC | clinical__biospecimen | |
| TCGA-BH-A0W3 | (TODO) -- GDC | clinical__biospecimen | |
| TCGA-BH-A0W4 | (TODO) -- GDC | clinical__biospecimen | |
| TCGA-BH-A0W5 | (TODO) -- GDC | clinical__biospecimen | |
| TCGA-BH-A0W7 | (TODO) -- GDC | clinical__biospecimen | |
| TCGA-BH-A0WA | (TODO) -- GDC | clinical__biospecimen | |
| TCGA-BH-A18G | (TODO) -- GDC | clinical__biospecimen | |
| TCGA-BH-A18H | (TODO) -- GDC | clinical__biospecimen | |
| TCGA-BH-A18I | (TODO) -- GDC | clinical__biospecimen | |
| TCGA-BH-A201 | (TODO) -- GDC | clinical__biospecimen | |
| TCGA-BH-A202 | (TODO) -- GDC | clinical__biospecimen | |
| TCGA-BH-A28O | (TODO) -- GDC | clinical__biospecimen | |
| TCGA-BH-A28Q | (TODO) -- GDC | clinical__biospecimen | |
| TCGA-BH-A2L8 | (TODO) -- GDC | clinical__biospecimen | |
| TCGA-BH-A42T | (TODO) -- GDC | clinical__biospecimen | |
| TCGA-BH-A42U | (TODO) -- GDC | clinical__biospecimen | |
| TCGA-BH-A42V | (TODO) -- GDC | clinical__biospecimen | |
| TCGA-BH-A5IZ | (TODO) -- GDC | clinical__biospecimen | |
| TCGA-BH-A6R8 | (TODO) -- GDC | clinical__biospecimen | |
| TCGA-BH-A6R9 | (TODO) -- GDC | clinical__biospecimen | |
| TCGA-BH-A8FY | (TODO) -- GDC | clinical__biospecimen | |
| TCGA-BH-A8FZ | (TODO) -- GDC | clinical__biospecimen | |
| TCGA-BH-A8G0 | (TODO) -- GDC | clinical__biospecimen | |
| TCGA-BH-AB28 | (TODO) -- GDC | clinical__biospecimen | |
| TCGA-C8-A12K | (TODO) -- GDC | clinical__biospecimen | |
| TCGA-C8-A12L | (TODO) -- GDC | clinical__biospecimen | |
| TCGA-C8-A12M | (TODO) -- GDC | clinical__biospecimen | |
| TCGA-C8-A12N | (TODO) -- GDC | clinical__biospecimen | |
| TCGA-C8-A12O | (TODO) -- GDC | clinical__biospecimen | |
| TCGA-C8-A12P | (TODO) -- GDC | clinical__biospecimen | |
| TCGA-C8-A12Q | (TODO) -- GDC | clinical__biospecimen | |
| TCGA-C8-A12T | (TODO) -- GDC | clinical__biospecimen | |
| TCGA-C8-A12U | (TODO) -- GDC | clinical__biospecimen | |
| TCGA-C8-A12V | (TODO) -- GDC | clinical__biospecimen | |
| TCGA-C8-A12W | (TODO) -- GDC | clinical__biospecimen | |
| TCGA-C8-A12X | (TODO) -- GDC | clinical__biospecimen | |
| TCGA-C8-A12Y | (TODO) -- GDC | clinical__biospecimen | |
| TCGA-C8-A12Z | (TODO) -- GDC | clinical__biospecimen | |
| TCGA-C8-A130 | (TODO) -- GDC | clinical__biospecimen | |
| TCGA-C8-A131 | (TODO) -- GDC | clinical__biospecimen | |
| TCGA-C8-A132 | (TODO) -- GDC | clinical__biospecimen | |
| TCGA-C8-A133 | (TODO) -- GDC | clinical__biospecimen | |
| TCGA-C8-A134 | (TODO) -- GDC | clinical__biospecimen | |
| TCGA-C8-A135 | (TODO) -- GDC | clinical__biospecimen | |
| TCGA-C8-A137 | (TODO) -- GDC | clinical__biospecimen | |
| TCGA-C8-A138 | (TODO) -- GDC | clinical__biospecimen | |
| TCGA-C8-A1HE | (TODO) -- GDC | clinical__biospecimen | |
| TCGA-C8-A1HF | (TODO) -- GDC | clinical__biospecimen | |
| TCGA-C8-A1HG | (TODO) -- GDC | clinical__biospecimen | |
| TCGA-C8-A1HI | (TODO) -- GDC | clinical__biospecimen | |
| TCGA-C8-A1HJ | (TODO) -- GDC | clinical__biospecimen | |
| TCGA-C8-A1HK | (TODO) -- GDC | clinical__biospecimen | |
| TCGA-C8-A1HL | (TODO) -- GDC | clinical__biospecimen | |
| TCGA-C8-A1HM | (TODO) -- GDC | clinical__biospecimen | |
| TCGA-C8-A1HN | (TODO) -- GDC | clinical__biospecimen | |
| TCGA-C8-A1HO | (TODO) -- GDC | clinical__biospecimen | |
| TCGA-C8-A26V | (TODO) -- GDC | clinical__biospecimen | |
| TCGA-C8-A26W | (TODO) -- GDC | clinical__biospecimen | |
| TCGA-C8-A26X | (TODO) -- GDC | clinical__biospecimen | |
| TCGA-C8-A26Y | (TODO) -- GDC | clinical__biospecimen | |
| TCGA-C8-A26Z | (TODO) -- GDC | clinical__biospecimen | |
| TCGA-C8-A273 | (TODO) -- GDC | clinical__biospecimen | |
| TCGA-C8-A275 | (TODO) -- GDC | clinical__biospecimen | |
| TCGA-C8-A278 | (TODO) -- GDC | clinical__biospecimen | |
| TCGA-C8-A27A | (TODO) -- GDC | clinical__biospecimen | |
| TCGA-C8-A27B | (TODO) -- GDC | clinical__biospecimen | |
| TCGA-C8-A3M7 | (TODO) -- GDC | clinical__biospecimen | |
| TCGA-C8-A3M8 | (TODO) -- GDC | clinical__biospecimen | |
| TCGA-C8-A8HP | (TODO) -- GDC | clinical__biospecimen | |
| TCGA-C8-A8HQ | (TODO) -- GDC | clinical__biospecimen | |
| TCGA-C8-A8HR | (TODO) -- GDC | clinical__biospecimen | |
| TCGA-C8-A9FZ | (TODO) -- GDC | clinical__biospecimen | |
| TCGA-D8-A13Y | (TODO) -- GDC | clinical__biospecimen | |
| TCGA-D8-A13Z | (TODO) -- GDC | clinical__biospecimen | |
| TCGA-D8-A140 | (TODO) -- GDC | clinical__biospecimen | |
| TCGA-D8-A141 | (TODO) -- GDC | clinical__biospecimen | |
| TCGA-D8-A142 | (TODO) -- GDC | clinical__biospecimen | |
| TCGA-D8-A143 | (TODO) -- GDC | clinical__biospecimen | |
| TCGA-D8-A145 | (TODO) -- GDC | clinical__biospecimen | |
| TCGA-D8-A146 | (TODO) -- GDC | clinical__biospecimen | |
| TCGA-D8-A147 | (TODO) -- GDC | clinical__biospecimen | |
| TCGA-D8-A1J8 | (TODO) -- GDC | clinical__biospecimen | |
| TCGA-D8-A1J9 | (TODO) -- GDC | clinical__biospecimen | |
| TCGA-D8-A1JA | (TODO) -- GDC | clinical__biospecimen | |
| TCGA-D8-A1JB | (TODO) -- GDC | clinical__biospecimen | |
| TCGA-D8-A1JC | (TODO) -- GDC | clinical__biospecimen | |
| TCGA-D8-A1JD | (TODO) -- GDC | clinical__biospecimen | |
| TCGA-D8-A1JE | (TODO) -- GDC | clinical__biospecimen | |
| TCGA-D8-A1JF | (TODO) -- GDC | clinical__biospecimen | |
| TCGA-D8-A1JG | (TODO) -- GDC | clinical__biospecimen | |
| TCGA-D8-A1JH | (TODO) -- GDC | clinical__biospecimen | |
| TCGA-D8-A1JI | (TODO) -- GDC | clinical__biospecimen | |
| TCGA-D8-A1JJ | (TODO) -- GDC | clinical__biospecimen | |
| TCGA-D8-A1JK | (TODO) -- GDC | clinical__biospecimen | |
| TCGA-D8-A1JL | (TODO) -- GDC | clinical__biospecimen | |
| TCGA-D8-A1JM | (TODO) -- GDC | clinical__biospecimen | |
| TCGA-D8-A1JN | (TODO) -- GDC | clinical__biospecimen | |
| TCGA-D8-A1JP | (TODO) -- GDC | clinical__biospecimen | |
| TCGA-D8-A1JS | (TODO) -- GDC | clinical__biospecimen | |
| TCGA-D8-A1JT | (TODO) -- GDC | clinical__biospecimen | |
| TCGA-D8-A1JU | (TODO) -- GDC | clinical__biospecimen | |
| TCGA-D8-A1X5 | (TODO) -- GDC | clinical__biospecimen | |
| TCGA-D8-A1X6 | (TODO) -- GDC | clinical__biospecimen | |
| TCGA-D8-A1X7 | (TODO) -- GDC | clinical__biospecimen | |
| TCGA-D8-A1X8 | (TODO) -- GDC | clinical__biospecimen | |
| TCGA-D8-A1X9 | (TODO) -- GDC | clinical__biospecimen | |
| TCGA-D8-A1XA | (TODO) -- GDC | clinical__biospecimen | |
| TCGA-D8-A1XB | (TODO) -- GDC | clinical__biospecimen | |
| TCGA-D8-A1XC | (TODO) -- GDC | clinical__biospecimen | |
| TCGA-D8-A1XF | (TODO) -- GDC | clinical__biospecimen | |
| TCGA-D8-A1XG | (TODO) -- GDC | clinical__biospecimen | |
| TCGA-D8-A1XJ | (TODO) -- GDC | clinical__biospecimen | |
| TCGA-D8-A1XK | (TODO) -- GDC | clinical__biospecimen | |
| TCGA-D8-A1XL | (TODO) -- GDC | clinical__biospecimen | |
| TCGA-D8-A1XM | (TODO) -- GDC | clinical__biospecimen | |
| TCGA-D8-A1XO | (TODO) -- GDC | clinical__biospecimen | |
| TCGA-D8-A1XQ | (TODO) -- GDC | clinical__biospecimen | |
| TCGA-D8-A1XR | (TODO) -- GDC | clinical__biospecimen | |
| TCGA-D8-A1XS | (TODO) -- GDC | clinical__biospecimen | |
| TCGA-D8-A1XT | (TODO) -- GDC | clinical__biospecimen | |
| TCGA-D8-A1XU | (TODO) -- GDC | clinical__biospecimen | |
| TCGA-D8-A1XV | (TODO) -- GDC | clinical__biospecimen | |
| TCGA-D8-A1XW | (TODO) -- GDC | clinical__biospecimen | |
| TCGA-D8-A1XY | (TODO) -- GDC | clinical__biospecimen | |
| TCGA-D8-A1XZ | (TODO) -- GDC | clinical__biospecimen | |
| TCGA-D8-A1Y0 | (TODO) -- GDC | clinical__biospecimen | |
| TCGA-D8-A1Y2 | (TODO) -- GDC | clinical__biospecimen | |
| TCGA-D8-A1Y3 | (TODO) -- GDC | clinical__biospecimen | |
| TCGA-D8-A27F | (TODO) -- GDC | clinical__biospecimen | |
| TCGA-D8-A27G | (TODO) -- GDC | clinical__biospecimen | |
| TCGA-D8-A27H | (TODO) -- GDC | clinical__biospecimen | |
| TCGA-D8-A27I | (TODO) -- GDC | clinical__biospecimen | |
| TCGA-D8-A27K | (TODO) -- GDC | clinical__biospecimen | |
| TCGA-D8-A27L | (TODO) -- GDC | clinical__biospecimen | |
| TCGA-D8-A27M | (TODO) -- GDC | clinical__biospecimen | |
| TCGA-D8-A27N | (TODO) -- GDC | clinical__biospecimen | |
| TCGA-D8-A27P | (TODO) -- GDC | clinical__biospecimen | |
| TCGA-D8-A27R | (TODO) -- GDC | clinical__biospecimen | |
| TCGA-D8-A27T | (TODO) -- GDC | clinical__biospecimen | |
| TCGA-D8-A27V | (TODO) -- GDC | clinical__biospecimen | |
| TCGA-D8-A27W | (TODO) -- GDC | clinical__biospecimen | |
| TCGA-D8-A3Z5 | (TODO) -- GDC | clinical__biospecimen | |
| TCGA-D8-A3Z6 | (TODO) -- GDC | clinical__biospecimen | |
| TCGA-D8-A4Z1 | (TODO) -- GDC | clinical__biospecimen | |
| TCGA-D8-A73U | (TODO) -- GDC | clinical__biospecimen | |
| TCGA-D8-A73W | (TODO) -- GDC | clinical__biospecimen | |
| TCGA-D8-A73X | (TODO) -- GDC | clinical__biospecimen | |
| TCGA-E2-A105 | (TODO) -- GDC | clinical__biospecimen | |
| TCGA-E2-A106 | (TODO) -- GDC | clinical__biospecimen | |
| TCGA-E2-A107 | (TODO) -- GDC | clinical__biospecimen | |
| TCGA-E2-A108 | (TODO) -- GDC | clinical__biospecimen | |
| TCGA-E2-A109 | (TODO) -- GDC | clinical__biospecimen | |
| TCGA-E2-A10A | (TODO) -- GDC | clinical__biospecimen | |
| TCGA-E2-A10C | (TODO) -- GDC | clinical__biospecimen | |
| TCGA-E2-A10F | (TODO) -- GDC | clinical__biospecimen | |
| TCGA-E2-A14N | (TODO) -- GDC | clinical__biospecimen | |
| TCGA-E2-A14O | (TODO) -- GDC | clinical__biospecimen | |
| TCGA-E2-A14P | (TODO) -- GDC | clinical__biospecimen | |
| TCGA-E2-A14Q | (TODO) -- GDC | clinical__biospecimen | |
| TCGA-E2-A14R | (TODO) -- GDC | clinical__biospecimen | |
| TCGA-E2-A14S | (TODO) -- GDC | clinical__biospecimen | |
| TCGA-E2-A14T | (TODO) -- GDC | clinical__biospecimen | |
| TCGA-E2-A14U | (TODO) -- GDC | clinical__biospecimen | |
| TCGA-E2-A14V | (TODO) -- GDC | clinical__biospecimen | |
| TCGA-E2-A14X | (TODO) -- GDC | clinical__biospecimen | |
| TCGA-E2-A14Y | (TODO) -- GDC | clinical__biospecimen | |
| TCGA-E2-A14Z | (TODO) -- GDC | clinical__biospecimen | |
| TCGA-E2-A150 | (TODO) -- GDC | clinical__biospecimen | |
| TCGA-E2-A152 | (TODO) -- GDC | clinical__biospecimen | |
| TCGA-E2-A153 | (TODO) -- GDC | clinical__biospecimen | |
| TCGA-E2-A154 | (TODO) -- GDC | clinical__biospecimen | |
| TCGA-E2-A155 | (TODO) -- GDC | clinical__biospecimen | |
| TCGA-E2-A156 | (TODO) -- GDC | clinical__biospecimen | |
| TCGA-E2-A158 | (TODO) -- GDC | clinical__biospecimen | |
| TCGA-E2-A159 | (TODO) -- GDC | clinical__biospecimen | |
| TCGA-E2-A15A | (TODO) -- GDC | clinical__biospecimen | |
| TCGA-E2-A15C | (TODO) -- GDC | clinical__biospecimen | |
| TCGA-E2-A15D | (TODO) -- GDC | clinical__biospecimen | |
| TCGA-E2-A15E | (TODO) -- GDC | clinical__biospecimen | |
| TCGA-E2-A15F | (TODO) -- GDC | clinical__biospecimen | |
| TCGA-E2-A15G | (TODO) -- GDC | clinical__biospecimen | |
| TCGA-E2-A15H | (TODO) -- GDC | clinical__biospecimen | |
| TCGA-E2-A15I | (TODO) -- GDC | clinical__biospecimen | |
| TCGA-E2-A15K | (TODO) -- GDC | clinical__biospecimen | |
| TCGA-E2-A15L | (TODO) -- GDC | clinical__biospecimen | |
| TCGA-E2-A15M | (TODO) -- GDC | clinical__biospecimen | |
| TCGA-E2-A15O | (TODO) -- GDC | clinical__biospecimen | |
| TCGA-E2-A15P | (TODO) -- GDC | clinical__biospecimen | |
| TCGA-E2-A15R | (TODO) -- GDC | clinical__biospecimen | |
| TCGA-E2-A15S | (TODO) -- GDC | clinical__biospecimen | |
| TCGA-E2-A15T | (TODO) -- GDC | clinical__biospecimen | |
| TCGA-E2-A1B0 | (TODO) -- GDC | clinical__biospecimen | |
| TCGA-E2-A1B1 | (TODO) -- GDC | clinical__biospecimen | |
| TCGA-E2-A1B4 | (TODO) -- GDC | clinical__biospecimen | |
| TCGA-E2-A1B5 | (TODO) -- GDC | clinical__biospecimen | |
| TCGA-E2-A1B6 | (TODO) -- GDC | clinical__biospecimen | |
| TCGA-E2-A1BC | (TODO) -- GDC | clinical__biospecimen | |
| TCGA-E2-A1BD | (TODO) -- GDC | clinical__biospecimen | |
| TCGA-E2-A1IE | (TODO) -- GDC | clinical__biospecimen | |
| TCGA-E2-A1IF | (TODO) -- GDC | clinical__biospecimen | |
| TCGA-E2-A1IG | (TODO) -- GDC | clinical__biospecimen | |
| TCGA-E2-A1IH | (TODO) -- GDC | clinical__biospecimen | |
| TCGA-E2-A1II | (TODO) -- GDC | clinical__biospecimen | |
| TCGA-E2-A1IJ | (TODO) -- GDC | clinical__biospecimen | |
| TCGA-E2-A1IK | (TODO) -- GDC | clinical__biospecimen | |
| TCGA-E2-A1IL | (TODO) -- GDC | clinical__biospecimen | |
| TCGA-E2-A1IN | (TODO) -- GDC | clinical__biospecimen | |
| TCGA-E2-A1IO | (TODO) -- GDC | clinical__biospecimen | |
| TCGA-E2-A1L6 | (TODO) -- GDC | clinical__biospecimen | |
| TCGA-E2-A1L7 | (TODO) -- GDC | clinical__biospecimen | |
| TCGA-E2-A1L8 | (TODO) -- GDC | clinical__biospecimen | |
| TCGA-E2-A1L9 | (TODO) -- GDC | clinical__biospecimen | |
| TCGA-E2-A1LA | (TODO) -- GDC | clinical__biospecimen | |
| TCGA-E2-A2P5 | (TODO) -- GDC | clinical__biospecimen | |
| TCGA-E2-A2P6 | (TODO) -- GDC | clinical__biospecimen | |
| TCGA-E2-A3DX | (TODO) -- GDC | clinical__biospecimen | |
| TCGA-E2-A56Z | (TODO) -- GDC | clinical__biospecimen | |
| TCGA-E2-A570 | (TODO) -- GDC | clinical__biospecimen | |
| TCGA-E2-A572 | (TODO) -- GDC | clinical__biospecimen | |
| TCGA-E2-A573 | (TODO) -- GDC | clinical__biospecimen | |
| TCGA-E2-A574 | (TODO) -- GDC | clinical__biospecimen | |
| TCGA-E2-A576 | (TODO) -- GDC | clinical__biospecimen | |
| TCGA-E2-A9RU | (TODO) -- GDC | clinical__biospecimen | |
| TCGA-E9-A1N3 | (TODO) -- GDC | clinical__biospecimen | |
| TCGA-E9-A1N4 | (TODO) -- GDC | clinical__biospecimen | |
| TCGA-E9-A1N5 | (TODO) -- GDC | clinical__biospecimen | |
| TCGA-E9-A1N8 | (TODO) -- GDC | clinical__biospecimen | |
| TCGA-E9-A1N9 | (TODO) -- GDC | clinical__biospecimen | |
| TCGA-E9-A1NA | (TODO) -- GDC | clinical__biospecimen | |
| TCGA-E9-A1NC | (TODO) -- GDC | clinical__biospecimen | |
| TCGA-E9-A1ND | (TODO) -- GDC | clinical__biospecimen | |
| TCGA-E9-A1NE | (TODO) -- GDC | clinical__biospecimen | |
| TCGA-E9-A1NF | (TODO) -- GDC | clinical__biospecimen | |
| TCGA-E9-A1NG | (TODO) -- GDC | clinical__biospecimen | |
| TCGA-E9-A1NI | (TODO) -- GDC | clinical__biospecimen | |
| TCGA-E9-A1QZ | (TODO) -- GDC | clinical__biospecimen | |
| TCGA-E9-A1R0 | (TODO) -- GDC | clinical__biospecimen | |
| TCGA-E9-A1R2 | (TODO) -- GDC | clinical__biospecimen | |
| TCGA-E9-A1R3 | (TODO) -- GDC | clinical__biospecimen | |
| TCGA-E9-A1R4 | (TODO) -- GDC | clinical__biospecimen | |
| TCGA-E9-A1R5 | (TODO) -- GDC | clinical__biospecimen | |
| TCGA-E9-A1R6 | (TODO) -- GDC | clinical__biospecimen | |
| TCGA-E9-A1R7 | (TODO) -- GDC | clinical__biospecimen | |
| TCGA-E9-A1RA | (TODO) -- GDC | clinical__biospecimen | |
| TCGA-E9-A1RB | (TODO) -- GDC | clinical__biospecimen | |
| TCGA-E9-A1RC | (TODO) -- GDC | clinical__biospecimen | |
| TCGA-E9-A1RD | (TODO) -- GDC | clinical__biospecimen | |
| TCGA-E9-A1RE | (TODO) -- GDC | clinical__biospecimen | |
| TCGA-E9-A1RF | (TODO) -- GDC | clinical__biospecimen | |
| TCGA-E9-A1RG | (TODO) -- GDC | clinical__biospecimen | |
| TCGA-E9-A1RH | (TODO) -- GDC | clinical__biospecimen | |
| TCGA-E9-A1RI | (TODO) -- GDC | clinical__biospecimen | |
| TCGA-E9-A226 | (TODO) -- GDC | clinical__biospecimen | |
| TCGA-E9-A227 | (TODO) -- GDC | clinical__biospecimen | |
| TCGA-E9-A228 | (TODO) -- GDC | clinical__biospecimen | |
| TCGA-E9-A229 | (TODO) -- GDC | clinical__biospecimen | |
| TCGA-E9-A22A | (TODO) -- GDC | clinical__biospecimen | |
| TCGA-E9-A22B | (TODO) -- GDC | clinical__biospecimen | |
| TCGA-E9-A22D | (TODO) -- GDC | clinical__biospecimen | |
| TCGA-E9-A22E | (TODO) -- GDC | clinical__biospecimen | |
| TCGA-E9-A22G | (TODO) -- GDC | clinical__biospecimen | |
| TCGA-E9-A22H | (TODO) -- GDC | clinical__biospecimen | |
| TCGA-E9-A243 | (TODO) -- GDC | clinical__biospecimen | |
| TCGA-E9-A244 | (TODO) -- GDC | clinical__biospecimen | |
| TCGA-E9-A245 | (TODO) -- GDC | clinical__biospecimen | |
| TCGA-E9-A247 | (TODO) -- GDC | clinical__biospecimen | |
| TCGA-E9-A248 | (TODO) -- GDC | clinical__biospecimen | |
| TCGA-E9-A249 | (TODO) -- GDC | clinical__biospecimen | |
| TCGA-E9-A24A | (TODO) -- GDC | clinical__biospecimen | |
| TCGA-E9-A295 | (TODO) -- GDC | clinical__biospecimen | |
| TCGA-E9-A2JS | (TODO) -- GDC | clinical__biospecimen | |
| TCGA-E9-A2JT | (TODO) -- GDC | clinical__biospecimen | |
| TCGA-E9-A3HO | (TODO) -- GDC | clinical__biospecimen | |
| TCGA-E9-A3Q9 | (TODO) -- GDC | clinical__biospecimen | |
| TCGA-E9-A3QA | (TODO) -- GDC | clinical__biospecimen | |
| TCGA-E9-A3X8 | (TODO) -- GDC | clinical__biospecimen | |
| TCGA-E9-A54X | (TODO) -- GDC | clinical__biospecimen | |
| TCGA-E9-A54Y | (TODO) -- GDC | clinical__biospecimen | |
| TCGA-E9-A5FK | (TODO) -- GDC | clinical__biospecimen | |
| TCGA-E9-A5FL | (TODO) -- GDC | clinical__biospecimen | |
| TCGA-E9-A5UO | (TODO) -- GDC | clinical__biospecimen | |
| TCGA-E9-A5UP | (TODO) -- GDC | clinical__biospecimen | |
| TCGA-E9-A6HE | (TODO) -- GDC | clinical__biospecimen | |
| TCGA-EW-A1IW | (TODO) -- GDC | clinical__biospecimen | |
| TCGA-EW-A1IX | (TODO) -- GDC | clinical__biospecimen | |
| TCGA-EW-A1IY | (TODO) -- GDC | clinical__biospecimen | |
| TCGA-EW-A1IZ | (TODO) -- GDC | clinical__biospecimen | |
| TCGA-EW-A1J1 | (TODO) -- GDC | clinical__biospecimen | |
| TCGA-EW-A1J2 | (TODO) -- GDC | clinical__biospecimen | |
| TCGA-EW-A1J3 | (TODO) -- GDC | clinical__biospecimen | |
| TCGA-EW-A1J5 | (TODO) -- GDC | clinical__biospecimen | |
| TCGA-EW-A1J6 | (TODO) -- GDC | clinical__biospecimen | |
| TCGA-EW-A1OV | (TODO) -- GDC | clinical__biospecimen | |
| TCGA-EW-A1OX | (TODO) -- GDC | clinical__biospecimen | |
| TCGA-EW-A1OY | (TODO) -- GDC | clinical__biospecimen | |
| TCGA-EW-A1OZ | (TODO) -- GDC | clinical__biospecimen | |
| TCGA-EW-A1P0 | (TODO) -- GDC | clinical__biospecimen | |
| TCGA-EW-A1P1 | (TODO) -- GDC | clinical__biospecimen | |
| TCGA-EW-A1P3 | (TODO) -- GDC | clinical__biospecimen | |
| TCGA-EW-A1P4 | (TODO) -- GDC | clinical__biospecimen | |
| TCGA-EW-A1P5 | (TODO) -- GDC | clinical__biospecimen | |
| TCGA-EW-A1P6 | (TODO) -- GDC | clinical__biospecimen | |
| TCGA-EW-A1P7 | (TODO) -- GDC | clinical__biospecimen | |
| TCGA-EW-A1P8 | (TODO) -- GDC | clinical__biospecimen | |
| TCGA-EW-A1PA | (TODO) -- GDC | clinical__biospecimen | |
| TCGA-EW-A1PB | (TODO) -- GDC | clinical__biospecimen | |
| TCGA-EW-A1PC | (TODO) -- GDC | clinical__biospecimen | |
| TCGA-EW-A1PD | (TODO) -- GDC | clinical__biospecimen | |
| TCGA-EW-A1PE | (TODO) -- GDC | clinical__biospecimen | |
| TCGA-EW-A1PG | (TODO) -- GDC | clinical__biospecimen | |
| TCGA-EW-A1PH | (TODO) -- GDC | clinical__biospecimen | |
| TCGA-EW-A2FR | (TODO) -- GDC | clinical__biospecimen | |
| TCGA-EW-A2FS | (TODO) -- GDC | clinical__biospecimen | |
| TCGA-EW-A2FV | (TODO) -- GDC | clinical__biospecimen | |
| TCGA-EW-A2FW | (TODO) -- GDC | clinical__biospecimen | |
| TCGA-EW-A3E8 | (TODO) -- GDC | clinical__biospecimen | |
| TCGA-EW-A3U0 | (TODO) -- GDC | clinical__biospecimen | |
| TCGA-EW-A423 | (TODO) -- GDC | clinical__biospecimen | |
| TCGA-EW-A424 | (TODO) -- GDC | clinical__biospecimen | |
| TCGA-EW-A6S9 | (TODO) -- GDC | clinical__biospecimen | |
| TCGA-EW-A6SA | (TODO) -- GDC | clinical__biospecimen | |
| TCGA-EW-A6SB | (TODO) -- GDC | clinical__biospecimen | |
| TCGA-EW-A6SC | (TODO) -- GDC | clinical__biospecimen | |
| TCGA-EW-A6SD | (TODO) -- GDC | clinical__biospecimen | |
| TCGA-GM-A2DA | (TODO) -- GDC | clinical__biospecimen | |
| TCGA-GM-A2DB | (TODO) -- GDC | clinical__biospecimen | |
| TCGA-GM-A2DC | (TODO) -- GDC | clinical__biospecimen | |
| TCGA-GM-A2DD | (TODO) -- GDC | clinical__biospecimen | |
| TCGA-GM-A2DF | (TODO) -- GDC | clinical__biospecimen | |
| TCGA-GM-A2DH | (TODO) -- GDC | clinical__biospecimen | |
| TCGA-GM-A2DK | (TODO) -- GDC | clinical__biospecimen | |
| TCGA-GM-A2DL | (TODO) -- GDC | clinical__biospecimen | |
| TCGA-GM-A2DM | (TODO) -- GDC | clinical__biospecimen | |
| TCGA-GM-A2DN | (TODO) -- GDC | clinical__biospecimen | |
| TCGA-GM-A2DO | (TODO) -- GDC | clinical__biospecimen | |
| TCGA-GM-A3NW | (TODO) -- GDC | clinical__biospecimen | |
| TCGA-GM-A3NY | (TODO) -- GDC | clinical__biospecimen | |
| TCGA-GM-A3XG | (TODO) -- GDC | clinical__biospecimen | |
| TCGA-GM-A3XL | (TODO) -- GDC | clinical__biospecimen | |
| TCGA-GM-A3XN | (TODO) -- GDC | clinical__biospecimen | |
| TCGA-GM-A4E0 | (TODO) -- GDC | clinical__biospecimen | |
| TCGA-GM-A5PV | (TODO) -- GDC | clinical__biospecimen | |
| TCGA-GM-A5PX | (TODO) -- GDC | clinical__biospecimen | |
| TCGA-HN-A2NL | (TODO) -- GDC | clinical__biospecimen | |
| TCGA-HN-A2OB | (TODO) -- GDC | clinical__biospecimen | |
| TCGA-JL-A3YW | (TODO) -- GDC | clinical__biospecimen | |
| TCGA-JL-A3YX | (TODO) -- GDC | clinical__biospecimen | |
| TCGA-LD-A66U | (TODO) -- GDC | clinical__biospecimen | |
| TCGA-LD-A74U | (TODO) -- GDC | clinical__biospecimen | |
| TCGA-LD-A7W5 | (TODO) -- GDC | clinical__biospecimen | |
| TCGA-LD-A7W6 | (TODO) -- GDC | clinical__biospecimen | |
| TCGA-LD-A9QF | (TODO) -- GDC | clinical__biospecimen | |
| TCGA-LL-A440 | (TODO) -- GDC | clinical__biospecimen | |
| TCGA-LL-A441 | (TODO) -- GDC | clinical__biospecimen | |
| TCGA-LL-A442 | (TODO) -- GDC | clinical__biospecimen | |
| TCGA-LL-A50Y | (TODO) -- GDC | clinical__biospecimen | |
| TCGA-LL-A5YL | (TODO) -- GDC | clinical__biospecimen | |
| TCGA-LL-A5YM | (TODO) -- GDC | clinical__biospecimen | |
| TCGA-LL-A5YN | (TODO) -- GDC | clinical__biospecimen | |
| TCGA-LL-A5YO | (TODO) -- GDC | clinical__biospecimen | |
| TCGA-LL-A5YP | (TODO) -- GDC | clinical__biospecimen | |
| TCGA-LL-A6FP | (TODO) -- GDC | clinical__biospecimen | |
| TCGA-LL-A6FQ | (TODO) -- GDC | clinical__biospecimen | |
| TCGA-LL-A6FR | (TODO) -- GDC | clinical__biospecimen | |
| TCGA-LL-A73Y | (TODO) -- GDC | clinical__biospecimen | |
| TCGA-LL-A73Z | (TODO) -- GDC | clinical__biospecimen | |
| TCGA-LL-A740 | (TODO) -- GDC | clinical__biospecimen | |
| TCGA-LL-A7SZ | (TODO) -- GDC | clinical__biospecimen | |
| TCGA-LL-A7T0 | (TODO) -- GDC | clinical__biospecimen | |
| TCGA-LL-A8F5 | (TODO) -- GDC | clinical__biospecimen | |
| TCGA-LL-A9Q3 | (TODO) -- GDC | clinical__biospecimen | |
| TCGA-LQ-A4E4 | (TODO) -- GDC | clinical__biospecimen | |
| TCGA-MS-A51U | (TODO) -- GDC | clinical__biospecimen | |
| TCGA-OK-A5Q2 | (TODO) -- GDC | clinical__biospecimen | |
| TCGA-OL-A5D6 | (TODO) -- GDC | clinical__biospecimen | |
| TCGA-OL-A5D7 | (TODO) -- GDC | clinical__biospecimen | |
| TCGA-OL-A5D8 | (TODO) -- GDC | clinical__biospecimen | |
| TCGA-OL-A5RU | (TODO) -- GDC | clinical__biospecimen | |
| TCGA-OL-A5RV | (TODO) -- GDC | clinical__biospecimen | |
| TCGA-OL-A5RW | (TODO) -- GDC | clinical__biospecimen | |
| TCGA-OL-A5RX | (TODO) -- GDC | clinical__biospecimen | |
| TCGA-OL-A5RY | (TODO) -- GDC | clinical__biospecimen | |
| TCGA-OL-A5RZ | (TODO) -- GDC | clinical__biospecimen | |
| TCGA-OL-A5S0 | (TODO) -- GDC | clinical__biospecimen | |
| TCGA-OL-A66H | (TODO) -- GDC | clinical__biospecimen | |
| TCGA-OL-A66I | (TODO) -- GDC | clinical__biospecimen | |
| TCGA-OL-A66J | (TODO) -- GDC | clinical__biospecimen | |
| TCGA-OL-A66K | (TODO) -- GDC | clinical__biospecimen | |
| TCGA-OL-A66L | (TODO) -- GDC | clinical__biospecimen | |
| TCGA-OL-A66N | (TODO) -- GDC | clinical__biospecimen | |
| TCGA-OL-A66O | (TODO) -- GDC | clinical__biospecimen | |
| TCGA-OL-A66P | (TODO) -- GDC | clinical__biospecimen | |
| TCGA-OL-A6VO | (TODO) -- GDC | clinical__biospecimen | |
| TCGA-OL-A6VQ | (TODO) -- GDC | clinical__biospecimen | |
| TCGA-OL-A6VR | (TODO) -- GDC | clinical__biospecimen | |
| TCGA-OL-A97C | (TODO) -- GDC | clinical__biospecimen | |
| TCGA-PE-A5DC | (TODO) -- GDC | clinical__biospecimen | |
| TCGA-PE-A5DD | (TODO) -- GDC | clinical__biospecimen | |
| TCGA-PE-A5DE | (TODO) -- GDC | clinical__biospecimen | |
| TCGA-PL-A8LV | (TODO) -- GDC | clinical__biospecimen | |
| TCGA-PL-A8LX | (TODO) -- GDC | clinical__biospecimen | |
| TCGA-PL-A8LY | (TODO) -- GDC | clinical__biospecimen | |
| TCGA-PL-A8LZ | (TODO) -- GDC | clinical__biospecimen | |
| TCGA-S3-A6ZF | (TODO) -- GDC | clinical__biospecimen | |
| TCGA-S3-A6ZG | (TODO) -- GDC | clinical__biospecimen | |
| TCGA-S3-A6ZH | (TODO) -- GDC | clinical__biospecimen | |
| TCGA-S3-AA0Z | (TODO) -- GDC | clinical__biospecimen | |
| TCGA-S3-AA10 | (TODO) -- GDC | clinical__biospecimen | |
| TCGA-S3-AA11 | (TODO) -- GDC | clinical__biospecimen | |
| TCGA-S3-AA12 | (TODO) -- GDC | clinical__biospecimen | |
| TCGA-S3-AA14 | (TODO) -- GDC | clinical__biospecimen | |
| TCGA-S3-AA15 | (TODO) -- GDC | clinical__biospecimen | |
| TCGA-S3-AA17 | (TODO) -- GDC | clinical__biospecimen | |
| TCGA-UL-AAZ6 | (TODO) -- GDC | clinical__biospecimen | |
| TCGA-UU-A93S | (TODO) -- GDC | clinical__biospecimen | |
| TCGA-V7-A7HQ | (TODO) -- GDC | clinical__biospecimen | |
| TCGA-W8-A86G | (TODO) -- GDC | clinical__biospecimen | |
| TCGA-WT-AB41 | (TODO) -- GDC | clinical__biospecimen | |
| TCGA-WT-AB44 | (TODO) -- GDC | clinical__biospecimen | |
| TCGA-XX-A899 | (TODO) -- GDC | clinical__biospecimen | |
| TCGA-XX-A89A | (TODO) -- GDC | clinical__biospecimen | |
| TCGA-Z7-A8R5 | (TODO) -- GDC | clinical__biospecimen | |
| TCGA-Z7-A8R6 | (TODO) -- GDC | clinical__biospecimen |
Table S2.
| TCGA Barcode | Platform | Center | Annotation |
|---|---|---|---|
| TCGA-3C-AAAU | (TODO) -- GDC | clinical__primary | |
| TCGA-3C-AALI | (TODO) -- GDC | clinical__primary | |
| TCGA-3C-AALJ | (TODO) -- GDC | clinical__primary | |
| TCGA-3C-AALK | (TODO) -- GDC | clinical__primary | |
| TCGA-4H-AAAK | (TODO) -- GDC | clinical__primary | |
| TCGA-5L-AAT0 | (TODO) -- GDC | clinical__primary | |
| TCGA-5L-AAT1 | (TODO) -- GDC | clinical__primary | |
| TCGA-5T-A9QA | (TODO) -- GDC | clinical__primary | |
| TCGA-A1-A0SB | (TODO) -- GDC | clinical__primary | |
| TCGA-A1-A0SD | (TODO) -- GDC | clinical__primary | |
| TCGA-A1-A0SE | (TODO) -- GDC | clinical__primary | |
| TCGA-A1-A0SF | (TODO) -- GDC | clinical__primary | |
| TCGA-A1-A0SG | (TODO) -- GDC | clinical__primary | |
| TCGA-A1-A0SH | (TODO) -- GDC | clinical__primary | |
| TCGA-A1-A0SI | (TODO) -- GDC | clinical__primary | |
| TCGA-A1-A0SJ | (TODO) -- GDC | clinical__primary | |
| TCGA-A1-A0SK | (TODO) -- GDC | clinical__primary | |
| TCGA-A1-A0SM | (TODO) -- GDC | clinical__primary | |
| TCGA-A1-A0SN | (TODO) -- GDC | clinical__primary | |
| TCGA-A1-A0SO | (TODO) -- GDC | clinical__primary | |
| TCGA-A1-A0SP | (TODO) -- GDC | clinical__primary | |
| TCGA-A2-A04N | (TODO) -- GDC | clinical__primary | |
| TCGA-A2-A04P | (TODO) -- GDC | clinical__primary | |
| TCGA-A2-A04Q | (TODO) -- GDC | clinical__primary | |
| TCGA-A2-A04R | (TODO) -- GDC | clinical__primary | |
| TCGA-A2-A04T | (TODO) -- GDC | clinical__primary | |
| TCGA-A2-A04U | (TODO) -- GDC | clinical__primary | |
| TCGA-A2-A04V | (TODO) -- GDC | clinical__primary | |
| TCGA-A2-A04W | (TODO) -- GDC | clinical__primary | |
| TCGA-A2-A04X | (TODO) -- GDC | clinical__primary | |
| TCGA-A2-A04Y | (TODO) -- GDC | clinical__primary | |
| TCGA-A2-A0CK | (TODO) -- GDC | clinical__primary | |
| TCGA-A2-A0CL | (TODO) -- GDC | clinical__primary | |
| TCGA-A2-A0CM | (TODO) -- GDC | clinical__primary | |
| TCGA-A2-A0CO | (TODO) -- GDC | clinical__primary | |
| TCGA-A2-A0CP | (TODO) -- GDC | clinical__primary | |
| TCGA-A2-A0CQ | (TODO) -- GDC | clinical__primary | |
| TCGA-A2-A0CR | (TODO) -- GDC | clinical__primary | |
| TCGA-A2-A0CS | (TODO) -- GDC | clinical__primary | |
| TCGA-A2-A0CT | (TODO) -- GDC | clinical__primary | |
| TCGA-A2-A0CU | (TODO) -- GDC | clinical__primary | |
| TCGA-A2-A0CV | (TODO) -- GDC | clinical__primary | |
| TCGA-A2-A0CW | (TODO) -- GDC | clinical__primary | |
| TCGA-A2-A0CX | (TODO) -- GDC | clinical__primary | |
| TCGA-A2-A0CY | (TODO) -- GDC | clinical__primary | |
| TCGA-A2-A0CZ | (TODO) -- GDC | clinical__primary | |
| TCGA-A2-A0D0 | (TODO) -- GDC | clinical__primary | |
| TCGA-A2-A0D1 | (TODO) -- GDC | clinical__primary | |
| TCGA-A2-A0D2 | (TODO) -- GDC | clinical__primary | |
| TCGA-A2-A0D3 | (TODO) -- GDC | clinical__primary | |
| TCGA-A2-A0D4 | (TODO) -- GDC | clinical__primary | |
| TCGA-A2-A0EM | (TODO) -- GDC | clinical__primary | |
| TCGA-A2-A0EN | (TODO) -- GDC | clinical__primary | |
| TCGA-A2-A0EO | (TODO) -- GDC | clinical__primary | |
| TCGA-A2-A0EQ | (TODO) -- GDC | clinical__primary | |
| TCGA-A2-A0ER | (TODO) -- GDC | clinical__primary | |
| TCGA-A2-A0ES | (TODO) -- GDC | clinical__primary | |
| TCGA-A2-A0ET | (TODO) -- GDC | clinical__primary | |
| TCGA-A2-A0EU | (TODO) -- GDC | clinical__primary | |
| TCGA-A2-A0EV | (TODO) -- GDC | clinical__primary | |
| TCGA-A2-A0EW | (TODO) -- GDC | clinical__primary | |
| TCGA-A2-A0EX | (TODO) -- GDC | clinical__primary | |
| TCGA-A2-A0EY | (TODO) -- GDC | clinical__primary | |
| TCGA-A2-A0ST | (TODO) -- GDC | clinical__primary | |
| TCGA-A2-A0SU | (TODO) -- GDC | clinical__primary | |
| TCGA-A2-A0SV | (TODO) -- GDC | clinical__primary | |
| TCGA-A2-A0SW | (TODO) -- GDC | clinical__primary | |
| TCGA-A2-A0SX | (TODO) -- GDC | clinical__primary | |
| TCGA-A2-A0SY | (TODO) -- GDC | clinical__primary | |
| TCGA-A2-A0T0 | (TODO) -- GDC | clinical__primary | |
| TCGA-A2-A0T1 | (TODO) -- GDC | clinical__primary | |
| TCGA-A2-A0T2 | (TODO) -- GDC | clinical__primary | |
| TCGA-A2-A0T3 | (TODO) -- GDC | clinical__primary | |
| TCGA-A2-A0T4 | (TODO) -- GDC | clinical__primary | |
| TCGA-A2-A0T5 | (TODO) -- GDC | clinical__primary | |
| TCGA-A2-A0T6 | (TODO) -- GDC | clinical__primary | |
| TCGA-A2-A0T7 | (TODO) -- GDC | clinical__primary | |
| TCGA-A2-A0YC | (TODO) -- GDC | clinical__primary | |
| TCGA-A2-A0YD | (TODO) -- GDC | clinical__primary | |
| TCGA-A2-A0YE | (TODO) -- GDC | clinical__primary | |
| TCGA-A2-A0YF | (TODO) -- GDC | clinical__primary | |
| TCGA-A2-A0YG | (TODO) -- GDC | clinical__primary | |
| TCGA-A2-A0YH | (TODO) -- GDC | clinical__primary | |
| TCGA-A2-A0YI | (TODO) -- GDC | clinical__primary | |
| TCGA-A2-A0YJ | (TODO) -- GDC | clinical__primary | |
| TCGA-A2-A0YK | (TODO) -- GDC | clinical__primary | |
| TCGA-A2-A0YL | (TODO) -- GDC | clinical__primary | |
| TCGA-A2-A0YM | (TODO) -- GDC | clinical__primary | |
| TCGA-A2-A0YT | (TODO) -- GDC | clinical__primary | |
| TCGA-A2-A1FV | (TODO) -- GDC | clinical__primary | |
| TCGA-A2-A1FW | (TODO) -- GDC | clinical__primary | |
| TCGA-A2-A1FX | (TODO) -- GDC | clinical__primary | |
| TCGA-A2-A1FZ | (TODO) -- GDC | clinical__primary | |
| TCGA-A2-A1G0 | (TODO) -- GDC | clinical__primary | |
| TCGA-A2-A1G1 | (TODO) -- GDC | clinical__primary | |
| TCGA-A2-A1G4 | (TODO) -- GDC | clinical__primary | |
| TCGA-A2-A1G6 | (TODO) -- GDC | clinical__primary | |
| TCGA-A2-A259 | (TODO) -- GDC | clinical__primary | |
| TCGA-A2-A25A | (TODO) -- GDC | clinical__primary | |
| TCGA-A2-A25B | (TODO) -- GDC | clinical__primary | |
| TCGA-A2-A25C | (TODO) -- GDC | clinical__primary | |
| TCGA-A2-A25D | (TODO) -- GDC | clinical__primary | |
| TCGA-A2-A25E | (TODO) -- GDC | clinical__primary | |
| TCGA-A2-A25F | (TODO) -- GDC | clinical__primary | |
| TCGA-A2-A3KC | (TODO) -- GDC | clinical__primary | |
| TCGA-A2-A3KD | (TODO) -- GDC | clinical__primary | |
| TCGA-A2-A3XS | (TODO) -- GDC | clinical__primary | |
| TCGA-A2-A3XT | (TODO) -- GDC | clinical__primary | |
| TCGA-A2-A3XU | (TODO) -- GDC | clinical__primary | |
| TCGA-A2-A3XV | (TODO) -- GDC | clinical__primary | |
| TCGA-A2-A3XW | (TODO) -- GDC | clinical__primary | |
| TCGA-A2-A3XZ | (TODO) -- GDC | clinical__primary | |
| TCGA-A2-A3Y0 | (TODO) -- GDC | clinical__primary | |
| TCGA-A2-A4RW | (TODO) -- GDC | clinical__primary | |
| TCGA-A2-A4RX | (TODO) -- GDC | clinical__primary | |
| TCGA-A2-A4RY | (TODO) -- GDC | clinical__primary | |
| TCGA-A2-A4S0 | (TODO) -- GDC | clinical__primary | |
| TCGA-A2-A4S1 | (TODO) -- GDC | clinical__primary | |
| TCGA-A2-A4S2 | (TODO) -- GDC | clinical__primary | |
| TCGA-A2-A4S3 | (TODO) -- GDC | clinical__primary | |
| TCGA-A7-A0CD | (TODO) -- GDC | clinical__primary | |
| TCGA-A7-A0CE | (TODO) -- GDC | clinical__primary | |
| TCGA-A7-A0CG | (TODO) -- GDC | clinical__primary | |
| TCGA-A7-A0CJ | (TODO) -- GDC | clinical__primary | |
| TCGA-A7-A0D9 | (TODO) -- GDC | clinical__primary | |
| TCGA-A7-A0DA | (TODO) -- GDC | clinical__primary | |
| TCGA-A7-A0DB | (TODO) -- GDC | clinical__primary | |
| TCGA-A7-A0DC | (TODO) -- GDC | clinical__primary | |
| TCGA-A7-A13D | (TODO) -- GDC | clinical__primary | |
| TCGA-A7-A13E | (TODO) -- GDC | clinical__primary | |
| TCGA-A7-A13F | (TODO) -- GDC | clinical__primary | |
| TCGA-A7-A13H | (TODO) -- GDC | clinical__primary | |
| TCGA-A7-A26E | (TODO) -- GDC | clinical__primary | |
| TCGA-A7-A26F | (TODO) -- GDC | clinical__primary | |
| TCGA-A7-A26G | (TODO) -- GDC | clinical__primary | |
| TCGA-A7-A26H | (TODO) -- GDC | clinical__primary | |
| TCGA-A7-A26I | (TODO) -- GDC | clinical__primary | |
| TCGA-A7-A26J | (TODO) -- GDC | clinical__primary | |
| TCGA-A7-A2KD | (TODO) -- GDC | clinical__primary | |
| TCGA-A7-A3IY | (TODO) -- GDC | clinical__primary | |
| TCGA-A7-A3IZ | (TODO) -- GDC | clinical__primary | |
| TCGA-A7-A3J0 | (TODO) -- GDC | clinical__primary | |
| TCGA-A7-A3J1 | (TODO) -- GDC | clinical__primary | |
| TCGA-A7-A3RF | (TODO) -- GDC | clinical__primary | |
| TCGA-A7-A425 | (TODO) -- GDC | clinical__primary | |
| TCGA-A7-A426 | (TODO) -- GDC | clinical__primary | |
| TCGA-A7-A4SA | (TODO) -- GDC | clinical__primary | |
| TCGA-A7-A4SB | (TODO) -- GDC | clinical__primary | |
| TCGA-A7-A4SC | (TODO) -- GDC | clinical__primary | |
| TCGA-A7-A4SD | (TODO) -- GDC | clinical__primary | |
| TCGA-A7-A4SE | (TODO) -- GDC | clinical__primary | |
| TCGA-A7-A4SF | (TODO) -- GDC | clinical__primary | |
| TCGA-A7-A56D | (TODO) -- GDC | clinical__primary | |
| TCGA-A7-A5ZV | (TODO) -- GDC | clinical__primary | |
| TCGA-A7-A5ZW | (TODO) -- GDC | clinical__primary | |
| TCGA-A7-A5ZX | (TODO) -- GDC | clinical__primary | |
| TCGA-A7-A6VV | (TODO) -- GDC | clinical__primary | |
| TCGA-A7-A6VW | (TODO) -- GDC | clinical__primary | |
| TCGA-A7-A6VX | (TODO) -- GDC | clinical__primary | |
| TCGA-A7-A6VY | (TODO) -- GDC | clinical__primary | |
| TCGA-A8-A06N | (TODO) -- GDC | clinical__primary | |
| TCGA-A8-A06O | (TODO) -- GDC | clinical__primary | |
| TCGA-A8-A06P | (TODO) -- GDC | clinical__primary | |
| TCGA-A8-A06Q | (TODO) -- GDC | clinical__primary | |
| TCGA-A8-A06R | (TODO) -- GDC | clinical__primary | |
| TCGA-A8-A06T | (TODO) -- GDC | clinical__primary | |
| TCGA-A8-A06U | (TODO) -- GDC | clinical__primary | |
| TCGA-A8-A06X | (TODO) -- GDC | clinical__primary | |
| TCGA-A8-A06Y | (TODO) -- GDC | clinical__primary | |
| TCGA-A8-A06Z | (TODO) -- GDC | clinical__primary | |
| TCGA-A8-A075 | (TODO) -- GDC | clinical__primary | |
| TCGA-A8-A076 | (TODO) -- GDC | clinical__primary | |
| TCGA-A8-A079 | (TODO) -- GDC | clinical__primary | |
| TCGA-A8-A07B | (TODO) -- GDC | clinical__primary | |
| TCGA-A8-A07C | (TODO) -- GDC | clinical__primary | |
| TCGA-A8-A07E | (TODO) -- GDC | clinical__primary | |
| TCGA-A8-A07F | (TODO) -- GDC | clinical__primary | |
| TCGA-A8-A07G | (TODO) -- GDC | clinical__primary | |
| TCGA-A8-A07I | (TODO) -- GDC | clinical__primary | |
| TCGA-A8-A07J | (TODO) -- GDC | clinical__primary | |
| TCGA-A8-A07L | (TODO) -- GDC | clinical__primary | |
| TCGA-A8-A07O | (TODO) -- GDC | clinical__primary | |
| TCGA-A8-A07P | (TODO) -- GDC | clinical__primary | |
| TCGA-A8-A07R | (TODO) -- GDC | clinical__primary | |
| TCGA-A8-A07U | (TODO) -- GDC | clinical__primary | |
| TCGA-A8-A07W | (TODO) -- GDC | clinical__primary | |
| TCGA-A8-A07Z | (TODO) -- GDC | clinical__primary | |
| TCGA-A8-A081 | (TODO) -- GDC | clinical__primary | |
| TCGA-A8-A082 | (TODO) -- GDC | clinical__primary | |
| TCGA-A8-A083 | (TODO) -- GDC | clinical__primary | |
| TCGA-A8-A084 | (TODO) -- GDC | clinical__primary | |
| TCGA-A8-A085 | (TODO) -- GDC | clinical__primary | |
| TCGA-A8-A086 | (TODO) -- GDC | clinical__primary | |
| TCGA-A8-A08A | (TODO) -- GDC | clinical__primary | |
| TCGA-A8-A08B | (TODO) -- GDC | clinical__primary | |
| TCGA-A8-A08C | (TODO) -- GDC | clinical__primary | |
| TCGA-A8-A08F | (TODO) -- GDC | clinical__primary | |
| TCGA-A8-A08G | (TODO) -- GDC | clinical__primary | |
| TCGA-A8-A08H | (TODO) -- GDC | clinical__primary | |
| TCGA-A8-A08I | (TODO) -- GDC | clinical__primary | |
| TCGA-A8-A08J | (TODO) -- GDC | clinical__primary | |
| TCGA-A8-A08L | (TODO) -- GDC | clinical__primary | |
| TCGA-A8-A08O | (TODO) -- GDC | clinical__primary | |
| TCGA-A8-A08P | (TODO) -- GDC | clinical__primary | |
| TCGA-A8-A08R | (TODO) -- GDC | clinical__primary | |
| TCGA-A8-A08S | (TODO) -- GDC | clinical__primary | |
| TCGA-A8-A08T | (TODO) -- GDC | clinical__primary | |
| TCGA-A8-A08X | (TODO) -- GDC | clinical__primary | |
| TCGA-A8-A08Z | (TODO) -- GDC | clinical__primary | |
| TCGA-A8-A090 | (TODO) -- GDC | clinical__primary | |
| TCGA-A8-A091 | (TODO) -- GDC | clinical__primary | |
| TCGA-A8-A092 | (TODO) -- GDC | clinical__primary | |
| TCGA-A8-A093 | (TODO) -- GDC | clinical__primary | |
| TCGA-A8-A094 | (TODO) -- GDC | clinical__primary | |
| TCGA-A8-A095 | (TODO) -- GDC | clinical__primary | |
| TCGA-A8-A096 | (TODO) -- GDC | clinical__primary | |
| TCGA-A8-A097 | (TODO) -- GDC | clinical__primary | |
| TCGA-A8-A099 | (TODO) -- GDC | clinical__primary | |
| TCGA-A8-A09A | (TODO) -- GDC | clinical__primary | |
| TCGA-A8-A09B | (TODO) -- GDC | clinical__primary | |
| TCGA-A8-A09C | (TODO) -- GDC | clinical__primary | |
| TCGA-A8-A09D | (TODO) -- GDC | clinical__primary | |
| TCGA-A8-A09E | (TODO) -- GDC | clinical__primary | |
| TCGA-A8-A09G | (TODO) -- GDC | clinical__primary | |
| TCGA-A8-A09I | (TODO) -- GDC | clinical__primary | |
| TCGA-A8-A09K | (TODO) -- GDC | clinical__primary | |
| TCGA-A8-A09M | (TODO) -- GDC | clinical__primary | |
| TCGA-A8-A09N | (TODO) -- GDC | clinical__primary | |
| TCGA-A8-A09Q | (TODO) -- GDC | clinical__primary | |
| TCGA-A8-A09R | (TODO) -- GDC | clinical__primary | |
| TCGA-A8-A09T | (TODO) -- GDC | clinical__primary | |
| TCGA-A8-A09V | (TODO) -- GDC | clinical__primary | |
| TCGA-A8-A09W | (TODO) -- GDC | clinical__primary | |
| TCGA-A8-A09X | (TODO) -- GDC | clinical__primary | |
| TCGA-A8-A09Z | (TODO) -- GDC | clinical__primary | |
| TCGA-A8-A0A1 | (TODO) -- GDC | clinical__primary | |
| TCGA-A8-A0A2 | (TODO) -- GDC | clinical__primary | |
| TCGA-A8-A0A4 | (TODO) -- GDC | clinical__primary | |
| TCGA-A8-A0A6 | (TODO) -- GDC | clinical__primary | |
| TCGA-A8-A0A7 | (TODO) -- GDC | clinical__primary | |
| TCGA-A8-A0A9 | (TODO) -- GDC | clinical__primary | |
| TCGA-A8-A0AB | (TODO) -- GDC | clinical__primary | |
| TCGA-A8-A0AD | (TODO) -- GDC | clinical__primary | |
| TCGA-AC-A23C | (TODO) -- GDC | clinical__primary | |
| TCGA-AC-A23E | (TODO) -- GDC | clinical__primary | |
| TCGA-AC-A2B8 | (TODO) -- GDC | clinical__primary | |
| TCGA-AC-A2QH | (TODO) -- GDC | clinical__primary | |
| TCGA-AC-A2QI | (TODO) -- GDC | clinical__primary | |
| TCGA-AC-A3BB | (TODO) -- GDC | clinical__primary | |
| TCGA-AC-A3HN | (TODO) -- GDC | clinical__primary | |
| TCGA-AC-A3OD | (TODO) -- GDC | clinical__primary | |
| TCGA-AC-A3QP | (TODO) -- GDC | clinical__primary | |
| TCGA-AC-A3QQ | (TODO) -- GDC | clinical__primary | |
| TCGA-AC-A3TM | (TODO) -- GDC | clinical__primary | |
| TCGA-AC-A3TN | (TODO) -- GDC | clinical__primary | |
| TCGA-AC-A3W5 | (TODO) -- GDC | clinical__primary | |
| TCGA-AC-A3W6 | (TODO) -- GDC | clinical__primary | |
| TCGA-AC-A3W7 | (TODO) -- GDC | clinical__primary | |
| TCGA-AC-A3YI | (TODO) -- GDC | clinical__primary | |
| TCGA-AC-A3YJ | (TODO) -- GDC | clinical__primary | |
| TCGA-AC-A4ZE | (TODO) -- GDC | clinical__primary | |
| TCGA-AC-A5EH | (TODO) -- GDC | clinical__primary | |
| TCGA-AC-A5EI | (TODO) -- GDC | clinical__primary | |
| TCGA-AC-A5XS | (TODO) -- GDC | clinical__primary | |
| TCGA-AC-A5XU | (TODO) -- GDC | clinical__primary | |
| TCGA-AC-A62V | (TODO) -- GDC | clinical__primary | |
| TCGA-AC-A62X | (TODO) -- GDC | clinical__primary | |
| TCGA-AC-A62Y | (TODO) -- GDC | clinical__primary | |
| TCGA-AC-A6IV | (TODO) -- GDC | clinical__primary | |
| TCGA-AC-A6IW | (TODO) -- GDC | clinical__primary | |
| TCGA-AC-A6IX | (TODO) -- GDC | clinical__primary | |
| TCGA-AC-A6NO | (TODO) -- GDC | clinical__primary | |
| TCGA-AC-A7VB | (TODO) -- GDC | clinical__primary | |
| TCGA-AC-A7VC | (TODO) -- GDC | clinical__primary | |
| TCGA-AC-A8OP | (TODO) -- GDC | clinical__primary | |
| TCGA-AC-A8OQ | (TODO) -- GDC | clinical__primary | |
| TCGA-AC-A8OR | (TODO) -- GDC | clinical__primary | |
| TCGA-AC-A8OS | (TODO) -- GDC | clinical__primary | |
| TCGA-AN-A03X | (TODO) -- GDC | clinical__primary | |
| TCGA-AN-A03Y | (TODO) -- GDC | clinical__primary | |
| TCGA-AN-A041 | (TODO) -- GDC | clinical__primary | |
| TCGA-AN-A046 | (TODO) -- GDC | clinical__primary | |
| TCGA-AN-A049 | (TODO) -- GDC | clinical__primary | |
| TCGA-AN-A04A | (TODO) -- GDC | clinical__primary | |
| TCGA-AN-A04C | (TODO) -- GDC | clinical__primary | |
| TCGA-AN-A04D | (TODO) -- GDC | clinical__primary | |
| TCGA-AN-A0AJ | (TODO) -- GDC | clinical__primary | |
| TCGA-AN-A0AK | (TODO) -- GDC | clinical__primary | |
| TCGA-AN-A0AL | (TODO) -- GDC | clinical__primary | |
| TCGA-AN-A0AM | (TODO) -- GDC | clinical__primary | |
| TCGA-AN-A0AR | (TODO) -- GDC | clinical__primary | |
| TCGA-AN-A0AS | (TODO) -- GDC | clinical__primary | |
| TCGA-AN-A0AT | (TODO) -- GDC | clinical__primary | |
| TCGA-AN-A0FD | (TODO) -- GDC | clinical__primary | |
| TCGA-AN-A0FF | (TODO) -- GDC | clinical__primary | |
| TCGA-AN-A0FJ | (TODO) -- GDC | clinical__primary | |
| TCGA-AN-A0FK | (TODO) -- GDC | clinical__primary | |
| TCGA-AN-A0FL | (TODO) -- GDC | clinical__primary | |
| TCGA-AN-A0FN | (TODO) -- GDC | clinical__primary | |
| TCGA-AN-A0FS | (TODO) -- GDC | clinical__primary | |
| TCGA-AN-A0FT | (TODO) -- GDC | clinical__primary | |
| TCGA-AN-A0FV | (TODO) -- GDC | clinical__primary | |
| TCGA-AN-A0FW | (TODO) -- GDC | clinical__primary | |
| TCGA-AN-A0FX | (TODO) -- GDC | clinical__primary | |
| TCGA-AN-A0FY | (TODO) -- GDC | clinical__primary | |
| TCGA-AN-A0FZ | (TODO) -- GDC | clinical__primary | |
| TCGA-AN-A0G0 | (TODO) -- GDC | clinical__primary | |
| TCGA-AN-A0XL | (TODO) -- GDC | clinical__primary | |
| TCGA-AN-A0XN | (TODO) -- GDC | clinical__primary | |
| TCGA-AN-A0XO | (TODO) -- GDC | clinical__primary | |
| TCGA-AN-A0XP | (TODO) -- GDC | clinical__primary | |
| TCGA-AN-A0XR | (TODO) -- GDC | clinical__primary | |
| TCGA-AN-A0XS | (TODO) -- GDC | clinical__primary | |
| TCGA-AN-A0XT | (TODO) -- GDC | clinical__primary | |
| TCGA-AN-A0XU | (TODO) -- GDC | clinical__primary | |
| TCGA-AN-A0XV | (TODO) -- GDC | clinical__primary | |
| TCGA-AO-A03L | (TODO) -- GDC | clinical__primary | |
| TCGA-AO-A03M | (TODO) -- GDC | clinical__primary | |
| TCGA-AO-A03N | (TODO) -- GDC | clinical__primary | |
| TCGA-AO-A03O | (TODO) -- GDC | clinical__primary | |
| TCGA-AO-A03P | (TODO) -- GDC | clinical__primary | |
| TCGA-AO-A03R | (TODO) -- GDC | clinical__primary | |
| TCGA-AO-A03T | (TODO) -- GDC | clinical__primary | |
| TCGA-AO-A03U | (TODO) -- GDC | clinical__primary | |
| TCGA-AO-A03V | (TODO) -- GDC | clinical__primary | |
| TCGA-AO-A0J2 | (TODO) -- GDC | clinical__primary | |
| TCGA-AO-A0J3 | (TODO) -- GDC | clinical__primary | |
| TCGA-AO-A0J4 | (TODO) -- GDC | clinical__primary | |
| TCGA-AO-A0J5 | (TODO) -- GDC | clinical__primary | |
| TCGA-AO-A0J6 | (TODO) -- GDC | clinical__primary | |
| TCGA-AO-A0J7 | (TODO) -- GDC | clinical__primary | |
| TCGA-AO-A0J8 | (TODO) -- GDC | clinical__primary | |
| TCGA-AO-A0J9 | (TODO) -- GDC | clinical__primary | |
| TCGA-AO-A0JA | (TODO) -- GDC | clinical__primary | |
| TCGA-AO-A0JB | (TODO) -- GDC | clinical__primary | |
| TCGA-AO-A0JC | (TODO) -- GDC | clinical__primary | |
| TCGA-AO-A0JD | (TODO) -- GDC | clinical__primary | |
| TCGA-AO-A0JE | (TODO) -- GDC | clinical__primary | |
| TCGA-AO-A0JF | (TODO) -- GDC | clinical__primary | |
| TCGA-AO-A0JG | (TODO) -- GDC | clinical__primary | |
| TCGA-AO-A0JI | (TODO) -- GDC | clinical__primary | |
| TCGA-AO-A0JJ | (TODO) -- GDC | clinical__primary | |
| TCGA-AO-A0JL | (TODO) -- GDC | clinical__primary | |
| TCGA-AO-A0JM | (TODO) -- GDC | clinical__primary | |
| TCGA-AO-A124 | (TODO) -- GDC | clinical__primary | |
| TCGA-AO-A125 | (TODO) -- GDC | clinical__primary | |
| TCGA-AO-A126 | (TODO) -- GDC | clinical__primary | |
| TCGA-AO-A128 | (TODO) -- GDC | clinical__primary | |
| TCGA-AO-A129 | (TODO) -- GDC | clinical__primary | |
| TCGA-AO-A12A | (TODO) -- GDC | clinical__primary | |
| TCGA-AO-A12B | (TODO) -- GDC | clinical__primary | |
| TCGA-AO-A12C | (TODO) -- GDC | clinical__primary | |
| TCGA-AO-A12D | (TODO) -- GDC | clinical__primary | |
| TCGA-AO-A12F | (TODO) -- GDC | clinical__primary | |
| TCGA-AO-A12G | (TODO) -- GDC | clinical__primary | |
| TCGA-AO-A12H | (TODO) -- GDC | clinical__primary | |
| TCGA-AO-A1KO | (TODO) -- GDC | clinical__primary | |
| TCGA-AO-A1KP | (TODO) -- GDC | clinical__primary | |
| TCGA-AO-A1KR | (TODO) -- GDC | clinical__primary | |
| TCGA-AO-A1KS | (TODO) -- GDC | clinical__primary | |
| TCGA-AO-A1KT | (TODO) -- GDC | clinical__primary | |
| TCGA-AQ-A04H | (TODO) -- GDC | clinical__primary | |
| TCGA-AQ-A04J | (TODO) -- GDC | clinical__primary | |
| TCGA-AQ-A0Y5 | (TODO) -- GDC | clinical__primary | |
| TCGA-AQ-A1H2 | (TODO) -- GDC | clinical__primary | |
| TCGA-AQ-A1H3 | (TODO) -- GDC | clinical__primary | |
| TCGA-AQ-A54N | (TODO) -- GDC | clinical__primary | |
| TCGA-AQ-A54O | (TODO) -- GDC | clinical__primary | |
| TCGA-AQ-A7U7 | (TODO) -- GDC | clinical__primary | |
| TCGA-AR-A0TP | (TODO) -- GDC | clinical__primary | |
| TCGA-AR-A0TQ | (TODO) -- GDC | clinical__primary | |
| TCGA-AR-A0TR | (TODO) -- GDC | clinical__primary | |
| TCGA-AR-A0TS | (TODO) -- GDC | clinical__primary | |
| TCGA-AR-A0TT | (TODO) -- GDC | clinical__primary | |
| TCGA-AR-A0TU | (TODO) -- GDC | clinical__primary | |
| TCGA-AR-A0TV | (TODO) -- GDC | clinical__primary | |
| TCGA-AR-A0TW | (TODO) -- GDC | clinical__primary | |
| TCGA-AR-A0TX | (TODO) -- GDC | clinical__primary | |
| TCGA-AR-A0TY | (TODO) -- GDC | clinical__primary | |
| TCGA-AR-A0TZ | (TODO) -- GDC | clinical__primary | |
| TCGA-AR-A0U0 | (TODO) -- GDC | clinical__primary | |
| TCGA-AR-A0U1 | (TODO) -- GDC | clinical__primary | |
| TCGA-AR-A0U2 | (TODO) -- GDC | clinical__primary | |
| TCGA-AR-A0U3 | (TODO) -- GDC | clinical__primary | |
| TCGA-AR-A0U4 | (TODO) -- GDC | clinical__primary | |
| TCGA-AR-A1AH | (TODO) -- GDC | clinical__primary | |
| TCGA-AR-A1AI | (TODO) -- GDC | clinical__primary | |
| TCGA-AR-A1AJ | (TODO) -- GDC | clinical__primary | |
| TCGA-AR-A1AK | (TODO) -- GDC | clinical__primary | |
| TCGA-AR-A1AL | (TODO) -- GDC | clinical__primary | |
| TCGA-AR-A1AM | (TODO) -- GDC | clinical__primary | |
| TCGA-AR-A1AN | (TODO) -- GDC | clinical__primary | |
| TCGA-AR-A1AO | (TODO) -- GDC | clinical__primary | |
| TCGA-AR-A1AP | (TODO) -- GDC | clinical__primary | |
| TCGA-AR-A1AQ | (TODO) -- GDC | clinical__primary | |
| TCGA-AR-A1AR | (TODO) -- GDC | clinical__primary | |
| TCGA-AR-A1AS | (TODO) -- GDC | clinical__primary | |
| TCGA-AR-A1AT | (TODO) -- GDC | clinical__primary | |
| TCGA-AR-A1AU | (TODO) -- GDC | clinical__primary | |
| TCGA-AR-A1AV | (TODO) -- GDC | clinical__primary | |
| TCGA-AR-A1AW | (TODO) -- GDC | clinical__primary | |
| TCGA-AR-A1AX | (TODO) -- GDC | clinical__primary | |
| TCGA-AR-A1AY | (TODO) -- GDC | clinical__primary | |
| TCGA-AR-A24H | (TODO) -- GDC | clinical__primary | |
| TCGA-AR-A24K | (TODO) -- GDC | clinical__primary | |
| TCGA-AR-A24M | (TODO) -- GDC | clinical__primary | |
| TCGA-AR-A24N | (TODO) -- GDC | clinical__primary | |
| TCGA-AR-A24O | (TODO) -- GDC | clinical__primary | |
| TCGA-AR-A24P | (TODO) -- GDC | clinical__primary | |
| TCGA-AR-A24Q | (TODO) -- GDC | clinical__primary | |
| TCGA-AR-A24R | (TODO) -- GDC | clinical__primary | |
| TCGA-AR-A24S | (TODO) -- GDC | clinical__primary | |
| TCGA-AR-A24V | (TODO) -- GDC | clinical__primary | |
| TCGA-AR-A24W | (TODO) -- GDC | clinical__primary | |
| TCGA-AR-A24X | (TODO) -- GDC | clinical__primary | |
| TCGA-AR-A24Z | (TODO) -- GDC | clinical__primary | |
| TCGA-AR-A250 | (TODO) -- GDC | clinical__primary | |
| TCGA-AR-A251 | (TODO) -- GDC | clinical__primary | |
| TCGA-AR-A252 | (TODO) -- GDC | clinical__primary | |
| TCGA-AR-A254 | (TODO) -- GDC | clinical__primary | |
| TCGA-AR-A255 | (TODO) -- GDC | clinical__primary | |
| TCGA-AR-A256 | (TODO) -- GDC | clinical__primary | |
| TCGA-AR-A2LE | (TODO) -- GDC | clinical__primary | |
| TCGA-AR-A2LH | (TODO) -- GDC | clinical__primary | |
| TCGA-AR-A2LJ | (TODO) -- GDC | clinical__primary | |
| TCGA-AR-A2LK | (TODO) -- GDC | clinical__primary | |
| TCGA-AR-A2LL | (TODO) -- GDC | clinical__primary | |
| TCGA-AR-A2LM | (TODO) -- GDC | clinical__primary | |
| TCGA-AR-A2LN | (TODO) -- GDC | clinical__primary | |
| TCGA-AR-A2LO | (TODO) -- GDC | clinical__primary | |
| TCGA-AR-A2LQ | (TODO) -- GDC | clinical__primary | |
| TCGA-AR-A2LR | (TODO) -- GDC | clinical__primary | |
| TCGA-AR-A5QM | (TODO) -- GDC | clinical__primary | |
| TCGA-AR-A5QN | (TODO) -- GDC | clinical__primary | |
| TCGA-AR-A5QP | (TODO) -- GDC | clinical__primary | |
| TCGA-AR-A5QQ | (TODO) -- GDC | clinical__primary | |
| TCGA-B6-A0I1 | (TODO) -- GDC | clinical__primary | |
| TCGA-B6-A0I2 | (TODO) -- GDC | clinical__primary | |
| TCGA-B6-A0I5 | (TODO) -- GDC | clinical__primary | |
| TCGA-B6-A0I6 | (TODO) -- GDC | clinical__primary | |
| TCGA-B6-A0I8 | (TODO) -- GDC | clinical__primary | |
| TCGA-B6-A0I9 | (TODO) -- GDC | clinical__primary | |
| TCGA-B6-A0IA | (TODO) -- GDC | clinical__primary | |
| TCGA-B6-A0IB | (TODO) -- GDC | clinical__primary | |
| TCGA-B6-A0IC | (TODO) -- GDC | clinical__primary | |
| TCGA-B6-A0IE | (TODO) -- GDC | clinical__primary | |
| TCGA-B6-A0IG | (TODO) -- GDC | clinical__primary | |
| TCGA-B6-A0IH | (TODO) -- GDC | clinical__primary | |
| TCGA-B6-A0IJ | (TODO) -- GDC | clinical__primary | |
| TCGA-B6-A0IK | (TODO) -- GDC | clinical__primary | |
| TCGA-B6-A0IM | (TODO) -- GDC | clinical__primary | |
| TCGA-B6-A0IN | (TODO) -- GDC | clinical__primary | |
| TCGA-B6-A0IO | (TODO) -- GDC | clinical__primary | |
| TCGA-B6-A0IP | (TODO) -- GDC | clinical__primary | |
| TCGA-B6-A0IQ | (TODO) -- GDC | clinical__primary | |
| TCGA-B6-A0RE | (TODO) -- GDC | clinical__primary | |
| TCGA-B6-A0RG | (TODO) -- GDC | clinical__primary | |
| TCGA-B6-A0RH | (TODO) -- GDC | clinical__primary | |
| TCGA-B6-A0RI | (TODO) -- GDC | clinical__primary | |
| TCGA-B6-A0RL | (TODO) -- GDC | clinical__primary | |
| TCGA-B6-A0RM | (TODO) -- GDC | clinical__primary | |
| TCGA-B6-A0RN | (TODO) -- GDC | clinical__primary | |
| TCGA-B6-A0RO | (TODO) -- GDC | clinical__primary | |
| TCGA-B6-A0RP | (TODO) -- GDC | clinical__primary | |
| TCGA-B6-A0RQ | (TODO) -- GDC | clinical__primary | |
| TCGA-B6-A0RS | (TODO) -- GDC | clinical__primary | |
| TCGA-B6-A0RT | (TODO) -- GDC | clinical__primary | |
| TCGA-B6-A0RU | (TODO) -- GDC | clinical__primary | |
| TCGA-B6-A0RV | (TODO) -- GDC | clinical__primary | |
| TCGA-B6-A0WS | (TODO) -- GDC | clinical__primary | |
| TCGA-B6-A0WT | (TODO) -- GDC | clinical__primary | |
| TCGA-B6-A0WV | (TODO) -- GDC | clinical__primary | |
| TCGA-B6-A0WX | (TODO) -- GDC | clinical__primary | |
| TCGA-B6-A0WY | (TODO) -- GDC | clinical__primary | |
| TCGA-B6-A0WZ | (TODO) -- GDC | clinical__primary | |
| TCGA-B6-A0X0 | (TODO) -- GDC | clinical__primary | |
| TCGA-B6-A0X1 | (TODO) -- GDC | clinical__primary | |
| TCGA-B6-A0X4 | (TODO) -- GDC | clinical__primary | |
| TCGA-B6-A0X5 | (TODO) -- GDC | clinical__primary | |
| TCGA-B6-A0X7 | (TODO) -- GDC | clinical__primary | |
| TCGA-B6-A1KC | (TODO) -- GDC | clinical__primary | |
| TCGA-B6-A1KF | (TODO) -- GDC | clinical__primary | |
| TCGA-B6-A1KI | (TODO) -- GDC | clinical__primary | |
| TCGA-B6-A1KN | (TODO) -- GDC | clinical__primary | |
| TCGA-B6-A2IU | (TODO) -- GDC | clinical__primary | |
| TCGA-B6-A3ZX | (TODO) -- GDC | clinical__primary | |
| TCGA-B6-A401 | (TODO) -- GDC | clinical__primary | |
| TCGA-B6-A408 | (TODO) -- GDC | clinical__primary | |
| TCGA-B6-A409 | (TODO) -- GDC | clinical__primary | |
| TCGA-B6-A40C | (TODO) -- GDC | clinical__primary | |
| TCGA-BH-A0AV | (TODO) -- GDC | clinical__primary | |
| TCGA-BH-A0AW | (TODO) -- GDC | clinical__primary | |
| TCGA-BH-A0AY | (TODO) -- GDC | clinical__primary | |
| TCGA-BH-A0B0 | (TODO) -- GDC | clinical__primary | |
| TCGA-BH-A0B1 | (TODO) -- GDC | clinical__primary | |
| TCGA-BH-A0B3 | (TODO) -- GDC | clinical__primary | |
| TCGA-BH-A0B4 | (TODO) -- GDC | clinical__primary | |
| TCGA-BH-A0B6 | (TODO) -- GDC | clinical__primary | |
| TCGA-BH-A0B7 | (TODO) -- GDC | clinical__primary | |
| TCGA-BH-A0B8 | (TODO) -- GDC | clinical__primary | |
| TCGA-BH-A0B9 | (TODO) -- GDC | clinical__primary | |
| TCGA-BH-A0BA | (TODO) -- GDC | clinical__primary | |
| TCGA-BH-A0BC | (TODO) -- GDC | clinical__primary | |
| TCGA-BH-A0BD | (TODO) -- GDC | clinical__primary | |
| TCGA-BH-A0BG | (TODO) -- GDC | clinical__primary | |
| TCGA-BH-A0BJ | (TODO) -- GDC | clinical__primary | |
| TCGA-BH-A0BL | (TODO) -- GDC | clinical__primary | |
| TCGA-BH-A0BM | (TODO) -- GDC | clinical__primary | |
| TCGA-BH-A0BO | (TODO) -- GDC | clinical__primary | |
| TCGA-BH-A0BP | (TODO) -- GDC | clinical__primary | |
| TCGA-BH-A0BR | (TODO) -- GDC | clinical__primary | |
| TCGA-BH-A0BV | (TODO) -- GDC | clinical__primary | |
| TCGA-BH-A0BW | (TODO) -- GDC | clinical__primary | |
| TCGA-BH-A0C0 | (TODO) -- GDC | clinical__primary | |
| TCGA-BH-A0C1 | (TODO) -- GDC | clinical__primary | |
| TCGA-BH-A0C7 | (TODO) -- GDC | clinical__primary | |
| TCGA-BH-A0DE | (TODO) -- GDC | clinical__primary | |
| TCGA-BH-A0DH | (TODO) -- GDC | clinical__primary | |
| TCGA-BH-A0DK | (TODO) -- GDC | clinical__primary | |
| TCGA-BH-A0DL | (TODO) -- GDC | clinical__primary | |
| TCGA-BH-A0DP | (TODO) -- GDC | clinical__primary | |
| TCGA-BH-A0DQ | (TODO) -- GDC | clinical__primary | |
| TCGA-BH-A0DS | (TODO) -- GDC | clinical__primary | |
| TCGA-BH-A0DX | (TODO) -- GDC | clinical__primary | |
| TCGA-BH-A0DZ | (TODO) -- GDC | clinical__primary | |
| TCGA-BH-A0E0 | (TODO) -- GDC | clinical__primary | |
| TCGA-BH-A0E1 | (TODO) -- GDC | clinical__primary | |
| TCGA-BH-A0E2 | (TODO) -- GDC | clinical__primary | |
| TCGA-BH-A0E6 | (TODO) -- GDC | clinical__primary | |
| TCGA-BH-A0E7 | (TODO) -- GDC | clinical__primary | |
| TCGA-BH-A0E9 | (TODO) -- GDC | clinical__primary | |
| TCGA-BH-A0EA | (TODO) -- GDC | clinical__primary | |
| TCGA-BH-A0EB | (TODO) -- GDC | clinical__primary | |
| TCGA-BH-A0EE | (TODO) -- GDC | clinical__primary | |
| TCGA-BH-A0EI | (TODO) -- GDC | clinical__primary | |
| TCGA-BH-A0GY | (TODO) -- GDC | clinical__primary | |
| TCGA-BH-A0GZ | (TODO) -- GDC | clinical__primary | |
| TCGA-BH-A0H0 | (TODO) -- GDC | clinical__primary | |
| TCGA-BH-A0H6 | (TODO) -- GDC | clinical__primary | |
| TCGA-BH-A0H7 | (TODO) -- GDC | clinical__primary | |
| TCGA-BH-A0H9 | (TODO) -- GDC | clinical__primary | |
| TCGA-BH-A0HB | (TODO) -- GDC | clinical__primary | |
| TCGA-BH-A0HF | (TODO) -- GDC | clinical__primary | |
| TCGA-BH-A0HI | (TODO) -- GDC | clinical__primary | |
| TCGA-BH-A0HK | (TODO) -- GDC | clinical__primary | |
| TCGA-BH-A0HL | (TODO) -- GDC | clinical__primary | |
| TCGA-BH-A0HN | (TODO) -- GDC | clinical__primary | |
| TCGA-BH-A0HO | (TODO) -- GDC | clinical__primary | |
| TCGA-BH-A0HP | (TODO) -- GDC | clinical__primary | |
| TCGA-BH-A0HQ | (TODO) -- GDC | clinical__primary | |
| TCGA-BH-A0HU | (TODO) -- GDC | clinical__primary | |
| TCGA-BH-A0HW | (TODO) -- GDC | clinical__primary | |
| TCGA-BH-A0HX | (TODO) -- GDC | clinical__primary | |
| TCGA-BH-A0HY | (TODO) -- GDC | clinical__primary | |
| TCGA-BH-A0RX | (TODO) -- GDC | clinical__primary | |
| TCGA-BH-A0W3 | (TODO) -- GDC | clinical__primary | |
| TCGA-BH-A0W4 | (TODO) -- GDC | clinical__primary | |
| TCGA-BH-A0W5 | (TODO) -- GDC | clinical__primary | |
| TCGA-BH-A0W7 | (TODO) -- GDC | clinical__primary | |
| TCGA-BH-A0WA | (TODO) -- GDC | clinical__primary | |
| TCGA-BH-A18G | (TODO) -- GDC | clinical__primary | |
| TCGA-BH-A18H | (TODO) -- GDC | clinical__primary | |
| TCGA-BH-A18I | (TODO) -- GDC | clinical__primary | |
| TCGA-BH-A201 | (TODO) -- GDC | clinical__primary | |
| TCGA-BH-A202 | (TODO) -- GDC | clinical__primary | |
| TCGA-BH-A28O | (TODO) -- GDC | clinical__primary | |
| TCGA-BH-A28Q | (TODO) -- GDC | clinical__primary | |
| TCGA-BH-A2L8 | (TODO) -- GDC | clinical__primary | |
| TCGA-BH-A42T | (TODO) -- GDC | clinical__primary | |
| TCGA-BH-A42U | (TODO) -- GDC | clinical__primary | |
| TCGA-BH-A42V | (TODO) -- GDC | clinical__primary | |
| TCGA-BH-A5IZ | (TODO) -- GDC | clinical__primary | |
| TCGA-BH-A6R8 | (TODO) -- GDC | clinical__primary | |
| TCGA-BH-A6R9 | (TODO) -- GDC | clinical__primary | |
| TCGA-BH-A8FY | (TODO) -- GDC | clinical__primary | |
| TCGA-BH-A8FZ | (TODO) -- GDC | clinical__primary | |
| TCGA-BH-A8G0 | (TODO) -- GDC | clinical__primary | |
| TCGA-BH-AB28 | (TODO) -- GDC | clinical__primary | |
| TCGA-C8-A12K | (TODO) -- GDC | clinical__primary | |
| TCGA-C8-A12L | (TODO) -- GDC | clinical__primary | |
| TCGA-C8-A12M | (TODO) -- GDC | clinical__primary | |
| TCGA-C8-A12N | (TODO) -- GDC | clinical__primary | |
| TCGA-C8-A12O | (TODO) -- GDC | clinical__primary | |
| TCGA-C8-A12P | (TODO) -- GDC | clinical__primary | |
| TCGA-C8-A12Q | (TODO) -- GDC | clinical__primary | |
| TCGA-C8-A12T | (TODO) -- GDC | clinical__primary | |
| TCGA-C8-A12U | (TODO) -- GDC | clinical__primary | |
| TCGA-C8-A12V | (TODO) -- GDC | clinical__primary | |
| TCGA-C8-A12W | (TODO) -- GDC | clinical__primary | |
| TCGA-C8-A12X | (TODO) -- GDC | clinical__primary | |
| TCGA-C8-A12Y | (TODO) -- GDC | clinical__primary | |
| TCGA-C8-A12Z | (TODO) -- GDC | clinical__primary | |
| TCGA-C8-A130 | (TODO) -- GDC | clinical__primary | |
| TCGA-C8-A131 | (TODO) -- GDC | clinical__primary | |
| TCGA-C8-A132 | (TODO) -- GDC | clinical__primary | |
| TCGA-C8-A133 | (TODO) -- GDC | clinical__primary | |
| TCGA-C8-A134 | (TODO) -- GDC | clinical__primary | |
| TCGA-C8-A135 | (TODO) -- GDC | clinical__primary | |
| TCGA-C8-A137 | (TODO) -- GDC | clinical__primary | |
| TCGA-C8-A138 | (TODO) -- GDC | clinical__primary | |
| TCGA-C8-A1HE | (TODO) -- GDC | clinical__primary | |
| TCGA-C8-A1HF | (TODO) -- GDC | clinical__primary | |
| TCGA-C8-A1HG | (TODO) -- GDC | clinical__primary | |
| TCGA-C8-A1HI | (TODO) -- GDC | clinical__primary | |
| TCGA-C8-A1HJ | (TODO) -- GDC | clinical__primary | |
| TCGA-C8-A1HK | (TODO) -- GDC | clinical__primary | |
| TCGA-C8-A1HL | (TODO) -- GDC | clinical__primary | |
| TCGA-C8-A1HM | (TODO) -- GDC | clinical__primary | |
| TCGA-C8-A1HN | (TODO) -- GDC | clinical__primary | |
| TCGA-C8-A1HO | (TODO) -- GDC | clinical__primary | |
| TCGA-C8-A26V | (TODO) -- GDC | clinical__primary | |
| TCGA-C8-A26W | (TODO) -- GDC | clinical__primary | |
| TCGA-C8-A26X | (TODO) -- GDC | clinical__primary | |
| TCGA-C8-A26Y | (TODO) -- GDC | clinical__primary | |
| TCGA-C8-A26Z | (TODO) -- GDC | clinical__primary | |
| TCGA-C8-A273 | (TODO) -- GDC | clinical__primary | |
| TCGA-C8-A275 | (TODO) -- GDC | clinical__primary | |
| TCGA-C8-A278 | (TODO) -- GDC | clinical__primary | |
| TCGA-C8-A27A | (TODO) -- GDC | clinical__primary | |
| TCGA-C8-A27B | (TODO) -- GDC | clinical__primary | |
| TCGA-C8-A3M7 | (TODO) -- GDC | clinical__primary | |
| TCGA-C8-A3M8 | (TODO) -- GDC | clinical__primary | |
| TCGA-C8-A8HP | (TODO) -- GDC | clinical__primary | |
| TCGA-C8-A8HQ | (TODO) -- GDC | clinical__primary | |
| TCGA-C8-A8HR | (TODO) -- GDC | clinical__primary | |
| TCGA-C8-A9FZ | (TODO) -- GDC | clinical__primary | |
| TCGA-D8-A13Y | (TODO) -- GDC | clinical__primary | |
| TCGA-D8-A13Z | (TODO) -- GDC | clinical__primary | |
| TCGA-D8-A140 | (TODO) -- GDC | clinical__primary | |
| TCGA-D8-A141 | (TODO) -- GDC | clinical__primary | |
| TCGA-D8-A142 | (TODO) -- GDC | clinical__primary | |
| TCGA-D8-A143 | (TODO) -- GDC | clinical__primary | |
| TCGA-D8-A145 | (TODO) -- GDC | clinical__primary | |
| TCGA-D8-A146 | (TODO) -- GDC | clinical__primary | |
| TCGA-D8-A147 | (TODO) -- GDC | clinical__primary | |
| TCGA-D8-A1J8 | (TODO) -- GDC | clinical__primary | |
| TCGA-D8-A1J9 | (TODO) -- GDC | clinical__primary | |
| TCGA-D8-A1JA | (TODO) -- GDC | clinical__primary | |
| TCGA-D8-A1JB | (TODO) -- GDC | clinical__primary | |
| TCGA-D8-A1JC | (TODO) -- GDC | clinical__primary | |
| TCGA-D8-A1JD | (TODO) -- GDC | clinical__primary | |
| TCGA-D8-A1JE | (TODO) -- GDC | clinical__primary | |
| TCGA-D8-A1JF | (TODO) -- GDC | clinical__primary | |
| TCGA-D8-A1JG | (TODO) -- GDC | clinical__primary | |
| TCGA-D8-A1JH | (TODO) -- GDC | clinical__primary | |
| TCGA-D8-A1JI | (TODO) -- GDC | clinical__primary | |
| TCGA-D8-A1JJ | (TODO) -- GDC | clinical__primary | |
| TCGA-D8-A1JK | (TODO) -- GDC | clinical__primary | |
| TCGA-D8-A1JL | (TODO) -- GDC | clinical__primary | |
| TCGA-D8-A1JM | (TODO) -- GDC | clinical__primary | |
| TCGA-D8-A1JN | (TODO) -- GDC | clinical__primary | |
| TCGA-D8-A1JP | (TODO) -- GDC | clinical__primary | |
| TCGA-D8-A1JS | (TODO) -- GDC | clinical__primary | |
| TCGA-D8-A1JT | (TODO) -- GDC | clinical__primary | |
| TCGA-D8-A1JU | (TODO) -- GDC | clinical__primary | |
| TCGA-D8-A1X5 | (TODO) -- GDC | clinical__primary | |
| TCGA-D8-A1X6 | (TODO) -- GDC | clinical__primary | |
| TCGA-D8-A1X7 | (TODO) -- GDC | clinical__primary | |
| TCGA-D8-A1X8 | (TODO) -- GDC | clinical__primary | |
| TCGA-D8-A1X9 | (TODO) -- GDC | clinical__primary | |
| TCGA-D8-A1XA | (TODO) -- GDC | clinical__primary | |
| TCGA-D8-A1XB | (TODO) -- GDC | clinical__primary | |
| TCGA-D8-A1XC | (TODO) -- GDC | clinical__primary | |
| TCGA-D8-A1XF | (TODO) -- GDC | clinical__primary | |
| TCGA-D8-A1XG | (TODO) -- GDC | clinical__primary | |
| TCGA-D8-A1XJ | (TODO) -- GDC | clinical__primary | |
| TCGA-D8-A1XK | (TODO) -- GDC | clinical__primary | |
| TCGA-D8-A1XL | (TODO) -- GDC | clinical__primary | |
| TCGA-D8-A1XM | (TODO) -- GDC | clinical__primary | |
| TCGA-D8-A1XO | (TODO) -- GDC | clinical__primary | |
| TCGA-D8-A1XQ | (TODO) -- GDC | clinical__primary | |
| TCGA-D8-A1XR | (TODO) -- GDC | clinical__primary | |
| TCGA-D8-A1XS | (TODO) -- GDC | clinical__primary | |
| TCGA-D8-A1XT | (TODO) -- GDC | clinical__primary | |
| TCGA-D8-A1XU | (TODO) -- GDC | clinical__primary | |
| TCGA-D8-A1XV | (TODO) -- GDC | clinical__primary | |
| TCGA-D8-A1XW | (TODO) -- GDC | clinical__primary | |
| TCGA-D8-A1XY | (TODO) -- GDC | clinical__primary | |
| TCGA-D8-A1XZ | (TODO) -- GDC | clinical__primary | |
| TCGA-D8-A1Y0 | (TODO) -- GDC | clinical__primary | |
| TCGA-D8-A1Y2 | (TODO) -- GDC | clinical__primary | |
| TCGA-D8-A1Y3 | (TODO) -- GDC | clinical__primary | |
| TCGA-D8-A27F | (TODO) -- GDC | clinical__primary | |
| TCGA-D8-A27G | (TODO) -- GDC | clinical__primary | |
| TCGA-D8-A27H | (TODO) -- GDC | clinical__primary | |
| TCGA-D8-A27I | (TODO) -- GDC | clinical__primary | |
| TCGA-D8-A27K | (TODO) -- GDC | clinical__primary | |
| TCGA-D8-A27L | (TODO) -- GDC | clinical__primary | |
| TCGA-D8-A27M | (TODO) -- GDC | clinical__primary | |
| TCGA-D8-A27N | (TODO) -- GDC | clinical__primary | |
| TCGA-D8-A27P | (TODO) -- GDC | clinical__primary | |
| TCGA-D8-A27R | (TODO) -- GDC | clinical__primary | |
| TCGA-D8-A27T | (TODO) -- GDC | clinical__primary | |
| TCGA-D8-A27V | (TODO) -- GDC | clinical__primary | |
| TCGA-D8-A27W | (TODO) -- GDC | clinical__primary | |
| TCGA-D8-A3Z5 | (TODO) -- GDC | clinical__primary | |
| TCGA-D8-A3Z6 | (TODO) -- GDC | clinical__primary | |
| TCGA-D8-A4Z1 | (TODO) -- GDC | clinical__primary | |
| TCGA-D8-A73U | (TODO) -- GDC | clinical__primary | |
| TCGA-D8-A73W | (TODO) -- GDC | clinical__primary | |
| TCGA-D8-A73X | (TODO) -- GDC | clinical__primary | |
| TCGA-E2-A105 | (TODO) -- GDC | clinical__primary | |
| TCGA-E2-A106 | (TODO) -- GDC | clinical__primary | |
| TCGA-E2-A107 | (TODO) -- GDC | clinical__primary | |
| TCGA-E2-A108 | (TODO) -- GDC | clinical__primary | |
| TCGA-E2-A109 | (TODO) -- GDC | clinical__primary | |
| TCGA-E2-A10A | (TODO) -- GDC | clinical__primary | |
| TCGA-E2-A10C | (TODO) -- GDC | clinical__primary | |
| TCGA-E2-A10F | (TODO) -- GDC | clinical__primary | |
| TCGA-E2-A14N | (TODO) -- GDC | clinical__primary | |
| TCGA-E2-A14O | (TODO) -- GDC | clinical__primary | |
| TCGA-E2-A14P | (TODO) -- GDC | clinical__primary | |
| TCGA-E2-A14Q | (TODO) -- GDC | clinical__primary | |
| TCGA-E2-A14R | (TODO) -- GDC | clinical__primary | |
| TCGA-E2-A14S | (TODO) -- GDC | clinical__primary | |
| TCGA-E2-A14T | (TODO) -- GDC | clinical__primary | |
| TCGA-E2-A14U | (TODO) -- GDC | clinical__primary | |
| TCGA-E2-A14V | (TODO) -- GDC | clinical__primary | |
| TCGA-E2-A14X | (TODO) -- GDC | clinical__primary | |
| TCGA-E2-A14Y | (TODO) -- GDC | clinical__primary | |
| TCGA-E2-A14Z | (TODO) -- GDC | clinical__primary | |
| TCGA-E2-A150 | (TODO) -- GDC | clinical__primary | |
| TCGA-E2-A152 | (TODO) -- GDC | clinical__primary | |
| TCGA-E2-A153 | (TODO) -- GDC | clinical__primary | |
| TCGA-E2-A154 | (TODO) -- GDC | clinical__primary | |
| TCGA-E2-A155 | (TODO) -- GDC | clinical__primary | |
| TCGA-E2-A156 | (TODO) -- GDC | clinical__primary | |
| TCGA-E2-A158 | (TODO) -- GDC | clinical__primary | |
| TCGA-E2-A159 | (TODO) -- GDC | clinical__primary | |
| TCGA-E2-A15A | (TODO) -- GDC | clinical__primary | |
| TCGA-E2-A15C | (TODO) -- GDC | clinical__primary | |
| TCGA-E2-A15D | (TODO) -- GDC | clinical__primary | |
| TCGA-E2-A15E | (TODO) -- GDC | clinical__primary | |
| TCGA-E2-A15F | (TODO) -- GDC | clinical__primary | |
| TCGA-E2-A15G | (TODO) -- GDC | clinical__primary | |
| TCGA-E2-A15H | (TODO) -- GDC | clinical__primary | |
| TCGA-E2-A15I | (TODO) -- GDC | clinical__primary | |
| TCGA-E2-A15K | (TODO) -- GDC | clinical__primary | |
| TCGA-E2-A15L | (TODO) -- GDC | clinical__primary | |
| TCGA-E2-A15M | (TODO) -- GDC | clinical__primary | |
| TCGA-E2-A15O | (TODO) -- GDC | clinical__primary | |
| TCGA-E2-A15P | (TODO) -- GDC | clinical__primary | |
| TCGA-E2-A15R | (TODO) -- GDC | clinical__primary | |
| TCGA-E2-A15S | (TODO) -- GDC | clinical__primary | |
| TCGA-E2-A15T | (TODO) -- GDC | clinical__primary | |
| TCGA-E2-A1B0 | (TODO) -- GDC | clinical__primary | |
| TCGA-E2-A1B1 | (TODO) -- GDC | clinical__primary | |
| TCGA-E2-A1B4 | (TODO) -- GDC | clinical__primary | |
| TCGA-E2-A1B5 | (TODO) -- GDC | clinical__primary | |
| TCGA-E2-A1B6 | (TODO) -- GDC | clinical__primary | |
| TCGA-E2-A1BC | (TODO) -- GDC | clinical__primary | |
| TCGA-E2-A1BD | (TODO) -- GDC | clinical__primary | |
| TCGA-E2-A1IE | (TODO) -- GDC | clinical__primary | |
| TCGA-E2-A1IF | (TODO) -- GDC | clinical__primary | |
| TCGA-E2-A1IG | (TODO) -- GDC | clinical__primary | |
| TCGA-E2-A1IH | (TODO) -- GDC | clinical__primary | |
| TCGA-E2-A1II | (TODO) -- GDC | clinical__primary | |
| TCGA-E2-A1IJ | (TODO) -- GDC | clinical__primary | |
| TCGA-E2-A1IK | (TODO) -- GDC | clinical__primary | |
| TCGA-E2-A1IL | (TODO) -- GDC | clinical__primary | |
| TCGA-E2-A1IN | (TODO) -- GDC | clinical__primary | |
| TCGA-E2-A1IO | (TODO) -- GDC | clinical__primary | |
| TCGA-E2-A1L6 | (TODO) -- GDC | clinical__primary | |
| TCGA-E2-A1L7 | (TODO) -- GDC | clinical__primary | |
| TCGA-E2-A1L8 | (TODO) -- GDC | clinical__primary | |
| TCGA-E2-A1L9 | (TODO) -- GDC | clinical__primary | |
| TCGA-E2-A1LA | (TODO) -- GDC | clinical__primary | |
| TCGA-E2-A2P5 | (TODO) -- GDC | clinical__primary | |
| TCGA-E2-A2P6 | (TODO) -- GDC | clinical__primary | |
| TCGA-E2-A3DX | (TODO) -- GDC | clinical__primary | |
| TCGA-E2-A56Z | (TODO) -- GDC | clinical__primary | |
| TCGA-E2-A570 | (TODO) -- GDC | clinical__primary | |
| TCGA-E2-A572 | (TODO) -- GDC | clinical__primary | |
| TCGA-E2-A573 | (TODO) -- GDC | clinical__primary | |
| TCGA-E2-A574 | (TODO) -- GDC | clinical__primary | |
| TCGA-E2-A576 | (TODO) -- GDC | clinical__primary | |
| TCGA-E2-A9RU | (TODO) -- GDC | clinical__primary | |
| TCGA-E9-A1N3 | (TODO) -- GDC | clinical__primary | |
| TCGA-E9-A1N4 | (TODO) -- GDC | clinical__primary | |
| TCGA-E9-A1N5 | (TODO) -- GDC | clinical__primary | |
| TCGA-E9-A1N8 | (TODO) -- GDC | clinical__primary | |
| TCGA-E9-A1N9 | (TODO) -- GDC | clinical__primary | |
| TCGA-E9-A1NA | (TODO) -- GDC | clinical__primary | |
| TCGA-E9-A1NC | (TODO) -- GDC | clinical__primary | |
| TCGA-E9-A1ND | (TODO) -- GDC | clinical__primary | |
| TCGA-E9-A1NE | (TODO) -- GDC | clinical__primary | |
| TCGA-E9-A1NF | (TODO) -- GDC | clinical__primary | |
| TCGA-E9-A1NG | (TODO) -- GDC | clinical__primary | |
| TCGA-E9-A1NI | (TODO) -- GDC | clinical__primary | |
| TCGA-E9-A1QZ | (TODO) -- GDC | clinical__primary | |
| TCGA-E9-A1R0 | (TODO) -- GDC | clinical__primary | |
| TCGA-E9-A1R2 | (TODO) -- GDC | clinical__primary | |
| TCGA-E9-A1R3 | (TODO) -- GDC | clinical__primary | |
| TCGA-E9-A1R4 | (TODO) -- GDC | clinical__primary | |
| TCGA-E9-A1R5 | (TODO) -- GDC | clinical__primary | |
| TCGA-E9-A1R6 | (TODO) -- GDC | clinical__primary | |
| TCGA-E9-A1R7 | (TODO) -- GDC | clinical__primary | |
| TCGA-E9-A1RA | (TODO) -- GDC | clinical__primary | |
| TCGA-E9-A1RB | (TODO) -- GDC | clinical__primary | |
| TCGA-E9-A1RC | (TODO) -- GDC | clinical__primary | |
| TCGA-E9-A1RD | (TODO) -- GDC | clinical__primary | |
| TCGA-E9-A1RE | (TODO) -- GDC | clinical__primary | |
| TCGA-E9-A1RF | (TODO) -- GDC | clinical__primary | |
| TCGA-E9-A1RG | (TODO) -- GDC | clinical__primary | |
| TCGA-E9-A1RH | (TODO) -- GDC | clinical__primary | |
| TCGA-E9-A1RI | (TODO) -- GDC | clinical__primary | |
| TCGA-E9-A226 | (TODO) -- GDC | clinical__primary | |
| TCGA-E9-A227 | (TODO) -- GDC | clinical__primary | |
| TCGA-E9-A228 | (TODO) -- GDC | clinical__primary | |
| TCGA-E9-A229 | (TODO) -- GDC | clinical__primary | |
| TCGA-E9-A22A | (TODO) -- GDC | clinical__primary | |
| TCGA-E9-A22B | (TODO) -- GDC | clinical__primary | |
| TCGA-E9-A22D | (TODO) -- GDC | clinical__primary | |
| TCGA-E9-A22E | (TODO) -- GDC | clinical__primary | |
| TCGA-E9-A22G | (TODO) -- GDC | clinical__primary | |
| TCGA-E9-A22H | (TODO) -- GDC | clinical__primary | |
| TCGA-E9-A243 | (TODO) -- GDC | clinical__primary | |
| TCGA-E9-A244 | (TODO) -- GDC | clinical__primary | |
| TCGA-E9-A245 | (TODO) -- GDC | clinical__primary | |
| TCGA-E9-A247 | (TODO) -- GDC | clinical__primary | |
| TCGA-E9-A248 | (TODO) -- GDC | clinical__primary | |
| TCGA-E9-A249 | (TODO) -- GDC | clinical__primary | |
| TCGA-E9-A24A | (TODO) -- GDC | clinical__primary | |
| TCGA-E9-A295 | (TODO) -- GDC | clinical__primary | |
| TCGA-E9-A2JS | (TODO) -- GDC | clinical__primary | |
| TCGA-E9-A2JT | (TODO) -- GDC | clinical__primary | |
| TCGA-E9-A3HO | (TODO) -- GDC | clinical__primary | |
| TCGA-E9-A3Q9 | (TODO) -- GDC | clinical__primary | |
| TCGA-E9-A3QA | (TODO) -- GDC | clinical__primary | |
| TCGA-E9-A3X8 | (TODO) -- GDC | clinical__primary | |
| TCGA-E9-A54X | (TODO) -- GDC | clinical__primary | |
| TCGA-E9-A54Y | (TODO) -- GDC | clinical__primary | |
| TCGA-E9-A5FK | (TODO) -- GDC | clinical__primary | |
| TCGA-E9-A5FL | (TODO) -- GDC | clinical__primary | |
| TCGA-E9-A5UO | (TODO) -- GDC | clinical__primary | |
| TCGA-E9-A5UP | (TODO) -- GDC | clinical__primary | |
| TCGA-E9-A6HE | (TODO) -- GDC | clinical__primary | |
| TCGA-EW-A1IW | (TODO) -- GDC | clinical__primary | |
| TCGA-EW-A1IX | (TODO) -- GDC | clinical__primary | |
| TCGA-EW-A1IY | (TODO) -- GDC | clinical__primary | |
| TCGA-EW-A1IZ | (TODO) -- GDC | clinical__primary | |
| TCGA-EW-A1J1 | (TODO) -- GDC | clinical__primary | |
| TCGA-EW-A1J2 | (TODO) -- GDC | clinical__primary | |
| TCGA-EW-A1J3 | (TODO) -- GDC | clinical__primary | |
| TCGA-EW-A1J5 | (TODO) -- GDC | clinical__primary | |
| TCGA-EW-A1J6 | (TODO) -- GDC | clinical__primary | |
| TCGA-EW-A1OV | (TODO) -- GDC | clinical__primary | |
| TCGA-EW-A1OX | (TODO) -- GDC | clinical__primary | |
| TCGA-EW-A1OY | (TODO) -- GDC | clinical__primary | |
| TCGA-EW-A1OZ | (TODO) -- GDC | clinical__primary | |
| TCGA-EW-A1P0 | (TODO) -- GDC | clinical__primary | |
| TCGA-EW-A1P1 | (TODO) -- GDC | clinical__primary | |
| TCGA-EW-A1P3 | (TODO) -- GDC | clinical__primary | |
| TCGA-EW-A1P4 | (TODO) -- GDC | clinical__primary | |
| TCGA-EW-A1P5 | (TODO) -- GDC | clinical__primary | |
| TCGA-EW-A1P6 | (TODO) -- GDC | clinical__primary | |
| TCGA-EW-A1P7 | (TODO) -- GDC | clinical__primary | |
| TCGA-EW-A1P8 | (TODO) -- GDC | clinical__primary | |
| TCGA-EW-A1PA | (TODO) -- GDC | clinical__primary | |
| TCGA-EW-A1PB | (TODO) -- GDC | clinical__primary | |
| TCGA-EW-A1PC | (TODO) -- GDC | clinical__primary | |
| TCGA-EW-A1PD | (TODO) -- GDC | clinical__primary | |
| TCGA-EW-A1PE | (TODO) -- GDC | clinical__primary | |
| TCGA-EW-A1PG | (TODO) -- GDC | clinical__primary | |
| TCGA-EW-A1PH | (TODO) -- GDC | clinical__primary | |
| TCGA-EW-A2FR | (TODO) -- GDC | clinical__primary | |
| TCGA-EW-A2FS | (TODO) -- GDC | clinical__primary | |
| TCGA-EW-A2FV | (TODO) -- GDC | clinical__primary | |
| TCGA-EW-A2FW | (TODO) -- GDC | clinical__primary | |
| TCGA-EW-A3E8 | (TODO) -- GDC | clinical__primary | |
| TCGA-EW-A3U0 | (TODO) -- GDC | clinical__primary | |
| TCGA-EW-A423 | (TODO) -- GDC | clinical__primary | |
| TCGA-EW-A424 | (TODO) -- GDC | clinical__primary | |
| TCGA-EW-A6S9 | (TODO) -- GDC | clinical__primary | |
| TCGA-EW-A6SA | (TODO) -- GDC | clinical__primary | |
| TCGA-EW-A6SB | (TODO) -- GDC | clinical__primary | |
| TCGA-EW-A6SC | (TODO) -- GDC | clinical__primary | |
| TCGA-EW-A6SD | (TODO) -- GDC | clinical__primary | |
| TCGA-GM-A2DA | (TODO) -- GDC | clinical__primary | |
| TCGA-GM-A2DB | (TODO) -- GDC | clinical__primary | |
| TCGA-GM-A2DC | (TODO) -- GDC | clinical__primary | |
| TCGA-GM-A2DD | (TODO) -- GDC | clinical__primary | |
| TCGA-GM-A2DF | (TODO) -- GDC | clinical__primary | |
| TCGA-GM-A2DH | (TODO) -- GDC | clinical__primary | |
| TCGA-GM-A2DK | (TODO) -- GDC | clinical__primary | |
| TCGA-GM-A2DL | (TODO) -- GDC | clinical__primary | |
| TCGA-GM-A2DM | (TODO) -- GDC | clinical__primary | |
| TCGA-GM-A2DN | (TODO) -- GDC | clinical__primary | |
| TCGA-GM-A2DO | (TODO) -- GDC | clinical__primary | |
| TCGA-GM-A3NW | (TODO) -- GDC | clinical__primary | |
| TCGA-GM-A3NY | (TODO) -- GDC | clinical__primary | |
| TCGA-GM-A3XG | (TODO) -- GDC | clinical__primary | |
| TCGA-GM-A3XL | (TODO) -- GDC | clinical__primary | |
| TCGA-GM-A3XN | (TODO) -- GDC | clinical__primary | |
| TCGA-GM-A4E0 | (TODO) -- GDC | clinical__primary | |
| TCGA-GM-A5PV | (TODO) -- GDC | clinical__primary | |
| TCGA-GM-A5PX | (TODO) -- GDC | clinical__primary | |
| TCGA-HN-A2NL | (TODO) -- GDC | clinical__primary | |
| TCGA-HN-A2OB | (TODO) -- GDC | clinical__primary | |
| TCGA-JL-A3YW | (TODO) -- GDC | clinical__primary | |
| TCGA-JL-A3YX | (TODO) -- GDC | clinical__primary | |
| TCGA-LD-A66U | (TODO) -- GDC | clinical__primary | |
| TCGA-LD-A74U | (TODO) -- GDC | clinical__primary | |
| TCGA-LD-A7W5 | (TODO) -- GDC | clinical__primary | |
| TCGA-LD-A7W6 | (TODO) -- GDC | clinical__primary | |
| TCGA-LD-A9QF | (TODO) -- GDC | clinical__primary | |
| TCGA-LL-A440 | (TODO) -- GDC | clinical__primary | |
| TCGA-LL-A441 | (TODO) -- GDC | clinical__primary | |
| TCGA-LL-A442 | (TODO) -- GDC | clinical__primary | |
| TCGA-LL-A50Y | (TODO) -- GDC | clinical__primary | |
| TCGA-LL-A5YL | (TODO) -- GDC | clinical__primary | |
| TCGA-LL-A5YM | (TODO) -- GDC | clinical__primary | |
| TCGA-LL-A5YN | (TODO) -- GDC | clinical__primary | |
| TCGA-LL-A5YO | (TODO) -- GDC | clinical__primary | |
| TCGA-LL-A5YP | (TODO) -- GDC | clinical__primary | |
| TCGA-LL-A6FP | (TODO) -- GDC | clinical__primary | |
| TCGA-LL-A6FQ | (TODO) -- GDC | clinical__primary | |
| TCGA-LL-A6FR | (TODO) -- GDC | clinical__primary | |
| TCGA-LL-A73Y | (TODO) -- GDC | clinical__primary | |
| TCGA-LL-A73Z | (TODO) -- GDC | clinical__primary | |
| TCGA-LL-A740 | (TODO) -- GDC | clinical__primary | |
| TCGA-LL-A7SZ | (TODO) -- GDC | clinical__primary | |
| TCGA-LL-A7T0 | (TODO) -- GDC | clinical__primary | |
| TCGA-LL-A8F5 | (TODO) -- GDC | clinical__primary | |
| TCGA-LL-A9Q3 | (TODO) -- GDC | clinical__primary | |
| TCGA-LQ-A4E4 | (TODO) -- GDC | clinical__primary | |
| TCGA-MS-A51U | (TODO) -- GDC | clinical__primary | |
| TCGA-OK-A5Q2 | (TODO) -- GDC | clinical__primary | |
| TCGA-OL-A5D6 | (TODO) -- GDC | clinical__primary | |
| TCGA-OL-A5D7 | (TODO) -- GDC | clinical__primary | |
| TCGA-OL-A5D8 | (TODO) -- GDC | clinical__primary | |
| TCGA-OL-A5RU | (TODO) -- GDC | clinical__primary | |
| TCGA-OL-A5RV | (TODO) -- GDC | clinical__primary | |
| TCGA-OL-A5RW | (TODO) -- GDC | clinical__primary | |
| TCGA-OL-A5RX | (TODO) -- GDC | clinical__primary | |
| TCGA-OL-A5RY | (TODO) -- GDC | clinical__primary | |
| TCGA-OL-A5RZ | (TODO) -- GDC | clinical__primary | |
| TCGA-OL-A5S0 | (TODO) -- GDC | clinical__primary | |
| TCGA-OL-A66H | (TODO) -- GDC | clinical__primary | |
| TCGA-OL-A66I | (TODO) -- GDC | clinical__primary | |
| TCGA-OL-A66J | (TODO) -- GDC | clinical__primary | |
| TCGA-OL-A66K | (TODO) -- GDC | clinical__primary | |
| TCGA-OL-A66L | (TODO) -- GDC | clinical__primary | |
| TCGA-OL-A66N | (TODO) -- GDC | clinical__primary | |
| TCGA-OL-A66O | (TODO) -- GDC | clinical__primary | |
| TCGA-OL-A66P | (TODO) -- GDC | clinical__primary | |
| TCGA-OL-A6VO | (TODO) -- GDC | clinical__primary | |
| TCGA-OL-A6VQ | (TODO) -- GDC | clinical__primary | |
| TCGA-OL-A6VR | (TODO) -- GDC | clinical__primary | |
| TCGA-OL-A97C | (TODO) -- GDC | clinical__primary | |
| TCGA-PE-A5DC | (TODO) -- GDC | clinical__primary | |
| TCGA-PE-A5DD | (TODO) -- GDC | clinical__primary | |
| TCGA-PE-A5DE | (TODO) -- GDC | clinical__primary | |
| TCGA-PL-A8LV | (TODO) -- GDC | clinical__primary | |
| TCGA-PL-A8LX | (TODO) -- GDC | clinical__primary | |
| TCGA-PL-A8LY | (TODO) -- GDC | clinical__primary | |
| TCGA-PL-A8LZ | (TODO) -- GDC | clinical__primary | |
| TCGA-S3-A6ZF | (TODO) -- GDC | clinical__primary | |
| TCGA-S3-A6ZG | (TODO) -- GDC | clinical__primary | |
| TCGA-S3-A6ZH | (TODO) -- GDC | clinical__primary | |
| TCGA-S3-AA0Z | (TODO) -- GDC | clinical__primary | |
| TCGA-S3-AA10 | (TODO) -- GDC | clinical__primary | |
| TCGA-S3-AA11 | (TODO) -- GDC | clinical__primary | |
| TCGA-S3-AA12 | (TODO) -- GDC | clinical__primary | |
| TCGA-S3-AA14 | (TODO) -- GDC | clinical__primary | |
| TCGA-S3-AA15 | (TODO) -- GDC | clinical__primary | |
| TCGA-S3-AA17 | (TODO) -- GDC | clinical__primary | |
| TCGA-UL-AAZ6 | (TODO) -- GDC | clinical__primary | |
| TCGA-UU-A93S | (TODO) -- GDC | clinical__primary | |
| TCGA-V7-A7HQ | (TODO) -- GDC | clinical__primary | |
| TCGA-W8-A86G | (TODO) -- GDC | clinical__primary | |
| TCGA-WT-AB41 | (TODO) -- GDC | clinical__primary | |
| TCGA-WT-AB44 | (TODO) -- GDC | clinical__primary | |
| TCGA-XX-A899 | (TODO) -- GDC | clinical__primary | |
| TCGA-XX-A89A | (TODO) -- GDC | clinical__primary | |
| TCGA-Z7-A8R5 | (TODO) -- GDC | clinical__primary | |
| TCGA-Z7-A8R6 | (TODO) -- GDC | clinical__primary |
Table S3.
| TCGA Barcode | Platform | Center | Annotation |
|---|---|---|---|
| TCGA-3C-AAAU-10A-01D-A41E-01 | Affymetrix SNP 6.0 | (TODO) -- GDC | CNV__unfiltered__snp6 |
| TCGA-3C-AAAU-10A-01D-A41E-01 | Affymetrix SNP 6.0 | (TODO) -- GDC | CNV__snp6 |
| TCGA-3C-AALI-10A-01D-A41E-01 | Affymetrix SNP 6.0 | (TODO) -- GDC | CNV__unfiltered__snp6 |
| TCGA-3C-AALI-10A-01D-A41E-01 | Affymetrix SNP 6.0 | (TODO) -- GDC | CNV__snp6 |
| TCGA-3C-AALJ-10A-01D-A41E-01 | Affymetrix SNP 6.0 | (TODO) -- GDC | CNV__unfiltered__snp6 |
| TCGA-3C-AALJ-10A-01D-A41E-01 | Affymetrix SNP 6.0 | (TODO) -- GDC | CNV__snp6 |
| TCGA-3C-AALK-10A-01D-A41E-01 | Affymetrix SNP 6.0 | (TODO) -- GDC | CNV__unfiltered__snp6 |
| TCGA-3C-AALK-10A-01D-A41E-01 | Affymetrix SNP 6.0 | (TODO) -- GDC | CNV__snp6 |
| TCGA-4H-AAAK-10A-01D-A41E-01 | Affymetrix SNP 6.0 | (TODO) -- GDC | CNV__unfiltered__snp6 |
| TCGA-4H-AAAK-10A-01D-A41E-01 | Affymetrix SNP 6.0 | (TODO) -- GDC | CNV__snp6 |
| TCGA-5L-AAT0-10A-01D-A41E-01 | Affymetrix SNP 6.0 | (TODO) -- GDC | CNV__unfiltered__snp6 |
| TCGA-5L-AAT0-10A-01D-A41E-01 | Affymetrix SNP 6.0 | (TODO) -- GDC | CNV__snp6 |
| TCGA-5L-AAT1-10A-01D-A41E-01 | Affymetrix SNP 6.0 | (TODO) -- GDC | CNV__unfiltered__snp6 |
| TCGA-5L-AAT1-10A-01D-A41E-01 | Affymetrix SNP 6.0 | (TODO) -- GDC | CNV__snp6 |
| TCGA-5T-A9QA-10A-01D-A41E-01 | Affymetrix SNP 6.0 | (TODO) -- GDC | CNV__unfiltered__snp6 |
| TCGA-5T-A9QA-10A-01D-A41E-01 | Affymetrix SNP 6.0 | (TODO) -- GDC | CNV__snp6 |
| TCGA-A1-A0SB-10B-01D-A141-01 | Affymetrix SNP 6.0 | (TODO) -- GDC | CNV__unfiltered__snp6 |
| TCGA-A1-A0SB-10B-01D-A141-01 | Affymetrix SNP 6.0 | (TODO) -- GDC | CNV__snp6 |
| TCGA-A1-A0SD-10A-01D-A113-01 | Affymetrix SNP 6.0 | (TODO) -- GDC | CNV__unfiltered__snp6 |
| TCGA-A1-A0SD-10A-01D-A113-01 | Affymetrix SNP 6.0 | (TODO) -- GDC | CNV__snp6 |
| TCGA-A1-A0SE-10A-03D-A087-01 | Affymetrix SNP 6.0 | (TODO) -- GDC | CNV__unfiltered__snp6 |
| TCGA-A1-A0SE-10A-03D-A087-01 | Affymetrix SNP 6.0 | (TODO) -- GDC | CNV__snp6 |
| TCGA-A1-A0SF-10B-01D-A141-01 | Affymetrix SNP 6.0 | (TODO) -- GDC | CNV__unfiltered__snp6 |
| TCGA-A1-A0SF-10B-01D-A141-01 | Affymetrix SNP 6.0 | (TODO) -- GDC | CNV__snp6 |
| TCGA-A1-A0SG-10B-01D-A141-01 | Affymetrix SNP 6.0 | (TODO) -- GDC | CNV__unfiltered__snp6 |
| TCGA-A1-A0SG-10B-01D-A141-01 | Affymetrix SNP 6.0 | (TODO) -- GDC | CNV__snp6 |
| TCGA-A1-A0SH-10A-03D-A087-01 | Affymetrix SNP 6.0 | (TODO) -- GDC | CNV__unfiltered__snp6 |
| TCGA-A1-A0SH-10A-03D-A087-01 | Affymetrix SNP 6.0 | (TODO) -- GDC | CNV__snp6 |
| TCGA-A1-A0SI-10B-01D-A141-01 | Affymetrix SNP 6.0 | (TODO) -- GDC | CNV__unfiltered__snp6 |
| TCGA-A1-A0SI-10B-01D-A141-01 | Affymetrix SNP 6.0 | (TODO) -- GDC | CNV__snp6 |
| TCGA-A1-A0SJ-10A-02D-A087-01 | Affymetrix SNP 6.0 | (TODO) -- GDC | CNV__unfiltered__snp6 |
| TCGA-A1-A0SJ-10A-02D-A087-01 | Affymetrix SNP 6.0 | (TODO) -- GDC | CNV__snp6 |
| TCGA-A1-A0SK-10A-03D-A087-01 | Affymetrix SNP 6.0 | (TODO) -- GDC | CNV__unfiltered__snp6 |
| TCGA-A1-A0SK-10A-03D-A087-01 | Affymetrix SNP 6.0 | (TODO) -- GDC | CNV__snp6 |
| TCGA-A1-A0SM-10A-02D-A087-01 | Affymetrix SNP 6.0 | (TODO) -- GDC | CNV__unfiltered__snp6 |
| TCGA-A1-A0SM-10A-02D-A087-01 | Affymetrix SNP 6.0 | (TODO) -- GDC | CNV__snp6 |
| TCGA-A1-A0SN-10B-01D-A141-01 | Affymetrix SNP 6.0 | (TODO) -- GDC | CNV__unfiltered__snp6 |
| TCGA-A1-A0SN-10B-01D-A141-01 | Affymetrix SNP 6.0 | (TODO) -- GDC | CNV__snp6 |
| TCGA-A1-A0SO-10A-03D-A087-01 | Affymetrix SNP 6.0 | (TODO) -- GDC | CNV__unfiltered__snp6 |
| TCGA-A1-A0SO-10A-03D-A087-01 | Affymetrix SNP 6.0 | (TODO) -- GDC | CNV__snp6 |
| TCGA-A1-A0SP-10A-02D-A087-01 | Affymetrix SNP 6.0 | (TODO) -- GDC | CNV__unfiltered__snp6 |
| TCGA-A1-A0SP-10A-02D-A087-01 | Affymetrix SNP 6.0 | (TODO) -- GDC | CNV__snp6 |
| TCGA-A2-A04N-10A-01D-A113-01 | Affymetrix SNP 6.0 | (TODO) -- GDC | CNV__unfiltered__snp6 |
| TCGA-A2-A04N-10A-01D-A113-01 | Affymetrix SNP 6.0 | (TODO) -- GDC | CNV__snp6 |
| TCGA-A2-A04P-10A-01D-A037-01 | Affymetrix SNP 6.0 | (TODO) -- GDC | CNV__unfiltered__snp6 |
| TCGA-A2-A04P-10A-01D-A037-01 | Affymetrix SNP 6.0 | (TODO) -- GDC | CNV__snp6 |
| TCGA-A2-A04Q-10A-01D-A037-01 | Affymetrix SNP 6.0 | (TODO) -- GDC | CNV__unfiltered__snp6 |
| TCGA-A2-A04Q-10A-01D-A037-01 | Affymetrix SNP 6.0 | (TODO) -- GDC | CNV__snp6 |
| TCGA-A2-A04R-10B-01D-A107-01 | Affymetrix SNP 6.0 | (TODO) -- GDC | CNV__unfiltered__snp6 |
| TCGA-A2-A04R-10B-01D-A107-01 | Affymetrix SNP 6.0 | (TODO) -- GDC | CNV__snp6 |
| TCGA-A2-A04T-10A-01D-A037-01 | Affymetrix SNP 6.0 | (TODO) -- GDC | CNV__unfiltered__snp6 |
| TCGA-A2-A04T-10A-01D-A037-01 | Affymetrix SNP 6.0 | (TODO) -- GDC | CNV__snp6 |
| TCGA-A2-A04U-10A-01D-A113-01 | Affymetrix SNP 6.0 | (TODO) -- GDC | CNV__unfiltered__snp6 |
| TCGA-A2-A04U-10A-01D-A113-01 | Affymetrix SNP 6.0 | (TODO) -- GDC | CNV__snp6 |
| TCGA-A2-A04V-10A-01D-A037-01 | Affymetrix SNP 6.0 | (TODO) -- GDC | CNV__unfiltered__snp6 |
| TCGA-A2-A04V-10A-01D-A037-01 | Affymetrix SNP 6.0 | (TODO) -- GDC | CNV__snp6 |
| TCGA-A2-A04W-10A-01D-A113-01 | Affymetrix SNP 6.0 | (TODO) -- GDC | CNV__unfiltered__snp6 |
| TCGA-A2-A04W-10A-01D-A113-01 | Affymetrix SNP 6.0 | (TODO) -- GDC | CNV__snp6 |
| TCGA-A2-A04X-10A-01D-A037-01 | Affymetrix SNP 6.0 | (TODO) -- GDC | CNV__unfiltered__snp6 |
| TCGA-A2-A04X-10A-01D-A037-01 | Affymetrix SNP 6.0 | (TODO) -- GDC | CNV__snp6 |
| TCGA-A2-A04Y-10A-01D-A037-01 | Affymetrix SNP 6.0 | (TODO) -- GDC | CNV__unfiltered__snp6 |
| TCGA-A2-A04Y-10A-01D-A037-01 | Affymetrix SNP 6.0 | (TODO) -- GDC | CNV__snp6 |
| TCGA-A2-A0CK-10A-01D-A229-01 | Affymetrix SNP 6.0 | (TODO) -- GDC | CNV__unfiltered__snp6 |
| TCGA-A2-A0CK-10A-01D-A229-01 | Affymetrix SNP 6.0 | (TODO) -- GDC | CNV__snp6 |
| TCGA-A2-A0CL-10A-01D-A113-01 | Affymetrix SNP 6.0 | (TODO) -- GDC | CNV__unfiltered__snp6 |
| TCGA-A2-A0CL-10A-01D-A113-01 | Affymetrix SNP 6.0 | (TODO) -- GDC | CNV__snp6 |
| TCGA-A2-A0CM-10A-01D-A037-01 | Affymetrix SNP 6.0 | (TODO) -- GDC | CNV__unfiltered__snp6 |
| TCGA-A2-A0CM-10A-01D-A037-01 | Affymetrix SNP 6.0 | (TODO) -- GDC | CNV__snp6 |
| TCGA-A2-A0CO-10A-01D-A229-01 | Affymetrix SNP 6.0 | (TODO) -- GDC | CNV__unfiltered__snp6 |
| TCGA-A2-A0CO-10A-01D-A229-01 | Affymetrix SNP 6.0 | (TODO) -- GDC | CNV__snp6 |
| TCGA-A2-A0CP-10A-01D-A037-01 | Affymetrix SNP 6.0 | (TODO) -- GDC | CNV__unfiltered__snp6 |
| TCGA-A2-A0CP-10A-01D-A037-01 | Affymetrix SNP 6.0 | (TODO) -- GDC | CNV__snp6 |
| TCGA-A2-A0CQ-10A-01D-A037-01 | Affymetrix SNP 6.0 | (TODO) -- GDC | CNV__unfiltered__snp6 |
| TCGA-A2-A0CQ-10A-01D-A037-01 | Affymetrix SNP 6.0 | (TODO) -- GDC | CNV__snp6 |
| TCGA-A2-A0CR-10A-01D-A229-01 | Affymetrix SNP 6.0 | (TODO) -- GDC | CNV__unfiltered__snp6 |
| TCGA-A2-A0CR-10A-01D-A229-01 | Affymetrix SNP 6.0 | (TODO) -- GDC | CNV__snp6 |
| TCGA-A2-A0CS-10A-01D-A113-01 | Affymetrix SNP 6.0 | (TODO) -- GDC | CNV__unfiltered__snp6 |
| TCGA-A2-A0CS-10A-01D-A113-01 | Affymetrix SNP 6.0 | (TODO) -- GDC | CNV__snp6 |
| TCGA-A2-A0CT-10A-01D-A059-01 | Affymetrix SNP 6.0 | (TODO) -- GDC | CNV__unfiltered__snp6 |
| TCGA-A2-A0CT-10A-01D-A059-01 | Affymetrix SNP 6.0 | (TODO) -- GDC | CNV__snp6 |
| TCGA-A2-A0CU-10A-01D-A037-01 | Affymetrix SNP 6.0 | (TODO) -- GDC | CNV__unfiltered__snp6 |
| TCGA-A2-A0CU-10A-01D-A037-01 | Affymetrix SNP 6.0 | (TODO) -- GDC | CNV__snp6 |
| TCGA-A2-A0CV-10A-01D-A113-01 | Affymetrix SNP 6.0 | (TODO) -- GDC | CNV__unfiltered__snp6 |
| TCGA-A2-A0CV-10A-01D-A113-01 | Affymetrix SNP 6.0 | (TODO) -- GDC | CNV__snp6 |
| TCGA-A2-A0CW-10A-01D-A113-01 | Affymetrix SNP 6.0 | (TODO) -- GDC | CNV__unfiltered__snp6 |
| TCGA-A2-A0CW-10A-01D-A113-01 | Affymetrix SNP 6.0 | (TODO) -- GDC | CNV__snp6 |
| TCGA-A2-A0CX-10A-01D-A012-01 | Affymetrix SNP 6.0 | (TODO) -- GDC | CNV__unfiltered__snp6 |
| TCGA-A2-A0CX-10A-01D-A012-01 | Affymetrix SNP 6.0 | (TODO) -- GDC | CNV__snp6 |
| TCGA-A2-A0CY-10A-01D-A037-01 | Affymetrix SNP 6.0 | (TODO) -- GDC | CNV__unfiltered__snp6 |
| TCGA-A2-A0CY-10A-01D-A037-01 | Affymetrix SNP 6.0 | (TODO) -- GDC | CNV__snp6 |
| TCGA-A2-A0CZ-10A-01D-A037-01 | Affymetrix SNP 6.0 | (TODO) -- GDC | CNV__unfiltered__snp6 |
| TCGA-A2-A0CZ-10A-01D-A037-01 | Affymetrix SNP 6.0 | (TODO) -- GDC | CNV__snp6 |
| TCGA-A2-A0D0-10A-01D-A012-01 | Affymetrix SNP 6.0 | (TODO) -- GDC | CNV__unfiltered__snp6 |
| TCGA-A2-A0D0-10A-01D-A012-01 | Affymetrix SNP 6.0 | (TODO) -- GDC | CNV__snp6 |
| TCGA-A2-A0D1-10A-01D-A037-01 | Affymetrix SNP 6.0 | (TODO) -- GDC | CNV__unfiltered__snp6 |
| TCGA-A2-A0D1-10A-01D-A037-01 | Affymetrix SNP 6.0 | (TODO) -- GDC | CNV__snp6 |
| TCGA-A2-A0D2-10A-01D-A037-01 | Affymetrix SNP 6.0 | (TODO) -- GDC | CNV__unfiltered__snp6 |
| TCGA-A2-A0D2-10A-01D-A037-01 | Affymetrix SNP 6.0 | (TODO) -- GDC | CNV__snp6 |
| TCGA-A2-A0D3-10A-01D-A113-01 | Affymetrix SNP 6.0 | (TODO) -- GDC | CNV__unfiltered__snp6 |
| TCGA-A2-A0D3-10A-01D-A113-01 | Affymetrix SNP 6.0 | (TODO) -- GDC | CNV__snp6 |
| TCGA-A2-A0D4-10A-01D-A012-01 | Affymetrix SNP 6.0 | (TODO) -- GDC | CNV__unfiltered__snp6 |
| TCGA-A2-A0D4-10A-01D-A012-01 | Affymetrix SNP 6.0 | (TODO) -- GDC | CNV__snp6 |
| TCGA-A2-A0EM-10A-01D-A037-01 | Affymetrix SNP 6.0 | (TODO) -- GDC | CNV__unfiltered__snp6 |
| TCGA-A2-A0EM-10A-01D-A037-01 | Affymetrix SNP 6.0 | (TODO) -- GDC | CNV__snp6 |
| TCGA-A2-A0EN-10A-01D-A087-01 | Affymetrix SNP 6.0 | (TODO) -- GDC | CNV__unfiltered__snp6 |
| TCGA-A2-A0EN-10A-01D-A087-01 | Affymetrix SNP 6.0 | (TODO) -- GDC | CNV__snp6 |
| TCGA-A2-A0EO-10A-01D-A037-01 | Affymetrix SNP 6.0 | (TODO) -- GDC | CNV__unfiltered__snp6 |
| TCGA-A2-A0EO-10A-01D-A037-01 | Affymetrix SNP 6.0 | (TODO) -- GDC | CNV__snp6 |
| TCGA-A2-A0EQ-10A-01D-A037-01 | Affymetrix SNP 6.0 | (TODO) -- GDC | CNV__unfiltered__snp6 |
| TCGA-A2-A0EQ-10A-01D-A037-01 | Affymetrix SNP 6.0 | (TODO) -- GDC | CNV__snp6 |
| TCGA-A2-A0ER-10A-01D-A037-01 | Affymetrix SNP 6.0 | (TODO) -- GDC | CNV__unfiltered__snp6 |
| TCGA-A2-A0ER-10A-01D-A037-01 | Affymetrix SNP 6.0 | (TODO) -- GDC | CNV__snp6 |
| TCGA-A2-A0ES-10A-01D-A113-01 | Affymetrix SNP 6.0 | (TODO) -- GDC | CNV__unfiltered__snp6 |
| TCGA-A2-A0ES-10A-01D-A113-01 | Affymetrix SNP 6.0 | (TODO) -- GDC | CNV__snp6 |
| TCGA-A2-A0ET-10A-01D-A037-01 | Affymetrix SNP 6.0 | (TODO) -- GDC | CNV__unfiltered__snp6 |
| TCGA-A2-A0ET-10A-01D-A037-01 | Affymetrix SNP 6.0 | (TODO) -- GDC | CNV__snp6 |
| TCGA-A2-A0EU-10A-01D-A059-01 | Affymetrix SNP 6.0 | (TODO) -- GDC | CNV__unfiltered__snp6 |
| TCGA-A2-A0EU-10A-01D-A059-01 | Affymetrix SNP 6.0 | (TODO) -- GDC | CNV__snp6 |
| TCGA-A2-A0EV-10A-01D-A037-01 | Affymetrix SNP 6.0 | (TODO) -- GDC | CNV__unfiltered__snp6 |
| TCGA-A2-A0EV-10A-01D-A037-01 | Affymetrix SNP 6.0 | (TODO) -- GDC | CNV__snp6 |
| TCGA-A2-A0EW-10A-01D-A113-01 | Affymetrix SNP 6.0 | (TODO) -- GDC | CNV__unfiltered__snp6 |
| TCGA-A2-A0EW-10A-01D-A113-01 | Affymetrix SNP 6.0 | (TODO) -- GDC | CNV__snp6 |
| TCGA-A2-A0EX-10A-01D-A037-01 | Affymetrix SNP 6.0 | (TODO) -- GDC | CNV__unfiltered__snp6 |
| TCGA-A2-A0EX-10A-01D-A037-01 | Affymetrix SNP 6.0 | (TODO) -- GDC | CNV__snp6 |
| TCGA-A2-A0EY-10A-01D-A037-01 | Affymetrix SNP 6.0 | (TODO) -- GDC | CNV__unfiltered__snp6 |
| TCGA-A2-A0EY-10A-01D-A037-01 | Affymetrix SNP 6.0 | (TODO) -- GDC | CNV__snp6 |
| TCGA-A2-A0ST-10A-01D-A087-01 | Affymetrix SNP 6.0 | (TODO) -- GDC | CNV__unfiltered__snp6 |
| TCGA-A2-A0ST-10A-01D-A087-01 | Affymetrix SNP 6.0 | (TODO) -- GDC | CNV__snp6 |
| TCGA-A2-A0SU-10A-01D-A087-01 | Affymetrix SNP 6.0 | (TODO) -- GDC | CNV__unfiltered__snp6 |
| TCGA-A2-A0SU-10A-01D-A087-01 | Affymetrix SNP 6.0 | (TODO) -- GDC | CNV__snp6 |
| TCGA-A2-A0SV-10A-01D-A087-01 | Affymetrix SNP 6.0 | (TODO) -- GDC | CNV__unfiltered__snp6 |
| TCGA-A2-A0SV-10A-01D-A087-01 | Affymetrix SNP 6.0 | (TODO) -- GDC | CNV__snp6 |
| TCGA-A2-A0SW-10A-01D-A087-01 | Affymetrix SNP 6.0 | (TODO) -- GDC | CNV__unfiltered__snp6 |
| TCGA-A2-A0SW-10A-01D-A087-01 | Affymetrix SNP 6.0 | (TODO) -- GDC | CNV__snp6 |
| TCGA-A2-A0SX-10A-01D-A087-01 | Affymetrix SNP 6.0 | (TODO) -- GDC | CNV__unfiltered__snp6 |
| TCGA-A2-A0SX-10A-01D-A087-01 | Affymetrix SNP 6.0 | (TODO) -- GDC | CNV__snp6 |
| TCGA-A2-A0SY-10A-01D-A087-01 | Affymetrix SNP 6.0 | (TODO) -- GDC | CNV__unfiltered__snp6 |
| TCGA-A2-A0SY-10A-01D-A087-01 | Affymetrix SNP 6.0 | (TODO) -- GDC | CNV__snp6 |
| TCGA-A2-A0T0-10A-01D-A087-01 | Affymetrix SNP 6.0 | (TODO) -- GDC | CNV__unfiltered__snp6 |
| TCGA-A2-A0T0-10A-01D-A087-01 | Affymetrix SNP 6.0 | (TODO) -- GDC | CNV__snp6 |
| TCGA-A2-A0T1-10A-01D-A087-01 | Affymetrix SNP 6.0 | (TODO) -- GDC | CNV__unfiltered__snp6 |
| TCGA-A2-A0T1-10A-01D-A087-01 | Affymetrix SNP 6.0 | (TODO) -- GDC | CNV__snp6 |
| TCGA-A2-A0T2-10A-01D-A087-01 | Affymetrix SNP 6.0 | (TODO) -- GDC | CNV__unfiltered__snp6 |
| TCGA-A2-A0T2-10A-01D-A087-01 | Affymetrix SNP 6.0 | (TODO) -- GDC | CNV__snp6 |
| TCGA-A2-A0T3-10A-01D-A113-01 | Affymetrix SNP 6.0 | (TODO) -- GDC | CNV__unfiltered__snp6 |
| TCGA-A2-A0T3-10A-01D-A113-01 | Affymetrix SNP 6.0 | (TODO) -- GDC | CNV__snp6 |
| TCGA-A2-A0T4-10A-01D-A087-01 | Affymetrix SNP 6.0 | (TODO) -- GDC | CNV__unfiltered__snp6 |
| TCGA-A2-A0T4-10A-01D-A087-01 | Affymetrix SNP 6.0 | (TODO) -- GDC | CNV__snp6 |
| TCGA-A2-A0T5-10A-01D-A087-01 | Affymetrix SNP 6.0 | (TODO) -- GDC | CNV__unfiltered__snp6 |
| TCGA-A2-A0T5-10A-01D-A087-01 | Affymetrix SNP 6.0 | (TODO) -- GDC | CNV__snp6 |
| TCGA-A2-A0T6-10A-01D-A087-01 | Affymetrix SNP 6.0 | (TODO) -- GDC | CNV__unfiltered__snp6 |
| TCGA-A2-A0T6-10A-01D-A087-01 | Affymetrix SNP 6.0 | (TODO) -- GDC | CNV__snp6 |
| TCGA-A2-A0T7-10A-01D-A087-01 | Affymetrix SNP 6.0 | (TODO) -- GDC | CNV__unfiltered__snp6 |
| TCGA-A2-A0T7-10A-01D-A087-01 | Affymetrix SNP 6.0 | (TODO) -- GDC | CNV__snp6 |
| TCGA-A2-A0YC-10A-01D-A107-01 | Affymetrix SNP 6.0 | (TODO) -- GDC | CNV__unfiltered__snp6 |
| TCGA-A2-A0YC-10A-01D-A107-01 | Affymetrix SNP 6.0 | (TODO) -- GDC | CNV__snp6 |
| TCGA-A2-A0YD-10A-01D-A107-01 | Affymetrix SNP 6.0 | (TODO) -- GDC | CNV__unfiltered__snp6 |
| TCGA-A2-A0YD-10A-01D-A107-01 | Affymetrix SNP 6.0 | (TODO) -- GDC | CNV__snp6 |
| TCGA-A2-A0YE-10A-01D-A107-01 | Affymetrix SNP 6.0 | (TODO) -- GDC | CNV__unfiltered__snp6 |
| TCGA-A2-A0YE-10A-01D-A107-01 | Affymetrix SNP 6.0 | (TODO) -- GDC | CNV__snp6 |
| TCGA-A2-A0YF-10A-01D-A107-01 | Affymetrix SNP 6.0 | (TODO) -- GDC | CNV__unfiltered__snp6 |
| TCGA-A2-A0YF-10A-01D-A107-01 | Affymetrix SNP 6.0 | (TODO) -- GDC | CNV__snp6 |
| TCGA-A2-A0YG-10A-01D-A107-01 | Affymetrix SNP 6.0 | (TODO) -- GDC | CNV__unfiltered__snp6 |
| TCGA-A2-A0YG-10A-01D-A107-01 | Affymetrix SNP 6.0 | (TODO) -- GDC | CNV__snp6 |
| TCGA-A2-A0YH-10A-01D-A107-01 | Affymetrix SNP 6.0 | (TODO) -- GDC | CNV__unfiltered__snp6 |
| TCGA-A2-A0YH-10A-01D-A107-01 | Affymetrix SNP 6.0 | (TODO) -- GDC | CNV__snp6 |
| TCGA-A2-A0YI-10A-01D-A10L-01 | Affymetrix SNP 6.0 | (TODO) -- GDC | CNV__unfiltered__snp6 |
| TCGA-A2-A0YI-10A-01D-A10L-01 | Affymetrix SNP 6.0 | (TODO) -- GDC | CNV__snp6 |
| TCGA-A2-A0YJ-10A-01D-A107-01 | Affymetrix SNP 6.0 | (TODO) -- GDC | CNV__unfiltered__snp6 |
| TCGA-A2-A0YJ-10A-01D-A107-01 | Affymetrix SNP 6.0 | (TODO) -- GDC | CNV__snp6 |
| TCGA-A2-A0YK-10A-01D-A107-01 | Affymetrix SNP 6.0 | (TODO) -- GDC | CNV__unfiltered__snp6 |
| TCGA-A2-A0YK-10A-01D-A107-01 | Affymetrix SNP 6.0 | (TODO) -- GDC | CNV__snp6 |
| TCGA-A2-A0YL-10A-01D-A107-01 | Affymetrix SNP 6.0 | (TODO) -- GDC | CNV__unfiltered__snp6 |
| TCGA-A2-A0YL-10A-01D-A107-01 | Affymetrix SNP 6.0 | (TODO) -- GDC | CNV__snp6 |
| TCGA-A2-A0YM-10A-01D-A107-01 | Affymetrix SNP 6.0 | (TODO) -- GDC | CNV__unfiltered__snp6 |
| TCGA-A2-A0YM-10A-01D-A107-01 | Affymetrix SNP 6.0 | (TODO) -- GDC | CNV__snp6 |
| TCGA-A2-A0YT-10A-01D-A107-01 | Affymetrix SNP 6.0 | (TODO) -- GDC | CNV__unfiltered__snp6 |
| TCGA-A2-A0YT-10A-01D-A107-01 | Affymetrix SNP 6.0 | (TODO) -- GDC | CNV__snp6 |
| TCGA-A2-A1FV-10A-01D-A13N-01 | Affymetrix SNP 6.0 | (TODO) -- GDC | CNV__unfiltered__snp6 |
| TCGA-A2-A1FV-10A-01D-A13N-01 | Affymetrix SNP 6.0 | (TODO) -- GDC | CNV__snp6 |
| TCGA-A2-A1FW-10A-01D-A13N-01 | Affymetrix SNP 6.0 | (TODO) -- GDC | CNV__unfiltered__snp6 |
| TCGA-A2-A1FW-10A-01D-A13N-01 | Affymetrix SNP 6.0 | (TODO) -- GDC | CNV__snp6 |
| TCGA-A2-A1FX-10A-01D-A13N-01 | Affymetrix SNP 6.0 | (TODO) -- GDC | CNV__unfiltered__snp6 |
| TCGA-A2-A1FX-10A-01D-A13N-01 | Affymetrix SNP 6.0 | (TODO) -- GDC | CNV__snp6 |
| TCGA-A2-A1FZ-10A-01D-A14F-01 | Affymetrix SNP 6.0 | (TODO) -- GDC | CNV__unfiltered__snp6 |
| TCGA-A2-A1FZ-10A-01D-A14F-01 | Affymetrix SNP 6.0 | (TODO) -- GDC | CNV__snp6 |
| TCGA-A2-A1G0-10A-01D-A13N-01 | Affymetrix SNP 6.0 | (TODO) -- GDC | CNV__unfiltered__snp6 |
| TCGA-A2-A1G0-10A-01D-A13N-01 | Affymetrix SNP 6.0 | (TODO) -- GDC | CNV__snp6 |
| TCGA-A2-A1G1-10A-01D-A13N-01 | Affymetrix SNP 6.0 | (TODO) -- GDC | CNV__unfiltered__snp6 |
| TCGA-A2-A1G1-10A-01D-A13N-01 | Affymetrix SNP 6.0 | (TODO) -- GDC | CNV__snp6 |
| TCGA-A2-A1G4-10A-01D-A13N-01 | Affymetrix SNP 6.0 | (TODO) -- GDC | CNV__unfiltered__snp6 |
| TCGA-A2-A1G4-10A-01D-A13N-01 | Affymetrix SNP 6.0 | (TODO) -- GDC | CNV__snp6 |
| TCGA-A2-A1G6-10A-01D-A13N-01 | Affymetrix SNP 6.0 | (TODO) -- GDC | CNV__unfiltered__snp6 |
| TCGA-A2-A1G6-10A-01D-A13N-01 | Affymetrix SNP 6.0 | (TODO) -- GDC | CNV__snp6 |
| TCGA-A2-A259-10A-01D-A16C-01 | Affymetrix SNP 6.0 | (TODO) -- GDC | CNV__unfiltered__snp6 |
| TCGA-A2-A259-10A-01D-A16C-01 | Affymetrix SNP 6.0 | (TODO) -- GDC | CNV__snp6 |
| TCGA-A2-A25A-10A-01D-A16C-01 | Affymetrix SNP 6.0 | (TODO) -- GDC | CNV__unfiltered__snp6 |
| TCGA-A2-A25A-10A-01D-A16C-01 | Affymetrix SNP 6.0 | (TODO) -- GDC | CNV__snp6 |
| TCGA-A2-A25B-10A-01D-A166-01 | Affymetrix SNP 6.0 | (TODO) -- GDC | CNV__unfiltered__snp6 |
| TCGA-A2-A25B-10A-01D-A166-01 | Affymetrix SNP 6.0 | (TODO) -- GDC | CNV__snp6 |
| TCGA-A2-A25C-10A-01D-A166-01 | Affymetrix SNP 6.0 | (TODO) -- GDC | CNV__unfiltered__snp6 |
| TCGA-A2-A25C-10A-01D-A166-01 | Affymetrix SNP 6.0 | (TODO) -- GDC | CNV__snp6 |
| TCGA-A2-A25D-10A-01D-A16C-01 | Affymetrix SNP 6.0 | (TODO) -- GDC | CNV__unfiltered__snp6 |
| TCGA-A2-A25D-10A-01D-A16C-01 | Affymetrix SNP 6.0 | (TODO) -- GDC | CNV__snp6 |
| TCGA-A2-A25E-10A-01D-A166-01 | Affymetrix SNP 6.0 | (TODO) -- GDC | CNV__unfiltered__snp6 |
| TCGA-A2-A25E-10A-01D-A166-01 | Affymetrix SNP 6.0 | (TODO) -- GDC | CNV__snp6 |
| TCGA-A2-A25F-10A-01D-A166-01 | Affymetrix SNP 6.0 | (TODO) -- GDC | CNV__unfiltered__snp6 |
| TCGA-A2-A25F-10A-01D-A166-01 | Affymetrix SNP 6.0 | (TODO) -- GDC | CNV__snp6 |
| TCGA-A2-A3KC-10A-01D-A20R-01 | Affymetrix SNP 6.0 | (TODO) -- GDC | CNV__unfiltered__snp6 |
| TCGA-A2-A3KC-10A-01D-A20R-01 | Affymetrix SNP 6.0 | (TODO) -- GDC | CNV__snp6 |
| TCGA-A2-A3KD-10A-01D-A20R-01 | Affymetrix SNP 6.0 | (TODO) -- GDC | CNV__unfiltered__snp6 |
| TCGA-A2-A3KD-10A-01D-A20R-01 | Affymetrix SNP 6.0 | (TODO) -- GDC | CNV__snp6 |
| TCGA-A2-A3XS-10A-01D-A22W-01 | Affymetrix SNP 6.0 | (TODO) -- GDC | CNV__unfiltered__snp6 |
| TCGA-A2-A3XS-10A-01D-A22W-01 | Affymetrix SNP 6.0 | (TODO) -- GDC | CNV__snp6 |
| TCGA-A2-A3XT-10A-01D-A22W-01 | Affymetrix SNP 6.0 | (TODO) -- GDC | CNV__unfiltered__snp6 |
| TCGA-A2-A3XT-10A-01D-A22W-01 | Affymetrix SNP 6.0 | (TODO) -- GDC | CNV__snp6 |
| TCGA-A2-A3XU-10A-01D-A22W-01 | Affymetrix SNP 6.0 | (TODO) -- GDC | CNV__unfiltered__snp6 |
| TCGA-A2-A3XU-10A-01D-A22W-01 | Affymetrix SNP 6.0 | (TODO) -- GDC | CNV__snp6 |
| TCGA-A2-A3XV-10A-01D-A238-01 | Affymetrix SNP 6.0 | (TODO) -- GDC | CNV__unfiltered__snp6 |
| TCGA-A2-A3XV-10A-01D-A238-01 | Affymetrix SNP 6.0 | (TODO) -- GDC | CNV__snp6 |
| TCGA-A2-A3XW-10A-01D-A238-01 | Affymetrix SNP 6.0 | (TODO) -- GDC | CNV__unfiltered__snp6 |
| TCGA-A2-A3XW-10A-01D-A238-01 | Affymetrix SNP 6.0 | (TODO) -- GDC | CNV__snp6 |
| TCGA-A2-A3XZ-10A-01D-A238-01 | Affymetrix SNP 6.0 | (TODO) -- GDC | CNV__unfiltered__snp6 |
| TCGA-A2-A3XZ-10A-01D-A238-01 | Affymetrix SNP 6.0 | (TODO) -- GDC | CNV__snp6 |
| TCGA-A2-A3Y0-10A-01D-A238-01 | Affymetrix SNP 6.0 | (TODO) -- GDC | CNV__unfiltered__snp6 |
| TCGA-A2-A3Y0-10A-01D-A238-01 | Affymetrix SNP 6.0 | (TODO) -- GDC | CNV__snp6 |
| TCGA-A2-A4RW-10A-01D-A25N-01 | Affymetrix SNP 6.0 | (TODO) -- GDC | CNV__unfiltered__snp6 |
| TCGA-A2-A4RW-10A-01D-A25N-01 | Affymetrix SNP 6.0 | (TODO) -- GDC | CNV__snp6 |
| TCGA-A2-A4RX-10A-01D-A25N-01 | Affymetrix SNP 6.0 | (TODO) -- GDC | CNV__unfiltered__snp6 |
| TCGA-A2-A4RX-10A-01D-A25N-01 | Affymetrix SNP 6.0 | (TODO) -- GDC | CNV__snp6 |
| TCGA-A2-A4RY-10A-01D-A25N-01 | Affymetrix SNP 6.0 | (TODO) -- GDC | CNV__unfiltered__snp6 |
| TCGA-A2-A4RY-10A-01D-A25N-01 | Affymetrix SNP 6.0 | (TODO) -- GDC | CNV__snp6 |
| TCGA-A2-A4S0-10A-01D-A25N-01 | Affymetrix SNP 6.0 | (TODO) -- GDC | CNV__unfiltered__snp6 |
| TCGA-A2-A4S0-10A-01D-A25N-01 | Affymetrix SNP 6.0 | (TODO) -- GDC | CNV__snp6 |
| TCGA-A2-A4S1-10A-01D-A25N-01 | Affymetrix SNP 6.0 | (TODO) -- GDC | CNV__unfiltered__snp6 |
| TCGA-A2-A4S1-10A-01D-A25N-01 | Affymetrix SNP 6.0 | (TODO) -- GDC | CNV__snp6 |
| TCGA-A2-A4S2-10A-01D-A25N-01 | Affymetrix SNP 6.0 | (TODO) -- GDC | CNV__unfiltered__snp6 |
| TCGA-A2-A4S2-10A-01D-A25N-01 | Affymetrix SNP 6.0 | (TODO) -- GDC | CNV__snp6 |
| TCGA-A2-A4S3-10A-01D-A25N-01 | Affymetrix SNP 6.0 | (TODO) -- GDC | CNV__unfiltered__snp6 |
| TCGA-A2-A4S3-10A-01D-A25N-01 | Affymetrix SNP 6.0 | (TODO) -- GDC | CNV__snp6 |
| TCGA-A7-A0CD-10A-01D-A012-01 | Affymetrix SNP 6.0 | (TODO) -- GDC | CNV__unfiltered__snp6 |
| TCGA-A7-A0CD-10A-01D-A012-01 | Affymetrix SNP 6.0 | (TODO) -- GDC | CNV__snp6 |
| TCGA-A7-A0CE-10A-01D-A012-01 | Affymetrix SNP 6.0 | (TODO) -- GDC | CNV__unfiltered__snp6 |
| TCGA-A7-A0CE-10A-01D-A012-01 | Affymetrix SNP 6.0 | (TODO) -- GDC | CNV__snp6 |
| TCGA-A7-A0CG-10A-01D-A012-01 | Affymetrix SNP 6.0 | (TODO) -- GDC | CNV__unfiltered__snp6 |
| TCGA-A7-A0CG-10A-01D-A012-01 | Affymetrix SNP 6.0 | (TODO) -- GDC | CNV__snp6 |
| TCGA-A7-A0CJ-10A-01D-A012-01 | Affymetrix SNP 6.0 | (TODO) -- GDC | CNV__unfiltered__snp6 |
| TCGA-A7-A0CJ-10A-01D-A012-01 | Affymetrix SNP 6.0 | (TODO) -- GDC | CNV__snp6 |
| TCGA-A7-A0D9-10A-01D-A059-01 | Affymetrix SNP 6.0 | (TODO) -- GDC | CNV__unfiltered__snp6 |
| TCGA-A7-A0D9-10A-01D-A059-01 | Affymetrix SNP 6.0 | (TODO) -- GDC | CNV__snp6 |
| TCGA-A7-A0DA-10A-01D-A113-01 | Affymetrix SNP 6.0 | (TODO) -- GDC | CNV__unfiltered__snp6 |
| TCGA-A7-A0DA-10A-01D-A113-01 | Affymetrix SNP 6.0 | (TODO) -- GDC | CNV__snp6 |
| TCGA-A7-A0DB-10A-01D-A012-01 | Affymetrix SNP 6.0 | (TODO) -- GDC | CNV__unfiltered__snp6 |
| TCGA-A7-A0DB-10A-01D-A012-01 | Affymetrix SNP 6.0 | (TODO) -- GDC | CNV__snp6 |
| TCGA-A7-A0DC-10A-01D-A012-01 | Affymetrix SNP 6.0 | (TODO) -- GDC | CNV__unfiltered__snp6 |
| TCGA-A7-A0DC-10A-01D-A012-01 | Affymetrix SNP 6.0 | (TODO) -- GDC | CNV__snp6 |
| TCGA-A7-A13D-10A-02D-A12N-01 | Affymetrix SNP 6.0 | (TODO) -- GDC | CNV__unfiltered__snp6 |
| TCGA-A7-A13D-10A-02D-A12N-01 | Affymetrix SNP 6.0 | (TODO) -- GDC | CNV__snp6 |
| TCGA-A7-A13E-10A-01D-A12N-01 | Affymetrix SNP 6.0 | (TODO) -- GDC | CNV__unfiltered__snp6 |
| TCGA-A7-A13E-10A-01D-A12N-01 | Affymetrix SNP 6.0 | (TODO) -- GDC | CNV__snp6 |
| TCGA-A7-A13F-10A-01D-A12N-01 | Affymetrix SNP 6.0 | (TODO) -- GDC | CNV__unfiltered__snp6 |
| TCGA-A7-A13F-10A-01D-A12N-01 | Affymetrix SNP 6.0 | (TODO) -- GDC | CNV__snp6 |
| TCGA-A7-A13H-10A-01D-A229-01 | Affymetrix SNP 6.0 | (TODO) -- GDC | CNV__unfiltered__snp6 |
| TCGA-A7-A13H-10A-01D-A229-01 | Affymetrix SNP 6.0 | (TODO) -- GDC | CNV__snp6 |
| TCGA-A7-A26E-10A-01D-A166-01 | Affymetrix SNP 6.0 | (TODO) -- GDC | CNV__unfiltered__snp6 |
| TCGA-A7-A26E-10A-01D-A166-01 | Affymetrix SNP 6.0 | (TODO) -- GDC | CNV__snp6 |
| TCGA-A7-A26E-10A-01D-A275-01 | Affymetrix SNP 6.0 | (TODO) -- GDC | CNV__unfiltered__snp6 |
| TCGA-A7-A26E-10A-01D-A275-01 | Affymetrix SNP 6.0 | (TODO) -- GDC | CNV__snp6 |
| TCGA-A7-A26F-10A-01D-A166-01 | Affymetrix SNP 6.0 | (TODO) -- GDC | CNV__unfiltered__snp6 |
| TCGA-A7-A26F-10A-01D-A166-01 | Affymetrix SNP 6.0 | (TODO) -- GDC | CNV__snp6 |
| TCGA-A7-A26G-10A-01D-A166-01 | Affymetrix SNP 6.0 | (TODO) -- GDC | CNV__unfiltered__snp6 |
| TCGA-A7-A26G-10A-01D-A166-01 | Affymetrix SNP 6.0 | (TODO) -- GDC | CNV__snp6 |
| TCGA-A7-A26H-10A-01D-A166-01 | Affymetrix SNP 6.0 | (TODO) -- GDC | CNV__unfiltered__snp6 |
| TCGA-A7-A26H-10A-01D-A166-01 | Affymetrix SNP 6.0 | (TODO) -- GDC | CNV__snp6 |
| TCGA-A7-A26I-10A-01D-A166-01 | Affymetrix SNP 6.0 | (TODO) -- GDC | CNV__unfiltered__snp6 |
| TCGA-A7-A26I-10A-01D-A166-01 | Affymetrix SNP 6.0 | (TODO) -- GDC | CNV__snp6 |
| TCGA-A7-A26J-10A-01D-A166-01 | Affymetrix SNP 6.0 | (TODO) -- GDC | CNV__unfiltered__snp6 |
| TCGA-A7-A26J-10A-01D-A166-01 | Affymetrix SNP 6.0 | (TODO) -- GDC | CNV__snp6 |
| TCGA-A7-A26J-10A-01D-A275-01 | Affymetrix SNP 6.0 | (TODO) -- GDC | CNV__unfiltered__snp6 |
| TCGA-A7-A26J-10A-01D-A275-01 | Affymetrix SNP 6.0 | (TODO) -- GDC | CNV__snp6 |
| TCGA-A7-A2KD-10A-01D-A21P-01 | Affymetrix SNP 6.0 | (TODO) -- GDC | CNV__unfiltered__snp6 |
| TCGA-A7-A2KD-10A-01D-A21P-01 | Affymetrix SNP 6.0 | (TODO) -- GDC | CNV__snp6 |
| TCGA-A7-A3IY-10A-01D-A21P-01 | Affymetrix SNP 6.0 | (TODO) -- GDC | CNV__unfiltered__snp6 |
| TCGA-A7-A3IY-10A-01D-A21P-01 | Affymetrix SNP 6.0 | (TODO) -- GDC | CNV__snp6 |
| TCGA-A7-A3IZ-10A-01D-A20R-01 | Affymetrix SNP 6.0 | (TODO) -- GDC | CNV__unfiltered__snp6 |
| TCGA-A7-A3IZ-10A-01D-A20R-01 | Affymetrix SNP 6.0 | (TODO) -- GDC | CNV__snp6 |
| TCGA-A7-A3J0-10A-01D-A20R-01 | Affymetrix SNP 6.0 | (TODO) -- GDC | CNV__unfiltered__snp6 |
| TCGA-A7-A3J0-10A-01D-A20R-01 | Affymetrix SNP 6.0 | (TODO) -- GDC | CNV__snp6 |
| TCGA-A7-A3J1-10A-01D-A20R-01 | Affymetrix SNP 6.0 | (TODO) -- GDC | CNV__unfiltered__snp6 |
| TCGA-A7-A3J1-10A-01D-A20R-01 | Affymetrix SNP 6.0 | (TODO) -- GDC | CNV__snp6 |
| TCGA-A7-A3RF-10A-01D-A229-01 | Affymetrix SNP 6.0 | (TODO) -- GDC | CNV__unfiltered__snp6 |
| TCGA-A7-A3RF-10A-01D-A229-01 | Affymetrix SNP 6.0 | (TODO) -- GDC | CNV__snp6 |
| TCGA-A7-A425-10A-01D-A242-01 | Affymetrix SNP 6.0 | (TODO) -- GDC | CNV__unfiltered__snp6 |
| TCGA-A7-A425-10A-01D-A242-01 | Affymetrix SNP 6.0 | (TODO) -- GDC | CNV__snp6 |
| TCGA-A7-A426-10A-01D-A242-01 | Affymetrix SNP 6.0 | (TODO) -- GDC | CNV__unfiltered__snp6 |
| TCGA-A7-A426-10A-01D-A242-01 | Affymetrix SNP 6.0 | (TODO) -- GDC | CNV__snp6 |
| TCGA-A7-A4SA-10A-01D-A25N-01 | Affymetrix SNP 6.0 | (TODO) -- GDC | CNV__unfiltered__snp6 |
| TCGA-A7-A4SA-10A-01D-A25N-01 | Affymetrix SNP 6.0 | (TODO) -- GDC | CNV__snp6 |
| TCGA-A7-A4SB-10A-01D-A25N-01 | Affymetrix SNP 6.0 | (TODO) -- GDC | CNV__unfiltered__snp6 |
| TCGA-A7-A4SB-10A-01D-A25N-01 | Affymetrix SNP 6.0 | (TODO) -- GDC | CNV__snp6 |
| TCGA-A7-A4SC-10A-01D-A25N-01 | Affymetrix SNP 6.0 | (TODO) -- GDC | CNV__unfiltered__snp6 |
| TCGA-A7-A4SC-10A-01D-A25N-01 | Affymetrix SNP 6.0 | (TODO) -- GDC | CNV__snp6 |
| TCGA-A7-A4SD-10A-01D-A25N-01 | Affymetrix SNP 6.0 | (TODO) -- GDC | CNV__unfiltered__snp6 |
| TCGA-A7-A4SD-10A-01D-A25N-01 | Affymetrix SNP 6.0 | (TODO) -- GDC | CNV__snp6 |
| TCGA-A7-A4SE-10A-01D-A25N-01 | Affymetrix SNP 6.0 | (TODO) -- GDC | CNV__unfiltered__snp6 |
| TCGA-A7-A4SE-10A-01D-A25N-01 | Affymetrix SNP 6.0 | (TODO) -- GDC | CNV__snp6 |
| TCGA-A7-A4SF-10A-01D-A25N-01 | Affymetrix SNP 6.0 | (TODO) -- GDC | CNV__unfiltered__snp6 |
| TCGA-A7-A4SF-10A-01D-A25N-01 | Affymetrix SNP 6.0 | (TODO) -- GDC | CNV__snp6 |
| TCGA-A7-A56D-10A-01D-A27O-01 | Affymetrix SNP 6.0 | (TODO) -- GDC | CNV__unfiltered__snp6 |
| TCGA-A7-A56D-10A-01D-A27O-01 | Affymetrix SNP 6.0 | (TODO) -- GDC | CNV__snp6 |
| TCGA-A7-A5ZV-10A-01D-A28D-01 | Affymetrix SNP 6.0 | (TODO) -- GDC | CNV__unfiltered__snp6 |
| TCGA-A7-A5ZV-10A-01D-A28D-01 | Affymetrix SNP 6.0 | (TODO) -- GDC | CNV__snp6 |
| TCGA-A7-A5ZW-10A-01D-A29M-01 | Affymetrix SNP 6.0 | (TODO) -- GDC | CNV__unfiltered__snp6 |
| TCGA-A7-A5ZW-10A-01D-A29M-01 | Affymetrix SNP 6.0 | (TODO) -- GDC | CNV__snp6 |
| TCGA-A7-A5ZX-10A-01D-A29M-01 | Affymetrix SNP 6.0 | (TODO) -- GDC | CNV__unfiltered__snp6 |
| TCGA-A7-A5ZX-10A-01D-A29M-01 | Affymetrix SNP 6.0 | (TODO) -- GDC | CNV__snp6 |
| TCGA-A7-A6VV-10A-01D-A33G-01 | Affymetrix SNP 6.0 | (TODO) -- GDC | CNV__unfiltered__snp6 |
| TCGA-A7-A6VV-10A-01D-A33G-01 | Affymetrix SNP 6.0 | (TODO) -- GDC | CNV__snp6 |
| TCGA-A7-A6VW-10A-01D-A33G-01 | Affymetrix SNP 6.0 | (TODO) -- GDC | CNV__unfiltered__snp6 |
| TCGA-A7-A6VW-10A-01D-A33G-01 | Affymetrix SNP 6.0 | (TODO) -- GDC | CNV__snp6 |
| TCGA-A7-A6VX-10A-01D-A33G-01 | Affymetrix SNP 6.0 | (TODO) -- GDC | CNV__unfiltered__snp6 |
| TCGA-A7-A6VX-10A-01D-A33G-01 | Affymetrix SNP 6.0 | (TODO) -- GDC | CNV__snp6 |
| TCGA-A7-A6VY-10A-01D-A33G-01 | Affymetrix SNP 6.0 | (TODO) -- GDC | CNV__unfiltered__snp6 |
| TCGA-A7-A6VY-10A-01D-A33G-01 | Affymetrix SNP 6.0 | (TODO) -- GDC | CNV__snp6 |
| TCGA-A8-A06N-10A-01D-A012-01 | Affymetrix SNP 6.0 | (TODO) -- GDC | CNV__unfiltered__snp6 |
| TCGA-A8-A06N-10A-01D-A012-01 | Affymetrix SNP 6.0 | (TODO) -- GDC | CNV__snp6 |
| TCGA-A8-A06O-10A-01D-A012-01 | Affymetrix SNP 6.0 | (TODO) -- GDC | CNV__unfiltered__snp6 |
| TCGA-A8-A06O-10A-01D-A012-01 | Affymetrix SNP 6.0 | (TODO) -- GDC | CNV__snp6 |
| TCGA-A8-A06P-10A-01D-A012-01 | Affymetrix SNP 6.0 | (TODO) -- GDC | CNV__unfiltered__snp6 |
| TCGA-A8-A06P-10A-01D-A012-01 | Affymetrix SNP 6.0 | (TODO) -- GDC | CNV__snp6 |
| TCGA-A8-A06Q-10A-01D-A037-01 | Affymetrix SNP 6.0 | (TODO) -- GDC | CNV__unfiltered__snp6 |
| TCGA-A8-A06Q-10A-01D-A037-01 | Affymetrix SNP 6.0 | (TODO) -- GDC | CNV__snp6 |
| TCGA-A8-A06R-10A-01D-A012-01 | Affymetrix SNP 6.0 | (TODO) -- GDC | CNV__unfiltered__snp6 |
| TCGA-A8-A06R-10A-01D-A012-01 | Affymetrix SNP 6.0 | (TODO) -- GDC | CNV__snp6 |
| TCGA-A8-A06T-10A-01D-A012-01 | Affymetrix SNP 6.0 | (TODO) -- GDC | CNV__unfiltered__snp6 |
| TCGA-A8-A06T-10A-01D-A012-01 | Affymetrix SNP 6.0 | (TODO) -- GDC | CNV__snp6 |
| TCGA-A8-A06U-10A-01D-A012-01 | Affymetrix SNP 6.0 | (TODO) -- GDC | CNV__unfiltered__snp6 |
| TCGA-A8-A06U-10A-01D-A012-01 | Affymetrix SNP 6.0 | (TODO) -- GDC | CNV__snp6 |
| TCGA-A8-A06X-10A-01D-A012-01 | Affymetrix SNP 6.0 | (TODO) -- GDC | CNV__unfiltered__snp6 |
| TCGA-A8-A06X-10A-01D-A012-01 | Affymetrix SNP 6.0 | (TODO) -- GDC | CNV__snp6 |
| TCGA-A8-A06Y-10A-01D-A012-01 | Affymetrix SNP 6.0 | (TODO) -- GDC | CNV__unfiltered__snp6 |
| TCGA-A8-A06Y-10A-01D-A012-01 | Affymetrix SNP 6.0 | (TODO) -- GDC | CNV__snp6 |
| TCGA-A8-A06Z-10A-01D-A012-01 | Affymetrix SNP 6.0 | (TODO) -- GDC | CNV__unfiltered__snp6 |
| TCGA-A8-A06Z-10A-01D-A012-01 | Affymetrix SNP 6.0 | (TODO) -- GDC | CNV__snp6 |
| TCGA-A8-A075-10B-01D-A087-01 | Affymetrix SNP 6.0 | (TODO) -- GDC | CNV__unfiltered__snp6 |
| TCGA-A8-A075-10B-01D-A087-01 | Affymetrix SNP 6.0 | (TODO) -- GDC | CNV__snp6 |
| TCGA-A8-A076-10A-01D-A012-01 | Affymetrix SNP 6.0 | (TODO) -- GDC | CNV__unfiltered__snp6 |
| TCGA-A8-A076-10A-01D-A012-01 | Affymetrix SNP 6.0 | (TODO) -- GDC | CNV__snp6 |
| TCGA-A8-A079-10A-01D-A012-01 | Affymetrix SNP 6.0 | (TODO) -- GDC | CNV__unfiltered__snp6 |
| TCGA-A8-A079-10A-01D-A012-01 | Affymetrix SNP 6.0 | (TODO) -- GDC | CNV__snp6 |
| TCGA-A8-A07B-10A-01D-A012-01 | Affymetrix SNP 6.0 | (TODO) -- GDC | CNV__unfiltered__snp6 |
| TCGA-A8-A07B-10A-01D-A012-01 | Affymetrix SNP 6.0 | (TODO) -- GDC | CNV__snp6 |
| TCGA-A8-A07C-10A-01D-A037-01 | Affymetrix SNP 6.0 | (TODO) -- GDC | CNV__unfiltered__snp6 |
| TCGA-A8-A07C-10A-01D-A037-01 | Affymetrix SNP 6.0 | (TODO) -- GDC | CNV__snp6 |
| TCGA-A8-A07E-10A-01D-A037-01 | Affymetrix SNP 6.0 | (TODO) -- GDC | CNV__unfiltered__snp6 |
| TCGA-A8-A07E-10A-01D-A037-01 | Affymetrix SNP 6.0 | (TODO) -- GDC | CNV__snp6 |
| TCGA-A8-A07F-10A-01D-A012-01 | Affymetrix SNP 6.0 | (TODO) -- GDC | CNV__unfiltered__snp6 |
| TCGA-A8-A07F-10A-01D-A012-01 | Affymetrix SNP 6.0 | (TODO) -- GDC | CNV__snp6 |
| TCGA-A8-A07G-10A-01D-A037-01 | Affymetrix SNP 6.0 | (TODO) -- GDC | CNV__unfiltered__snp6 |
| TCGA-A8-A07G-10A-01D-A037-01 | Affymetrix SNP 6.0 | (TODO) -- GDC | CNV__snp6 |
| TCGA-A8-A07I-10A-01D-A012-01 | Affymetrix SNP 6.0 | (TODO) -- GDC | CNV__unfiltered__snp6 |
| TCGA-A8-A07I-10A-01D-A012-01 | Affymetrix SNP 6.0 | (TODO) -- GDC | CNV__snp6 |
| TCGA-A8-A07J-10A-01D-A012-01 | Affymetrix SNP 6.0 | (TODO) -- GDC | CNV__unfiltered__snp6 |
| TCGA-A8-A07J-10A-01D-A012-01 | Affymetrix SNP 6.0 | (TODO) -- GDC | CNV__snp6 |
| TCGA-A8-A07L-10A-01D-A012-01 | Affymetrix SNP 6.0 | (TODO) -- GDC | CNV__unfiltered__snp6 |
| TCGA-A8-A07L-10A-01D-A012-01 | Affymetrix SNP 6.0 | (TODO) -- GDC | CNV__snp6 |
| TCGA-A8-A07O-10A-01D-A012-01 | Affymetrix SNP 6.0 | (TODO) -- GDC | CNV__unfiltered__snp6 |
| TCGA-A8-A07O-10A-01D-A012-01 | Affymetrix SNP 6.0 | (TODO) -- GDC | CNV__snp6 |
| TCGA-A8-A07P-10A-01D-A012-01 | Affymetrix SNP 6.0 | (TODO) -- GDC | CNV__unfiltered__snp6 |
| TCGA-A8-A07P-10A-01D-A012-01 | Affymetrix SNP 6.0 | (TODO) -- GDC | CNV__snp6 |
| TCGA-A8-A07R-10B-01D-A037-01 | Affymetrix SNP 6.0 | (TODO) -- GDC | CNV__unfiltered__snp6 |
| TCGA-A8-A07R-10B-01D-A037-01 | Affymetrix SNP 6.0 | (TODO) -- GDC | CNV__snp6 |
| TCGA-A8-A07U-10A-01D-A037-01 | Affymetrix SNP 6.0 | (TODO) -- GDC | CNV__unfiltered__snp6 |
| TCGA-A8-A07U-10A-01D-A037-01 | Affymetrix SNP 6.0 | (TODO) -- GDC | CNV__snp6 |
| TCGA-A8-A07W-10A-01D-A012-01 | Affymetrix SNP 6.0 | (TODO) -- GDC | CNV__unfiltered__snp6 |
| TCGA-A8-A07W-10A-01D-A012-01 | Affymetrix SNP 6.0 | (TODO) -- GDC | CNV__snp6 |
| TCGA-A8-A07Z-10A-01D-A012-01 | Affymetrix SNP 6.0 | (TODO) -- GDC | CNV__unfiltered__snp6 |
| TCGA-A8-A07Z-10A-01D-A012-01 | Affymetrix SNP 6.0 | (TODO) -- GDC | CNV__snp6 |
| TCGA-A8-A081-10A-01D-A012-01 | Affymetrix SNP 6.0 | (TODO) -- GDC | CNV__unfiltered__snp6 |
| TCGA-A8-A081-10A-01D-A012-01 | Affymetrix SNP 6.0 | (TODO) -- GDC | CNV__snp6 |
| TCGA-A8-A082-10A-01D-A012-01 | Affymetrix SNP 6.0 | (TODO) -- GDC | CNV__unfiltered__snp6 |
| TCGA-A8-A082-10A-01D-A012-01 | Affymetrix SNP 6.0 | (TODO) -- GDC | CNV__snp6 |
| TCGA-A8-A083-10A-01D-A012-01 | Affymetrix SNP 6.0 | (TODO) -- GDC | CNV__unfiltered__snp6 |
| TCGA-A8-A083-10A-01D-A012-01 | Affymetrix SNP 6.0 | (TODO) -- GDC | CNV__snp6 |
| TCGA-A8-A084-10A-01D-A012-01 | Affymetrix SNP 6.0 | (TODO) -- GDC | CNV__unfiltered__snp6 |
| TCGA-A8-A084-10A-01D-A012-01 | Affymetrix SNP 6.0 | (TODO) -- GDC | CNV__snp6 |
| TCGA-A8-A085-10A-01D-A012-01 | Affymetrix SNP 6.0 | (TODO) -- GDC | CNV__unfiltered__snp6 |
| TCGA-A8-A085-10A-01D-A012-01 | Affymetrix SNP 6.0 | (TODO) -- GDC | CNV__snp6 |
| TCGA-A8-A086-10A-01D-A012-01 | Affymetrix SNP 6.0 | (TODO) -- GDC | CNV__unfiltered__snp6 |
| TCGA-A8-A086-10A-01D-A012-01 | Affymetrix SNP 6.0 | (TODO) -- GDC | CNV__snp6 |
| TCGA-A8-A08A-10A-01D-A012-01 | Affymetrix SNP 6.0 | (TODO) -- GDC | CNV__unfiltered__snp6 |
| TCGA-A8-A08A-10A-01D-A012-01 | Affymetrix SNP 6.0 | (TODO) -- GDC | CNV__snp6 |
| TCGA-A8-A08B-10A-01D-A012-01 | Affymetrix SNP 6.0 | (TODO) -- GDC | CNV__unfiltered__snp6 |
| TCGA-A8-A08B-10A-01D-A012-01 | Affymetrix SNP 6.0 | (TODO) -- GDC | CNV__snp6 |
| TCGA-A8-A08C-10A-01D-A012-01 | Affymetrix SNP 6.0 | (TODO) -- GDC | CNV__unfiltered__snp6 |
| TCGA-A8-A08C-10A-01D-A012-01 | Affymetrix SNP 6.0 | (TODO) -- GDC | CNV__snp6 |
| TCGA-A8-A08F-10A-01D-A012-01 | Affymetrix SNP 6.0 | (TODO) -- GDC | CNV__unfiltered__snp6 |
| TCGA-A8-A08F-10A-01D-A012-01 | Affymetrix SNP 6.0 | (TODO) -- GDC | CNV__snp6 |
| TCGA-A8-A08G-10A-01D-A012-01 | Affymetrix SNP 6.0 | (TODO) -- GDC | CNV__unfiltered__snp6 |
| TCGA-A8-A08G-10A-01D-A012-01 | Affymetrix SNP 6.0 | (TODO) -- GDC | CNV__snp6 |
| TCGA-A8-A08H-10A-01D-A012-01 | Affymetrix SNP 6.0 | (TODO) -- GDC | CNV__unfiltered__snp6 |
| TCGA-A8-A08H-10A-01D-A012-01 | Affymetrix SNP 6.0 | (TODO) -- GDC | CNV__snp6 |
| TCGA-A8-A08I-10A-01D-A012-01 | Affymetrix SNP 6.0 | (TODO) -- GDC | CNV__unfiltered__snp6 |
| TCGA-A8-A08I-10A-01D-A012-01 | Affymetrix SNP 6.0 | (TODO) -- GDC | CNV__snp6 |
| TCGA-A8-A08J-10A-01D-A012-01 | Affymetrix SNP 6.0 | (TODO) -- GDC | CNV__unfiltered__snp6 |
| TCGA-A8-A08J-10A-01D-A012-01 | Affymetrix SNP 6.0 | (TODO) -- GDC | CNV__snp6 |
| TCGA-A8-A08L-10A-01D-A012-01 | Affymetrix SNP 6.0 | (TODO) -- GDC | CNV__unfiltered__snp6 |
| TCGA-A8-A08L-10A-01D-A012-01 | Affymetrix SNP 6.0 | (TODO) -- GDC | CNV__snp6 |
| TCGA-A8-A08O-10A-01D-A059-01 | Affymetrix SNP 6.0 | (TODO) -- GDC | CNV__unfiltered__snp6 |
| TCGA-A8-A08O-10A-01D-A059-01 | Affymetrix SNP 6.0 | (TODO) -- GDC | CNV__snp6 |
| TCGA-A8-A08P-10A-01D-A012-01 | Affymetrix SNP 6.0 | (TODO) -- GDC | CNV__unfiltered__snp6 |
| TCGA-A8-A08P-10A-01D-A012-01 | Affymetrix SNP 6.0 | (TODO) -- GDC | CNV__snp6 |
| TCGA-A8-A08R-10A-01D-A037-01 | Affymetrix SNP 6.0 | (TODO) -- GDC | CNV__unfiltered__snp6 |
| TCGA-A8-A08R-10A-01D-A037-01 | Affymetrix SNP 6.0 | (TODO) -- GDC | CNV__snp6 |
| TCGA-A8-A08S-10A-01D-A037-01 | Affymetrix SNP 6.0 | (TODO) -- GDC | CNV__unfiltered__snp6 |
| TCGA-A8-A08S-10A-01D-A037-01 | Affymetrix SNP 6.0 | (TODO) -- GDC | CNV__snp6 |
| TCGA-A8-A08T-10A-01D-A012-01 | Affymetrix SNP 6.0 | (TODO) -- GDC | CNV__unfiltered__snp6 |
| TCGA-A8-A08T-10A-01D-A012-01 | Affymetrix SNP 6.0 | (TODO) -- GDC | CNV__snp6 |
| TCGA-A8-A08X-10A-01D-A012-01 | Affymetrix SNP 6.0 | (TODO) -- GDC | CNV__unfiltered__snp6 |
| TCGA-A8-A08X-10A-01D-A012-01 | Affymetrix SNP 6.0 | (TODO) -- GDC | CNV__snp6 |
| TCGA-A8-A08Z-10A-01D-A012-01 | Affymetrix SNP 6.0 | (TODO) -- GDC | CNV__unfiltered__snp6 |
| TCGA-A8-A08Z-10A-01D-A012-01 | Affymetrix SNP 6.0 | (TODO) -- GDC | CNV__snp6 |
| TCGA-A8-A090-10A-01D-A012-01 | Affymetrix SNP 6.0 | (TODO) -- GDC | CNV__unfiltered__snp6 |
| TCGA-A8-A090-10A-01D-A012-01 | Affymetrix SNP 6.0 | (TODO) -- GDC | CNV__snp6 |
| TCGA-A8-A091-10A-01D-A012-01 | Affymetrix SNP 6.0 | (TODO) -- GDC | CNV__unfiltered__snp6 |
| TCGA-A8-A091-10A-01D-A012-01 | Affymetrix SNP 6.0 | (TODO) -- GDC | CNV__snp6 |
| TCGA-A8-A092-10A-01D-A012-01 | Affymetrix SNP 6.0 | (TODO) -- GDC | CNV__unfiltered__snp6 |
| TCGA-A8-A092-10A-01D-A012-01 | Affymetrix SNP 6.0 | (TODO) -- GDC | CNV__snp6 |
| TCGA-A8-A093-10A-01D-A012-01 | Affymetrix SNP 6.0 | (TODO) -- GDC | CNV__unfiltered__snp6 |
| TCGA-A8-A093-10A-01D-A012-01 | Affymetrix SNP 6.0 | (TODO) -- GDC | CNV__snp6 |
| TCGA-A8-A094-10A-01D-A012-01 | Affymetrix SNP 6.0 | (TODO) -- GDC | CNV__unfiltered__snp6 |
| TCGA-A8-A094-10A-01D-A012-01 | Affymetrix SNP 6.0 | (TODO) -- GDC | CNV__snp6 |
| TCGA-A8-A095-10A-01D-A012-01 | Affymetrix SNP 6.0 | (TODO) -- GDC | CNV__unfiltered__snp6 |
| TCGA-A8-A095-10A-01D-A012-01 | Affymetrix SNP 6.0 | (TODO) -- GDC | CNV__snp6 |
| TCGA-A8-A096-10A-01D-A012-01 | Affymetrix SNP 6.0 | (TODO) -- GDC | CNV__unfiltered__snp6 |
| TCGA-A8-A096-10A-01D-A012-01 | Affymetrix SNP 6.0 | (TODO) -- GDC | CNV__snp6 |
| TCGA-A8-A097-10A-01D-A037-01 | Affymetrix SNP 6.0 | (TODO) -- GDC | CNV__unfiltered__snp6 |
| TCGA-A8-A097-10A-01D-A037-01 | Affymetrix SNP 6.0 | (TODO) -- GDC | CNV__snp6 |
| TCGA-A8-A099-10A-01D-A012-01 | Affymetrix SNP 6.0 | (TODO) -- GDC | CNV__unfiltered__snp6 |
| TCGA-A8-A099-10A-01D-A012-01 | Affymetrix SNP 6.0 | (TODO) -- GDC | CNV__snp6 |
| TCGA-A8-A09A-10A-01D-A012-01 | Affymetrix SNP 6.0 | (TODO) -- GDC | CNV__unfiltered__snp6 |
| TCGA-A8-A09A-10A-01D-A012-01 | Affymetrix SNP 6.0 | (TODO) -- GDC | CNV__snp6 |
| TCGA-A8-A09B-10A-01D-A012-01 | Affymetrix SNP 6.0 | (TODO) -- GDC | CNV__unfiltered__snp6 |
| TCGA-A8-A09B-10A-01D-A012-01 | Affymetrix SNP 6.0 | (TODO) -- GDC | CNV__snp6 |
| TCGA-A8-A09C-10A-01D-A012-01 | Affymetrix SNP 6.0 | (TODO) -- GDC | CNV__unfiltered__snp6 |
| TCGA-A8-A09C-10A-01D-A012-01 | Affymetrix SNP 6.0 | (TODO) -- GDC | CNV__snp6 |
| TCGA-A8-A09D-10A-01D-A012-01 | Affymetrix SNP 6.0 | (TODO) -- GDC | CNV__unfiltered__snp6 |
| TCGA-A8-A09D-10A-01D-A012-01 | Affymetrix SNP 6.0 | (TODO) -- GDC | CNV__snp6 |
| TCGA-A8-A09E-10A-01D-A012-01 | Affymetrix SNP 6.0 | (TODO) -- GDC | CNV__unfiltered__snp6 |
| TCGA-A8-A09E-10A-01D-A012-01 | Affymetrix SNP 6.0 | (TODO) -- GDC | CNV__snp6 |
| TCGA-A8-A09G-10A-01D-A012-01 | Affymetrix SNP 6.0 | (TODO) -- GDC | CNV__unfiltered__snp6 |
| TCGA-A8-A09G-10A-01D-A012-01 | Affymetrix SNP 6.0 | (TODO) -- GDC | CNV__snp6 |
| TCGA-A8-A09I-10A-01D-A037-01 | Affymetrix SNP 6.0 | (TODO) -- GDC | CNV__unfiltered__snp6 |
| TCGA-A8-A09I-10A-01D-A037-01 | Affymetrix SNP 6.0 | (TODO) -- GDC | CNV__snp6 |
| TCGA-A8-A09K-10A-01D-A012-01 | Affymetrix SNP 6.0 | (TODO) -- GDC | CNV__unfiltered__snp6 |
| TCGA-A8-A09K-10A-01D-A012-01 | Affymetrix SNP 6.0 | (TODO) -- GDC | CNV__snp6 |
| TCGA-A8-A09M-10A-01D-A012-01 | Affymetrix SNP 6.0 | (TODO) -- GDC | CNV__unfiltered__snp6 |
| TCGA-A8-A09M-10A-01D-A012-01 | Affymetrix SNP 6.0 | (TODO) -- GDC | CNV__snp6 |
| TCGA-A8-A09N-10A-01D-A012-01 | Affymetrix SNP 6.0 | (TODO) -- GDC | CNV__unfiltered__snp6 |
| TCGA-A8-A09N-10A-01D-A012-01 | Affymetrix SNP 6.0 | (TODO) -- GDC | CNV__snp6 |
| TCGA-A8-A09Q-10A-01D-A012-01 | Affymetrix SNP 6.0 | (TODO) -- GDC | CNV__unfiltered__snp6 |
| TCGA-A8-A09Q-10A-01D-A012-01 | Affymetrix SNP 6.0 | (TODO) -- GDC | CNV__snp6 |
| TCGA-A8-A09R-10A-01D-A012-01 | Affymetrix SNP 6.0 | (TODO) -- GDC | CNV__unfiltered__snp6 |
| TCGA-A8-A09R-10A-01D-A012-01 | Affymetrix SNP 6.0 | (TODO) -- GDC | CNV__snp6 |
| TCGA-A8-A09T-10A-01D-A012-01 | Affymetrix SNP 6.0 | (TODO) -- GDC | CNV__unfiltered__snp6 |
| TCGA-A8-A09T-10A-01D-A012-01 | Affymetrix SNP 6.0 | (TODO) -- GDC | CNV__snp6 |
| TCGA-A8-A09V-10A-01D-A037-01 | Affymetrix SNP 6.0 | (TODO) -- GDC | CNV__unfiltered__snp6 |
| TCGA-A8-A09V-10A-01D-A037-01 | Affymetrix SNP 6.0 | (TODO) -- GDC | CNV__snp6 |
| TCGA-A8-A09W-10A-01D-A012-01 | Affymetrix SNP 6.0 | (TODO) -- GDC | CNV__unfiltered__snp6 |
| TCGA-A8-A09W-10A-01D-A012-01 | Affymetrix SNP 6.0 | (TODO) -- GDC | CNV__snp6 |
| TCGA-A8-A09X-10A-01D-A012-01 | Affymetrix SNP 6.0 | (TODO) -- GDC | CNV__unfiltered__snp6 |
| TCGA-A8-A09X-10A-01D-A012-01 | Affymetrix SNP 6.0 | (TODO) -- GDC | CNV__snp6 |
| TCGA-A8-A09Z-10A-01D-A012-01 | Affymetrix SNP 6.0 | (TODO) -- GDC | CNV__unfiltered__snp6 |
| TCGA-A8-A09Z-10A-01D-A012-01 | Affymetrix SNP 6.0 | (TODO) -- GDC | CNV__snp6 |
| TCGA-A8-A0A1-10A-01D-A012-01 | Affymetrix SNP 6.0 | (TODO) -- GDC | CNV__unfiltered__snp6 |
| TCGA-A8-A0A1-10A-01D-A012-01 | Affymetrix SNP 6.0 | (TODO) -- GDC | CNV__snp6 |
| TCGA-A8-A0A2-10A-01D-A037-01 | Affymetrix SNP 6.0 | (TODO) -- GDC | CNV__unfiltered__snp6 |
| TCGA-A8-A0A2-10A-01D-A037-01 | Affymetrix SNP 6.0 | (TODO) -- GDC | CNV__snp6 |
| TCGA-A8-A0A4-10A-01D-A012-01 | Affymetrix SNP 6.0 | (TODO) -- GDC | CNV__unfiltered__snp6 |
| TCGA-A8-A0A4-10A-01D-A012-01 | Affymetrix SNP 6.0 | (TODO) -- GDC | CNV__snp6 |
| TCGA-A8-A0A6-10A-01D-A059-01 | Affymetrix SNP 6.0 | (TODO) -- GDC | CNV__unfiltered__snp6 |
| TCGA-A8-A0A6-10A-01D-A059-01 | Affymetrix SNP 6.0 | (TODO) -- GDC | CNV__snp6 |
| TCGA-A8-A0A7-10A-01D-A012-01 | Affymetrix SNP 6.0 | (TODO) -- GDC | CNV__unfiltered__snp6 |
| TCGA-A8-A0A7-10A-01D-A012-01 | Affymetrix SNP 6.0 | (TODO) -- GDC | CNV__snp6 |
| TCGA-A8-A0A9-10A-01D-A012-01 | Affymetrix SNP 6.0 | (TODO) -- GDC | CNV__unfiltered__snp6 |
| TCGA-A8-A0A9-10A-01D-A012-01 | Affymetrix SNP 6.0 | (TODO) -- GDC | CNV__snp6 |
| TCGA-A8-A0AB-10A-01D-A037-01 | Affymetrix SNP 6.0 | (TODO) -- GDC | CNV__unfiltered__snp6 |
| TCGA-A8-A0AB-10A-01D-A037-01 | Affymetrix SNP 6.0 | (TODO) -- GDC | CNV__snp6 |
| TCGA-A8-A0AD-10A-01D-A059-01 | Affymetrix SNP 6.0 | (TODO) -- GDC | CNV__unfiltered__snp6 |
| TCGA-A8-A0AD-10A-01D-A059-01 | Affymetrix SNP 6.0 | (TODO) -- GDC | CNV__snp6 |
| TCGA-AC-A23C-10A-01D-A166-01 | Affymetrix SNP 6.0 | (TODO) -- GDC | CNV__unfiltered__snp6 |
| TCGA-AC-A23C-10A-01D-A166-01 | Affymetrix SNP 6.0 | (TODO) -- GDC | CNV__snp6 |
| TCGA-AC-A23E-10A-01D-A160-01 | Affymetrix SNP 6.0 | (TODO) -- GDC | CNV__unfiltered__snp6 |
| TCGA-AC-A23E-10A-01D-A160-01 | Affymetrix SNP 6.0 | (TODO) -- GDC | CNV__snp6 |
| TCGA-AC-A2B8-10A-01D-A17C-01 | Affymetrix SNP 6.0 | (TODO) -- GDC | CNV__unfiltered__snp6 |
| TCGA-AC-A2B8-10A-01D-A17C-01 | Affymetrix SNP 6.0 | (TODO) -- GDC | CNV__snp6 |
| TCGA-AC-A2QH-10A-01D-A18N-01 | Affymetrix SNP 6.0 | (TODO) -- GDC | CNV__unfiltered__snp6 |
| TCGA-AC-A2QH-10A-01D-A18N-01 | Affymetrix SNP 6.0 | (TODO) -- GDC | CNV__snp6 |
| TCGA-AC-A2QI-10A-01D-A19X-01 | Affymetrix SNP 6.0 | (TODO) -- GDC | CNV__unfiltered__snp6 |
| TCGA-AC-A2QI-10A-01D-A19X-01 | Affymetrix SNP 6.0 | (TODO) -- GDC | CNV__snp6 |
| TCGA-AC-A3BB-10A-01D-A19X-01 | Affymetrix SNP 6.0 | (TODO) -- GDC | CNV__unfiltered__snp6 |
| TCGA-AC-A3BB-10A-01D-A19X-01 | Affymetrix SNP 6.0 | (TODO) -- GDC | CNV__snp6 |
| TCGA-AC-A3HN-10A-01D-A20R-01 | Affymetrix SNP 6.0 | (TODO) -- GDC | CNV__unfiltered__snp6 |
| TCGA-AC-A3HN-10A-01D-A20R-01 | Affymetrix SNP 6.0 | (TODO) -- GDC | CNV__snp6 |
| TCGA-AC-A3OD-10A-01D-A21P-01 | Affymetrix SNP 6.0 | (TODO) -- GDC | CNV__unfiltered__snp6 |
| TCGA-AC-A3OD-10A-01D-A21P-01 | Affymetrix SNP 6.0 | (TODO) -- GDC | CNV__snp6 |
| TCGA-AC-A3QP-10B-01D-A22W-01 | Affymetrix SNP 6.0 | (TODO) -- GDC | CNV__unfiltered__snp6 |
| TCGA-AC-A3QP-10B-01D-A22W-01 | Affymetrix SNP 6.0 | (TODO) -- GDC | CNV__snp6 |
| TCGA-AC-A3QQ-10A-01D-A229-01 | Affymetrix SNP 6.0 | (TODO) -- GDC | CNV__unfiltered__snp6 |
| TCGA-AC-A3QQ-10A-01D-A229-01 | Affymetrix SNP 6.0 | (TODO) -- GDC | CNV__snp6 |
| TCGA-AC-A3TM-10A-01D-A229-01 | Affymetrix SNP 6.0 | (TODO) -- GDC | CNV__unfiltered__snp6 |
| TCGA-AC-A3TM-10A-01D-A229-01 | Affymetrix SNP 6.0 | (TODO) -- GDC | CNV__snp6 |
| TCGA-AC-A3TN-10A-01D-A229-01 | Affymetrix SNP 6.0 | (TODO) -- GDC | CNV__unfiltered__snp6 |
| TCGA-AC-A3TN-10A-01D-A229-01 | Affymetrix SNP 6.0 | (TODO) -- GDC | CNV__snp6 |
| TCGA-AC-A3W5-10A-01D-A229-01 | Affymetrix SNP 6.0 | (TODO) -- GDC | CNV__unfiltered__snp6 |
| TCGA-AC-A3W5-10A-01D-A229-01 | Affymetrix SNP 6.0 | (TODO) -- GDC | CNV__snp6 |
| TCGA-AC-A3W6-10A-01D-A229-01 | Affymetrix SNP 6.0 | (TODO) -- GDC | CNV__unfiltered__snp6 |
| TCGA-AC-A3W6-10A-01D-A229-01 | Affymetrix SNP 6.0 | (TODO) -- GDC | CNV__snp6 |
| TCGA-AC-A3W7-10A-01D-A229-01 | Affymetrix SNP 6.0 | (TODO) -- GDC | CNV__unfiltered__snp6 |
| TCGA-AC-A3W7-10A-01D-A229-01 | Affymetrix SNP 6.0 | (TODO) -- GDC | CNV__snp6 |
| TCGA-AC-A3YI-10A-01D-A238-01 | Affymetrix SNP 6.0 | (TODO) -- GDC | CNV__unfiltered__snp6 |
| TCGA-AC-A3YI-10A-01D-A238-01 | Affymetrix SNP 6.0 | (TODO) -- GDC | CNV__snp6 |
| TCGA-AC-A3YJ-10A-01D-A22W-01 | Affymetrix SNP 6.0 | (TODO) -- GDC | CNV__unfiltered__snp6 |
| TCGA-AC-A3YJ-10A-01D-A22W-01 | Affymetrix SNP 6.0 | (TODO) -- GDC | CNV__snp6 |
| TCGA-AC-A4ZE-10B-01D-A41E-01 | Affymetrix SNP 6.0 | (TODO) -- GDC | CNV__unfiltered__snp6 |
| TCGA-AC-A4ZE-10B-01D-A41E-01 | Affymetrix SNP 6.0 | (TODO) -- GDC | CNV__snp6 |
| TCGA-AC-A5EH-10A-01D-A28D-01 | Affymetrix SNP 6.0 | (TODO) -- GDC | CNV__unfiltered__snp6 |
| TCGA-AC-A5EH-10A-01D-A28D-01 | Affymetrix SNP 6.0 | (TODO) -- GDC | CNV__snp6 |
| TCGA-AC-A5EI-10A-01D-A27O-01 | Affymetrix SNP 6.0 | (TODO) -- GDC | CNV__unfiltered__snp6 |
| TCGA-AC-A5EI-10A-01D-A27O-01 | Affymetrix SNP 6.0 | (TODO) -- GDC | CNV__snp6 |
| TCGA-AC-A5XS-10A-01D-A29M-01 | Affymetrix SNP 6.0 | (TODO) -- GDC | CNV__unfiltered__snp6 |
| TCGA-AC-A5XS-10A-01D-A29M-01 | Affymetrix SNP 6.0 | (TODO) -- GDC | CNV__snp6 |
| TCGA-AC-A5XU-10A-01D-A28D-01 | Affymetrix SNP 6.0 | (TODO) -- GDC | CNV__unfiltered__snp6 |
| TCGA-AC-A5XU-10A-01D-A28D-01 | Affymetrix SNP 6.0 | (TODO) -- GDC | CNV__snp6 |
| TCGA-AC-A62V-10A-01D-A31T-01 | Affymetrix SNP 6.0 | (TODO) -- GDC | CNV__unfiltered__snp6 |
| TCGA-AC-A62V-10A-01D-A31T-01 | Affymetrix SNP 6.0 | (TODO) -- GDC | CNV__snp6 |
| TCGA-AC-A62X-10A-01D-A29M-01 | Affymetrix SNP 6.0 | (TODO) -- GDC | CNV__unfiltered__snp6 |
| TCGA-AC-A62X-10A-01D-A29M-01 | Affymetrix SNP 6.0 | (TODO) -- GDC | CNV__snp6 |
| TCGA-AC-A62Y-10A-01D-A29M-01 | Affymetrix SNP 6.0 | (TODO) -- GDC | CNV__unfiltered__snp6 |
| TCGA-AC-A62Y-10A-01D-A29M-01 | Affymetrix SNP 6.0 | (TODO) -- GDC | CNV__snp6 |
| TCGA-AC-A6IV-10A-01D-A33G-01 | Affymetrix SNP 6.0 | (TODO) -- GDC | CNV__unfiltered__snp6 |
| TCGA-AC-A6IV-10A-01D-A33G-01 | Affymetrix SNP 6.0 | (TODO) -- GDC | CNV__snp6 |
| TCGA-AC-A6IW-10A-01D-A33G-01 | Affymetrix SNP 6.0 | (TODO) -- GDC | CNV__unfiltered__snp6 |
| TCGA-AC-A6IW-10A-01D-A33G-01 | Affymetrix SNP 6.0 | (TODO) -- GDC | CNV__snp6 |
| TCGA-AC-A6IX-10A-01D-A32H-01 | Affymetrix SNP 6.0 | (TODO) -- GDC | CNV__unfiltered__snp6 |
| TCGA-AC-A6IX-10A-01D-A32H-01 | Affymetrix SNP 6.0 | (TODO) -- GDC | CNV__snp6 |
| TCGA-AC-A6NO-10A-01D-A33G-01 | Affymetrix SNP 6.0 | (TODO) -- GDC | CNV__unfiltered__snp6 |
| TCGA-AC-A6NO-10A-01D-A33G-01 | Affymetrix SNP 6.0 | (TODO) -- GDC | CNV__snp6 |
| TCGA-AC-A7VB-10A-01D-A350-01 | Affymetrix SNP 6.0 | (TODO) -- GDC | CNV__unfiltered__snp6 |
| TCGA-AC-A7VB-10A-01D-A350-01 | Affymetrix SNP 6.0 | (TODO) -- GDC | CNV__snp6 |
| TCGA-AC-A7VC-10A-01D-A350-01 | Affymetrix SNP 6.0 | (TODO) -- GDC | CNV__unfiltered__snp6 |
| TCGA-AC-A7VC-10A-01D-A350-01 | Affymetrix SNP 6.0 | (TODO) -- GDC | CNV__snp6 |
| TCGA-AC-A8OP-10A-01D-A40C-01 | Affymetrix SNP 6.0 | (TODO) -- GDC | CNV__unfiltered__snp6 |
| TCGA-AC-A8OP-10A-01D-A40C-01 | Affymetrix SNP 6.0 | (TODO) -- GDC | CNV__snp6 |
| TCGA-AC-A8OQ-10A-01D-A41E-01 | Affymetrix SNP 6.0 | (TODO) -- GDC | CNV__unfiltered__snp6 |
| TCGA-AC-A8OQ-10A-01D-A41E-01 | Affymetrix SNP 6.0 | (TODO) -- GDC | CNV__snp6 |
| TCGA-AC-A8OR-10A-01D-A41E-01 | Affymetrix SNP 6.0 | (TODO) -- GDC | CNV__unfiltered__snp6 |
| TCGA-AC-A8OR-10A-01D-A41E-01 | Affymetrix SNP 6.0 | (TODO) -- GDC | CNV__snp6 |
| TCGA-AC-A8OS-10A-01D-A41E-01 | Affymetrix SNP 6.0 | (TODO) -- GDC | CNV__unfiltered__snp6 |
| TCGA-AC-A8OS-10A-01D-A41E-01 | Affymetrix SNP 6.0 | (TODO) -- GDC | CNV__snp6 |
| TCGA-AN-A03X-10A-01D-A012-01 | Affymetrix SNP 6.0 | (TODO) -- GDC | CNV__unfiltered__snp6 |
| TCGA-AN-A03X-10A-01D-A012-01 | Affymetrix SNP 6.0 | (TODO) -- GDC | CNV__snp6 |
| TCGA-AN-A03Y-10A-01D-A012-01 | Affymetrix SNP 6.0 | (TODO) -- GDC | CNV__unfiltered__snp6 |
| TCGA-AN-A03Y-10A-01D-A012-01 | Affymetrix SNP 6.0 | (TODO) -- GDC | CNV__snp6 |
| TCGA-AN-A041-10A-01D-A037-01 | Affymetrix SNP 6.0 | (TODO) -- GDC | CNV__unfiltered__snp6 |
| TCGA-AN-A041-10A-01D-A037-01 | Affymetrix SNP 6.0 | (TODO) -- GDC | CNV__snp6 |
| TCGA-AN-A046-10A-01D-A037-01 | Affymetrix SNP 6.0 | (TODO) -- GDC | CNV__unfiltered__snp6 |
| TCGA-AN-A046-10A-01D-A037-01 | Affymetrix SNP 6.0 | (TODO) -- GDC | CNV__snp6 |
| TCGA-AN-A049-10A-01D-A012-01 | Affymetrix SNP 6.0 | (TODO) -- GDC | CNV__unfiltered__snp6 |
| TCGA-AN-A049-10A-01D-A012-01 | Affymetrix SNP 6.0 | (TODO) -- GDC | CNV__snp6 |
| TCGA-AN-A04A-10A-01D-A037-01 | Affymetrix SNP 6.0 | (TODO) -- GDC | CNV__unfiltered__snp6 |
| TCGA-AN-A04A-10A-01D-A037-01 | Affymetrix SNP 6.0 | (TODO) -- GDC | CNV__snp6 |
| TCGA-AN-A04C-10A-01D-A037-01 | Affymetrix SNP 6.0 | (TODO) -- GDC | CNV__unfiltered__snp6 |
| TCGA-AN-A04C-10A-01D-A037-01 | Affymetrix SNP 6.0 | (TODO) -- GDC | CNV__snp6 |
| TCGA-AN-A04D-10A-01D-A037-01 | Affymetrix SNP 6.0 | (TODO) -- GDC | CNV__unfiltered__snp6 |
| TCGA-AN-A04D-10A-01D-A037-01 | Affymetrix SNP 6.0 | (TODO) -- GDC | CNV__snp6 |
| TCGA-AN-A0AJ-10A-01D-A012-01 | Affymetrix SNP 6.0 | (TODO) -- GDC | CNV__unfiltered__snp6 |
| TCGA-AN-A0AJ-10A-01D-A012-01 | Affymetrix SNP 6.0 | (TODO) -- GDC | CNV__snp6 |
| TCGA-AN-A0AK-10A-01D-A012-01 | Affymetrix SNP 6.0 | (TODO) -- GDC | CNV__unfiltered__snp6 |
| TCGA-AN-A0AK-10A-01D-A012-01 | Affymetrix SNP 6.0 | (TODO) -- GDC | CNV__snp6 |
| TCGA-AN-A0AL-10A-01D-A012-01 | Affymetrix SNP 6.0 | (TODO) -- GDC | CNV__unfiltered__snp6 |
| TCGA-AN-A0AL-10A-01D-A012-01 | Affymetrix SNP 6.0 | (TODO) -- GDC | CNV__snp6 |
| TCGA-AN-A0AM-10A-01D-A037-01 | Affymetrix SNP 6.0 | (TODO) -- GDC | CNV__unfiltered__snp6 |
| TCGA-AN-A0AM-10A-01D-A037-01 | Affymetrix SNP 6.0 | (TODO) -- GDC | CNV__snp6 |
| TCGA-AN-A0AR-10A-01D-A012-01 | Affymetrix SNP 6.0 | (TODO) -- GDC | CNV__unfiltered__snp6 |
| TCGA-AN-A0AR-10A-01D-A012-01 | Affymetrix SNP 6.0 | (TODO) -- GDC | CNV__snp6 |
| TCGA-AN-A0AS-10A-01D-A012-01 | Affymetrix SNP 6.0 | (TODO) -- GDC | CNV__unfiltered__snp6 |
| TCGA-AN-A0AS-10A-01D-A012-01 | Affymetrix SNP 6.0 | (TODO) -- GDC | CNV__snp6 |
| TCGA-AN-A0AT-10A-01D-A037-01 | Affymetrix SNP 6.0 | (TODO) -- GDC | CNV__unfiltered__snp6 |
| TCGA-AN-A0AT-10A-01D-A037-01 | Affymetrix SNP 6.0 | (TODO) -- GDC | CNV__snp6 |
| TCGA-AN-A0FD-10A-01D-A037-01 | Affymetrix SNP 6.0 | (TODO) -- GDC | CNV__unfiltered__snp6 |
| TCGA-AN-A0FD-10A-01D-A037-01 | Affymetrix SNP 6.0 | (TODO) -- GDC | CNV__snp6 |
| TCGA-AN-A0FF-10A-01D-A037-01 | Affymetrix SNP 6.0 | (TODO) -- GDC | CNV__unfiltered__snp6 |
| TCGA-AN-A0FF-10A-01D-A037-01 | Affymetrix SNP 6.0 | (TODO) -- GDC | CNV__snp6 |
| TCGA-AN-A0FJ-10A-01D-A012-01 | Affymetrix SNP 6.0 | (TODO) -- GDC | CNV__unfiltered__snp6 |
| TCGA-AN-A0FJ-10A-01D-A012-01 | Affymetrix SNP 6.0 | (TODO) -- GDC | CNV__snp6 |
| TCGA-AN-A0FK-10A-01D-A037-01 | Affymetrix SNP 6.0 | (TODO) -- GDC | CNV__unfiltered__snp6 |
| TCGA-AN-A0FK-10A-01D-A037-01 | Affymetrix SNP 6.0 | (TODO) -- GDC | CNV__snp6 |
| TCGA-AN-A0FL-10A-01D-A037-01 | Affymetrix SNP 6.0 | (TODO) -- GDC | CNV__unfiltered__snp6 |
| TCGA-AN-A0FL-10A-01D-A037-01 | Affymetrix SNP 6.0 | (TODO) -- GDC | CNV__snp6 |
| TCGA-AN-A0FN-10A-01D-A037-01 | Affymetrix SNP 6.0 | (TODO) -- GDC | CNV__unfiltered__snp6 |
| TCGA-AN-A0FN-10A-01D-A037-01 | Affymetrix SNP 6.0 | (TODO) -- GDC | CNV__snp6 |
| TCGA-AN-A0FS-10A-01D-A037-01 | Affymetrix SNP 6.0 | (TODO) -- GDC | CNV__unfiltered__snp6 |
| TCGA-AN-A0FS-10A-01D-A037-01 | Affymetrix SNP 6.0 | (TODO) -- GDC | CNV__snp6 |
| TCGA-AN-A0FT-10A-01D-A037-01 | Affymetrix SNP 6.0 | (TODO) -- GDC | CNV__unfiltered__snp6 |
| TCGA-AN-A0FT-10A-01D-A037-01 | Affymetrix SNP 6.0 | (TODO) -- GDC | CNV__snp6 |
| TCGA-AN-A0FV-10A-01D-A012-01 | Affymetrix SNP 6.0 | (TODO) -- GDC | CNV__unfiltered__snp6 |
| TCGA-AN-A0FV-10A-01D-A012-01 | Affymetrix SNP 6.0 | (TODO) -- GDC | CNV__snp6 |
| TCGA-AN-A0FW-10A-01D-A037-01 | Affymetrix SNP 6.0 | (TODO) -- GDC | CNV__unfiltered__snp6 |
| TCGA-AN-A0FW-10A-01D-A037-01 | Affymetrix SNP 6.0 | (TODO) -- GDC | CNV__snp6 |
| TCGA-AN-A0FX-10A-01D-A037-01 | Affymetrix SNP 6.0 | (TODO) -- GDC | CNV__unfiltered__snp6 |
| TCGA-AN-A0FX-10A-01D-A037-01 | Affymetrix SNP 6.0 | (TODO) -- GDC | CNV__snp6 |
| TCGA-AN-A0FY-10A-01D-A037-01 | Affymetrix SNP 6.0 | (TODO) -- GDC | CNV__unfiltered__snp6 |
| TCGA-AN-A0FY-10A-01D-A037-01 | Affymetrix SNP 6.0 | (TODO) -- GDC | CNV__snp6 |
| TCGA-AN-A0FZ-10A-01D-A037-01 | Affymetrix SNP 6.0 | (TODO) -- GDC | CNV__unfiltered__snp6 |
| TCGA-AN-A0FZ-10A-01D-A037-01 | Affymetrix SNP 6.0 | (TODO) -- GDC | CNV__snp6 |
| TCGA-AN-A0G0-10A-01D-A037-01 | Affymetrix SNP 6.0 | (TODO) -- GDC | CNV__unfiltered__snp6 |
| TCGA-AN-A0G0-10A-01D-A037-01 | Affymetrix SNP 6.0 | (TODO) -- GDC | CNV__snp6 |
| TCGA-AN-A0XL-10A-01D-A10L-01 | Affymetrix SNP 6.0 | (TODO) -- GDC | CNV__unfiltered__snp6 |
| TCGA-AN-A0XL-10A-01D-A10L-01 | Affymetrix SNP 6.0 | (TODO) -- GDC | CNV__snp6 |
| TCGA-AN-A0XN-10A-01D-A107-01 | Affymetrix SNP 6.0 | (TODO) -- GDC | CNV__unfiltered__snp6 |
| TCGA-AN-A0XN-10A-01D-A107-01 | Affymetrix SNP 6.0 | (TODO) -- GDC | CNV__snp6 |
| TCGA-AN-A0XO-10A-01D-A107-01 | Affymetrix SNP 6.0 | (TODO) -- GDC | CNV__unfiltered__snp6 |
| TCGA-AN-A0XO-10A-01D-A107-01 | Affymetrix SNP 6.0 | (TODO) -- GDC | CNV__snp6 |
| TCGA-AN-A0XP-10A-01D-A107-01 | Affymetrix SNP 6.0 | (TODO) -- GDC | CNV__unfiltered__snp6 |
| TCGA-AN-A0XP-10A-01D-A107-01 | Affymetrix SNP 6.0 | (TODO) -- GDC | CNV__snp6 |
| TCGA-AN-A0XR-10A-01D-A107-01 | Affymetrix SNP 6.0 | (TODO) -- GDC | CNV__unfiltered__snp6 |
| TCGA-AN-A0XR-10A-01D-A107-01 | Affymetrix SNP 6.0 | (TODO) -- GDC | CNV__snp6 |
| TCGA-AN-A0XS-10A-01D-A107-01 | Affymetrix SNP 6.0 | (TODO) -- GDC | CNV__unfiltered__snp6 |
| TCGA-AN-A0XS-10A-01D-A107-01 | Affymetrix SNP 6.0 | (TODO) -- GDC | CNV__snp6 |
| TCGA-AN-A0XT-10A-01D-A107-01 | Affymetrix SNP 6.0 | (TODO) -- GDC | CNV__unfiltered__snp6 |
| TCGA-AN-A0XT-10A-01D-A107-01 | Affymetrix SNP 6.0 | (TODO) -- GDC | CNV__snp6 |
| TCGA-AN-A0XU-10A-01D-A107-01 | Affymetrix SNP 6.0 | (TODO) -- GDC | CNV__unfiltered__snp6 |
| TCGA-AN-A0XU-10A-01D-A107-01 | Affymetrix SNP 6.0 | (TODO) -- GDC | CNV__snp6 |
| TCGA-AN-A0XV-10A-01D-A107-01 | Affymetrix SNP 6.0 | (TODO) -- GDC | CNV__unfiltered__snp6 |
| TCGA-AN-A0XV-10A-01D-A107-01 | Affymetrix SNP 6.0 | (TODO) -- GDC | CNV__snp6 |
| TCGA-AO-A03L-10A-01D-A059-01 | Affymetrix SNP 6.0 | (TODO) -- GDC | CNV__unfiltered__snp6 |
| TCGA-AO-A03L-10A-01D-A059-01 | Affymetrix SNP 6.0 | (TODO) -- GDC | CNV__snp6 |
| TCGA-AO-A03M-10A-01D-A10L-01 | Affymetrix SNP 6.0 | (TODO) -- GDC | CNV__unfiltered__snp6 |
| TCGA-AO-A03M-10A-01D-A10L-01 | Affymetrix SNP 6.0 | (TODO) -- GDC | CNV__snp6 |
| TCGA-AO-A03N-10A-01D-A10L-01 | Affymetrix SNP 6.0 | (TODO) -- GDC | CNV__unfiltered__snp6 |
| TCGA-AO-A03N-10A-01D-A10L-01 | Affymetrix SNP 6.0 | (TODO) -- GDC | CNV__snp6 |
| TCGA-AO-A03O-10A-01D-A012-01 | Affymetrix SNP 6.0 | (TODO) -- GDC | CNV__unfiltered__snp6 |
| TCGA-AO-A03O-10A-01D-A012-01 | Affymetrix SNP 6.0 | (TODO) -- GDC | CNV__snp6 |
| TCGA-AO-A03P-10A-01D-A012-01 | Affymetrix SNP 6.0 | (TODO) -- GDC | CNV__unfiltered__snp6 |
| TCGA-AO-A03P-10A-01D-A012-01 | Affymetrix SNP 6.0 | (TODO) -- GDC | CNV__snp6 |
| TCGA-AO-A03R-10A-01D-A037-01 | Affymetrix SNP 6.0 | (TODO) -- GDC | CNV__unfiltered__snp6 |
| TCGA-AO-A03R-10A-01D-A037-01 | Affymetrix SNP 6.0 | (TODO) -- GDC | CNV__snp6 |
| TCGA-AO-A03T-10A-01D-A037-01 | Affymetrix SNP 6.0 | (TODO) -- GDC | CNV__unfiltered__snp6 |
| TCGA-AO-A03T-10A-01D-A037-01 | Affymetrix SNP 6.0 | (TODO) -- GDC | CNV__snp6 |
| TCGA-AO-A03U-10A-01D-A10L-01 | Affymetrix SNP 6.0 | (TODO) -- GDC | CNV__unfiltered__snp6 |
| TCGA-AO-A03U-10A-01D-A10L-01 | Affymetrix SNP 6.0 | (TODO) -- GDC | CNV__snp6 |
| TCGA-AO-A03V-10A-01D-A113-01 | Affymetrix SNP 6.0 | (TODO) -- GDC | CNV__unfiltered__snp6 |
| TCGA-AO-A03V-10A-01D-A113-01 | Affymetrix SNP 6.0 | (TODO) -- GDC | CNV__snp6 |
| TCGA-AO-A0J2-10A-01D-A037-01 | Affymetrix SNP 6.0 | (TODO) -- GDC | CNV__unfiltered__snp6 |
| TCGA-AO-A0J2-10A-01D-A037-01 | Affymetrix SNP 6.0 | (TODO) -- GDC | CNV__snp6 |
| TCGA-AO-A0J3-10A-01D-A037-01 | Affymetrix SNP 6.0 | (TODO) -- GDC | CNV__unfiltered__snp6 |
| TCGA-AO-A0J3-10A-01D-A037-01 | Affymetrix SNP 6.0 | (TODO) -- GDC | CNV__snp6 |
| TCGA-AO-A0J4-10A-01D-A037-01 | Affymetrix SNP 6.0 | (TODO) -- GDC | CNV__unfiltered__snp6 |
| TCGA-AO-A0J4-10A-01D-A037-01 | Affymetrix SNP 6.0 | (TODO) -- GDC | CNV__snp6 |
| TCGA-AO-A0J5-10A-01D-A037-01 | Affymetrix SNP 6.0 | (TODO) -- GDC | CNV__unfiltered__snp6 |
| TCGA-AO-A0J5-10A-01D-A037-01 | Affymetrix SNP 6.0 | (TODO) -- GDC | CNV__snp6 |
| TCGA-AO-A0J6-10A-01D-A037-01 | Affymetrix SNP 6.0 | (TODO) -- GDC | CNV__unfiltered__snp6 |
| TCGA-AO-A0J6-10A-01D-A037-01 | Affymetrix SNP 6.0 | (TODO) -- GDC | CNV__snp6 |
| TCGA-AO-A0J7-10A-01D-A037-01 | Affymetrix SNP 6.0 | (TODO) -- GDC | CNV__unfiltered__snp6 |
| TCGA-AO-A0J7-10A-01D-A037-01 | Affymetrix SNP 6.0 | (TODO) -- GDC | CNV__snp6 |
| TCGA-AO-A0J8-10A-01D-A037-01 | Affymetrix SNP 6.0 | (TODO) -- GDC | CNV__unfiltered__snp6 |
| TCGA-AO-A0J8-10A-01D-A037-01 | Affymetrix SNP 6.0 | (TODO) -- GDC | CNV__snp6 |
| TCGA-AO-A0J9-10A-01D-A037-01 | Affymetrix SNP 6.0 | (TODO) -- GDC | CNV__unfiltered__snp6 |
| TCGA-AO-A0J9-10A-01D-A037-01 | Affymetrix SNP 6.0 | (TODO) -- GDC | CNV__snp6 |
| TCGA-AO-A0JA-10A-01D-A059-01 | Affymetrix SNP 6.0 | (TODO) -- GDC | CNV__unfiltered__snp6 |
| TCGA-AO-A0JA-10A-01D-A059-01 | Affymetrix SNP 6.0 | (TODO) -- GDC | CNV__snp6 |
| TCGA-AO-A0JB-10A-01D-A059-01 | Affymetrix SNP 6.0 | (TODO) -- GDC | CNV__unfiltered__snp6 |
| TCGA-AO-A0JB-10A-01D-A059-01 | Affymetrix SNP 6.0 | (TODO) -- GDC | CNV__snp6 |
| TCGA-AO-A0JC-10A-01D-A059-01 | Affymetrix SNP 6.0 | (TODO) -- GDC | CNV__unfiltered__snp6 |
| TCGA-AO-A0JC-10A-01D-A059-01 | Affymetrix SNP 6.0 | (TODO) -- GDC | CNV__snp6 |
| TCGA-AO-A0JD-10A-01D-A059-01 | Affymetrix SNP 6.0 | (TODO) -- GDC | CNV__unfiltered__snp6 |
| TCGA-AO-A0JD-10A-01D-A059-01 | Affymetrix SNP 6.0 | (TODO) -- GDC | CNV__snp6 |
| TCGA-AO-A0JE-10A-01D-A059-01 | Affymetrix SNP 6.0 | (TODO) -- GDC | CNV__unfiltered__snp6 |
| TCGA-AO-A0JE-10A-01D-A059-01 | Affymetrix SNP 6.0 | (TODO) -- GDC | CNV__snp6 |
| TCGA-AO-A0JF-10A-01D-A059-01 | Affymetrix SNP 6.0 | (TODO) -- GDC | CNV__unfiltered__snp6 |
| TCGA-AO-A0JF-10A-01D-A059-01 | Affymetrix SNP 6.0 | (TODO) -- GDC | CNV__snp6 |
| TCGA-AO-A0JG-10A-01D-A087-01 | Affymetrix SNP 6.0 | (TODO) -- GDC | CNV__unfiltered__snp6 |
| TCGA-AO-A0JG-10A-01D-A087-01 | Affymetrix SNP 6.0 | (TODO) -- GDC | CNV__snp6 |
| TCGA-AO-A0JI-10A-01D-A059-01 | Affymetrix SNP 6.0 | (TODO) -- GDC | CNV__unfiltered__snp6 |
| TCGA-AO-A0JI-10A-01D-A059-01 | Affymetrix SNP 6.0 | (TODO) -- GDC | CNV__snp6 |
| TCGA-AO-A0JJ-10A-01D-A059-01 | Affymetrix SNP 6.0 | (TODO) -- GDC | CNV__unfiltered__snp6 |
| TCGA-AO-A0JJ-10A-01D-A059-01 | Affymetrix SNP 6.0 | (TODO) -- GDC | CNV__snp6 |
| TCGA-AO-A0JL-10A-01D-A059-01 | Affymetrix SNP 6.0 | (TODO) -- GDC | CNV__unfiltered__snp6 |
| TCGA-AO-A0JL-10A-01D-A059-01 | Affymetrix SNP 6.0 | (TODO) -- GDC | CNV__snp6 |
| TCGA-AO-A0JM-10A-01D-A059-01 | Affymetrix SNP 6.0 | (TODO) -- GDC | CNV__unfiltered__snp6 |
| TCGA-AO-A0JM-10A-01D-A059-01 | Affymetrix SNP 6.0 | (TODO) -- GDC | CNV__snp6 |
| TCGA-AO-A124-10A-01D-A10L-01 | Affymetrix SNP 6.0 | (TODO) -- GDC | CNV__unfiltered__snp6 |
| TCGA-AO-A124-10A-01D-A10L-01 | Affymetrix SNP 6.0 | (TODO) -- GDC | CNV__snp6 |
| TCGA-AO-A125-10A-01D-A10L-01 | Affymetrix SNP 6.0 | (TODO) -- GDC | CNV__unfiltered__snp6 |
| TCGA-AO-A125-10A-01D-A10L-01 | Affymetrix SNP 6.0 | (TODO) -- GDC | CNV__snp6 |
| TCGA-AO-A126-10A-01D-A10L-01 | Affymetrix SNP 6.0 | (TODO) -- GDC | CNV__unfiltered__snp6 |
| TCGA-AO-A126-10A-01D-A10L-01 | Affymetrix SNP 6.0 | (TODO) -- GDC | CNV__snp6 |
| TCGA-AO-A128-10A-01D-A10L-01 | Affymetrix SNP 6.0 | (TODO) -- GDC | CNV__unfiltered__snp6 |
| TCGA-AO-A128-10A-01D-A10L-01 | Affymetrix SNP 6.0 | (TODO) -- GDC | CNV__snp6 |
| TCGA-AO-A129-10A-01D-A10L-01 | Affymetrix SNP 6.0 | (TODO) -- GDC | CNV__unfiltered__snp6 |
| TCGA-AO-A129-10A-01D-A10L-01 | Affymetrix SNP 6.0 | (TODO) -- GDC | CNV__snp6 |
| TCGA-AO-A12A-10A-01D-A113-01 | Affymetrix SNP 6.0 | (TODO) -- GDC | CNV__unfiltered__snp6 |
| TCGA-AO-A12A-10A-01D-A113-01 | Affymetrix SNP 6.0 | (TODO) -- GDC | CNV__snp6 |
| TCGA-AO-A12B-10A-01D-A10L-01 | Affymetrix SNP 6.0 | (TODO) -- GDC | CNV__unfiltered__snp6 |
| TCGA-AO-A12B-10A-01D-A10L-01 | Affymetrix SNP 6.0 | (TODO) -- GDC | CNV__snp6 |
| TCGA-AO-A12C-10A-01D-A10L-01 | Affymetrix SNP 6.0 | (TODO) -- GDC | CNV__unfiltered__snp6 |
| TCGA-AO-A12C-10A-01D-A10L-01 | Affymetrix SNP 6.0 | (TODO) -- GDC | CNV__snp6 |
| TCGA-AO-A12D-10A-01D-A113-01 | Affymetrix SNP 6.0 | (TODO) -- GDC | CNV__unfiltered__snp6 |
| TCGA-AO-A12D-10A-01D-A113-01 | Affymetrix SNP 6.0 | (TODO) -- GDC | CNV__snp6 |
| TCGA-AO-A12F-10A-01D-A113-01 | Affymetrix SNP 6.0 | (TODO) -- GDC | CNV__unfiltered__snp6 |
| TCGA-AO-A12F-10A-01D-A113-01 | Affymetrix SNP 6.0 | (TODO) -- GDC | CNV__snp6 |
| TCGA-AO-A12G-10A-01D-A10L-01 | Affymetrix SNP 6.0 | (TODO) -- GDC | CNV__unfiltered__snp6 |
| TCGA-AO-A12G-10A-01D-A10L-01 | Affymetrix SNP 6.0 | (TODO) -- GDC | CNV__snp6 |
| TCGA-AO-A12H-10A-01D-A113-01 | Affymetrix SNP 6.0 | (TODO) -- GDC | CNV__unfiltered__snp6 |
| TCGA-AO-A12H-10A-01D-A113-01 | Affymetrix SNP 6.0 | (TODO) -- GDC | CNV__snp6 |
| TCGA-AO-A1KO-10A-01D-A13N-01 | Affymetrix SNP 6.0 | (TODO) -- GDC | CNV__unfiltered__snp6 |
| TCGA-AO-A1KO-10A-01D-A13N-01 | Affymetrix SNP 6.0 | (TODO) -- GDC | CNV__snp6 |
| TCGA-AO-A1KP-10A-01D-A13N-01 | Affymetrix SNP 6.0 | (TODO) -- GDC | CNV__unfiltered__snp6 |
| TCGA-AO-A1KP-10A-01D-A13N-01 | Affymetrix SNP 6.0 | (TODO) -- GDC | CNV__snp6 |
| TCGA-AO-A1KR-10A-01D-A141-01 | Affymetrix SNP 6.0 | (TODO) -- GDC | CNV__unfiltered__snp6 |
| TCGA-AO-A1KR-10A-01D-A141-01 | Affymetrix SNP 6.0 | (TODO) -- GDC | CNV__snp6 |
| TCGA-AO-A1KS-10A-01D-A13N-01 | Affymetrix SNP 6.0 | (TODO) -- GDC | CNV__unfiltered__snp6 |
| TCGA-AO-A1KS-10A-01D-A13N-01 | Affymetrix SNP 6.0 | (TODO) -- GDC | CNV__snp6 |
| TCGA-AO-A1KT-10A-01D-A13N-01 | Affymetrix SNP 6.0 | (TODO) -- GDC | CNV__unfiltered__snp6 |
| TCGA-AO-A1KT-10A-01D-A13N-01 | Affymetrix SNP 6.0 | (TODO) -- GDC | CNV__snp6 |
| TCGA-AQ-A04H-10A-01D-A10L-01 | Affymetrix SNP 6.0 | (TODO) -- GDC | CNV__unfiltered__snp6 |
| TCGA-AQ-A04H-10A-01D-A10L-01 | Affymetrix SNP 6.0 | (TODO) -- GDC | CNV__snp6 |
| TCGA-AQ-A04J-10A-01D-A037-01 | Affymetrix SNP 6.0 | (TODO) -- GDC | CNV__unfiltered__snp6 |
| TCGA-AQ-A04J-10A-01D-A037-01 | Affymetrix SNP 6.0 | (TODO) -- GDC | CNV__snp6 |
| TCGA-AQ-A0Y5-10A-01D-A14J-01 | Affymetrix SNP 6.0 | (TODO) -- GDC | CNV__unfiltered__snp6 |
| TCGA-AQ-A0Y5-10A-01D-A14J-01 | Affymetrix SNP 6.0 | (TODO) -- GDC | CNV__snp6 |
| TCGA-AQ-A1H2-10A-01D-A13N-01 | Affymetrix SNP 6.0 | (TODO) -- GDC | CNV__unfiltered__snp6 |
| TCGA-AQ-A1H2-10A-01D-A13N-01 | Affymetrix SNP 6.0 | (TODO) -- GDC | CNV__snp6 |
| TCGA-AQ-A1H3-10A-01D-A13N-01 | Affymetrix SNP 6.0 | (TODO) -- GDC | CNV__unfiltered__snp6 |
| TCGA-AQ-A1H3-10A-01D-A13N-01 | Affymetrix SNP 6.0 | (TODO) -- GDC | CNV__snp6 |
| TCGA-AQ-A54N-10A-01D-A25N-01 | Affymetrix SNP 6.0 | (TODO) -- GDC | CNV__unfiltered__snp6 |
| TCGA-AQ-A54N-10A-01D-A25N-01 | Affymetrix SNP 6.0 | (TODO) -- GDC | CNV__snp6 |
| TCGA-AQ-A54O-10A-01D-A25N-01 | Affymetrix SNP 6.0 | (TODO) -- GDC | CNV__unfiltered__snp6 |
| TCGA-AQ-A54O-10A-01D-A25N-01 | Affymetrix SNP 6.0 | (TODO) -- GDC | CNV__snp6 |
| TCGA-AQ-A7U7-10A-01D-A350-01 | Affymetrix SNP 6.0 | (TODO) -- GDC | CNV__unfiltered__snp6 |
| TCGA-AQ-A7U7-10A-01D-A350-01 | Affymetrix SNP 6.0 | (TODO) -- GDC | CNV__snp6 |
| TCGA-AR-A0TP-10A-01D-A087-01 | Affymetrix SNP 6.0 | (TODO) -- GDC | CNV__unfiltered__snp6 |
| TCGA-AR-A0TP-10A-01D-A087-01 | Affymetrix SNP 6.0 | (TODO) -- GDC | CNV__snp6 |
| TCGA-AR-A0TQ-10A-01D-A087-01 | Affymetrix SNP 6.0 | (TODO) -- GDC | CNV__unfiltered__snp6 |
| TCGA-AR-A0TQ-10A-01D-A087-01 | Affymetrix SNP 6.0 | (TODO) -- GDC | CNV__snp6 |
| TCGA-AR-A0TR-10A-01D-A087-01 | Affymetrix SNP 6.0 | (TODO) -- GDC | CNV__unfiltered__snp6 |
| TCGA-AR-A0TR-10A-01D-A087-01 | Affymetrix SNP 6.0 | (TODO) -- GDC | CNV__snp6 |
| TCGA-AR-A0TS-10A-01D-A113-01 | Affymetrix SNP 6.0 | (TODO) -- GDC | CNV__unfiltered__snp6 |
| TCGA-AR-A0TS-10A-01D-A113-01 | Affymetrix SNP 6.0 | (TODO) -- GDC | CNV__snp6 |
| TCGA-AR-A0TT-10A-01D-A087-01 | Affymetrix SNP 6.0 | (TODO) -- GDC | CNV__unfiltered__snp6 |
| TCGA-AR-A0TT-10A-01D-A087-01 | Affymetrix SNP 6.0 | (TODO) -- GDC | CNV__snp6 |
| TCGA-AR-A0TU-10A-01D-A107-01 | Affymetrix SNP 6.0 | (TODO) -- GDC | CNV__unfiltered__snp6 |
| TCGA-AR-A0TU-10A-01D-A107-01 | Affymetrix SNP 6.0 | (TODO) -- GDC | CNV__snp6 |
| TCGA-AR-A0TV-10A-01D-A087-01 | Affymetrix SNP 6.0 | (TODO) -- GDC | CNV__unfiltered__snp6 |
| TCGA-AR-A0TV-10A-01D-A087-01 | Affymetrix SNP 6.0 | (TODO) -- GDC | CNV__snp6 |
| TCGA-AR-A0TW-10A-01D-A087-01 | Affymetrix SNP 6.0 | (TODO) -- GDC | CNV__unfiltered__snp6 |
| TCGA-AR-A0TW-10A-01D-A087-01 | Affymetrix SNP 6.0 | (TODO) -- GDC | CNV__snp6 |
| TCGA-AR-A0TX-10A-01D-A087-01 | Affymetrix SNP 6.0 | (TODO) -- GDC | CNV__unfiltered__snp6 |
| TCGA-AR-A0TX-10A-01D-A087-01 | Affymetrix SNP 6.0 | (TODO) -- GDC | CNV__snp6 |
| TCGA-AR-A0TY-10A-01D-A113-01 | Affymetrix SNP 6.0 | (TODO) -- GDC | CNV__unfiltered__snp6 |
| TCGA-AR-A0TY-10A-01D-A113-01 | Affymetrix SNP 6.0 | (TODO) -- GDC | CNV__snp6 |
| TCGA-AR-A0TZ-10A-01D-A087-01 | Affymetrix SNP 6.0 | (TODO) -- GDC | CNV__unfiltered__snp6 |
| TCGA-AR-A0TZ-10A-01D-A087-01 | Affymetrix SNP 6.0 | (TODO) -- GDC | CNV__snp6 |
| TCGA-AR-A0U0-10A-01D-A107-01 | Affymetrix SNP 6.0 | (TODO) -- GDC | CNV__unfiltered__snp6 |
| TCGA-AR-A0U0-10A-01D-A107-01 | Affymetrix SNP 6.0 | (TODO) -- GDC | CNV__snp6 |
| TCGA-AR-A0U1-10A-01D-A113-01 | Affymetrix SNP 6.0 | (TODO) -- GDC | CNV__unfiltered__snp6 |
| TCGA-AR-A0U1-10A-01D-A113-01 | Affymetrix SNP 6.0 | (TODO) -- GDC | CNV__snp6 |
| TCGA-AR-A0U2-10A-01D-A107-01 | Affymetrix SNP 6.0 | (TODO) -- GDC | CNV__unfiltered__snp6 |
| TCGA-AR-A0U2-10A-01D-A107-01 | Affymetrix SNP 6.0 | (TODO) -- GDC | CNV__snp6 |
| TCGA-AR-A0U3-10A-01D-A107-01 | Affymetrix SNP 6.0 | (TODO) -- GDC | CNV__unfiltered__snp6 |
| TCGA-AR-A0U3-10A-01D-A107-01 | Affymetrix SNP 6.0 | (TODO) -- GDC | CNV__snp6 |
| TCGA-AR-A0U4-10A-01D-A107-01 | Affymetrix SNP 6.0 | (TODO) -- GDC | CNV__unfiltered__snp6 |
| TCGA-AR-A0U4-10A-01D-A107-01 | Affymetrix SNP 6.0 | (TODO) -- GDC | CNV__snp6 |
| TCGA-AR-A1AH-10A-01D-A12A-01 | Affymetrix SNP 6.0 | (TODO) -- GDC | CNV__unfiltered__snp6 |
| TCGA-AR-A1AH-10A-01D-A12A-01 | Affymetrix SNP 6.0 | (TODO) -- GDC | CNV__snp6 |
| TCGA-AR-A1AI-10A-01D-A12N-01 | Affymetrix SNP 6.0 | (TODO) -- GDC | CNV__unfiltered__snp6 |
| TCGA-AR-A1AI-10A-01D-A12N-01 | Affymetrix SNP 6.0 | (TODO) -- GDC | CNV__snp6 |
| TCGA-AR-A1AJ-10A-01D-A12N-01 | Affymetrix SNP 6.0 | (TODO) -- GDC | CNV__unfiltered__snp6 |
| TCGA-AR-A1AJ-10A-01D-A12N-01 | Affymetrix SNP 6.0 | (TODO) -- GDC | CNV__snp6 |
| TCGA-AR-A1AK-10A-01D-A12N-01 | Affymetrix SNP 6.0 | (TODO) -- GDC | CNV__unfiltered__snp6 |
| TCGA-AR-A1AK-10A-01D-A12N-01 | Affymetrix SNP 6.0 | (TODO) -- GDC | CNV__snp6 |
| TCGA-AR-A1AL-10A-01D-A12N-01 | Affymetrix SNP 6.0 | (TODO) -- GDC | CNV__unfiltered__snp6 |
| TCGA-AR-A1AL-10A-01D-A12N-01 | Affymetrix SNP 6.0 | (TODO) -- GDC | CNV__snp6 |
| TCGA-AR-A1AM-10A-01D-A229-01 | Affymetrix SNP 6.0 | (TODO) -- GDC | CNV__unfiltered__snp6 |
| TCGA-AR-A1AM-10A-01D-A229-01 | Affymetrix SNP 6.0 | (TODO) -- GDC | CNV__snp6 |
| TCGA-AR-A1AN-10A-01D-A12N-01 | Affymetrix SNP 6.0 | (TODO) -- GDC | CNV__unfiltered__snp6 |
| TCGA-AR-A1AN-10A-01D-A12N-01 | Affymetrix SNP 6.0 | (TODO) -- GDC | CNV__snp6 |
| TCGA-AR-A1AO-10A-01D-A12N-01 | Affymetrix SNP 6.0 | (TODO) -- GDC | CNV__unfiltered__snp6 |
| TCGA-AR-A1AO-10A-01D-A12N-01 | Affymetrix SNP 6.0 | (TODO) -- GDC | CNV__snp6 |
| TCGA-AR-A1AP-10A-01D-A12N-01 | Affymetrix SNP 6.0 | (TODO) -- GDC | CNV__unfiltered__snp6 |
| TCGA-AR-A1AP-10A-01D-A12N-01 | Affymetrix SNP 6.0 | (TODO) -- GDC | CNV__snp6 |
| TCGA-AR-A1AQ-10A-01D-A12N-01 | Affymetrix SNP 6.0 | (TODO) -- GDC | CNV__unfiltered__snp6 |
| TCGA-AR-A1AQ-10A-01D-A12N-01 | Affymetrix SNP 6.0 | (TODO) -- GDC | CNV__snp6 |
| TCGA-AR-A1AR-10A-01D-A134-01 | Affymetrix SNP 6.0 | (TODO) -- GDC | CNV__unfiltered__snp6 |
| TCGA-AR-A1AR-10A-01D-A134-01 | Affymetrix SNP 6.0 | (TODO) -- GDC | CNV__snp6 |
| TCGA-AR-A1AS-10A-01D-A12N-01 | Affymetrix SNP 6.0 | (TODO) -- GDC | CNV__unfiltered__snp6 |
| TCGA-AR-A1AS-10A-01D-A12N-01 | Affymetrix SNP 6.0 | (TODO) -- GDC | CNV__snp6 |
| TCGA-AR-A1AT-10A-01D-A12N-01 | Affymetrix SNP 6.0 | (TODO) -- GDC | CNV__unfiltered__snp6 |
| TCGA-AR-A1AT-10A-01D-A12N-01 | Affymetrix SNP 6.0 | (TODO) -- GDC | CNV__snp6 |
| TCGA-AR-A1AU-10A-01D-A12N-01 | Affymetrix SNP 6.0 | (TODO) -- GDC | CNV__unfiltered__snp6 |
| TCGA-AR-A1AU-10A-01D-A12N-01 | Affymetrix SNP 6.0 | (TODO) -- GDC | CNV__snp6 |
| TCGA-AR-A1AV-10A-01D-A12N-01 | Affymetrix SNP 6.0 | (TODO) -- GDC | CNV__unfiltered__snp6 |
| TCGA-AR-A1AV-10A-01D-A12N-01 | Affymetrix SNP 6.0 | (TODO) -- GDC | CNV__snp6 |
| TCGA-AR-A1AW-10A-01D-A12N-01 | Affymetrix SNP 6.0 | (TODO) -- GDC | CNV__unfiltered__snp6 |
| TCGA-AR-A1AW-10A-01D-A12N-01 | Affymetrix SNP 6.0 | (TODO) -- GDC | CNV__snp6 |
| TCGA-AR-A1AX-10A-01D-A12N-01 | Affymetrix SNP 6.0 | (TODO) -- GDC | CNV__unfiltered__snp6 |
| TCGA-AR-A1AX-10A-01D-A12N-01 | Affymetrix SNP 6.0 | (TODO) -- GDC | CNV__snp6 |
| TCGA-AR-A1AY-10A-01D-A12N-01 | Affymetrix SNP 6.0 | (TODO) -- GDC | CNV__unfiltered__snp6 |
| TCGA-AR-A1AY-10A-01D-A12N-01 | Affymetrix SNP 6.0 | (TODO) -- GDC | CNV__snp6 |
| TCGA-AR-A24H-10A-01D-A166-01 | Affymetrix SNP 6.0 | (TODO) -- GDC | CNV__unfiltered__snp6 |
| TCGA-AR-A24H-10A-01D-A166-01 | Affymetrix SNP 6.0 | (TODO) -- GDC | CNV__snp6 |
| TCGA-AR-A24K-10A-01D-A166-01 | Affymetrix SNP 6.0 | (TODO) -- GDC | CNV__unfiltered__snp6 |
| TCGA-AR-A24K-10A-01D-A166-01 | Affymetrix SNP 6.0 | (TODO) -- GDC | CNV__snp6 |
| TCGA-AR-A24M-10A-01D-A166-01 | Affymetrix SNP 6.0 | (TODO) -- GDC | CNV__unfiltered__snp6 |
| TCGA-AR-A24M-10A-01D-A166-01 | Affymetrix SNP 6.0 | (TODO) -- GDC | CNV__snp6 |
| TCGA-AR-A24N-10A-01D-A166-01 | Affymetrix SNP 6.0 | (TODO) -- GDC | CNV__unfiltered__snp6 |
| TCGA-AR-A24N-10A-01D-A166-01 | Affymetrix SNP 6.0 | (TODO) -- GDC | CNV__snp6 |
| TCGA-AR-A24O-10A-01D-A166-01 | Affymetrix SNP 6.0 | (TODO) -- GDC | CNV__unfiltered__snp6 |
| TCGA-AR-A24O-10A-01D-A166-01 | Affymetrix SNP 6.0 | (TODO) -- GDC | CNV__snp6 |
| TCGA-AR-A24P-10A-01D-A166-01 | Affymetrix SNP 6.0 | (TODO) -- GDC | CNV__unfiltered__snp6 |
| TCGA-AR-A24P-10A-01D-A166-01 | Affymetrix SNP 6.0 | (TODO) -- GDC | CNV__snp6 |
| TCGA-AR-A24Q-10A-01D-A166-01 | Affymetrix SNP 6.0 | (TODO) -- GDC | CNV__unfiltered__snp6 |
| TCGA-AR-A24Q-10A-01D-A166-01 | Affymetrix SNP 6.0 | (TODO) -- GDC | CNV__snp6 |
| TCGA-AR-A24R-10A-01D-A166-01 | Affymetrix SNP 6.0 | (TODO) -- GDC | CNV__unfiltered__snp6 |
| TCGA-AR-A24R-10A-01D-A166-01 | Affymetrix SNP 6.0 | (TODO) -- GDC | CNV__snp6 |
| TCGA-AR-A24S-10A-01D-A166-01 | Affymetrix SNP 6.0 | (TODO) -- GDC | CNV__unfiltered__snp6 |
| TCGA-AR-A24S-10A-01D-A166-01 | Affymetrix SNP 6.0 | (TODO) -- GDC | CNV__snp6 |
| TCGA-AR-A24V-10A-01D-A166-01 | Affymetrix SNP 6.0 | (TODO) -- GDC | CNV__unfiltered__snp6 |
| TCGA-AR-A24V-10A-01D-A166-01 | Affymetrix SNP 6.0 | (TODO) -- GDC | CNV__snp6 |
| TCGA-AR-A24W-10A-01D-A166-01 | Affymetrix SNP 6.0 | (TODO) -- GDC | CNV__unfiltered__snp6 |
| TCGA-AR-A24W-10A-01D-A166-01 | Affymetrix SNP 6.0 | (TODO) -- GDC | CNV__snp6 |
| TCGA-AR-A24X-10A-01D-A166-01 | Affymetrix SNP 6.0 | (TODO) -- GDC | CNV__unfiltered__snp6 |
| TCGA-AR-A24X-10A-01D-A166-01 | Affymetrix SNP 6.0 | (TODO) -- GDC | CNV__snp6 |
| TCGA-AR-A24Z-10A-01D-A166-01 | Affymetrix SNP 6.0 | (TODO) -- GDC | CNV__unfiltered__snp6 |
| TCGA-AR-A24Z-10A-01D-A166-01 | Affymetrix SNP 6.0 | (TODO) -- GDC | CNV__snp6 |
| TCGA-AR-A250-10A-01D-A166-01 | Affymetrix SNP 6.0 | (TODO) -- GDC | CNV__unfiltered__snp6 |
| TCGA-AR-A250-10A-01D-A166-01 | Affymetrix SNP 6.0 | (TODO) -- GDC | CNV__snp6 |
| TCGA-AR-A251-10A-01D-A166-01 | Affymetrix SNP 6.0 | (TODO) -- GDC | CNV__unfiltered__snp6 |
| TCGA-AR-A251-10A-01D-A166-01 | Affymetrix SNP 6.0 | (TODO) -- GDC | CNV__snp6 |
| TCGA-AR-A252-10A-01D-A166-01 | Affymetrix SNP 6.0 | (TODO) -- GDC | CNV__unfiltered__snp6 |
| TCGA-AR-A252-10A-01D-A166-01 | Affymetrix SNP 6.0 | (TODO) -- GDC | CNV__snp6 |
| TCGA-AR-A254-10A-01D-A166-01 | Affymetrix SNP 6.0 | (TODO) -- GDC | CNV__unfiltered__snp6 |
| TCGA-AR-A254-10A-01D-A166-01 | Affymetrix SNP 6.0 | (TODO) -- GDC | CNV__snp6 |
| TCGA-AR-A255-10A-01D-A166-01 | Affymetrix SNP 6.0 | (TODO) -- GDC | CNV__unfiltered__snp6 |
| TCGA-AR-A255-10A-01D-A166-01 | Affymetrix SNP 6.0 | (TODO) -- GDC | CNV__snp6 |
| TCGA-AR-A256-10A-01D-A166-01 | Affymetrix SNP 6.0 | (TODO) -- GDC | CNV__unfiltered__snp6 |
| TCGA-AR-A256-10A-01D-A166-01 | Affymetrix SNP 6.0 | (TODO) -- GDC | CNV__snp6 |
| TCGA-AR-A2LE-10A-01D-A17U-01 | Affymetrix SNP 6.0 | (TODO) -- GDC | CNV__unfiltered__snp6 |
| TCGA-AR-A2LE-10A-01D-A17U-01 | Affymetrix SNP 6.0 | (TODO) -- GDC | CNV__snp6 |
| TCGA-AR-A2LH-10A-01D-A18N-01 | Affymetrix SNP 6.0 | (TODO) -- GDC | CNV__unfiltered__snp6 |
| TCGA-AR-A2LH-10A-01D-A18N-01 | Affymetrix SNP 6.0 | (TODO) -- GDC | CNV__snp6 |
| TCGA-AR-A2LJ-10A-01D-A19X-01 | Affymetrix SNP 6.0 | (TODO) -- GDC | CNV__unfiltered__snp6 |
| TCGA-AR-A2LJ-10A-01D-A19X-01 | Affymetrix SNP 6.0 | (TODO) -- GDC | CNV__snp6 |
| TCGA-AR-A2LK-10A-01D-A17U-01 | Affymetrix SNP 6.0 | (TODO) -- GDC | CNV__unfiltered__snp6 |
| TCGA-AR-A2LK-10A-01D-A17U-01 | Affymetrix SNP 6.0 | (TODO) -- GDC | CNV__snp6 |
| TCGA-AR-A2LL-10A-01D-A17U-01 | Affymetrix SNP 6.0 | (TODO) -- GDC | CNV__unfiltered__snp6 |
| TCGA-AR-A2LL-10A-01D-A17U-01 | Affymetrix SNP 6.0 | (TODO) -- GDC | CNV__snp6 |
| TCGA-AR-A2LM-10A-01D-A17U-01 | Affymetrix SNP 6.0 | (TODO) -- GDC | CNV__unfiltered__snp6 |
| TCGA-AR-A2LM-10A-01D-A17U-01 | Affymetrix SNP 6.0 | (TODO) -- GDC | CNV__snp6 |
| TCGA-AR-A2LN-10A-01D-A18N-01 | Affymetrix SNP 6.0 | (TODO) -- GDC | CNV__unfiltered__snp6 |
| TCGA-AR-A2LN-10A-01D-A18N-01 | Affymetrix SNP 6.0 | (TODO) -- GDC | CNV__snp6 |
| TCGA-AR-A2LO-10A-01D-A18N-01 | Affymetrix SNP 6.0 | (TODO) -- GDC | CNV__unfiltered__snp6 |
| TCGA-AR-A2LO-10A-01D-A18N-01 | Affymetrix SNP 6.0 | (TODO) -- GDC | CNV__snp6 |
| TCGA-AR-A2LQ-10A-01D-A18N-01 | Affymetrix SNP 6.0 | (TODO) -- GDC | CNV__unfiltered__snp6 |
| TCGA-AR-A2LQ-10A-01D-A18N-01 | Affymetrix SNP 6.0 | (TODO) -- GDC | CNV__snp6 |
| TCGA-AR-A2LR-10A-01D-A18N-01 | Affymetrix SNP 6.0 | (TODO) -- GDC | CNV__unfiltered__snp6 |
| TCGA-AR-A2LR-10A-01D-A18N-01 | Affymetrix SNP 6.0 | (TODO) -- GDC | CNV__snp6 |
| TCGA-AR-A5QM-10A-01D-A27O-01 | Affymetrix SNP 6.0 | (TODO) -- GDC | CNV__unfiltered__snp6 |
| TCGA-AR-A5QM-10A-01D-A27O-01 | Affymetrix SNP 6.0 | (TODO) -- GDC | CNV__snp6 |
| TCGA-AR-A5QN-10A-01D-A28D-01 | Affymetrix SNP 6.0 | (TODO) -- GDC | CNV__unfiltered__snp6 |
| TCGA-AR-A5QN-10A-01D-A28D-01 | Affymetrix SNP 6.0 | (TODO) -- GDC | CNV__snp6 |
| TCGA-AR-A5QP-10A-01D-A28D-01 | Affymetrix SNP 6.0 | (TODO) -- GDC | CNV__unfiltered__snp6 |
| TCGA-AR-A5QP-10A-01D-A28D-01 | Affymetrix SNP 6.0 | (TODO) -- GDC | CNV__snp6 |
| TCGA-AR-A5QQ-10A-01D-A28D-01 | Affymetrix SNP 6.0 | (TODO) -- GDC | CNV__unfiltered__snp6 |
| TCGA-AR-A5QQ-10A-01D-A28D-01 | Affymetrix SNP 6.0 | (TODO) -- GDC | CNV__snp6 |
| TCGA-B6-A0I1-10A-01D-A21P-01 | Affymetrix SNP 6.0 | (TODO) -- GDC | CNV__unfiltered__snp6 |
| TCGA-B6-A0I1-10A-01D-A21P-01 | Affymetrix SNP 6.0 | (TODO) -- GDC | CNV__snp6 |
| TCGA-B6-A0I2-10A-01D-A037-01 | Affymetrix SNP 6.0 | (TODO) -- GDC | CNV__unfiltered__snp6 |
| TCGA-B6-A0I2-10A-01D-A037-01 | Affymetrix SNP 6.0 | (TODO) -- GDC | CNV__snp6 |
| TCGA-B6-A0I5-10A-01D-A037-01 | Affymetrix SNP 6.0 | (TODO) -- GDC | CNV__unfiltered__snp6 |
| TCGA-B6-A0I5-10A-01D-A037-01 | Affymetrix SNP 6.0 | (TODO) -- GDC | CNV__snp6 |
| TCGA-B6-A0I6-10A-01D-A037-01 | Affymetrix SNP 6.0 | (TODO) -- GDC | CNV__unfiltered__snp6 |
| TCGA-B6-A0I6-10A-01D-A037-01 | Affymetrix SNP 6.0 | (TODO) -- GDC | CNV__snp6 |
| TCGA-B6-A0I8-10A-01D-A037-01 | Affymetrix SNP 6.0 | (TODO) -- GDC | CNV__unfiltered__snp6 |
| TCGA-B6-A0I8-10A-01D-A037-01 | Affymetrix SNP 6.0 | (TODO) -- GDC | CNV__snp6 |
| TCGA-B6-A0I9-10A-01D-A037-01 | Affymetrix SNP 6.0 | (TODO) -- GDC | CNV__unfiltered__snp6 |
| TCGA-B6-A0I9-10A-01D-A037-01 | Affymetrix SNP 6.0 | (TODO) -- GDC | CNV__snp6 |
| TCGA-B6-A0IA-10A-01D-A037-01 | Affymetrix SNP 6.0 | (TODO) -- GDC | CNV__unfiltered__snp6 |
| TCGA-B6-A0IA-10A-01D-A037-01 | Affymetrix SNP 6.0 | (TODO) -- GDC | CNV__snp6 |
| TCGA-B6-A0IB-10A-01D-A037-01 | Affymetrix SNP 6.0 | (TODO) -- GDC | CNV__unfiltered__snp6 |
| TCGA-B6-A0IB-10A-01D-A037-01 | Affymetrix SNP 6.0 | (TODO) -- GDC | CNV__snp6 |
| TCGA-B6-A0IC-10A-01D-A037-01 | Affymetrix SNP 6.0 | (TODO) -- GDC | CNV__unfiltered__snp6 |
| TCGA-B6-A0IC-10A-01D-A037-01 | Affymetrix SNP 6.0 | (TODO) -- GDC | CNV__snp6 |
| TCGA-B6-A0IE-10A-01D-A037-01 | Affymetrix SNP 6.0 | (TODO) -- GDC | CNV__unfiltered__snp6 |
| TCGA-B6-A0IE-10A-01D-A037-01 | Affymetrix SNP 6.0 | (TODO) -- GDC | CNV__snp6 |
| TCGA-B6-A0IG-10A-01D-A037-01 | Affymetrix SNP 6.0 | (TODO) -- GDC | CNV__unfiltered__snp6 |
| TCGA-B6-A0IG-10A-01D-A037-01 | Affymetrix SNP 6.0 | (TODO) -- GDC | CNV__snp6 |
| TCGA-B6-A0IH-10A-01D-A113-01 | Affymetrix SNP 6.0 | (TODO) -- GDC | CNV__unfiltered__snp6 |
| TCGA-B6-A0IH-10A-01D-A113-01 | Affymetrix SNP 6.0 | (TODO) -- GDC | CNV__snp6 |
| TCGA-B6-A0IJ-10A-01D-A037-01 | Affymetrix SNP 6.0 | (TODO) -- GDC | CNV__unfiltered__snp6 |
| TCGA-B6-A0IJ-10A-01D-A037-01 | Affymetrix SNP 6.0 | (TODO) -- GDC | CNV__snp6 |
| TCGA-B6-A0IK-10A-01D-A059-01 | Affymetrix SNP 6.0 | (TODO) -- GDC | CNV__unfiltered__snp6 |
| TCGA-B6-A0IK-10A-01D-A059-01 | Affymetrix SNP 6.0 | (TODO) -- GDC | CNV__snp6 |
| TCGA-B6-A0IM-10A-01D-A037-01 | Affymetrix SNP 6.0 | (TODO) -- GDC | CNV__unfiltered__snp6 |
| TCGA-B6-A0IM-10A-01D-A037-01 | Affymetrix SNP 6.0 | (TODO) -- GDC | CNV__snp6 |
| TCGA-B6-A0IN-10A-01D-A037-01 | Affymetrix SNP 6.0 | (TODO) -- GDC | CNV__unfiltered__snp6 |
| TCGA-B6-A0IN-10A-01D-A037-01 | Affymetrix SNP 6.0 | (TODO) -- GDC | CNV__snp6 |
| TCGA-B6-A0IO-10A-01D-A037-01 | Affymetrix SNP 6.0 | (TODO) -- GDC | CNV__unfiltered__snp6 |
| TCGA-B6-A0IO-10A-01D-A037-01 | Affymetrix SNP 6.0 | (TODO) -- GDC | CNV__snp6 |
| TCGA-B6-A0IP-10A-01D-A037-01 | Affymetrix SNP 6.0 | (TODO) -- GDC | CNV__unfiltered__snp6 |
| TCGA-B6-A0IP-10A-01D-A037-01 | Affymetrix SNP 6.0 | (TODO) -- GDC | CNV__snp6 |
| TCGA-B6-A0IQ-10A-01D-A037-01 | Affymetrix SNP 6.0 | (TODO) -- GDC | CNV__unfiltered__snp6 |
| TCGA-B6-A0IQ-10A-01D-A037-01 | Affymetrix SNP 6.0 | (TODO) -- GDC | CNV__snp6 |
| TCGA-B6-A0RE-10A-01D-A059-01 | Affymetrix SNP 6.0 | (TODO) -- GDC | CNV__unfiltered__snp6 |
| TCGA-B6-A0RE-10A-01D-A059-01 | Affymetrix SNP 6.0 | (TODO) -- GDC | CNV__snp6 |
| TCGA-B6-A0RG-10A-01D-A059-01 | Affymetrix SNP 6.0 | (TODO) -- GDC | CNV__unfiltered__snp6 |
| TCGA-B6-A0RG-10A-01D-A059-01 | Affymetrix SNP 6.0 | (TODO) -- GDC | CNV__snp6 |
| TCGA-B6-A0RH-10A-01D-A113-01 | Affymetrix SNP 6.0 | (TODO) -- GDC | CNV__unfiltered__snp6 |
| TCGA-B6-A0RH-10A-01D-A113-01 | Affymetrix SNP 6.0 | (TODO) -- GDC | CNV__snp6 |
| TCGA-B6-A0RI-10A-01D-A059-01 | Affymetrix SNP 6.0 | (TODO) -- GDC | CNV__unfiltered__snp6 |
| TCGA-B6-A0RI-10A-01D-A059-01 | Affymetrix SNP 6.0 | (TODO) -- GDC | CNV__snp6 |
| TCGA-B6-A0RL-10A-01D-A087-01 | Affymetrix SNP 6.0 | (TODO) -- GDC | CNV__unfiltered__snp6 |
| TCGA-B6-A0RL-10A-01D-A087-01 | Affymetrix SNP 6.0 | (TODO) -- GDC | CNV__snp6 |
| TCGA-B6-A0RM-10A-01D-A087-01 | Affymetrix SNP 6.0 | (TODO) -- GDC | CNV__unfiltered__snp6 |
| TCGA-B6-A0RM-10A-01D-A087-01 | Affymetrix SNP 6.0 | (TODO) -- GDC | CNV__snp6 |
| TCGA-B6-A0RN-10A-01D-A087-01 | Affymetrix SNP 6.0 | (TODO) -- GDC | CNV__unfiltered__snp6 |
| TCGA-B6-A0RN-10A-01D-A087-01 | Affymetrix SNP 6.0 | (TODO) -- GDC | CNV__snp6 |
| TCGA-B6-A0RO-10A-01D-A087-01 | Affymetrix SNP 6.0 | (TODO) -- GDC | CNV__unfiltered__snp6 |
| TCGA-B6-A0RO-10A-01D-A087-01 | Affymetrix SNP 6.0 | (TODO) -- GDC | CNV__snp6 |
| TCGA-B6-A0RP-10A-01D-A087-01 | Affymetrix SNP 6.0 | (TODO) -- GDC | CNV__unfiltered__snp6 |
| TCGA-B6-A0RP-10A-01D-A087-01 | Affymetrix SNP 6.0 | (TODO) -- GDC | CNV__snp6 |
| TCGA-B6-A0RQ-10A-01D-A113-01 | Affymetrix SNP 6.0 | (TODO) -- GDC | CNV__unfiltered__snp6 |
| TCGA-B6-A0RQ-10A-01D-A113-01 | Affymetrix SNP 6.0 | (TODO) -- GDC | CNV__snp6 |
| TCGA-B6-A0RS-10A-01D-A087-01 | Affymetrix SNP 6.0 | (TODO) -- GDC | CNV__unfiltered__snp6 |
| TCGA-B6-A0RS-10A-01D-A087-01 | Affymetrix SNP 6.0 | (TODO) -- GDC | CNV__snp6 |
| TCGA-B6-A0RT-10A-01D-A087-01 | Affymetrix SNP 6.0 | (TODO) -- GDC | CNV__unfiltered__snp6 |
| TCGA-B6-A0RT-10A-01D-A087-01 | Affymetrix SNP 6.0 | (TODO) -- GDC | CNV__snp6 |
| TCGA-B6-A0RU-10A-01D-A087-01 | Affymetrix SNP 6.0 | (TODO) -- GDC | CNV__unfiltered__snp6 |
| TCGA-B6-A0RU-10A-01D-A087-01 | Affymetrix SNP 6.0 | (TODO) -- GDC | CNV__snp6 |
| TCGA-B6-A0RV-10A-01D-A087-01 | Affymetrix SNP 6.0 | (TODO) -- GDC | CNV__unfiltered__snp6 |
| TCGA-B6-A0RV-10A-01D-A087-01 | Affymetrix SNP 6.0 | (TODO) -- GDC | CNV__snp6 |
| TCGA-B6-A0WS-10A-01D-A113-01 | Affymetrix SNP 6.0 | (TODO) -- GDC | CNV__unfiltered__snp6 |
| TCGA-B6-A0WS-10A-01D-A113-01 | Affymetrix SNP 6.0 | (TODO) -- GDC | CNV__snp6 |
| TCGA-B6-A0WT-10A-01D-A107-01 | Affymetrix SNP 6.0 | (TODO) -- GDC | CNV__unfiltered__snp6 |
| TCGA-B6-A0WT-10A-01D-A107-01 | Affymetrix SNP 6.0 | (TODO) -- GDC | CNV__snp6 |
| TCGA-B6-A0WV-10A-01D-A107-01 | Affymetrix SNP 6.0 | (TODO) -- GDC | CNV__unfiltered__snp6 |
| TCGA-B6-A0WV-10A-01D-A107-01 | Affymetrix SNP 6.0 | (TODO) -- GDC | CNV__snp6 |
| TCGA-B6-A0WX-10A-01D-A107-01 | Affymetrix SNP 6.0 | (TODO) -- GDC | CNV__unfiltered__snp6 |
| TCGA-B6-A0WX-10A-01D-A107-01 | Affymetrix SNP 6.0 | (TODO) -- GDC | CNV__snp6 |
| TCGA-B6-A0WY-10A-01D-A107-01 | Affymetrix SNP 6.0 | (TODO) -- GDC | CNV__unfiltered__snp6 |
| TCGA-B6-A0WY-10A-01D-A107-01 | Affymetrix SNP 6.0 | (TODO) -- GDC | CNV__snp6 |
| TCGA-B6-A0WZ-10A-01D-A107-01 | Affymetrix SNP 6.0 | (TODO) -- GDC | CNV__unfiltered__snp6 |
| TCGA-B6-A0WZ-10A-01D-A107-01 | Affymetrix SNP 6.0 | (TODO) -- GDC | CNV__snp6 |
| TCGA-B6-A0X0-10A-01D-A113-01 | Affymetrix SNP 6.0 | (TODO) -- GDC | CNV__unfiltered__snp6 |
| TCGA-B6-A0X0-10A-01D-A113-01 | Affymetrix SNP 6.0 | (TODO) -- GDC | CNV__snp6 |
| TCGA-B6-A0X1-10A-01D-A107-01 | Affymetrix SNP 6.0 | (TODO) -- GDC | CNV__unfiltered__snp6 |
| TCGA-B6-A0X1-10A-01D-A107-01 | Affymetrix SNP 6.0 | (TODO) -- GDC | CNV__snp6 |
| TCGA-B6-A0X4-10A-01D-A107-01 | Affymetrix SNP 6.0 | (TODO) -- GDC | CNV__unfiltered__snp6 |
| TCGA-B6-A0X4-10A-01D-A107-01 | Affymetrix SNP 6.0 | (TODO) -- GDC | CNV__snp6 |
| TCGA-B6-A0X5-10A-01D-A107-01 | Affymetrix SNP 6.0 | (TODO) -- GDC | CNV__unfiltered__snp6 |
| TCGA-B6-A0X5-10A-01D-A107-01 | Affymetrix SNP 6.0 | (TODO) -- GDC | CNV__snp6 |
| TCGA-B6-A0X7-10A-01D-A10L-01 | Affymetrix SNP 6.0 | (TODO) -- GDC | CNV__unfiltered__snp6 |
| TCGA-B6-A0X7-10A-01D-A10L-01 | Affymetrix SNP 6.0 | (TODO) -- GDC | CNV__snp6 |
| TCGA-B6-A1KC-10A-01D-A13N-01 | Affymetrix SNP 6.0 | (TODO) -- GDC | CNV__unfiltered__snp6 |
| TCGA-B6-A1KC-10A-01D-A13N-01 | Affymetrix SNP 6.0 | (TODO) -- GDC | CNV__snp6 |
| TCGA-B6-A1KF-10A-01D-A13N-01 | Affymetrix SNP 6.0 | (TODO) -- GDC | CNV__unfiltered__snp6 |
| TCGA-B6-A1KF-10A-01D-A13N-01 | Affymetrix SNP 6.0 | (TODO) -- GDC | CNV__snp6 |
| TCGA-B6-A1KI-10A-01D-A14J-01 | Affymetrix SNP 6.0 | (TODO) -- GDC | CNV__unfiltered__snp6 |
| TCGA-B6-A1KI-10A-01D-A14J-01 | Affymetrix SNP 6.0 | (TODO) -- GDC | CNV__snp6 |
| TCGA-B6-A1KN-10A-01D-A13N-01 | Affymetrix SNP 6.0 | (TODO) -- GDC | CNV__unfiltered__snp6 |
| TCGA-B6-A1KN-10A-01D-A13N-01 | Affymetrix SNP 6.0 | (TODO) -- GDC | CNV__snp6 |
| TCGA-B6-A2IU-10A-01D-A18N-01 | Affymetrix SNP 6.0 | (TODO) -- GDC | CNV__unfiltered__snp6 |
| TCGA-B6-A2IU-10A-01D-A18N-01 | Affymetrix SNP 6.0 | (TODO) -- GDC | CNV__snp6 |
| TCGA-B6-A3ZX-10A-01D-A238-01 | Affymetrix SNP 6.0 | (TODO) -- GDC | CNV__unfiltered__snp6 |
| TCGA-B6-A3ZX-10A-01D-A238-01 | Affymetrix SNP 6.0 | (TODO) -- GDC | CNV__snp6 |
| TCGA-B6-A401-10A-01D-A238-01 | Affymetrix SNP 6.0 | (TODO) -- GDC | CNV__unfiltered__snp6 |
| TCGA-B6-A401-10A-01D-A238-01 | Affymetrix SNP 6.0 | (TODO) -- GDC | CNV__snp6 |
| TCGA-B6-A408-10A-01D-A242-01 | Affymetrix SNP 6.0 | (TODO) -- GDC | CNV__unfiltered__snp6 |
| TCGA-B6-A408-10A-01D-A242-01 | Affymetrix SNP 6.0 | (TODO) -- GDC | CNV__snp6 |
| TCGA-B6-A409-10A-01D-A242-01 | Affymetrix SNP 6.0 | (TODO) -- GDC | CNV__unfiltered__snp6 |
| TCGA-B6-A409-10A-01D-A242-01 | Affymetrix SNP 6.0 | (TODO) -- GDC | CNV__snp6 |
| TCGA-B6-A40C-10A-01D-A238-01 | Affymetrix SNP 6.0 | (TODO) -- GDC | CNV__unfiltered__snp6 |
| TCGA-B6-A40C-10A-01D-A238-01 | Affymetrix SNP 6.0 | (TODO) -- GDC | CNV__snp6 |
| TCGA-BH-A0AV-10A-01D-A113-01 | Affymetrix SNP 6.0 | (TODO) -- GDC | CNV__unfiltered__snp6 |
| TCGA-BH-A0AV-10A-01D-A113-01 | Affymetrix SNP 6.0 | (TODO) -- GDC | CNV__snp6 |
| TCGA-BH-A0AW-10A-01D-A059-01 | Affymetrix SNP 6.0 | (TODO) -- GDC | CNV__unfiltered__snp6 |
| TCGA-BH-A0AW-10A-01D-A059-01 | Affymetrix SNP 6.0 | (TODO) -- GDC | CNV__snp6 |
| TCGA-BH-A0AY-10A-01D-A012-01 | Affymetrix SNP 6.0 | (TODO) -- GDC | CNV__unfiltered__snp6 |
| TCGA-BH-A0AY-10A-01D-A012-01 | Affymetrix SNP 6.0 | (TODO) -- GDC | CNV__snp6 |
| TCGA-BH-A0B0-10A-01D-A113-01 | Affymetrix SNP 6.0 | (TODO) -- GDC | CNV__unfiltered__snp6 |
| TCGA-BH-A0B0-10A-01D-A113-01 | Affymetrix SNP 6.0 | (TODO) -- GDC | CNV__snp6 |
| TCGA-BH-A0B1-10A-01D-A059-01 | Affymetrix SNP 6.0 | (TODO) -- GDC | CNV__unfiltered__snp6 |
| TCGA-BH-A0B1-10A-01D-A059-01 | Affymetrix SNP 6.0 | (TODO) -- GDC | CNV__snp6 |
| TCGA-BH-A0B2-10A-01D-A10L-01 | Affymetrix SNP 6.0 | (TODO) -- GDC | CNV__unfiltered__snp6 |
| TCGA-BH-A0B2-10A-01D-A10L-01 | Affymetrix SNP 6.0 | (TODO) -- GDC | CNV__snp6 |
| TCGA-BH-A0B3-10A-01D-A059-01 | Affymetrix SNP 6.0 | (TODO) -- GDC | CNV__unfiltered__snp6 |
| TCGA-BH-A0B3-10A-01D-A059-01 | Affymetrix SNP 6.0 | (TODO) -- GDC | CNV__snp6 |
| TCGA-BH-A0B4-10A-01D-A012-01 | Affymetrix SNP 6.0 | (TODO) -- GDC | CNV__unfiltered__snp6 |
| TCGA-BH-A0B4-10A-01D-A012-01 | Affymetrix SNP 6.0 | (TODO) -- GDC | CNV__snp6 |
| TCGA-BH-A0B6-10A-01D-A19X-01 | Affymetrix SNP 6.0 | (TODO) -- GDC | CNV__unfiltered__snp6 |
| TCGA-BH-A0B6-10A-01D-A19X-01 | Affymetrix SNP 6.0 | (TODO) -- GDC | CNV__snp6 |
| TCGA-BH-A0B7-10A-01D-A113-01 | Affymetrix SNP 6.0 | (TODO) -- GDC | CNV__unfiltered__snp6 |
| TCGA-BH-A0B7-10A-01D-A113-01 | Affymetrix SNP 6.0 | (TODO) -- GDC | CNV__snp6 |
| TCGA-BH-A0B8-10A-01D-A059-01 | Affymetrix SNP 6.0 | (TODO) -- GDC | CNV__unfiltered__snp6 |
| TCGA-BH-A0B8-10A-01D-A059-01 | Affymetrix SNP 6.0 | (TODO) -- GDC | CNV__snp6 |
| TCGA-BH-A0B9-10A-01D-A059-01 | Affymetrix SNP 6.0 | (TODO) -- GDC | CNV__unfiltered__snp6 |
| TCGA-BH-A0B9-10A-01D-A059-01 | Affymetrix SNP 6.0 | (TODO) -- GDC | CNV__snp6 |
| TCGA-BH-A0BA-10A-01D-A059-01 | Affymetrix SNP 6.0 | (TODO) -- GDC | CNV__unfiltered__snp6 |
| TCGA-BH-A0BA-10A-01D-A059-01 | Affymetrix SNP 6.0 | (TODO) -- GDC | CNV__snp6 |
| TCGA-BH-A0BC-10A-01D-A087-01 | Affymetrix SNP 6.0 | (TODO) -- GDC | CNV__unfiltered__snp6 |
| TCGA-BH-A0BC-10A-01D-A087-01 | Affymetrix SNP 6.0 | (TODO) -- GDC | CNV__snp6 |
| TCGA-BH-A0BD-10A-01D-A037-01 | Affymetrix SNP 6.0 | (TODO) -- GDC | CNV__unfiltered__snp6 |
| TCGA-BH-A0BD-10A-01D-A037-01 | Affymetrix SNP 6.0 | (TODO) -- GDC | CNV__snp6 |
| TCGA-BH-A0BG-10A-01D-A113-01 | Affymetrix SNP 6.0 | (TODO) -- GDC | CNV__unfiltered__snp6 |
| TCGA-BH-A0BG-10A-01D-A113-01 | Affymetrix SNP 6.0 | (TODO) -- GDC | CNV__snp6 |
| TCGA-BH-A0BJ-10A-01D-A059-01 | Affymetrix SNP 6.0 | (TODO) -- GDC | CNV__unfiltered__snp6 |
| TCGA-BH-A0BJ-10A-01D-A059-01 | Affymetrix SNP 6.0 | (TODO) -- GDC | CNV__snp6 |
| TCGA-BH-A0BL-10A-01D-A113-01 | Affymetrix SNP 6.0 | (TODO) -- GDC | CNV__unfiltered__snp6 |
| TCGA-BH-A0BL-10A-01D-A113-01 | Affymetrix SNP 6.0 | (TODO) -- GDC | CNV__snp6 |
| TCGA-BH-A0BM-10A-01D-A059-01 | Affymetrix SNP 6.0 | (TODO) -- GDC | CNV__unfiltered__snp6 |
| TCGA-BH-A0BM-10A-01D-A059-01 | Affymetrix SNP 6.0 | (TODO) -- GDC | CNV__snp6 |
| TCGA-BH-A0BO-10A-01D-A12A-01 | Affymetrix SNP 6.0 | (TODO) -- GDC | CNV__unfiltered__snp6 |
| TCGA-BH-A0BO-10A-01D-A12A-01 | Affymetrix SNP 6.0 | (TODO) -- GDC | CNV__snp6 |
| TCGA-BH-A0BP-10A-01D-A113-01 | Affymetrix SNP 6.0 | (TODO) -- GDC | CNV__unfiltered__snp6 |
| TCGA-BH-A0BP-10A-01D-A113-01 | Affymetrix SNP 6.0 | (TODO) -- GDC | CNV__snp6 |
| TCGA-BH-A0BR-10A-01D-A113-01 | Affymetrix SNP 6.0 | (TODO) -- GDC | CNV__unfiltered__snp6 |
| TCGA-BH-A0BR-10A-01D-A113-01 | Affymetrix SNP 6.0 | (TODO) -- GDC | CNV__snp6 |
| TCGA-BH-A0BV-10A-01D-A012-01 | Affymetrix SNP 6.0 | (TODO) -- GDC | CNV__unfiltered__snp6 |
| TCGA-BH-A0BV-10A-01D-A012-01 | Affymetrix SNP 6.0 | (TODO) -- GDC | CNV__snp6 |
| TCGA-BH-A0BW-10A-01D-A113-01 | Affymetrix SNP 6.0 | (TODO) -- GDC | CNV__unfiltered__snp6 |
| TCGA-BH-A0BW-10A-01D-A113-01 | Affymetrix SNP 6.0 | (TODO) -- GDC | CNV__snp6 |
| TCGA-BH-A0C0-10A-01D-A059-01 | Affymetrix SNP 6.0 | (TODO) -- GDC | CNV__unfiltered__snp6 |
| TCGA-BH-A0C0-10A-01D-A059-01 | Affymetrix SNP 6.0 | (TODO) -- GDC | CNV__snp6 |
| TCGA-BH-A0C1-10A-01D-A12A-01 | Affymetrix SNP 6.0 | (TODO) -- GDC | CNV__unfiltered__snp6 |
| TCGA-BH-A0C1-10A-01D-A12A-01 | Affymetrix SNP 6.0 | (TODO) -- GDC | CNV__snp6 |
| TCGA-BH-A0C7-10A-01D-A113-01 | Affymetrix SNP 6.0 | (TODO) -- GDC | CNV__unfiltered__snp6 |
| TCGA-BH-A0C7-10A-01D-A113-01 | Affymetrix SNP 6.0 | (TODO) -- GDC | CNV__snp6 |
| TCGA-BH-A0DE-10A-02D-A113-01 | Affymetrix SNP 6.0 | (TODO) -- GDC | CNV__unfiltered__snp6 |
| TCGA-BH-A0DE-10A-02D-A113-01 | Affymetrix SNP 6.0 | (TODO) -- GDC | CNV__snp6 |
| TCGA-BH-A0DH-10A-01D-A087-01 | Affymetrix SNP 6.0 | (TODO) -- GDC | CNV__unfiltered__snp6 |
| TCGA-BH-A0DH-10A-01D-A087-01 | Affymetrix SNP 6.0 | (TODO) -- GDC | CNV__snp6 |
| TCGA-BH-A0DK-10A-01D-A059-01 | Affymetrix SNP 6.0 | (TODO) -- GDC | CNV__unfiltered__snp6 |
| TCGA-BH-A0DK-10A-01D-A059-01 | Affymetrix SNP 6.0 | (TODO) -- GDC | CNV__snp6 |
| TCGA-BH-A0DL-10A-01D-A113-01 | Affymetrix SNP 6.0 | (TODO) -- GDC | CNV__unfiltered__snp6 |
| TCGA-BH-A0DL-10A-01D-A113-01 | Affymetrix SNP 6.0 | (TODO) -- GDC | CNV__snp6 |
| TCGA-BH-A0DP-10A-01D-A059-01 | Affymetrix SNP 6.0 | (TODO) -- GDC | CNV__unfiltered__snp6 |
| TCGA-BH-A0DP-10A-01D-A059-01 | Affymetrix SNP 6.0 | (TODO) -- GDC | CNV__snp6 |
| TCGA-BH-A0DQ-10A-01D-A087-01 | Affymetrix SNP 6.0 | (TODO) -- GDC | CNV__unfiltered__snp6 |
| TCGA-BH-A0DQ-10A-01D-A087-01 | Affymetrix SNP 6.0 | (TODO) -- GDC | CNV__snp6 |
| TCGA-BH-A0DS-10A-01D-A059-01 | Affymetrix SNP 6.0 | (TODO) -- GDC | CNV__unfiltered__snp6 |
| TCGA-BH-A0DS-10A-01D-A059-01 | Affymetrix SNP 6.0 | (TODO) -- GDC | CNV__snp6 |
| TCGA-BH-A0DX-10A-02D-A113-01 | Affymetrix SNP 6.0 | (TODO) -- GDC | CNV__unfiltered__snp6 |
| TCGA-BH-A0DX-10A-02D-A113-01 | Affymetrix SNP 6.0 | (TODO) -- GDC | CNV__snp6 |
| TCGA-BH-A0DZ-10A-01D-A012-01 | Affymetrix SNP 6.0 | (TODO) -- GDC | CNV__unfiltered__snp6 |
| TCGA-BH-A0DZ-10A-01D-A012-01 | Affymetrix SNP 6.0 | (TODO) -- GDC | CNV__snp6 |
| TCGA-BH-A0E0-10A-01D-A059-01 | Affymetrix SNP 6.0 | (TODO) -- GDC | CNV__unfiltered__snp6 |
| TCGA-BH-A0E0-10A-01D-A059-01 | Affymetrix SNP 6.0 | (TODO) -- GDC | CNV__snp6 |
| TCGA-BH-A0E1-10A-01D-A059-01 | Affymetrix SNP 6.0 | (TODO) -- GDC | CNV__unfiltered__snp6 |
| TCGA-BH-A0E1-10A-01D-A059-01 | Affymetrix SNP 6.0 | (TODO) -- GDC | CNV__snp6 |
| TCGA-BH-A0E2-10A-01D-A059-01 | Affymetrix SNP 6.0 | (TODO) -- GDC | CNV__unfiltered__snp6 |
| TCGA-BH-A0E2-10A-01D-A059-01 | Affymetrix SNP 6.0 | (TODO) -- GDC | CNV__snp6 |
| TCGA-BH-A0E6-10A-01D-A037-01 | Affymetrix SNP 6.0 | (TODO) -- GDC | CNV__unfiltered__snp6 |
| TCGA-BH-A0E6-10A-01D-A037-01 | Affymetrix SNP 6.0 | (TODO) -- GDC | CNV__snp6 |
| TCGA-BH-A0E7-10A-01D-A037-01 | Affymetrix SNP 6.0 | (TODO) -- GDC | CNV__unfiltered__snp6 |
| TCGA-BH-A0E7-10A-01D-A037-01 | Affymetrix SNP 6.0 | (TODO) -- GDC | CNV__snp6 |
| TCGA-BH-A0E9-10A-01D-A113-01 | Affymetrix SNP 6.0 | (TODO) -- GDC | CNV__unfiltered__snp6 |
| TCGA-BH-A0E9-10A-01D-A113-01 | Affymetrix SNP 6.0 | (TODO) -- GDC | CNV__snp6 |
| TCGA-BH-A0EA-10A-01D-A113-01 | Affymetrix SNP 6.0 | (TODO) -- GDC | CNV__unfiltered__snp6 |
| TCGA-BH-A0EA-10A-01D-A113-01 | Affymetrix SNP 6.0 | (TODO) -- GDC | CNV__snp6 |
| TCGA-BH-A0EB-10A-01D-A037-01 | Affymetrix SNP 6.0 | (TODO) -- GDC | CNV__unfiltered__snp6 |
| TCGA-BH-A0EB-10A-01D-A037-01 | Affymetrix SNP 6.0 | (TODO) -- GDC | CNV__snp6 |
| TCGA-BH-A0EE-10A-01D-A037-01 | Affymetrix SNP 6.0 | (TODO) -- GDC | CNV__unfiltered__snp6 |
| TCGA-BH-A0EE-10A-01D-A037-01 | Affymetrix SNP 6.0 | (TODO) -- GDC | CNV__snp6 |
| TCGA-BH-A0EI-10A-01D-A113-01 | Affymetrix SNP 6.0 | (TODO) -- GDC | CNV__unfiltered__snp6 |
| TCGA-BH-A0EI-10A-01D-A113-01 | Affymetrix SNP 6.0 | (TODO) -- GDC | CNV__snp6 |
| TCGA-BH-A0GY-10A-01D-A059-01 | Affymetrix SNP 6.0 | (TODO) -- GDC | CNV__unfiltered__snp6 |
| TCGA-BH-A0GY-10A-01D-A059-01 | Affymetrix SNP 6.0 | (TODO) -- GDC | CNV__snp6 |
| TCGA-BH-A0GZ-10A-01D-A059-01 | Affymetrix SNP 6.0 | (TODO) -- GDC | CNV__unfiltered__snp6 |
| TCGA-BH-A0GZ-10A-01D-A059-01 | Affymetrix SNP 6.0 | (TODO) -- GDC | CNV__snp6 |
| TCGA-BH-A0H0-10A-01D-A059-01 | Affymetrix SNP 6.0 | (TODO) -- GDC | CNV__unfiltered__snp6 |
| TCGA-BH-A0H0-10A-01D-A059-01 | Affymetrix SNP 6.0 | (TODO) -- GDC | CNV__snp6 |
| TCGA-BH-A0H5-10A-01D-A113-01 | Affymetrix SNP 6.0 | (TODO) -- GDC | CNV__unfiltered__snp6 |
| TCGA-BH-A0H5-10A-01D-A113-01 | Affymetrix SNP 6.0 | (TODO) -- GDC | CNV__snp6 |
| TCGA-BH-A0H6-10A-01D-A059-01 | Affymetrix SNP 6.0 | (TODO) -- GDC | CNV__unfiltered__snp6 |
| TCGA-BH-A0H6-10A-01D-A059-01 | Affymetrix SNP 6.0 | (TODO) -- GDC | CNV__snp6 |
| TCGA-BH-A0H7-10A-01D-A059-01 | Affymetrix SNP 6.0 | (TODO) -- GDC | CNV__unfiltered__snp6 |
| TCGA-BH-A0H7-10A-01D-A059-01 | Affymetrix SNP 6.0 | (TODO) -- GDC | CNV__snp6 |
| TCGA-BH-A0H9-10A-01D-A059-01 | Affymetrix SNP 6.0 | (TODO) -- GDC | CNV__unfiltered__snp6 |
| TCGA-BH-A0H9-10A-01D-A059-01 | Affymetrix SNP 6.0 | (TODO) -- GDC | CNV__snp6 |
| TCGA-BH-A0HB-10A-01D-A059-01 | Affymetrix SNP 6.0 | (TODO) -- GDC | CNV__unfiltered__snp6 |
| TCGA-BH-A0HB-10A-01D-A059-01 | Affymetrix SNP 6.0 | (TODO) -- GDC | CNV__snp6 |
| TCGA-BH-A0HF-10A-01D-A059-01 | Affymetrix SNP 6.0 | (TODO) -- GDC | CNV__unfiltered__snp6 |
| TCGA-BH-A0HF-10A-01D-A059-01 | Affymetrix SNP 6.0 | (TODO) -- GDC | CNV__snp6 |
| TCGA-BH-A0HI-10A-01D-A087-01 | Affymetrix SNP 6.0 | (TODO) -- GDC | CNV__unfiltered__snp6 |
| TCGA-BH-A0HI-10A-01D-A087-01 | Affymetrix SNP 6.0 | (TODO) -- GDC | CNV__snp6 |
| TCGA-BH-A0HK-10A-01D-A059-01 | Affymetrix SNP 6.0 | (TODO) -- GDC | CNV__unfiltered__snp6 |
| TCGA-BH-A0HK-10A-01D-A059-01 | Affymetrix SNP 6.0 | (TODO) -- GDC | CNV__snp6 |
| TCGA-BH-A0HL-10A-11D-A037-01 | Affymetrix SNP 6.0 | (TODO) -- GDC | CNV__unfiltered__snp6 |
| TCGA-BH-A0HL-10A-11D-A037-01 | Affymetrix SNP 6.0 | (TODO) -- GDC | CNV__snp6 |
| TCGA-BH-A0HN-10A-01D-A087-01 | Affymetrix SNP 6.0 | (TODO) -- GDC | CNV__unfiltered__snp6 |
| TCGA-BH-A0HN-10A-01D-A087-01 | Affymetrix SNP 6.0 | (TODO) -- GDC | CNV__snp6 |
| TCGA-BH-A0HO-10A-01D-A037-01 | Affymetrix SNP 6.0 | (TODO) -- GDC | CNV__unfiltered__snp6 |
| TCGA-BH-A0HO-10A-01D-A037-01 | Affymetrix SNP 6.0 | (TODO) -- GDC | CNV__snp6 |
| TCGA-BH-A0HP-10A-01D-A087-01 | Affymetrix SNP 6.0 | (TODO) -- GDC | CNV__unfiltered__snp6 |
| TCGA-BH-A0HP-10A-01D-A087-01 | Affymetrix SNP 6.0 | (TODO) -- GDC | CNV__snp6 |
| TCGA-BH-A0HQ-10A-01D-A037-01 | Affymetrix SNP 6.0 | (TODO) -- GDC | CNV__unfiltered__snp6 |
| TCGA-BH-A0HQ-10A-01D-A037-01 | Affymetrix SNP 6.0 | (TODO) -- GDC | CNV__snp6 |
| TCGA-BH-A0HU-10A-01D-A037-01 | Affymetrix SNP 6.0 | (TODO) -- GDC | CNV__unfiltered__snp6 |
| TCGA-BH-A0HU-10A-01D-A037-01 | Affymetrix SNP 6.0 | (TODO) -- GDC | CNV__snp6 |
| TCGA-BH-A0HW-10A-01D-A037-01 | Affymetrix SNP 6.0 | (TODO) -- GDC | CNV__unfiltered__snp6 |
| TCGA-BH-A0HW-10A-01D-A037-01 | Affymetrix SNP 6.0 | (TODO) -- GDC | CNV__snp6 |
| TCGA-BH-A0HX-10A-02D-A059-01 | Affymetrix SNP 6.0 | (TODO) -- GDC | CNV__unfiltered__snp6 |
| TCGA-BH-A0HX-10A-02D-A059-01 | Affymetrix SNP 6.0 | (TODO) -- GDC | CNV__snp6 |
| TCGA-BH-A0HY-10A-02D-A059-01 | Affymetrix SNP 6.0 | (TODO) -- GDC | CNV__unfiltered__snp6 |
| TCGA-BH-A0HY-10A-02D-A059-01 | Affymetrix SNP 6.0 | (TODO) -- GDC | CNV__snp6 |
| TCGA-BH-A0RX-10A-01D-A087-01 | Affymetrix SNP 6.0 | (TODO) -- GDC | CNV__unfiltered__snp6 |
| TCGA-BH-A0RX-10A-01D-A087-01 | Affymetrix SNP 6.0 | (TODO) -- GDC | CNV__snp6 |
| TCGA-BH-A0W3-10A-01D-A107-01 | Affymetrix SNP 6.0 | (TODO) -- GDC | CNV__unfiltered__snp6 |
| TCGA-BH-A0W3-10A-01D-A107-01 | Affymetrix SNP 6.0 | (TODO) -- GDC | CNV__snp6 |
| TCGA-BH-A0W4-10A-01D-A107-01 | Affymetrix SNP 6.0 | (TODO) -- GDC | CNV__unfiltered__snp6 |
| TCGA-BH-A0W4-10A-01D-A107-01 | Affymetrix SNP 6.0 | (TODO) -- GDC | CNV__snp6 |
| TCGA-BH-A0W5-10A-01D-A107-01 | Affymetrix SNP 6.0 | (TODO) -- GDC | CNV__unfiltered__snp6 |
| TCGA-BH-A0W5-10A-01D-A107-01 | Affymetrix SNP 6.0 | (TODO) -- GDC | CNV__snp6 |
| TCGA-BH-A0W7-10A-01D-A113-01 | Affymetrix SNP 6.0 | (TODO) -- GDC | CNV__unfiltered__snp6 |
| TCGA-BH-A0W7-10A-01D-A113-01 | Affymetrix SNP 6.0 | (TODO) -- GDC | CNV__snp6 |
| TCGA-BH-A0WA-10A-01D-A107-01 | Affymetrix SNP 6.0 | (TODO) -- GDC | CNV__unfiltered__snp6 |
| TCGA-BH-A0WA-10A-01D-A107-01 | Affymetrix SNP 6.0 | (TODO) -- GDC | CNV__snp6 |
| TCGA-BH-A18G-10A-01D-A12A-01 | Affymetrix SNP 6.0 | (TODO) -- GDC | CNV__unfiltered__snp6 |
| TCGA-BH-A18G-10A-01D-A12A-01 | Affymetrix SNP 6.0 | (TODO) -- GDC | CNV__snp6 |
| TCGA-BH-A18H-10A-01D-A12A-01 | Affymetrix SNP 6.0 | (TODO) -- GDC | CNV__unfiltered__snp6 |
| TCGA-BH-A18H-10A-01D-A12A-01 | Affymetrix SNP 6.0 | (TODO) -- GDC | CNV__snp6 |
| TCGA-BH-A18I-10A-01D-A12A-01 | Affymetrix SNP 6.0 | (TODO) -- GDC | CNV__unfiltered__snp6 |
| TCGA-BH-A18I-10A-01D-A12A-01 | Affymetrix SNP 6.0 | (TODO) -- GDC | CNV__snp6 |
| TCGA-BH-A201-10A-01D-A14J-01 | Affymetrix SNP 6.0 | (TODO) -- GDC | CNV__unfiltered__snp6 |
| TCGA-BH-A201-10A-01D-A14J-01 | Affymetrix SNP 6.0 | (TODO) -- GDC | CNV__snp6 |
| TCGA-BH-A202-10A-01D-A14J-01 | Affymetrix SNP 6.0 | (TODO) -- GDC | CNV__unfiltered__snp6 |
| TCGA-BH-A202-10A-01D-A14J-01 | Affymetrix SNP 6.0 | (TODO) -- GDC | CNV__snp6 |
| TCGA-BH-A28O-10A-01D-A229-01 | Affymetrix SNP 6.0 | (TODO) -- GDC | CNV__unfiltered__snp6 |
| TCGA-BH-A28O-10A-01D-A229-01 | Affymetrix SNP 6.0 | (TODO) -- GDC | CNV__snp6 |
| TCGA-BH-A28Q-10A-01D-A16C-01 | Affymetrix SNP 6.0 | (TODO) -- GDC | CNV__unfiltered__snp6 |
| TCGA-BH-A28Q-10A-01D-A16C-01 | Affymetrix SNP 6.0 | (TODO) -- GDC | CNV__snp6 |
| TCGA-BH-A2L8-10A-01D-A18N-01 | Affymetrix SNP 6.0 | (TODO) -- GDC | CNV__unfiltered__snp6 |
| TCGA-BH-A2L8-10A-01D-A18N-01 | Affymetrix SNP 6.0 | (TODO) -- GDC | CNV__snp6 |
| TCGA-BH-A42T-10A-01D-A242-01 | Affymetrix SNP 6.0 | (TODO) -- GDC | CNV__unfiltered__snp6 |
| TCGA-BH-A42T-10A-01D-A242-01 | Affymetrix SNP 6.0 | (TODO) -- GDC | CNV__snp6 |
| TCGA-BH-A42U-10A-01D-A242-01 | Affymetrix SNP 6.0 | (TODO) -- GDC | CNV__unfiltered__snp6 |
| TCGA-BH-A42U-10A-01D-A242-01 | Affymetrix SNP 6.0 | (TODO) -- GDC | CNV__snp6 |
| TCGA-BH-A42V-10A-01D-A242-01 | Affymetrix SNP 6.0 | (TODO) -- GDC | CNV__unfiltered__snp6 |
| TCGA-BH-A42V-10A-01D-A242-01 | Affymetrix SNP 6.0 | (TODO) -- GDC | CNV__snp6 |
| TCGA-BH-A5IZ-10A-01D-A27O-01 | Affymetrix SNP 6.0 | (TODO) -- GDC | CNV__unfiltered__snp6 |
| TCGA-BH-A5IZ-10A-01D-A27O-01 | Affymetrix SNP 6.0 | (TODO) -- GDC | CNV__snp6 |
| TCGA-BH-A6R8-10A-01D-A33G-01 | Affymetrix SNP 6.0 | (TODO) -- GDC | CNV__unfiltered__snp6 |
| TCGA-BH-A6R8-10A-01D-A33G-01 | Affymetrix SNP 6.0 | (TODO) -- GDC | CNV__snp6 |
| TCGA-BH-A6R9-10A-01D-A32H-01 | Affymetrix SNP 6.0 | (TODO) -- GDC | CNV__unfiltered__snp6 |
| TCGA-BH-A6R9-10A-01D-A32H-01 | Affymetrix SNP 6.0 | (TODO) -- GDC | CNV__snp6 |
| TCGA-BH-A8FY-10A-01D-A36L-01 | Affymetrix SNP 6.0 | (TODO) -- GDC | CNV__unfiltered__snp6 |
| TCGA-BH-A8FY-10A-01D-A36L-01 | Affymetrix SNP 6.0 | (TODO) -- GDC | CNV__snp6 |
| TCGA-BH-A8FZ-10A-01D-A350-01 | Affymetrix SNP 6.0 | (TODO) -- GDC | CNV__unfiltered__snp6 |
| TCGA-BH-A8FZ-10A-01D-A350-01 | Affymetrix SNP 6.0 | (TODO) -- GDC | CNV__snp6 |
| TCGA-BH-A8G0-10A-01D-A350-01 | Affymetrix SNP 6.0 | (TODO) -- GDC | CNV__unfiltered__snp6 |
| TCGA-BH-A8G0-10A-01D-A350-01 | Affymetrix SNP 6.0 | (TODO) -- GDC | CNV__snp6 |
| TCGA-BH-AB28-10A-01D-A41E-01 | Affymetrix SNP 6.0 | (TODO) -- GDC | CNV__unfiltered__snp6 |
| TCGA-BH-AB28-10A-01D-A41E-01 | Affymetrix SNP 6.0 | (TODO) -- GDC | CNV__snp6 |
| TCGA-C8-A12K-10A-01D-A113-01 | Affymetrix SNP 6.0 | (TODO) -- GDC | CNV__unfiltered__snp6 |
| TCGA-C8-A12K-10A-01D-A113-01 | Affymetrix SNP 6.0 | (TODO) -- GDC | CNV__snp6 |
| TCGA-C8-A12L-10A-01D-A113-01 | Affymetrix SNP 6.0 | (TODO) -- GDC | CNV__unfiltered__snp6 |
| TCGA-C8-A12L-10A-01D-A113-01 | Affymetrix SNP 6.0 | (TODO) -- GDC | CNV__snp6 |
| TCGA-C8-A12M-10A-01D-A113-01 | Affymetrix SNP 6.0 | (TODO) -- GDC | CNV__unfiltered__snp6 |
| TCGA-C8-A12M-10A-01D-A113-01 | Affymetrix SNP 6.0 | (TODO) -- GDC | CNV__snp6 |
| TCGA-C8-A12N-10A-01D-A113-01 | Affymetrix SNP 6.0 | (TODO) -- GDC | CNV__unfiltered__snp6 |
| TCGA-C8-A12N-10A-01D-A113-01 | Affymetrix SNP 6.0 | (TODO) -- GDC | CNV__snp6 |
| TCGA-C8-A12O-10A-01D-A113-01 | Affymetrix SNP 6.0 | (TODO) -- GDC | CNV__unfiltered__snp6 |
| TCGA-C8-A12O-10A-01D-A113-01 | Affymetrix SNP 6.0 | (TODO) -- GDC | CNV__snp6 |
| TCGA-C8-A12P-10A-01D-A113-01 | Affymetrix SNP 6.0 | (TODO) -- GDC | CNV__unfiltered__snp6 |
| TCGA-C8-A12P-10A-01D-A113-01 | Affymetrix SNP 6.0 | (TODO) -- GDC | CNV__snp6 |
| TCGA-C8-A12Q-10A-01D-A113-01 | Affymetrix SNP 6.0 | (TODO) -- GDC | CNV__unfiltered__snp6 |
| TCGA-C8-A12Q-10A-01D-A113-01 | Affymetrix SNP 6.0 | (TODO) -- GDC | CNV__snp6 |
| TCGA-C8-A12T-10A-01D-A113-01 | Affymetrix SNP 6.0 | (TODO) -- GDC | CNV__unfiltered__snp6 |
| TCGA-C8-A12T-10A-01D-A113-01 | Affymetrix SNP 6.0 | (TODO) -- GDC | CNV__snp6 |
| TCGA-C8-A12U-10A-01D-A113-01 | Affymetrix SNP 6.0 | (TODO) -- GDC | CNV__unfiltered__snp6 |
| TCGA-C8-A12U-10A-01D-A113-01 | Affymetrix SNP 6.0 | (TODO) -- GDC | CNV__snp6 |
| TCGA-C8-A12V-10A-01D-A113-01 | Affymetrix SNP 6.0 | (TODO) -- GDC | CNV__unfiltered__snp6 |
| TCGA-C8-A12V-10A-01D-A113-01 | Affymetrix SNP 6.0 | (TODO) -- GDC | CNV__snp6 |
| TCGA-C8-A12W-10A-01D-A113-01 | Affymetrix SNP 6.0 | (TODO) -- GDC | CNV__unfiltered__snp6 |
| TCGA-C8-A12W-10A-01D-A113-01 | Affymetrix SNP 6.0 | (TODO) -- GDC | CNV__snp6 |
| TCGA-C8-A12X-10A-01D-A113-01 | Affymetrix SNP 6.0 | (TODO) -- GDC | CNV__unfiltered__snp6 |
| TCGA-C8-A12X-10A-01D-A113-01 | Affymetrix SNP 6.0 | (TODO) -- GDC | CNV__snp6 |
| TCGA-C8-A12Y-10A-01D-A12A-01 | Affymetrix SNP 6.0 | (TODO) -- GDC | CNV__unfiltered__snp6 |
| TCGA-C8-A12Y-10A-01D-A12A-01 | Affymetrix SNP 6.0 | (TODO) -- GDC | CNV__snp6 |
| TCGA-C8-A12Z-10A-01D-A113-01 | Affymetrix SNP 6.0 | (TODO) -- GDC | CNV__unfiltered__snp6 |
| TCGA-C8-A12Z-10A-01D-A113-01 | Affymetrix SNP 6.0 | (TODO) -- GDC | CNV__snp6 |
| TCGA-C8-A130-10A-01D-A113-01 | Affymetrix SNP 6.0 | (TODO) -- GDC | CNV__unfiltered__snp6 |
| TCGA-C8-A130-10A-01D-A113-01 | Affymetrix SNP 6.0 | (TODO) -- GDC | CNV__snp6 |
| TCGA-C8-A131-10A-01D-A113-01 | Affymetrix SNP 6.0 | (TODO) -- GDC | CNV__unfiltered__snp6 |
| TCGA-C8-A131-10A-01D-A113-01 | Affymetrix SNP 6.0 | (TODO) -- GDC | CNV__snp6 |
| TCGA-C8-A132-10A-01D-A113-01 | Affymetrix SNP 6.0 | (TODO) -- GDC | CNV__unfiltered__snp6 |
| TCGA-C8-A132-10A-01D-A113-01 | Affymetrix SNP 6.0 | (TODO) -- GDC | CNV__snp6 |
| TCGA-C8-A133-10A-01D-A12A-01 | Affymetrix SNP 6.0 | (TODO) -- GDC | CNV__unfiltered__snp6 |
| TCGA-C8-A133-10A-01D-A12A-01 | Affymetrix SNP 6.0 | (TODO) -- GDC | CNV__snp6 |
| TCGA-C8-A134-10A-01D-A113-01 | Affymetrix SNP 6.0 | (TODO) -- GDC | CNV__unfiltered__snp6 |
| TCGA-C8-A134-10A-01D-A113-01 | Affymetrix SNP 6.0 | (TODO) -- GDC | CNV__snp6 |
| TCGA-C8-A135-10A-02D-A113-01 | Affymetrix SNP 6.0 | (TODO) -- GDC | CNV__unfiltered__snp6 |
| TCGA-C8-A135-10A-02D-A113-01 | Affymetrix SNP 6.0 | (TODO) -- GDC | CNV__snp6 |
| TCGA-C8-A137-10A-02D-A113-01 | Affymetrix SNP 6.0 | (TODO) -- GDC | CNV__unfiltered__snp6 |
| TCGA-C8-A137-10A-02D-A113-01 | Affymetrix SNP 6.0 | (TODO) -- GDC | CNV__snp6 |
| TCGA-C8-A138-10A-01D-A113-01 | Affymetrix SNP 6.0 | (TODO) -- GDC | CNV__unfiltered__snp6 |
| TCGA-C8-A138-10A-01D-A113-01 | Affymetrix SNP 6.0 | (TODO) -- GDC | CNV__snp6 |
| TCGA-C8-A1HE-10A-01D-A13N-01 | Affymetrix SNP 6.0 | (TODO) -- GDC | CNV__unfiltered__snp6 |
| TCGA-C8-A1HE-10A-01D-A13N-01 | Affymetrix SNP 6.0 | (TODO) -- GDC | CNV__snp6 |
| TCGA-C8-A1HF-10A-01D-A134-01 | Affymetrix SNP 6.0 | (TODO) -- GDC | CNV__unfiltered__snp6 |
| TCGA-C8-A1HF-10A-01D-A134-01 | Affymetrix SNP 6.0 | (TODO) -- GDC | CNV__snp6 |
| TCGA-C8-A1HG-10A-01D-A134-01 | Affymetrix SNP 6.0 | (TODO) -- GDC | CNV__unfiltered__snp6 |
| TCGA-C8-A1HG-10A-01D-A134-01 | Affymetrix SNP 6.0 | (TODO) -- GDC | CNV__snp6 |
| TCGA-C8-A1HI-10A-01D-A134-01 | Affymetrix SNP 6.0 | (TODO) -- GDC | CNV__unfiltered__snp6 |
| TCGA-C8-A1HI-10A-01D-A134-01 | Affymetrix SNP 6.0 | (TODO) -- GDC | CNV__snp6 |
| TCGA-C8-A1HJ-10A-01D-A13N-01 | Affymetrix SNP 6.0 | (TODO) -- GDC | CNV__unfiltered__snp6 |
| TCGA-C8-A1HJ-10A-01D-A13N-01 | Affymetrix SNP 6.0 | (TODO) -- GDC | CNV__snp6 |
| TCGA-C8-A1HK-10A-01D-A13N-01 | Affymetrix SNP 6.0 | (TODO) -- GDC | CNV__unfiltered__snp6 |
| TCGA-C8-A1HK-10A-01D-A13N-01 | Affymetrix SNP 6.0 | (TODO) -- GDC | CNV__snp6 |
| TCGA-C8-A1HL-10A-01D-A134-01 | Affymetrix SNP 6.0 | (TODO) -- GDC | CNV__unfiltered__snp6 |
| TCGA-C8-A1HL-10A-01D-A134-01 | Affymetrix SNP 6.0 | (TODO) -- GDC | CNV__snp6 |
| TCGA-C8-A1HM-10A-01D-A134-01 | Affymetrix SNP 6.0 | (TODO) -- GDC | CNV__unfiltered__snp6 |
| TCGA-C8-A1HM-10A-01D-A134-01 | Affymetrix SNP 6.0 | (TODO) -- GDC | CNV__snp6 |
| TCGA-C8-A1HN-10A-01D-A134-01 | Affymetrix SNP 6.0 | (TODO) -- GDC | CNV__unfiltered__snp6 |
| TCGA-C8-A1HN-10A-01D-A134-01 | Affymetrix SNP 6.0 | (TODO) -- GDC | CNV__snp6 |
| TCGA-C8-A1HO-10A-01D-A13N-01 | Affymetrix SNP 6.0 | (TODO) -- GDC | CNV__unfiltered__snp6 |
| TCGA-C8-A1HO-10A-01D-A13N-01 | Affymetrix SNP 6.0 | (TODO) -- GDC | CNV__snp6 |
| TCGA-C8-A26V-10A-01D-A16C-01 | Affymetrix SNP 6.0 | (TODO) -- GDC | CNV__unfiltered__snp6 |
| TCGA-C8-A26V-10A-01D-A16C-01 | Affymetrix SNP 6.0 | (TODO) -- GDC | CNV__snp6 |
| TCGA-C8-A26W-10A-01D-A16C-01 | Affymetrix SNP 6.0 | (TODO) -- GDC | CNV__unfiltered__snp6 |
| TCGA-C8-A26W-10A-01D-A16C-01 | Affymetrix SNP 6.0 | (TODO) -- GDC | CNV__snp6 |
| TCGA-C8-A26X-10A-01D-A16C-01 | Affymetrix SNP 6.0 | (TODO) -- GDC | CNV__unfiltered__snp6 |
| TCGA-C8-A26X-10A-01D-A16C-01 | Affymetrix SNP 6.0 | (TODO) -- GDC | CNV__snp6 |
| TCGA-C8-A26Y-10A-01D-A16C-01 | Affymetrix SNP 6.0 | (TODO) -- GDC | CNV__unfiltered__snp6 |
| TCGA-C8-A26Y-10A-01D-A16C-01 | Affymetrix SNP 6.0 | (TODO) -- GDC | CNV__snp6 |
| TCGA-C8-A26Z-10A-01D-A16C-01 | Affymetrix SNP 6.0 | (TODO) -- GDC | CNV__unfiltered__snp6 |
| TCGA-C8-A26Z-10A-01D-A16C-01 | Affymetrix SNP 6.0 | (TODO) -- GDC | CNV__snp6 |
| TCGA-C8-A273-10A-01D-A16C-01 | Affymetrix SNP 6.0 | (TODO) -- GDC | CNV__unfiltered__snp6 |
| TCGA-C8-A273-10A-01D-A16C-01 | Affymetrix SNP 6.0 | (TODO) -- GDC | CNV__snp6 |
| TCGA-C8-A275-10A-01D-A16C-01 | Affymetrix SNP 6.0 | (TODO) -- GDC | CNV__unfiltered__snp6 |
| TCGA-C8-A275-10A-01D-A16C-01 | Affymetrix SNP 6.0 | (TODO) -- GDC | CNV__snp6 |
| TCGA-C8-A278-10A-01D-A166-01 | Affymetrix SNP 6.0 | (TODO) -- GDC | CNV__unfiltered__snp6 |
| TCGA-C8-A278-10A-01D-A166-01 | Affymetrix SNP 6.0 | (TODO) -- GDC | CNV__snp6 |
| TCGA-C8-A27A-10B-01D-A166-01 | Affymetrix SNP 6.0 | (TODO) -- GDC | CNV__unfiltered__snp6 |
| TCGA-C8-A27A-10B-01D-A166-01 | Affymetrix SNP 6.0 | (TODO) -- GDC | CNV__snp6 |
| TCGA-C8-A27B-10A-01D-A166-01 | Affymetrix SNP 6.0 | (TODO) -- GDC | CNV__unfiltered__snp6 |
| TCGA-C8-A27B-10A-01D-A166-01 | Affymetrix SNP 6.0 | (TODO) -- GDC | CNV__snp6 |
| TCGA-C8-A3M7-10A-01D-A21P-01 | Affymetrix SNP 6.0 | (TODO) -- GDC | CNV__unfiltered__snp6 |
| TCGA-C8-A3M7-10A-01D-A21P-01 | Affymetrix SNP 6.0 | (TODO) -- GDC | CNV__snp6 |
| TCGA-C8-A3M8-10A-01D-A20R-01 | Affymetrix SNP 6.0 | (TODO) -- GDC | CNV__unfiltered__snp6 |
| TCGA-C8-A3M8-10A-01D-A20R-01 | Affymetrix SNP 6.0 | (TODO) -- GDC | CNV__snp6 |
| TCGA-C8-A8HP-10A-01D-A36L-01 | Affymetrix SNP 6.0 | (TODO) -- GDC | CNV__unfiltered__snp6 |
| TCGA-C8-A8HP-10A-01D-A36L-01 | Affymetrix SNP 6.0 | (TODO) -- GDC | CNV__snp6 |
| TCGA-C8-A8HQ-10A-01D-A36L-01 | Affymetrix SNP 6.0 | (TODO) -- GDC | CNV__unfiltered__snp6 |
| TCGA-C8-A8HQ-10A-01D-A36L-01 | Affymetrix SNP 6.0 | (TODO) -- GDC | CNV__snp6 |
| TCGA-C8-A8HR-10A-01D-A36L-01 | Affymetrix SNP 6.0 | (TODO) -- GDC | CNV__unfiltered__snp6 |
| TCGA-C8-A8HR-10A-01D-A36L-01 | Affymetrix SNP 6.0 | (TODO) -- GDC | CNV__snp6 |
| TCGA-C8-A9FZ-10A-01D-A41E-01 | Affymetrix SNP 6.0 | (TODO) -- GDC | CNV__unfiltered__snp6 |
| TCGA-C8-A9FZ-10A-01D-A41E-01 | Affymetrix SNP 6.0 | (TODO) -- GDC | CNV__snp6 |
| TCGA-D8-A13Y-10A-01D-A113-01 | Affymetrix SNP 6.0 | (TODO) -- GDC | CNV__unfiltered__snp6 |
| TCGA-D8-A13Y-10A-01D-A113-01 | Affymetrix SNP 6.0 | (TODO) -- GDC | CNV__snp6 |
| TCGA-D8-A13Z-10A-01D-A113-01 | Affymetrix SNP 6.0 | (TODO) -- GDC | CNV__unfiltered__snp6 |
| TCGA-D8-A13Z-10A-01D-A113-01 | Affymetrix SNP 6.0 | (TODO) -- GDC | CNV__snp6 |
| TCGA-D8-A140-10A-01D-A113-01 | Affymetrix SNP 6.0 | (TODO) -- GDC | CNV__unfiltered__snp6 |
| TCGA-D8-A140-10A-01D-A113-01 | Affymetrix SNP 6.0 | (TODO) -- GDC | CNV__snp6 |
| TCGA-D8-A141-10A-01D-A113-01 | Affymetrix SNP 6.0 | (TODO) -- GDC | CNV__unfiltered__snp6 |
| TCGA-D8-A141-10A-01D-A113-01 | Affymetrix SNP 6.0 | (TODO) -- GDC | CNV__snp6 |
| TCGA-D8-A142-10A-01D-A113-01 | Affymetrix SNP 6.0 | (TODO) -- GDC | CNV__unfiltered__snp6 |
| TCGA-D8-A142-10A-01D-A113-01 | Affymetrix SNP 6.0 | (TODO) -- GDC | CNV__snp6 |
| TCGA-D8-A143-10A-01D-A113-01 | Affymetrix SNP 6.0 | (TODO) -- GDC | CNV__unfiltered__snp6 |
| TCGA-D8-A143-10A-01D-A113-01 | Affymetrix SNP 6.0 | (TODO) -- GDC | CNV__snp6 |
| TCGA-D8-A145-10A-01D-A113-01 | Affymetrix SNP 6.0 | (TODO) -- GDC | CNV__unfiltered__snp6 |
| TCGA-D8-A145-10A-01D-A113-01 | Affymetrix SNP 6.0 | (TODO) -- GDC | CNV__snp6 |
| TCGA-D8-A146-10A-01D-A113-01 | Affymetrix SNP 6.0 | (TODO) -- GDC | CNV__unfiltered__snp6 |
| TCGA-D8-A146-10A-01D-A113-01 | Affymetrix SNP 6.0 | (TODO) -- GDC | CNV__snp6 |
| TCGA-D8-A147-10A-01D-A113-01 | Affymetrix SNP 6.0 | (TODO) -- GDC | CNV__unfiltered__snp6 |
| TCGA-D8-A147-10A-01D-A113-01 | Affymetrix SNP 6.0 | (TODO) -- GDC | CNV__snp6 |
| TCGA-D8-A1J8-10A-01D-A13N-01 | Affymetrix SNP 6.0 | (TODO) -- GDC | CNV__unfiltered__snp6 |
| TCGA-D8-A1J8-10A-01D-A13N-01 | Affymetrix SNP 6.0 | (TODO) -- GDC | CNV__snp6 |
| TCGA-D8-A1J9-10A-01D-A13N-01 | Affymetrix SNP 6.0 | (TODO) -- GDC | CNV__unfiltered__snp6 |
| TCGA-D8-A1J9-10A-01D-A13N-01 | Affymetrix SNP 6.0 | (TODO) -- GDC | CNV__snp6 |
| TCGA-D8-A1JA-10A-01D-A13N-01 | Affymetrix SNP 6.0 | (TODO) -- GDC | CNV__unfiltered__snp6 |
| TCGA-D8-A1JA-10A-01D-A13N-01 | Affymetrix SNP 6.0 | (TODO) -- GDC | CNV__snp6 |
| TCGA-D8-A1JB-10A-01D-A13N-01 | Affymetrix SNP 6.0 | (TODO) -- GDC | CNV__unfiltered__snp6 |
| TCGA-D8-A1JB-10A-01D-A13N-01 | Affymetrix SNP 6.0 | (TODO) -- GDC | CNV__snp6 |
| TCGA-D8-A1JC-10A-01D-A13N-01 | Affymetrix SNP 6.0 | (TODO) -- GDC | CNV__unfiltered__snp6 |
| TCGA-D8-A1JC-10A-01D-A13N-01 | Affymetrix SNP 6.0 | (TODO) -- GDC | CNV__snp6 |
| TCGA-D8-A1JD-10A-01D-A13N-01 | Affymetrix SNP 6.0 | (TODO) -- GDC | CNV__unfiltered__snp6 |
| TCGA-D8-A1JD-10A-01D-A13N-01 | Affymetrix SNP 6.0 | (TODO) -- GDC | CNV__snp6 |
| TCGA-D8-A1JE-10A-01D-A13N-01 | Affymetrix SNP 6.0 | (TODO) -- GDC | CNV__unfiltered__snp6 |
| TCGA-D8-A1JE-10A-01D-A13N-01 | Affymetrix SNP 6.0 | (TODO) -- GDC | CNV__snp6 |
| TCGA-D8-A1JF-10A-01D-A13N-01 | Affymetrix SNP 6.0 | (TODO) -- GDC | CNV__unfiltered__snp6 |
| TCGA-D8-A1JF-10A-01D-A13N-01 | Affymetrix SNP 6.0 | (TODO) -- GDC | CNV__snp6 |
| TCGA-D8-A1JG-10A-01D-A13N-01 | Affymetrix SNP 6.0 | (TODO) -- GDC | CNV__unfiltered__snp6 |
| TCGA-D8-A1JG-10A-01D-A13N-01 | Affymetrix SNP 6.0 | (TODO) -- GDC | CNV__snp6 |
| TCGA-D8-A1JH-10A-01D-A13N-01 | Affymetrix SNP 6.0 | (TODO) -- GDC | CNV__unfiltered__snp6 |
| TCGA-D8-A1JH-10A-01D-A13N-01 | Affymetrix SNP 6.0 | (TODO) -- GDC | CNV__snp6 |
| TCGA-D8-A1JI-10A-01D-A13N-01 | Affymetrix SNP 6.0 | (TODO) -- GDC | CNV__unfiltered__snp6 |
| TCGA-D8-A1JI-10A-01D-A13N-01 | Affymetrix SNP 6.0 | (TODO) -- GDC | CNV__snp6 |
| TCGA-D8-A1JJ-10A-01D-A14J-01 | Affymetrix SNP 6.0 | (TODO) -- GDC | CNV__unfiltered__snp6 |
| TCGA-D8-A1JJ-10A-01D-A14J-01 | Affymetrix SNP 6.0 | (TODO) -- GDC | CNV__snp6 |
| TCGA-D8-A1JK-10A-01D-A13N-01 | Affymetrix SNP 6.0 | (TODO) -- GDC | CNV__unfiltered__snp6 |
| TCGA-D8-A1JK-10A-01D-A13N-01 | Affymetrix SNP 6.0 | (TODO) -- GDC | CNV__snp6 |
| TCGA-D8-A1JL-10A-01D-A13N-01 | Affymetrix SNP 6.0 | (TODO) -- GDC | CNV__unfiltered__snp6 |
| TCGA-D8-A1JL-10A-01D-A13N-01 | Affymetrix SNP 6.0 | (TODO) -- GDC | CNV__snp6 |
| TCGA-D8-A1JM-10A-01D-A13N-01 | Affymetrix SNP 6.0 | (TODO) -- GDC | CNV__unfiltered__snp6 |
| TCGA-D8-A1JM-10A-01D-A13N-01 | Affymetrix SNP 6.0 | (TODO) -- GDC | CNV__snp6 |
| TCGA-D8-A1JN-10A-01D-A13N-01 | Affymetrix SNP 6.0 | (TODO) -- GDC | CNV__unfiltered__snp6 |
| TCGA-D8-A1JN-10A-01D-A13N-01 | Affymetrix SNP 6.0 | (TODO) -- GDC | CNV__snp6 |
| TCGA-D8-A1JP-10A-01D-A13N-01 | Affymetrix SNP 6.0 | (TODO) -- GDC | CNV__unfiltered__snp6 |
| TCGA-D8-A1JP-10A-01D-A13N-01 | Affymetrix SNP 6.0 | (TODO) -- GDC | CNV__snp6 |
| TCGA-D8-A1JS-10A-01D-A13N-01 | Affymetrix SNP 6.0 | (TODO) -- GDC | CNV__unfiltered__snp6 |
| TCGA-D8-A1JS-10A-01D-A13N-01 | Affymetrix SNP 6.0 | (TODO) -- GDC | CNV__snp6 |
| TCGA-D8-A1JT-10A-01D-A13N-01 | Affymetrix SNP 6.0 | (TODO) -- GDC | CNV__unfiltered__snp6 |
| TCGA-D8-A1JT-10A-01D-A13N-01 | Affymetrix SNP 6.0 | (TODO) -- GDC | CNV__snp6 |
| TCGA-D8-A1JU-10A-01D-A13N-01 | Affymetrix SNP 6.0 | (TODO) -- GDC | CNV__unfiltered__snp6 |
| TCGA-D8-A1JU-10A-01D-A13N-01 | Affymetrix SNP 6.0 | (TODO) -- GDC | CNV__snp6 |
| TCGA-D8-A1X5-10A-01D-A14F-01 | Affymetrix SNP 6.0 | (TODO) -- GDC | CNV__unfiltered__snp6 |
| TCGA-D8-A1X5-10A-01D-A14F-01 | Affymetrix SNP 6.0 | (TODO) -- GDC | CNV__snp6 |
| TCGA-D8-A1X6-10A-01D-A14J-01 | Affymetrix SNP 6.0 | (TODO) -- GDC | CNV__unfiltered__snp6 |
| TCGA-D8-A1X6-10A-01D-A14J-01 | Affymetrix SNP 6.0 | (TODO) -- GDC | CNV__snp6 |
| TCGA-D8-A1X7-10A-01D-A14J-01 | Affymetrix SNP 6.0 | (TODO) -- GDC | CNV__unfiltered__snp6 |
| TCGA-D8-A1X7-10A-01D-A14J-01 | Affymetrix SNP 6.0 | (TODO) -- GDC | CNV__snp6 |
| TCGA-D8-A1X8-10A-01D-A14J-01 | Affymetrix SNP 6.0 | (TODO) -- GDC | CNV__unfiltered__snp6 |
| TCGA-D8-A1X8-10A-01D-A14J-01 | Affymetrix SNP 6.0 | (TODO) -- GDC | CNV__snp6 |
| TCGA-D8-A1X9-10A-01D-A160-01 | Affymetrix SNP 6.0 | (TODO) -- GDC | CNV__unfiltered__snp6 |
| TCGA-D8-A1X9-10A-01D-A160-01 | Affymetrix SNP 6.0 | (TODO) -- GDC | CNV__snp6 |
| TCGA-D8-A1XA-10A-01D-A14F-01 | Affymetrix SNP 6.0 | (TODO) -- GDC | CNV__unfiltered__snp6 |
| TCGA-D8-A1XA-10A-01D-A14F-01 | Affymetrix SNP 6.0 | (TODO) -- GDC | CNV__snp6 |
| TCGA-D8-A1XB-10A-01D-A14F-01 | Affymetrix SNP 6.0 | (TODO) -- GDC | CNV__unfiltered__snp6 |
| TCGA-D8-A1XB-10A-01D-A14F-01 | Affymetrix SNP 6.0 | (TODO) -- GDC | CNV__snp6 |
| TCGA-D8-A1XC-10A-01D-A14F-01 | Affymetrix SNP 6.0 | (TODO) -- GDC | CNV__unfiltered__snp6 |
| TCGA-D8-A1XC-10A-01D-A14F-01 | Affymetrix SNP 6.0 | (TODO) -- GDC | CNV__snp6 |
| TCGA-D8-A1XF-10A-01D-A14F-01 | Affymetrix SNP 6.0 | (TODO) -- GDC | CNV__unfiltered__snp6 |
| TCGA-D8-A1XF-10A-01D-A14F-01 | Affymetrix SNP 6.0 | (TODO) -- GDC | CNV__snp6 |
| TCGA-D8-A1XG-10A-01D-A14F-01 | Affymetrix SNP 6.0 | (TODO) -- GDC | CNV__unfiltered__snp6 |
| TCGA-D8-A1XG-10A-01D-A14F-01 | Affymetrix SNP 6.0 | (TODO) -- GDC | CNV__snp6 |
| TCGA-D8-A1XJ-10A-01D-A14J-01 | Affymetrix SNP 6.0 | (TODO) -- GDC | CNV__unfiltered__snp6 |
| TCGA-D8-A1XJ-10A-01D-A14J-01 | Affymetrix SNP 6.0 | (TODO) -- GDC | CNV__snp6 |
| TCGA-D8-A1XK-10A-01D-A14J-01 | Affymetrix SNP 6.0 | (TODO) -- GDC | CNV__unfiltered__snp6 |
| TCGA-D8-A1XK-10A-01D-A14J-01 | Affymetrix SNP 6.0 | (TODO) -- GDC | CNV__snp6 |
| TCGA-D8-A1XL-10A-01D-A14J-01 | Affymetrix SNP 6.0 | (TODO) -- GDC | CNV__unfiltered__snp6 |
| TCGA-D8-A1XL-10A-01D-A14J-01 | Affymetrix SNP 6.0 | (TODO) -- GDC | CNV__snp6 |
| TCGA-D8-A1XM-10A-01D-A14J-01 | Affymetrix SNP 6.0 | (TODO) -- GDC | CNV__unfiltered__snp6 |
| TCGA-D8-A1XM-10A-01D-A14J-01 | Affymetrix SNP 6.0 | (TODO) -- GDC | CNV__snp6 |
| TCGA-D8-A1XO-10A-01D-A14J-01 | Affymetrix SNP 6.0 | (TODO) -- GDC | CNV__unfiltered__snp6 |
| TCGA-D8-A1XO-10A-01D-A14J-01 | Affymetrix SNP 6.0 | (TODO) -- GDC | CNV__snp6 |
| TCGA-D8-A1XQ-10A-01D-A14J-01 | Affymetrix SNP 6.0 | (TODO) -- GDC | CNV__unfiltered__snp6 |
| TCGA-D8-A1XQ-10A-01D-A14J-01 | Affymetrix SNP 6.0 | (TODO) -- GDC | CNV__snp6 |
| TCGA-D8-A1XR-10A-01D-A14J-01 | Affymetrix SNP 6.0 | (TODO) -- GDC | CNV__unfiltered__snp6 |
| TCGA-D8-A1XR-10A-01D-A14J-01 | Affymetrix SNP 6.0 | (TODO) -- GDC | CNV__snp6 |
| TCGA-D8-A1XS-10A-01D-A14J-01 | Affymetrix SNP 6.0 | (TODO) -- GDC | CNV__unfiltered__snp6 |
| TCGA-D8-A1XS-10A-01D-A14J-01 | Affymetrix SNP 6.0 | (TODO) -- GDC | CNV__snp6 |
| TCGA-D8-A1XT-10A-01D-A14J-01 | Affymetrix SNP 6.0 | (TODO) -- GDC | CNV__unfiltered__snp6 |
| TCGA-D8-A1XT-10A-01D-A14J-01 | Affymetrix SNP 6.0 | (TODO) -- GDC | CNV__snp6 |
| TCGA-D8-A1XU-10A-01D-A14J-01 | Affymetrix SNP 6.0 | (TODO) -- GDC | CNV__unfiltered__snp6 |
| TCGA-D8-A1XU-10A-01D-A14J-01 | Affymetrix SNP 6.0 | (TODO) -- GDC | CNV__snp6 |
| TCGA-D8-A1XV-10A-01D-A14J-01 | Affymetrix SNP 6.0 | (TODO) -- GDC | CNV__unfiltered__snp6 |
| TCGA-D8-A1XV-10A-01D-A14J-01 | Affymetrix SNP 6.0 | (TODO) -- GDC | CNV__snp6 |
| TCGA-D8-A1XW-10A-01D-A14J-01 | Affymetrix SNP 6.0 | (TODO) -- GDC | CNV__unfiltered__snp6 |
| TCGA-D8-A1XW-10A-01D-A14J-01 | Affymetrix SNP 6.0 | (TODO) -- GDC | CNV__snp6 |
| TCGA-D8-A1XY-10A-01D-A14J-01 | Affymetrix SNP 6.0 | (TODO) -- GDC | CNV__unfiltered__snp6 |
| TCGA-D8-A1XY-10A-01D-A14J-01 | Affymetrix SNP 6.0 | (TODO) -- GDC | CNV__snp6 |
| TCGA-D8-A1XZ-10A-01D-A14J-01 | Affymetrix SNP 6.0 | (TODO) -- GDC | CNV__unfiltered__snp6 |
| TCGA-D8-A1XZ-10A-01D-A14J-01 | Affymetrix SNP 6.0 | (TODO) -- GDC | CNV__snp6 |
| TCGA-D8-A1Y0-10A-01D-A14J-01 | Affymetrix SNP 6.0 | (TODO) -- GDC | CNV__unfiltered__snp6 |
| TCGA-D8-A1Y0-10A-01D-A14J-01 | Affymetrix SNP 6.0 | (TODO) -- GDC | CNV__snp6 |
| TCGA-D8-A1Y2-10A-01D-A160-01 | Affymetrix SNP 6.0 | (TODO) -- GDC | CNV__unfiltered__snp6 |
| TCGA-D8-A1Y2-10A-01D-A160-01 | Affymetrix SNP 6.0 | (TODO) -- GDC | CNV__snp6 |
| TCGA-D8-A1Y3-10A-01D-A160-01 | Affymetrix SNP 6.0 | (TODO) -- GDC | CNV__unfiltered__snp6 |
| TCGA-D8-A1Y3-10A-01D-A160-01 | Affymetrix SNP 6.0 | (TODO) -- GDC | CNV__snp6 |
| TCGA-D8-A27F-10A-01D-A16C-01 | Affymetrix SNP 6.0 | (TODO) -- GDC | CNV__unfiltered__snp6 |
| TCGA-D8-A27F-10A-01D-A16C-01 | Affymetrix SNP 6.0 | (TODO) -- GDC | CNV__snp6 |
| TCGA-D8-A27G-10A-01D-A16C-01 | Affymetrix SNP 6.0 | (TODO) -- GDC | CNV__unfiltered__snp6 |
| TCGA-D8-A27G-10A-01D-A16C-01 | Affymetrix SNP 6.0 | (TODO) -- GDC | CNV__snp6 |
| TCGA-D8-A27H-10A-01D-A16C-01 | Affymetrix SNP 6.0 | (TODO) -- GDC | CNV__unfiltered__snp6 |
| TCGA-D8-A27H-10A-01D-A16C-01 | Affymetrix SNP 6.0 | (TODO) -- GDC | CNV__snp6 |
| TCGA-D8-A27I-10A-02D-A16C-01 | Affymetrix SNP 6.0 | (TODO) -- GDC | CNV__unfiltered__snp6 |
| TCGA-D8-A27I-10A-02D-A16C-01 | Affymetrix SNP 6.0 | (TODO) -- GDC | CNV__snp6 |
| TCGA-D8-A27K-10A-01D-A16C-01 | Affymetrix SNP 6.0 | (TODO) -- GDC | CNV__unfiltered__snp6 |
| TCGA-D8-A27K-10A-01D-A16C-01 | Affymetrix SNP 6.0 | (TODO) -- GDC | CNV__snp6 |
| TCGA-D8-A27L-10A-01D-A16C-01 | Affymetrix SNP 6.0 | (TODO) -- GDC | CNV__unfiltered__snp6 |
| TCGA-D8-A27L-10A-01D-A16C-01 | Affymetrix SNP 6.0 | (TODO) -- GDC | CNV__snp6 |
| TCGA-D8-A27M-10A-01D-A16C-01 | Affymetrix SNP 6.0 | (TODO) -- GDC | CNV__unfiltered__snp6 |
| TCGA-D8-A27M-10A-01D-A16C-01 | Affymetrix SNP 6.0 | (TODO) -- GDC | CNV__snp6 |
| TCGA-D8-A27N-10A-01D-A16C-01 | Affymetrix SNP 6.0 | (TODO) -- GDC | CNV__unfiltered__snp6 |
| TCGA-D8-A27N-10A-01D-A16C-01 | Affymetrix SNP 6.0 | (TODO) -- GDC | CNV__snp6 |
| TCGA-D8-A27P-10A-01D-A16C-01 | Affymetrix SNP 6.0 | (TODO) -- GDC | CNV__unfiltered__snp6 |
| TCGA-D8-A27P-10A-01D-A16C-01 | Affymetrix SNP 6.0 | (TODO) -- GDC | CNV__snp6 |
| TCGA-D8-A27R-10A-01D-A16C-01 | Affymetrix SNP 6.0 | (TODO) -- GDC | CNV__unfiltered__snp6 |
| TCGA-D8-A27R-10A-01D-A16C-01 | Affymetrix SNP 6.0 | (TODO) -- GDC | CNV__snp6 |
| TCGA-D8-A27T-10A-01D-A16C-01 | Affymetrix SNP 6.0 | (TODO) -- GDC | CNV__unfiltered__snp6 |
| TCGA-D8-A27T-10A-01D-A16C-01 | Affymetrix SNP 6.0 | (TODO) -- GDC | CNV__snp6 |
| TCGA-D8-A27V-10A-01D-A17C-01 | Affymetrix SNP 6.0 | (TODO) -- GDC | CNV__unfiltered__snp6 |
| TCGA-D8-A27V-10A-01D-A17C-01 | Affymetrix SNP 6.0 | (TODO) -- GDC | CNV__snp6 |
| TCGA-D8-A27W-10A-01D-A16C-01 | Affymetrix SNP 6.0 | (TODO) -- GDC | CNV__unfiltered__snp6 |
| TCGA-D8-A27W-10A-01D-A16C-01 | Affymetrix SNP 6.0 | (TODO) -- GDC | CNV__snp6 |
| TCGA-D8-A3Z5-10A-01D-A242-01 | Affymetrix SNP 6.0 | (TODO) -- GDC | CNV__unfiltered__snp6 |
| TCGA-D8-A3Z5-10A-01D-A242-01 | Affymetrix SNP 6.0 | (TODO) -- GDC | CNV__snp6 |
| TCGA-D8-A3Z6-10A-01D-A238-01 | Affymetrix SNP 6.0 | (TODO) -- GDC | CNV__unfiltered__snp6 |
| TCGA-D8-A3Z6-10A-01D-A238-01 | Affymetrix SNP 6.0 | (TODO) -- GDC | CNV__snp6 |
| TCGA-D8-A4Z1-10A-01D-A25N-01 | Affymetrix SNP 6.0 | (TODO) -- GDC | CNV__unfiltered__snp6 |
| TCGA-D8-A4Z1-10A-01D-A25N-01 | Affymetrix SNP 6.0 | (TODO) -- GDC | CNV__snp6 |
| TCGA-D8-A73U-10A-21D-A33G-01 | Affymetrix SNP 6.0 | (TODO) -- GDC | CNV__unfiltered__snp6 |
| TCGA-D8-A73U-10A-21D-A33G-01 | Affymetrix SNP 6.0 | (TODO) -- GDC | CNV__snp6 |
| TCGA-D8-A73W-10A-21D-A350-01 | Affymetrix SNP 6.0 | (TODO) -- GDC | CNV__unfiltered__snp6 |
| TCGA-D8-A73W-10A-21D-A350-01 | Affymetrix SNP 6.0 | (TODO) -- GDC | CNV__snp6 |
| TCGA-D8-A73X-10A-21D-A32H-01 | Affymetrix SNP 6.0 | (TODO) -- GDC | CNV__unfiltered__snp6 |
| TCGA-D8-A73X-10A-21D-A32H-01 | Affymetrix SNP 6.0 | (TODO) -- GDC | CNV__snp6 |
| TCGA-E2-A105-10A-01D-A10L-01 | Affymetrix SNP 6.0 | (TODO) -- GDC | CNV__unfiltered__snp6 |
| TCGA-E2-A105-10A-01D-A10L-01 | Affymetrix SNP 6.0 | (TODO) -- GDC | CNV__snp6 |
| TCGA-E2-A106-10A-01D-A10L-01 | Affymetrix SNP 6.0 | (TODO) -- GDC | CNV__unfiltered__snp6 |
| TCGA-E2-A106-10A-01D-A10L-01 | Affymetrix SNP 6.0 | (TODO) -- GDC | CNV__snp6 |
| TCGA-E2-A107-10A-01D-A10L-01 | Affymetrix SNP 6.0 | (TODO) -- GDC | CNV__unfiltered__snp6 |
| TCGA-E2-A107-10A-01D-A10L-01 | Affymetrix SNP 6.0 | (TODO) -- GDC | CNV__snp6 |
| TCGA-E2-A108-10A-01D-A10L-01 | Affymetrix SNP 6.0 | (TODO) -- GDC | CNV__unfiltered__snp6 |
| TCGA-E2-A108-10A-01D-A10L-01 | Affymetrix SNP 6.0 | (TODO) -- GDC | CNV__snp6 |
| TCGA-E2-A109-10A-01D-A10L-01 | Affymetrix SNP 6.0 | (TODO) -- GDC | CNV__unfiltered__snp6 |
| TCGA-E2-A109-10A-01D-A10L-01 | Affymetrix SNP 6.0 | (TODO) -- GDC | CNV__snp6 |
| TCGA-E2-A10A-10A-01D-A113-01 | Affymetrix SNP 6.0 | (TODO) -- GDC | CNV__unfiltered__snp6 |
| TCGA-E2-A10A-10A-01D-A113-01 | Affymetrix SNP 6.0 | (TODO) -- GDC | CNV__snp6 |
| TCGA-E2-A10C-10A-01D-A10L-01 | Affymetrix SNP 6.0 | (TODO) -- GDC | CNV__unfiltered__snp6 |
| TCGA-E2-A10C-10A-01D-A10L-01 | Affymetrix SNP 6.0 | (TODO) -- GDC | CNV__snp6 |
| TCGA-E2-A10F-10A-01D-A10L-01 | Affymetrix SNP 6.0 | (TODO) -- GDC | CNV__unfiltered__snp6 |
| TCGA-E2-A10F-10A-01D-A10L-01 | Affymetrix SNP 6.0 | (TODO) -- GDC | CNV__snp6 |
| TCGA-E2-A14N-10A-01D-A134-01 | Affymetrix SNP 6.0 | (TODO) -- GDC | CNV__unfiltered__snp6 |
| TCGA-E2-A14N-10A-01D-A134-01 | Affymetrix SNP 6.0 | (TODO) -- GDC | CNV__snp6 |
| TCGA-E2-A14O-10A-01D-A113-01 | Affymetrix SNP 6.0 | (TODO) -- GDC | CNV__unfiltered__snp6 |
| TCGA-E2-A14O-10A-01D-A113-01 | Affymetrix SNP 6.0 | (TODO) -- GDC | CNV__snp6 |
| TCGA-E2-A14P-10A-01D-A12A-01 | Affymetrix SNP 6.0 | (TODO) -- GDC | CNV__unfiltered__snp6 |
| TCGA-E2-A14P-10A-01D-A12A-01 | Affymetrix SNP 6.0 | (TODO) -- GDC | CNV__snp6 |
| TCGA-E2-A14Q-10A-01D-A12A-01 | Affymetrix SNP 6.0 | (TODO) -- GDC | CNV__unfiltered__snp6 |
| TCGA-E2-A14Q-10A-01D-A12A-01 | Affymetrix SNP 6.0 | (TODO) -- GDC | CNV__snp6 |
| TCGA-E2-A14R-10A-01D-A113-01 | Affymetrix SNP 6.0 | (TODO) -- GDC | CNV__unfiltered__snp6 |
| TCGA-E2-A14R-10A-01D-A113-01 | Affymetrix SNP 6.0 | (TODO) -- GDC | CNV__snp6 |
| TCGA-E2-A14S-10A-01D-A12A-01 | Affymetrix SNP 6.0 | (TODO) -- GDC | CNV__unfiltered__snp6 |
| TCGA-E2-A14S-10A-01D-A12A-01 | Affymetrix SNP 6.0 | (TODO) -- GDC | CNV__snp6 |
| TCGA-E2-A14T-10A-01D-A113-01 | Affymetrix SNP 6.0 | (TODO) -- GDC | CNV__unfiltered__snp6 |
| TCGA-E2-A14T-10A-01D-A113-01 | Affymetrix SNP 6.0 | (TODO) -- GDC | CNV__snp6 |
| TCGA-E2-A14U-10A-01D-A229-01 | Affymetrix SNP 6.0 | (TODO) -- GDC | CNV__unfiltered__snp6 |
| TCGA-E2-A14U-10A-01D-A229-01 | Affymetrix SNP 6.0 | (TODO) -- GDC | CNV__snp6 |
| TCGA-E2-A14V-10A-01D-A12A-01 | Affymetrix SNP 6.0 | (TODO) -- GDC | CNV__unfiltered__snp6 |
| TCGA-E2-A14V-10A-01D-A12A-01 | Affymetrix SNP 6.0 | (TODO) -- GDC | CNV__snp6 |
| TCGA-E2-A14X-10A-01D-A113-01 | Affymetrix SNP 6.0 | (TODO) -- GDC | CNV__unfiltered__snp6 |
| TCGA-E2-A14X-10A-01D-A113-01 | Affymetrix SNP 6.0 | (TODO) -- GDC | CNV__snp6 |
| TCGA-E2-A14Y-10A-01D-A12A-01 | Affymetrix SNP 6.0 | (TODO) -- GDC | CNV__unfiltered__snp6 |
| TCGA-E2-A14Y-10A-01D-A12A-01 | Affymetrix SNP 6.0 | (TODO) -- GDC | CNV__snp6 |
| TCGA-E2-A14Z-10A-01D-A113-01 | Affymetrix SNP 6.0 | (TODO) -- GDC | CNV__unfiltered__snp6 |
| TCGA-E2-A14Z-10A-01D-A113-01 | Affymetrix SNP 6.0 | (TODO) -- GDC | CNV__snp6 |
| TCGA-E2-A150-10A-01D-A12A-01 | Affymetrix SNP 6.0 | (TODO) -- GDC | CNV__unfiltered__snp6 |
| TCGA-E2-A150-10A-01D-A12A-01 | Affymetrix SNP 6.0 | (TODO) -- GDC | CNV__snp6 |
| TCGA-E2-A152-10A-01D-A12A-01 | Affymetrix SNP 6.0 | (TODO) -- GDC | CNV__unfiltered__snp6 |
| TCGA-E2-A152-10A-01D-A12A-01 | Affymetrix SNP 6.0 | (TODO) -- GDC | CNV__snp6 |
| TCGA-E2-A153-10A-01D-A12A-01 | Affymetrix SNP 6.0 | (TODO) -- GDC | CNV__unfiltered__snp6 |
| TCGA-E2-A153-10A-01D-A12A-01 | Affymetrix SNP 6.0 | (TODO) -- GDC | CNV__snp6 |
| TCGA-E2-A154-10A-01D-A113-01 | Affymetrix SNP 6.0 | (TODO) -- GDC | CNV__unfiltered__snp6 |
| TCGA-E2-A154-10A-01D-A113-01 | Affymetrix SNP 6.0 | (TODO) -- GDC | CNV__snp6 |
| TCGA-E2-A155-10A-01D-A12A-01 | Affymetrix SNP 6.0 | (TODO) -- GDC | CNV__unfiltered__snp6 |
| TCGA-E2-A155-10A-01D-A12A-01 | Affymetrix SNP 6.0 | (TODO) -- GDC | CNV__snp6 |
| TCGA-E2-A156-10A-01D-A12A-01 | Affymetrix SNP 6.0 | (TODO) -- GDC | CNV__unfiltered__snp6 |
| TCGA-E2-A156-10A-01D-A12A-01 | Affymetrix SNP 6.0 | (TODO) -- GDC | CNV__snp6 |
| TCGA-E2-A158-10A-01D-A12A-01 | Affymetrix SNP 6.0 | (TODO) -- GDC | CNV__unfiltered__snp6 |
| TCGA-E2-A158-10A-01D-A12A-01 | Affymetrix SNP 6.0 | (TODO) -- GDC | CNV__snp6 |
| TCGA-E2-A159-10A-01D-A113-01 | Affymetrix SNP 6.0 | (TODO) -- GDC | CNV__unfiltered__snp6 |
| TCGA-E2-A159-10A-01D-A113-01 | Affymetrix SNP 6.0 | (TODO) -- GDC | CNV__snp6 |
| TCGA-E2-A15A-10A-01D-A12A-01 | Affymetrix SNP 6.0 | (TODO) -- GDC | CNV__unfiltered__snp6 |
| TCGA-E2-A15A-10A-01D-A12A-01 | Affymetrix SNP 6.0 | (TODO) -- GDC | CNV__snp6 |
| TCGA-E2-A15C-10A-01D-A12A-01 | Affymetrix SNP 6.0 | (TODO) -- GDC | CNV__unfiltered__snp6 |
| TCGA-E2-A15C-10A-01D-A12A-01 | Affymetrix SNP 6.0 | (TODO) -- GDC | CNV__snp6 |
| TCGA-E2-A15D-10A-01D-A113-01 | Affymetrix SNP 6.0 | (TODO) -- GDC | CNV__unfiltered__snp6 |
| TCGA-E2-A15D-10A-01D-A113-01 | Affymetrix SNP 6.0 | (TODO) -- GDC | CNV__snp6 |
| TCGA-E2-A15E-10A-01D-A12A-01 | Affymetrix SNP 6.0 | (TODO) -- GDC | CNV__unfiltered__snp6 |
| TCGA-E2-A15E-10A-01D-A12A-01 | Affymetrix SNP 6.0 | (TODO) -- GDC | CNV__snp6 |
| TCGA-E2-A15F-10A-01D-A113-01 | Affymetrix SNP 6.0 | (TODO) -- GDC | CNV__unfiltered__snp6 |
| TCGA-E2-A15F-10A-01D-A113-01 | Affymetrix SNP 6.0 | (TODO) -- GDC | CNV__snp6 |
| TCGA-E2-A15G-10A-01D-A12A-01 | Affymetrix SNP 6.0 | (TODO) -- GDC | CNV__unfiltered__snp6 |
| TCGA-E2-A15G-10A-01D-A12A-01 | Affymetrix SNP 6.0 | (TODO) -- GDC | CNV__snp6 |
| TCGA-E2-A15H-10A-01D-A12A-01 | Affymetrix SNP 6.0 | (TODO) -- GDC | CNV__unfiltered__snp6 |
| TCGA-E2-A15H-10A-01D-A12A-01 | Affymetrix SNP 6.0 | (TODO) -- GDC | CNV__snp6 |
| TCGA-E2-A15I-10A-01D-A134-01 | Affymetrix SNP 6.0 | (TODO) -- GDC | CNV__unfiltered__snp6 |
| TCGA-E2-A15I-10A-01D-A134-01 | Affymetrix SNP 6.0 | (TODO) -- GDC | CNV__snp6 |
| TCGA-E2-A15K-10A-01D-A12N-01 | Affymetrix SNP 6.0 | (TODO) -- GDC | CNV__unfiltered__snp6 |
| TCGA-E2-A15K-10A-01D-A12N-01 | Affymetrix SNP 6.0 | (TODO) -- GDC | CNV__snp6 |
| TCGA-E2-A15L-10A-01D-A12A-01 | Affymetrix SNP 6.0 | (TODO) -- GDC | CNV__unfiltered__snp6 |
| TCGA-E2-A15L-10A-01D-A12A-01 | Affymetrix SNP 6.0 | (TODO) -- GDC | CNV__snp6 |
| TCGA-E2-A15M-10A-01D-A12A-01 | Affymetrix SNP 6.0 | (TODO) -- GDC | CNV__unfiltered__snp6 |
| TCGA-E2-A15M-10A-01D-A12A-01 | Affymetrix SNP 6.0 | (TODO) -- GDC | CNV__snp6 |
| TCGA-E2-A15O-10A-01D-A113-01 | Affymetrix SNP 6.0 | (TODO) -- GDC | CNV__unfiltered__snp6 |
| TCGA-E2-A15O-10A-01D-A113-01 | Affymetrix SNP 6.0 | (TODO) -- GDC | CNV__snp6 |
| TCGA-E2-A15P-10A-01D-A113-01 | Affymetrix SNP 6.0 | (TODO) -- GDC | CNV__unfiltered__snp6 |
| TCGA-E2-A15P-10A-01D-A113-01 | Affymetrix SNP 6.0 | (TODO) -- GDC | CNV__snp6 |
| TCGA-E2-A15R-10A-01D-A113-01 | Affymetrix SNP 6.0 | (TODO) -- GDC | CNV__unfiltered__snp6 |
| TCGA-E2-A15R-10A-01D-A113-01 | Affymetrix SNP 6.0 | (TODO) -- GDC | CNV__snp6 |
| TCGA-E2-A15S-10A-01D-A113-01 | Affymetrix SNP 6.0 | (TODO) -- GDC | CNV__unfiltered__snp6 |
| TCGA-E2-A15S-10A-01D-A113-01 | Affymetrix SNP 6.0 | (TODO) -- GDC | CNV__snp6 |
| TCGA-E2-A15T-10A-01D-A113-01 | Affymetrix SNP 6.0 | (TODO) -- GDC | CNV__unfiltered__snp6 |
| TCGA-E2-A15T-10A-01D-A113-01 | Affymetrix SNP 6.0 | (TODO) -- GDC | CNV__snp6 |
| TCGA-E2-A1B0-10A-01D-A12N-01 | Affymetrix SNP 6.0 | (TODO) -- GDC | CNV__unfiltered__snp6 |
| TCGA-E2-A1B0-10A-01D-A12N-01 | Affymetrix SNP 6.0 | (TODO) -- GDC | CNV__snp6 |
| TCGA-E2-A1B1-10A-01D-A12N-01 | Affymetrix SNP 6.0 | (TODO) -- GDC | CNV__unfiltered__snp6 |
| TCGA-E2-A1B1-10A-01D-A12N-01 | Affymetrix SNP 6.0 | (TODO) -- GDC | CNV__snp6 |
| TCGA-E2-A1B4-10A-01D-A12N-01 | Affymetrix SNP 6.0 | (TODO) -- GDC | CNV__unfiltered__snp6 |
| TCGA-E2-A1B4-10A-01D-A12N-01 | Affymetrix SNP 6.0 | (TODO) -- GDC | CNV__snp6 |
| TCGA-E2-A1B5-10A-01D-A12N-01 | Affymetrix SNP 6.0 | (TODO) -- GDC | CNV__unfiltered__snp6 |
| TCGA-E2-A1B5-10A-01D-A12N-01 | Affymetrix SNP 6.0 | (TODO) -- GDC | CNV__snp6 |
| TCGA-E2-A1B6-10A-01D-A12N-01 | Affymetrix SNP 6.0 | (TODO) -- GDC | CNV__unfiltered__snp6 |
| TCGA-E2-A1B6-10A-01D-A12N-01 | Affymetrix SNP 6.0 | (TODO) -- GDC | CNV__snp6 |
| TCGA-E2-A1BC-10A-01D-A12N-01 | Affymetrix SNP 6.0 | (TODO) -- GDC | CNV__unfiltered__snp6 |
| TCGA-E2-A1BC-10A-01D-A12N-01 | Affymetrix SNP 6.0 | (TODO) -- GDC | CNV__snp6 |
| TCGA-E2-A1BD-10A-01D-A12N-01 | Affymetrix SNP 6.0 | (TODO) -- GDC | CNV__unfiltered__snp6 |
| TCGA-E2-A1BD-10A-01D-A12N-01 | Affymetrix SNP 6.0 | (TODO) -- GDC | CNV__snp6 |
| TCGA-E2-A1IE-10A-01D-A13N-01 | Affymetrix SNP 6.0 | (TODO) -- GDC | CNV__unfiltered__snp6 |
| TCGA-E2-A1IE-10A-01D-A13N-01 | Affymetrix SNP 6.0 | (TODO) -- GDC | CNV__snp6 |
| TCGA-E2-A1IF-10A-01D-A141-01 | Affymetrix SNP 6.0 | (TODO) -- GDC | CNV__unfiltered__snp6 |
| TCGA-E2-A1IF-10A-01D-A141-01 | Affymetrix SNP 6.0 | (TODO) -- GDC | CNV__snp6 |
| TCGA-E2-A1IG-10A-01D-A141-01 | Affymetrix SNP 6.0 | (TODO) -- GDC | CNV__unfiltered__snp6 |
| TCGA-E2-A1IG-10A-01D-A141-01 | Affymetrix SNP 6.0 | (TODO) -- GDC | CNV__snp6 |
| TCGA-E2-A1IH-10A-01D-A13N-01 | Affymetrix SNP 6.0 | (TODO) -- GDC | CNV__unfiltered__snp6 |
| TCGA-E2-A1IH-10A-01D-A13N-01 | Affymetrix SNP 6.0 | (TODO) -- GDC | CNV__snp6 |
| TCGA-E2-A1II-10A-01D-A141-01 | Affymetrix SNP 6.0 | (TODO) -- GDC | CNV__unfiltered__snp6 |
| TCGA-E2-A1II-10A-01D-A141-01 | Affymetrix SNP 6.0 | (TODO) -- GDC | CNV__snp6 |
| TCGA-E2-A1IJ-10A-01D-A141-01 | Affymetrix SNP 6.0 | (TODO) -- GDC | CNV__unfiltered__snp6 |
| TCGA-E2-A1IJ-10A-01D-A141-01 | Affymetrix SNP 6.0 | (TODO) -- GDC | CNV__snp6 |
| TCGA-E2-A1IK-10A-01D-A141-01 | Affymetrix SNP 6.0 | (TODO) -- GDC | CNV__unfiltered__snp6 |
| TCGA-E2-A1IK-10A-01D-A141-01 | Affymetrix SNP 6.0 | (TODO) -- GDC | CNV__snp6 |
| TCGA-E2-A1IL-10A-01D-A14F-01 | Affymetrix SNP 6.0 | (TODO) -- GDC | CNV__unfiltered__snp6 |
| TCGA-E2-A1IL-10A-01D-A14F-01 | Affymetrix SNP 6.0 | (TODO) -- GDC | CNV__snp6 |
| TCGA-E2-A1IN-10A-01D-A13N-01 | Affymetrix SNP 6.0 | (TODO) -- GDC | CNV__unfiltered__snp6 |
| TCGA-E2-A1IN-10A-01D-A13N-01 | Affymetrix SNP 6.0 | (TODO) -- GDC | CNV__snp6 |
| TCGA-E2-A1IO-10A-01D-A141-01 | Affymetrix SNP 6.0 | (TODO) -- GDC | CNV__unfiltered__snp6 |
| TCGA-E2-A1IO-10A-01D-A141-01 | Affymetrix SNP 6.0 | (TODO) -- GDC | CNV__snp6 |
| TCGA-E2-A1L6-10A-01D-A13N-01 | Affymetrix SNP 6.0 | (TODO) -- GDC | CNV__unfiltered__snp6 |
| TCGA-E2-A1L6-10A-01D-A13N-01 | Affymetrix SNP 6.0 | (TODO) -- GDC | CNV__snp6 |
| TCGA-E2-A1L7-10A-01D-A141-01 | Affymetrix SNP 6.0 | (TODO) -- GDC | CNV__unfiltered__snp6 |
| TCGA-E2-A1L7-10A-01D-A141-01 | Affymetrix SNP 6.0 | (TODO) -- GDC | CNV__snp6 |
| TCGA-E2-A1L8-10A-01D-A13N-01 | Affymetrix SNP 6.0 | (TODO) -- GDC | CNV__unfiltered__snp6 |
| TCGA-E2-A1L8-10A-01D-A13N-01 | Affymetrix SNP 6.0 | (TODO) -- GDC | CNV__snp6 |
| TCGA-E2-A1L9-10A-01D-A13N-01 | Affymetrix SNP 6.0 | (TODO) -- GDC | CNV__unfiltered__snp6 |
| TCGA-E2-A1L9-10A-01D-A13N-01 | Affymetrix SNP 6.0 | (TODO) -- GDC | CNV__snp6 |
| TCGA-E2-A1LA-10A-01D-A141-01 | Affymetrix SNP 6.0 | (TODO) -- GDC | CNV__unfiltered__snp6 |
| TCGA-E2-A1LA-10A-01D-A141-01 | Affymetrix SNP 6.0 | (TODO) -- GDC | CNV__snp6 |
| TCGA-E2-A2P5-10B-01D-A19X-01 | Affymetrix SNP 6.0 | (TODO) -- GDC | CNV__unfiltered__snp6 |
| TCGA-E2-A2P5-10B-01D-A19X-01 | Affymetrix SNP 6.0 | (TODO) -- GDC | CNV__snp6 |
| TCGA-E2-A2P6-10B-01D-A19X-01 | Affymetrix SNP 6.0 | (TODO) -- GDC | CNV__unfiltered__snp6 |
| TCGA-E2-A2P6-10B-01D-A19X-01 | Affymetrix SNP 6.0 | (TODO) -- GDC | CNV__snp6 |
| TCGA-E2-A3DX-10A-01D-A20R-01 | Affymetrix SNP 6.0 | (TODO) -- GDC | CNV__unfiltered__snp6 |
| TCGA-E2-A3DX-10A-01D-A20R-01 | Affymetrix SNP 6.0 | (TODO) -- GDC | CNV__snp6 |
| TCGA-E2-A56Z-10A-01D-A29M-01 | Affymetrix SNP 6.0 | (TODO) -- GDC | CNV__unfiltered__snp6 |
| TCGA-E2-A56Z-10A-01D-A29M-01 | Affymetrix SNP 6.0 | (TODO) -- GDC | CNV__snp6 |
| TCGA-E2-A570-10A-01D-A29M-01 | Affymetrix SNP 6.0 | (TODO) -- GDC | CNV__unfiltered__snp6 |
| TCGA-E2-A570-10A-01D-A29M-01 | Affymetrix SNP 6.0 | (TODO) -- GDC | CNV__snp6 |
| TCGA-E2-A572-10B-01D-A31T-01 | Affymetrix SNP 6.0 | (TODO) -- GDC | CNV__unfiltered__snp6 |
| TCGA-E2-A572-10B-01D-A31T-01 | Affymetrix SNP 6.0 | (TODO) -- GDC | CNV__snp6 |
| TCGA-E2-A573-10A-01D-A29M-01 | Affymetrix SNP 6.0 | (TODO) -- GDC | CNV__unfiltered__snp6 |
| TCGA-E2-A573-10A-01D-A29M-01 | Affymetrix SNP 6.0 | (TODO) -- GDC | CNV__snp6 |
| TCGA-E2-A574-10A-01D-A29M-01 | Affymetrix SNP 6.0 | (TODO) -- GDC | CNV__unfiltered__snp6 |
| TCGA-E2-A574-10A-01D-A29M-01 | Affymetrix SNP 6.0 | (TODO) -- GDC | CNV__snp6 |
| TCGA-E2-A576-10B-01D-A31T-01 | Affymetrix SNP 6.0 | (TODO) -- GDC | CNV__unfiltered__snp6 |
| TCGA-E2-A576-10B-01D-A31T-01 | Affymetrix SNP 6.0 | (TODO) -- GDC | CNV__snp6 |
| TCGA-E2-A9RU-10A-01D-A41E-01 | Affymetrix SNP 6.0 | (TODO) -- GDC | CNV__unfiltered__snp6 |
| TCGA-E2-A9RU-10A-01D-A41E-01 | Affymetrix SNP 6.0 | (TODO) -- GDC | CNV__snp6 |
| TCGA-E9-A1N3-10A-01D-A160-01 | Affymetrix SNP 6.0 | (TODO) -- GDC | CNV__unfiltered__snp6 |
| TCGA-E9-A1N3-10A-01D-A160-01 | Affymetrix SNP 6.0 | (TODO) -- GDC | CNV__snp6 |
| TCGA-E9-A1N4-10A-01D-A14J-01 | Affymetrix SNP 6.0 | (TODO) -- GDC | CNV__unfiltered__snp6 |
| TCGA-E9-A1N4-10A-01D-A14J-01 | Affymetrix SNP 6.0 | (TODO) -- GDC | CNV__snp6 |
| TCGA-E9-A1N5-10A-01D-A14F-01 | Affymetrix SNP 6.0 | (TODO) -- GDC | CNV__unfiltered__snp6 |
| TCGA-E9-A1N5-10A-01D-A14F-01 | Affymetrix SNP 6.0 | (TODO) -- GDC | CNV__snp6 |
| TCGA-E9-A1N8-10A-01D-A141-01 | Affymetrix SNP 6.0 | (TODO) -- GDC | CNV__unfiltered__snp6 |
| TCGA-E9-A1N8-10A-01D-A141-01 | Affymetrix SNP 6.0 | (TODO) -- GDC | CNV__snp6 |
| TCGA-E9-A1N9-10A-01D-A14F-01 | Affymetrix SNP 6.0 | (TODO) -- GDC | CNV__unfiltered__snp6 |
| TCGA-E9-A1N9-10A-01D-A14F-01 | Affymetrix SNP 6.0 | (TODO) -- GDC | CNV__snp6 |
| TCGA-E9-A1NA-10A-01D-A141-01 | Affymetrix SNP 6.0 | (TODO) -- GDC | CNV__unfiltered__snp6 |
| TCGA-E9-A1NA-10A-01D-A141-01 | Affymetrix SNP 6.0 | (TODO) -- GDC | CNV__snp6 |
| TCGA-E9-A1NC-10A-01D-A160-01 | Affymetrix SNP 6.0 | (TODO) -- GDC | CNV__unfiltered__snp6 |
| TCGA-E9-A1NC-10A-01D-A160-01 | Affymetrix SNP 6.0 | (TODO) -- GDC | CNV__snp6 |
| TCGA-E9-A1ND-10A-01D-A141-01 | Affymetrix SNP 6.0 | (TODO) -- GDC | CNV__unfiltered__snp6 |
| TCGA-E9-A1ND-10A-01D-A141-01 | Affymetrix SNP 6.0 | (TODO) -- GDC | CNV__snp6 |
| TCGA-E9-A1NE-10A-01D-A14J-01 | Affymetrix SNP 6.0 | (TODO) -- GDC | CNV__unfiltered__snp6 |
| TCGA-E9-A1NE-10A-01D-A14J-01 | Affymetrix SNP 6.0 | (TODO) -- GDC | CNV__snp6 |
| TCGA-E9-A1NF-10A-01D-A14F-01 | Affymetrix SNP 6.0 | (TODO) -- GDC | CNV__unfiltered__snp6 |
| TCGA-E9-A1NF-10A-01D-A14F-01 | Affymetrix SNP 6.0 | (TODO) -- GDC | CNV__snp6 |
| TCGA-E9-A1NG-10A-01D-A14J-01 | Affymetrix SNP 6.0 | (TODO) -- GDC | CNV__unfiltered__snp6 |
| TCGA-E9-A1NG-10A-01D-A14J-01 | Affymetrix SNP 6.0 | (TODO) -- GDC | CNV__snp6 |
| TCGA-E9-A1NI-10A-01D-A14F-01 | Affymetrix SNP 6.0 | (TODO) -- GDC | CNV__unfiltered__snp6 |
| TCGA-E9-A1NI-10A-01D-A14F-01 | Affymetrix SNP 6.0 | (TODO) -- GDC | CNV__snp6 |
| TCGA-E9-A1QZ-10A-01D-A166-01 | Affymetrix SNP 6.0 | (TODO) -- GDC | CNV__unfiltered__snp6 |
| TCGA-E9-A1QZ-10A-01D-A166-01 | Affymetrix SNP 6.0 | (TODO) -- GDC | CNV__snp6 |
| TCGA-E9-A1R0-10A-01D-A16C-01 | Affymetrix SNP 6.0 | (TODO) -- GDC | CNV__unfiltered__snp6 |
| TCGA-E9-A1R0-10A-01D-A16C-01 | Affymetrix SNP 6.0 | (TODO) -- GDC | CNV__snp6 |
| TCGA-E9-A1R2-10A-01D-A14F-01 | Affymetrix SNP 6.0 | (TODO) -- GDC | CNV__unfiltered__snp6 |
| TCGA-E9-A1R2-10A-01D-A14F-01 | Affymetrix SNP 6.0 | (TODO) -- GDC | CNV__snp6 |
| TCGA-E9-A1R3-10A-01D-A14J-01 | Affymetrix SNP 6.0 | (TODO) -- GDC | CNV__unfiltered__snp6 |
| TCGA-E9-A1R3-10A-01D-A14J-01 | Affymetrix SNP 6.0 | (TODO) -- GDC | CNV__snp6 |
| TCGA-E9-A1R4-10A-01D-A14F-01 | Affymetrix SNP 6.0 | (TODO) -- GDC | CNV__unfiltered__snp6 |
| TCGA-E9-A1R4-10A-01D-A14F-01 | Affymetrix SNP 6.0 | (TODO) -- GDC | CNV__snp6 |
| TCGA-E9-A1R5-10A-01D-A14J-01 | Affymetrix SNP 6.0 | (TODO) -- GDC | CNV__unfiltered__snp6 |
| TCGA-E9-A1R5-10A-01D-A14J-01 | Affymetrix SNP 6.0 | (TODO) -- GDC | CNV__snp6 |
| TCGA-E9-A1R6-10A-01D-A14F-01 | Affymetrix SNP 6.0 | (TODO) -- GDC | CNV__unfiltered__snp6 |
| TCGA-E9-A1R6-10A-01D-A14F-01 | Affymetrix SNP 6.0 | (TODO) -- GDC | CNV__snp6 |
| TCGA-E9-A1R7-10A-01D-A14J-01 | Affymetrix SNP 6.0 | (TODO) -- GDC | CNV__unfiltered__snp6 |
| TCGA-E9-A1R7-10A-01D-A14J-01 | Affymetrix SNP 6.0 | (TODO) -- GDC | CNV__snp6 |
| TCGA-E9-A1RA-10A-01D-A14F-01 | Affymetrix SNP 6.0 | (TODO) -- GDC | CNV__unfiltered__snp6 |
| TCGA-E9-A1RA-10A-01D-A14F-01 | Affymetrix SNP 6.0 | (TODO) -- GDC | CNV__snp6 |
| TCGA-E9-A1RB-10A-01D-A160-01 | Affymetrix SNP 6.0 | (TODO) -- GDC | CNV__unfiltered__snp6 |
| TCGA-E9-A1RB-10A-01D-A160-01 | Affymetrix SNP 6.0 | (TODO) -- GDC | CNV__snp6 |
| TCGA-E9-A1RC-10A-01D-A160-01 | Affymetrix SNP 6.0 | (TODO) -- GDC | CNV__unfiltered__snp6 |
| TCGA-E9-A1RC-10A-01D-A160-01 | Affymetrix SNP 6.0 | (TODO) -- GDC | CNV__snp6 |
| TCGA-E9-A1RD-10A-01D-A160-01 | Affymetrix SNP 6.0 | (TODO) -- GDC | CNV__unfiltered__snp6 |
| TCGA-E9-A1RD-10A-01D-A160-01 | Affymetrix SNP 6.0 | (TODO) -- GDC | CNV__snp6 |
| TCGA-E9-A1RE-10A-01D-A160-01 | Affymetrix SNP 6.0 | (TODO) -- GDC | CNV__unfiltered__snp6 |
| TCGA-E9-A1RE-10A-01D-A160-01 | Affymetrix SNP 6.0 | (TODO) -- GDC | CNV__snp6 |
| TCGA-E9-A1RF-10A-01D-A160-01 | Affymetrix SNP 6.0 | (TODO) -- GDC | CNV__unfiltered__snp6 |
| TCGA-E9-A1RF-10A-01D-A160-01 | Affymetrix SNP 6.0 | (TODO) -- GDC | CNV__snp6 |
| TCGA-E9-A1RG-10A-01D-A14F-01 | Affymetrix SNP 6.0 | (TODO) -- GDC | CNV__unfiltered__snp6 |
| TCGA-E9-A1RG-10A-01D-A14F-01 | Affymetrix SNP 6.0 | (TODO) -- GDC | CNV__snp6 |
| TCGA-E9-A1RH-10A-01D-A166-01 | Affymetrix SNP 6.0 | (TODO) -- GDC | CNV__unfiltered__snp6 |
| TCGA-E9-A1RH-10A-01D-A166-01 | Affymetrix SNP 6.0 | (TODO) -- GDC | CNV__snp6 |
| TCGA-E9-A1RI-10A-01D-A166-01 | Affymetrix SNP 6.0 | (TODO) -- GDC | CNV__unfiltered__snp6 |
| TCGA-E9-A1RI-10A-01D-A166-01 | Affymetrix SNP 6.0 | (TODO) -- GDC | CNV__snp6 |
| TCGA-E9-A226-10A-01D-A160-01 | Affymetrix SNP 6.0 | (TODO) -- GDC | CNV__unfiltered__snp6 |
| TCGA-E9-A226-10A-01D-A160-01 | Affymetrix SNP 6.0 | (TODO) -- GDC | CNV__snp6 |
| TCGA-E9-A227-10A-01D-A160-01 | Affymetrix SNP 6.0 | (TODO) -- GDC | CNV__unfiltered__snp6 |
| TCGA-E9-A227-10A-01D-A160-01 | Affymetrix SNP 6.0 | (TODO) -- GDC | CNV__snp6 |
| TCGA-E9-A228-10A-01D-A160-01 | Affymetrix SNP 6.0 | (TODO) -- GDC | CNV__unfiltered__snp6 |
| TCGA-E9-A228-10A-01D-A160-01 | Affymetrix SNP 6.0 | (TODO) -- GDC | CNV__snp6 |
| TCGA-E9-A229-10B-01D-A160-01 | Affymetrix SNP 6.0 | (TODO) -- GDC | CNV__unfiltered__snp6 |
| TCGA-E9-A229-10B-01D-A160-01 | Affymetrix SNP 6.0 | (TODO) -- GDC | CNV__snp6 |
| TCGA-E9-A22A-10A-01D-A160-01 | Affymetrix SNP 6.0 | (TODO) -- GDC | CNV__unfiltered__snp6 |
| TCGA-E9-A22A-10A-01D-A160-01 | Affymetrix SNP 6.0 | (TODO) -- GDC | CNV__snp6 |
| TCGA-E9-A22B-10A-01D-A160-01 | Affymetrix SNP 6.0 | (TODO) -- GDC | CNV__unfiltered__snp6 |
| TCGA-E9-A22B-10A-01D-A160-01 | Affymetrix SNP 6.0 | (TODO) -- GDC | CNV__snp6 |
| TCGA-E9-A22D-10A-01D-A160-01 | Affymetrix SNP 6.0 | (TODO) -- GDC | CNV__unfiltered__snp6 |
| TCGA-E9-A22D-10A-01D-A160-01 | Affymetrix SNP 6.0 | (TODO) -- GDC | CNV__snp6 |
| TCGA-E9-A22E-10A-01D-A160-01 | Affymetrix SNP 6.0 | (TODO) -- GDC | CNV__unfiltered__snp6 |
| TCGA-E9-A22E-10A-01D-A160-01 | Affymetrix SNP 6.0 | (TODO) -- GDC | CNV__snp6 |
| TCGA-E9-A22G-10A-01D-A160-01 | Affymetrix SNP 6.0 | (TODO) -- GDC | CNV__unfiltered__snp6 |
| TCGA-E9-A22G-10A-01D-A160-01 | Affymetrix SNP 6.0 | (TODO) -- GDC | CNV__snp6 |
| TCGA-E9-A22H-10A-01D-A160-01 | Affymetrix SNP 6.0 | (TODO) -- GDC | CNV__unfiltered__snp6 |
| TCGA-E9-A22H-10A-01D-A160-01 | Affymetrix SNP 6.0 | (TODO) -- GDC | CNV__snp6 |
| TCGA-E9-A243-10A-01D-A166-01 | Affymetrix SNP 6.0 | (TODO) -- GDC | CNV__unfiltered__snp6 |
| TCGA-E9-A243-10A-01D-A166-01 | Affymetrix SNP 6.0 | (TODO) -- GDC | CNV__snp6 |
| TCGA-E9-A244-10A-01D-A166-01 | Affymetrix SNP 6.0 | (TODO) -- GDC | CNV__unfiltered__snp6 |
| TCGA-E9-A244-10A-01D-A166-01 | Affymetrix SNP 6.0 | (TODO) -- GDC | CNV__snp6 |
| TCGA-E9-A245-10A-01D-A16C-01 | Affymetrix SNP 6.0 | (TODO) -- GDC | CNV__unfiltered__snp6 |
| TCGA-E9-A245-10A-01D-A16C-01 | Affymetrix SNP 6.0 | (TODO) -- GDC | CNV__snp6 |
| TCGA-E9-A247-10A-01D-A166-01 | Affymetrix SNP 6.0 | (TODO) -- GDC | CNV__unfiltered__snp6 |
| TCGA-E9-A247-10A-01D-A166-01 | Affymetrix SNP 6.0 | (TODO) -- GDC | CNV__snp6 |
| TCGA-E9-A248-10A-01D-A166-01 | Affymetrix SNP 6.0 | (TODO) -- GDC | CNV__unfiltered__snp6 |
| TCGA-E9-A248-10A-01D-A166-01 | Affymetrix SNP 6.0 | (TODO) -- GDC | CNV__snp6 |
| TCGA-E9-A249-10A-01D-A166-01 | Affymetrix SNP 6.0 | (TODO) -- GDC | CNV__unfiltered__snp6 |
| TCGA-E9-A249-10A-01D-A166-01 | Affymetrix SNP 6.0 | (TODO) -- GDC | CNV__snp6 |
| TCGA-E9-A24A-10A-01D-A166-01 | Affymetrix SNP 6.0 | (TODO) -- GDC | CNV__unfiltered__snp6 |
| TCGA-E9-A24A-10A-01D-A166-01 | Affymetrix SNP 6.0 | (TODO) -- GDC | CNV__snp6 |
| TCGA-E9-A295-10A-01D-A16C-01 | Affymetrix SNP 6.0 | (TODO) -- GDC | CNV__unfiltered__snp6 |
| TCGA-E9-A295-10A-01D-A16C-01 | Affymetrix SNP 6.0 | (TODO) -- GDC | CNV__snp6 |
| TCGA-E9-A2JS-10A-01D-A17U-01 | Affymetrix SNP 6.0 | (TODO) -- GDC | CNV__unfiltered__snp6 |
| TCGA-E9-A2JS-10A-01D-A17U-01 | Affymetrix SNP 6.0 | (TODO) -- GDC | CNV__snp6 |
| TCGA-E9-A2JT-10A-01D-A18N-01 | Affymetrix SNP 6.0 | (TODO) -- GDC | CNV__unfiltered__snp6 |
| TCGA-E9-A2JT-10A-01D-A18N-01 | Affymetrix SNP 6.0 | (TODO) -- GDC | CNV__snp6 |
| TCGA-E9-A3HO-10A-02D-A20R-01 | Affymetrix SNP 6.0 | (TODO) -- GDC | CNV__unfiltered__snp6 |
| TCGA-E9-A3HO-10A-02D-A20R-01 | Affymetrix SNP 6.0 | (TODO) -- GDC | CNV__snp6 |
| TCGA-E9-A3Q9-10A-01D-A21P-01 | Affymetrix SNP 6.0 | (TODO) -- GDC | CNV__unfiltered__snp6 |
| TCGA-E9-A3Q9-10A-01D-A21P-01 | Affymetrix SNP 6.0 | (TODO) -- GDC | CNV__snp6 |
| TCGA-E9-A3QA-10A-01D-A229-01 | Affymetrix SNP 6.0 | (TODO) -- GDC | CNV__unfiltered__snp6 |
| TCGA-E9-A3QA-10A-01D-A229-01 | Affymetrix SNP 6.0 | (TODO) -- GDC | CNV__snp6 |
| TCGA-E9-A3X8-10B-01D-A22W-01 | Affymetrix SNP 6.0 | (TODO) -- GDC | CNV__unfiltered__snp6 |
| TCGA-E9-A3X8-10B-01D-A22W-01 | Affymetrix SNP 6.0 | (TODO) -- GDC | CNV__snp6 |
| TCGA-E9-A54X-10A-01D-A25N-01 | Affymetrix SNP 6.0 | (TODO) -- GDC | CNV__unfiltered__snp6 |
| TCGA-E9-A54X-10A-01D-A25N-01 | Affymetrix SNP 6.0 | (TODO) -- GDC | CNV__snp6 |
| TCGA-E9-A54Y-10A-01D-A25N-01 | Affymetrix SNP 6.0 | (TODO) -- GDC | CNV__unfiltered__snp6 |
| TCGA-E9-A54Y-10A-01D-A25N-01 | Affymetrix SNP 6.0 | (TODO) -- GDC | CNV__snp6 |
| TCGA-E9-A5FK-10A-01D-A27O-01 | Affymetrix SNP 6.0 | (TODO) -- GDC | CNV__unfiltered__snp6 |
| TCGA-E9-A5FK-10A-01D-A27O-01 | Affymetrix SNP 6.0 | (TODO) -- GDC | CNV__snp6 |
| TCGA-E9-A5FL-10A-01D-A27O-01 | Affymetrix SNP 6.0 | (TODO) -- GDC | CNV__unfiltered__snp6 |
| TCGA-E9-A5FL-10A-01D-A27O-01 | Affymetrix SNP 6.0 | (TODO) -- GDC | CNV__snp6 |
| TCGA-E9-A5UO-10A-01D-A28D-01 | Affymetrix SNP 6.0 | (TODO) -- GDC | CNV__unfiltered__snp6 |
| TCGA-E9-A5UO-10A-01D-A28D-01 | Affymetrix SNP 6.0 | (TODO) -- GDC | CNV__snp6 |
| TCGA-E9-A5UP-10A-01D-A28D-01 | Affymetrix SNP 6.0 | (TODO) -- GDC | CNV__unfiltered__snp6 |
| TCGA-E9-A5UP-10A-01D-A28D-01 | Affymetrix SNP 6.0 | (TODO) -- GDC | CNV__snp6 |
| TCGA-E9-A6HE-10A-01D-A31T-01 | Affymetrix SNP 6.0 | (TODO) -- GDC | CNV__unfiltered__snp6 |
| TCGA-E9-A6HE-10A-01D-A31T-01 | Affymetrix SNP 6.0 | (TODO) -- GDC | CNV__snp6 |
| TCGA-EW-A1IW-10A-01D-A13N-01 | Affymetrix SNP 6.0 | (TODO) -- GDC | CNV__unfiltered__snp6 |
| TCGA-EW-A1IW-10A-01D-A13N-01 | Affymetrix SNP 6.0 | (TODO) -- GDC | CNV__snp6 |
| TCGA-EW-A1IX-10A-01D-A141-01 | Affymetrix SNP 6.0 | (TODO) -- GDC | CNV__unfiltered__snp6 |
| TCGA-EW-A1IX-10A-01D-A141-01 | Affymetrix SNP 6.0 | (TODO) -- GDC | CNV__snp6 |
| TCGA-EW-A1IY-10A-01D-A13N-01 | Affymetrix SNP 6.0 | (TODO) -- GDC | CNV__unfiltered__snp6 |
| TCGA-EW-A1IY-10A-01D-A13N-01 | Affymetrix SNP 6.0 | (TODO) -- GDC | CNV__snp6 |
| TCGA-EW-A1IZ-10A-01D-A13N-01 | Affymetrix SNP 6.0 | (TODO) -- GDC | CNV__unfiltered__snp6 |
| TCGA-EW-A1IZ-10A-01D-A13N-01 | Affymetrix SNP 6.0 | (TODO) -- GDC | CNV__snp6 |
| TCGA-EW-A1J1-10A-01D-A13N-01 | Affymetrix SNP 6.0 | (TODO) -- GDC | CNV__unfiltered__snp6 |
| TCGA-EW-A1J1-10A-01D-A13N-01 | Affymetrix SNP 6.0 | (TODO) -- GDC | CNV__snp6 |
| TCGA-EW-A1J2-10A-01D-A13N-01 | Affymetrix SNP 6.0 | (TODO) -- GDC | CNV__unfiltered__snp6 |
| TCGA-EW-A1J2-10A-01D-A13N-01 | Affymetrix SNP 6.0 | (TODO) -- GDC | CNV__snp6 |
| TCGA-EW-A1J3-10A-01D-A13N-01 | Affymetrix SNP 6.0 | (TODO) -- GDC | CNV__unfiltered__snp6 |
| TCGA-EW-A1J3-10A-01D-A13N-01 | Affymetrix SNP 6.0 | (TODO) -- GDC | CNV__snp6 |
| TCGA-EW-A1J5-10A-01D-A13N-01 | Affymetrix SNP 6.0 | (TODO) -- GDC | CNV__unfiltered__snp6 |
| TCGA-EW-A1J5-10A-01D-A13N-01 | Affymetrix SNP 6.0 | (TODO) -- GDC | CNV__snp6 |
| TCGA-EW-A1J6-10A-01D-A13N-01 | Affymetrix SNP 6.0 | (TODO) -- GDC | CNV__unfiltered__snp6 |
| TCGA-EW-A1J6-10A-01D-A13N-01 | Affymetrix SNP 6.0 | (TODO) -- GDC | CNV__snp6 |
| TCGA-EW-A1OV-10A-01D-A141-01 | Affymetrix SNP 6.0 | (TODO) -- GDC | CNV__unfiltered__snp6 |
| TCGA-EW-A1OV-10A-01D-A141-01 | Affymetrix SNP 6.0 | (TODO) -- GDC | CNV__snp6 |
| TCGA-EW-A1OX-10A-01D-A141-01 | Affymetrix SNP 6.0 | (TODO) -- GDC | CNV__unfiltered__snp6 |
| TCGA-EW-A1OX-10A-01D-A141-01 | Affymetrix SNP 6.0 | (TODO) -- GDC | CNV__snp6 |
| TCGA-EW-A1OY-10A-01D-A141-01 | Affymetrix SNP 6.0 | (TODO) -- GDC | CNV__unfiltered__snp6 |
| TCGA-EW-A1OY-10A-01D-A141-01 | Affymetrix SNP 6.0 | (TODO) -- GDC | CNV__snp6 |
| TCGA-EW-A1OZ-10A-01D-A141-01 | Affymetrix SNP 6.0 | (TODO) -- GDC | CNV__unfiltered__snp6 |
| TCGA-EW-A1OZ-10A-01D-A141-01 | Affymetrix SNP 6.0 | (TODO) -- GDC | CNV__snp6 |
| TCGA-EW-A1P0-10A-01D-A141-01 | Affymetrix SNP 6.0 | (TODO) -- GDC | CNV__unfiltered__snp6 |
| TCGA-EW-A1P0-10A-01D-A141-01 | Affymetrix SNP 6.0 | (TODO) -- GDC | CNV__snp6 |
| TCGA-EW-A1P1-10A-01D-A14F-01 | Affymetrix SNP 6.0 | (TODO) -- GDC | CNV__unfiltered__snp6 |
| TCGA-EW-A1P1-10A-01D-A14F-01 | Affymetrix SNP 6.0 | (TODO) -- GDC | CNV__snp6 |
| TCGA-EW-A1P3-10A-01D-A141-01 | Affymetrix SNP 6.0 | (TODO) -- GDC | CNV__unfiltered__snp6 |
| TCGA-EW-A1P3-10A-01D-A141-01 | Affymetrix SNP 6.0 | (TODO) -- GDC | CNV__snp6 |
| TCGA-EW-A1P4-10A-01D-A141-01 | Affymetrix SNP 6.0 | (TODO) -- GDC | CNV__unfiltered__snp6 |
| TCGA-EW-A1P4-10A-01D-A141-01 | Affymetrix SNP 6.0 | (TODO) -- GDC | CNV__snp6 |
| TCGA-EW-A1P5-10A-01D-A141-01 | Affymetrix SNP 6.0 | (TODO) -- GDC | CNV__unfiltered__snp6 |
| TCGA-EW-A1P5-10A-01D-A141-01 | Affymetrix SNP 6.0 | (TODO) -- GDC | CNV__snp6 |
| TCGA-EW-A1P6-10A-01D-A141-01 | Affymetrix SNP 6.0 | (TODO) -- GDC | CNV__unfiltered__snp6 |
| TCGA-EW-A1P6-10A-01D-A141-01 | Affymetrix SNP 6.0 | (TODO) -- GDC | CNV__snp6 |
| TCGA-EW-A1P7-10A-01D-A141-01 | Affymetrix SNP 6.0 | (TODO) -- GDC | CNV__unfiltered__snp6 |
| TCGA-EW-A1P7-10A-01D-A141-01 | Affymetrix SNP 6.0 | (TODO) -- GDC | CNV__snp6 |
| TCGA-EW-A1P8-10A-01D-A141-01 | Affymetrix SNP 6.0 | (TODO) -- GDC | CNV__unfiltered__snp6 |
| TCGA-EW-A1P8-10A-01D-A141-01 | Affymetrix SNP 6.0 | (TODO) -- GDC | CNV__snp6 |
| TCGA-EW-A1PA-10A-01D-A141-01 | Affymetrix SNP 6.0 | (TODO) -- GDC | CNV__unfiltered__snp6 |
| TCGA-EW-A1PA-10A-01D-A141-01 | Affymetrix SNP 6.0 | (TODO) -- GDC | CNV__snp6 |
| TCGA-EW-A1PB-10A-01D-A141-01 | Affymetrix SNP 6.0 | (TODO) -- GDC | CNV__unfiltered__snp6 |
| TCGA-EW-A1PB-10A-01D-A141-01 | Affymetrix SNP 6.0 | (TODO) -- GDC | CNV__snp6 |
| TCGA-EW-A1PC-10A-01D-A21P-01 | Affymetrix SNP 6.0 | (TODO) -- GDC | CNV__unfiltered__snp6 |
| TCGA-EW-A1PC-10A-01D-A21P-01 | Affymetrix SNP 6.0 | (TODO) -- GDC | CNV__snp6 |
| TCGA-EW-A1PD-10A-01D-A141-01 | Affymetrix SNP 6.0 | (TODO) -- GDC | CNV__unfiltered__snp6 |
| TCGA-EW-A1PD-10A-01D-A141-01 | Affymetrix SNP 6.0 | (TODO) -- GDC | CNV__snp6 |
| TCGA-EW-A1PE-10A-01D-A141-01 | Affymetrix SNP 6.0 | (TODO) -- GDC | CNV__unfiltered__snp6 |
| TCGA-EW-A1PE-10A-01D-A141-01 | Affymetrix SNP 6.0 | (TODO) -- GDC | CNV__snp6 |
| TCGA-EW-A1PG-10A-01D-A141-01 | Affymetrix SNP 6.0 | (TODO) -- GDC | CNV__unfiltered__snp6 |
| TCGA-EW-A1PG-10A-01D-A141-01 | Affymetrix SNP 6.0 | (TODO) -- GDC | CNV__snp6 |
| TCGA-EW-A1PH-10A-01D-A14J-01 | Affymetrix SNP 6.0 | (TODO) -- GDC | CNV__unfiltered__snp6 |
| TCGA-EW-A1PH-10A-01D-A14J-01 | Affymetrix SNP 6.0 | (TODO) -- GDC | CNV__snp6 |
| TCGA-EW-A2FR-10A-01D-A21P-01 | Affymetrix SNP 6.0 | (TODO) -- GDC | CNV__unfiltered__snp6 |
| TCGA-EW-A2FR-10A-01D-A21P-01 | Affymetrix SNP 6.0 | (TODO) -- GDC | CNV__snp6 |
| TCGA-EW-A2FS-10A-01D-A17C-01 | Affymetrix SNP 6.0 | (TODO) -- GDC | CNV__unfiltered__snp6 |
| TCGA-EW-A2FS-10A-01D-A17C-01 | Affymetrix SNP 6.0 | (TODO) -- GDC | CNV__snp6 |
| TCGA-EW-A2FV-10A-01D-A17C-01 | Affymetrix SNP 6.0 | (TODO) -- GDC | CNV__unfiltered__snp6 |
| TCGA-EW-A2FV-10A-01D-A17C-01 | Affymetrix SNP 6.0 | (TODO) -- GDC | CNV__snp6 |
| TCGA-EW-A2FW-10A-01D-A17C-01 | Affymetrix SNP 6.0 | (TODO) -- GDC | CNV__unfiltered__snp6 |
| TCGA-EW-A2FW-10A-01D-A17C-01 | Affymetrix SNP 6.0 | (TODO) -- GDC | CNV__snp6 |
| TCGA-EW-A3E8-10A-01D-A242-01 | Affymetrix SNP 6.0 | (TODO) -- GDC | CNV__unfiltered__snp6 |
| TCGA-EW-A3E8-10A-01D-A242-01 | Affymetrix SNP 6.0 | (TODO) -- GDC | CNV__snp6 |
| TCGA-EW-A3U0-10A-01D-A229-01 | Affymetrix SNP 6.0 | (TODO) -- GDC | CNV__unfiltered__snp6 |
| TCGA-EW-A3U0-10A-01D-A229-01 | Affymetrix SNP 6.0 | (TODO) -- GDC | CNV__snp6 |
| TCGA-EW-A423-10A-01D-A242-01 | Affymetrix SNP 6.0 | (TODO) -- GDC | CNV__unfiltered__snp6 |
| TCGA-EW-A423-10A-01D-A242-01 | Affymetrix SNP 6.0 | (TODO) -- GDC | CNV__snp6 |
| TCGA-EW-A424-10A-01D-A242-01 | Affymetrix SNP 6.0 | (TODO) -- GDC | CNV__unfiltered__snp6 |
| TCGA-EW-A424-10A-01D-A242-01 | Affymetrix SNP 6.0 | (TODO) -- GDC | CNV__snp6 |
| TCGA-EW-A6S9-10A-01D-A33G-01 | Affymetrix SNP 6.0 | (TODO) -- GDC | CNV__unfiltered__snp6 |
| TCGA-EW-A6S9-10A-01D-A33G-01 | Affymetrix SNP 6.0 | (TODO) -- GDC | CNV__snp6 |
| TCGA-EW-A6SA-10A-01D-A32H-01 | Affymetrix SNP 6.0 | (TODO) -- GDC | CNV__unfiltered__snp6 |
| TCGA-EW-A6SA-10A-01D-A32H-01 | Affymetrix SNP 6.0 | (TODO) -- GDC | CNV__snp6 |
| TCGA-EW-A6SB-10A-01D-A32H-01 | Affymetrix SNP 6.0 | (TODO) -- GDC | CNV__unfiltered__snp6 |
| TCGA-EW-A6SB-10A-01D-A32H-01 | Affymetrix SNP 6.0 | (TODO) -- GDC | CNV__snp6 |
| TCGA-EW-A6SC-10A-01D-A32H-01 | Affymetrix SNP 6.0 | (TODO) -- GDC | CNV__unfiltered__snp6 |
| TCGA-EW-A6SC-10A-01D-A32H-01 | Affymetrix SNP 6.0 | (TODO) -- GDC | CNV__snp6 |
| TCGA-EW-A6SD-10A-01D-A33G-01 | Affymetrix SNP 6.0 | (TODO) -- GDC | CNV__unfiltered__snp6 |
| TCGA-EW-A6SD-10A-01D-A33G-01 | Affymetrix SNP 6.0 | (TODO) -- GDC | CNV__snp6 |
| TCGA-GM-A2DA-10C-01D-A18N-01 | Affymetrix SNP 6.0 | (TODO) -- GDC | CNV__unfiltered__snp6 |
| TCGA-GM-A2DA-10C-01D-A18N-01 | Affymetrix SNP 6.0 | (TODO) -- GDC | CNV__snp6 |
| TCGA-GM-A2DB-10C-01D-A18N-01 | Affymetrix SNP 6.0 | (TODO) -- GDC | CNV__unfiltered__snp6 |
| TCGA-GM-A2DB-10C-01D-A18N-01 | Affymetrix SNP 6.0 | (TODO) -- GDC | CNV__snp6 |
| TCGA-GM-A2DC-10C-01D-A18N-01 | Affymetrix SNP 6.0 | (TODO) -- GDC | CNV__unfiltered__snp6 |
| TCGA-GM-A2DC-10C-01D-A18N-01 | Affymetrix SNP 6.0 | (TODO) -- GDC | CNV__snp6 |
| TCGA-GM-A2DD-10C-01D-A17U-01 | Affymetrix SNP 6.0 | (TODO) -- GDC | CNV__unfiltered__snp6 |
| TCGA-GM-A2DD-10C-01D-A17U-01 | Affymetrix SNP 6.0 | (TODO) -- GDC | CNV__snp6 |
| TCGA-GM-A2DF-10C-01D-A17U-01 | Affymetrix SNP 6.0 | (TODO) -- GDC | CNV__unfiltered__snp6 |
| TCGA-GM-A2DF-10C-01D-A17U-01 | Affymetrix SNP 6.0 | (TODO) -- GDC | CNV__snp6 |
| TCGA-GM-A2DH-10C-01D-A17U-01 | Affymetrix SNP 6.0 | (TODO) -- GDC | CNV__unfiltered__snp6 |
| TCGA-GM-A2DH-10C-01D-A17U-01 | Affymetrix SNP 6.0 | (TODO) -- GDC | CNV__snp6 |
| TCGA-GM-A2DK-10C-01D-A17U-01 | Affymetrix SNP 6.0 | (TODO) -- GDC | CNV__unfiltered__snp6 |
| TCGA-GM-A2DK-10C-01D-A17U-01 | Affymetrix SNP 6.0 | (TODO) -- GDC | CNV__snp6 |
| TCGA-GM-A2DL-10C-01D-A18N-01 | Affymetrix SNP 6.0 | (TODO) -- GDC | CNV__unfiltered__snp6 |
| TCGA-GM-A2DL-10C-01D-A18N-01 | Affymetrix SNP 6.0 | (TODO) -- GDC | CNV__snp6 |
| TCGA-GM-A2DM-10C-01D-A17U-01 | Affymetrix SNP 6.0 | (TODO) -- GDC | CNV__unfiltered__snp6 |
| TCGA-GM-A2DM-10C-01D-A17U-01 | Affymetrix SNP 6.0 | (TODO) -- GDC | CNV__snp6 |
| TCGA-GM-A2DN-10C-01D-A17U-01 | Affymetrix SNP 6.0 | (TODO) -- GDC | CNV__unfiltered__snp6 |
| TCGA-GM-A2DN-10C-01D-A17U-01 | Affymetrix SNP 6.0 | (TODO) -- GDC | CNV__snp6 |
| TCGA-GM-A2DO-10D-01D-A18N-01 | Affymetrix SNP 6.0 | (TODO) -- GDC | CNV__unfiltered__snp6 |
| TCGA-GM-A2DO-10D-01D-A18N-01 | Affymetrix SNP 6.0 | (TODO) -- GDC | CNV__snp6 |
| TCGA-GM-A3NW-10A-01D-A229-01 | Affymetrix SNP 6.0 | (TODO) -- GDC | CNV__unfiltered__snp6 |
| TCGA-GM-A3NW-10A-01D-A229-01 | Affymetrix SNP 6.0 | (TODO) -- GDC | CNV__snp6 |
| TCGA-GM-A3NY-10A-01D-A21P-01 | Affymetrix SNP 6.0 | (TODO) -- GDC | CNV__unfiltered__snp6 |
| TCGA-GM-A3NY-10A-01D-A21P-01 | Affymetrix SNP 6.0 | (TODO) -- GDC | CNV__snp6 |
| TCGA-GM-A3XG-10A-01D-A242-01 | Affymetrix SNP 6.0 | (TODO) -- GDC | CNV__unfiltered__snp6 |
| TCGA-GM-A3XG-10A-01D-A242-01 | Affymetrix SNP 6.0 | (TODO) -- GDC | CNV__snp6 |
| TCGA-GM-A3XL-10A-01D-A22W-01 | Affymetrix SNP 6.0 | (TODO) -- GDC | CNV__unfiltered__snp6 |
| TCGA-GM-A3XL-10A-01D-A22W-01 | Affymetrix SNP 6.0 | (TODO) -- GDC | CNV__snp6 |
| TCGA-GM-A3XN-10A-01D-A22W-01 | Affymetrix SNP 6.0 | (TODO) -- GDC | CNV__unfiltered__snp6 |
| TCGA-GM-A3XN-10A-01D-A22W-01 | Affymetrix SNP 6.0 | (TODO) -- GDC | CNV__snp6 |
| TCGA-GM-A4E0-10A-01D-A25N-01 | Affymetrix SNP 6.0 | (TODO) -- GDC | CNV__unfiltered__snp6 |
| TCGA-GM-A4E0-10A-01D-A25N-01 | Affymetrix SNP 6.0 | (TODO) -- GDC | CNV__snp6 |
| TCGA-GM-A5PV-10A-01D-A28D-01 | Affymetrix SNP 6.0 | (TODO) -- GDC | CNV__unfiltered__snp6 |
| TCGA-GM-A5PV-10A-01D-A28D-01 | Affymetrix SNP 6.0 | (TODO) -- GDC | CNV__snp6 |
| TCGA-GM-A5PX-10A-01D-A28D-01 | Affymetrix SNP 6.0 | (TODO) -- GDC | CNV__unfiltered__snp6 |
| TCGA-GM-A5PX-10A-01D-A28D-01 | Affymetrix SNP 6.0 | (TODO) -- GDC | CNV__snp6 |
| TCGA-HN-A2NL-10A-01D-A18N-01 | Affymetrix SNP 6.0 | (TODO) -- GDC | CNV__unfiltered__snp6 |
| TCGA-HN-A2NL-10A-01D-A18N-01 | Affymetrix SNP 6.0 | (TODO) -- GDC | CNV__snp6 |
| TCGA-HN-A2OB-10B-01D-A27O-01 | Affymetrix SNP 6.0 | (TODO) -- GDC | CNV__unfiltered__snp6 |
| TCGA-HN-A2OB-10B-01D-A27O-01 | Affymetrix SNP 6.0 | (TODO) -- GDC | CNV__snp6 |
| TCGA-JL-A3YW-10B-01D-A238-01 | Affymetrix SNP 6.0 | (TODO) -- GDC | CNV__unfiltered__snp6 |
| TCGA-JL-A3YW-10B-01D-A238-01 | Affymetrix SNP 6.0 | (TODO) -- GDC | CNV__snp6 |
| TCGA-JL-A3YX-10A-01D-A22W-01 | Affymetrix SNP 6.0 | (TODO) -- GDC | CNV__unfiltered__snp6 |
| TCGA-JL-A3YX-10A-01D-A22W-01 | Affymetrix SNP 6.0 | (TODO) -- GDC | CNV__snp6 |
| TCGA-LD-A66U-10A-01D-A31T-01 | Affymetrix SNP 6.0 | (TODO) -- GDC | CNV__unfiltered__snp6 |
| TCGA-LD-A66U-10A-01D-A31T-01 | Affymetrix SNP 6.0 | (TODO) -- GDC | CNV__snp6 |
| TCGA-LD-A74U-10A-01D-A33G-01 | Affymetrix SNP 6.0 | (TODO) -- GDC | CNV__unfiltered__snp6 |
| TCGA-LD-A74U-10A-01D-A33G-01 | Affymetrix SNP 6.0 | (TODO) -- GDC | CNV__snp6 |
| TCGA-LD-A7W5-10A-01D-A350-01 | Affymetrix SNP 6.0 | (TODO) -- GDC | CNV__unfiltered__snp6 |
| TCGA-LD-A7W5-10A-01D-A350-01 | Affymetrix SNP 6.0 | (TODO) -- GDC | CNV__snp6 |
| TCGA-LD-A7W6-10A-01D-A350-01 | Affymetrix SNP 6.0 | (TODO) -- GDC | CNV__unfiltered__snp6 |
| TCGA-LD-A7W6-10A-01D-A350-01 | Affymetrix SNP 6.0 | (TODO) -- GDC | CNV__snp6 |
| TCGA-LD-A9QF-10A-01D-A41E-01 | Affymetrix SNP 6.0 | (TODO) -- GDC | CNV__unfiltered__snp6 |
| TCGA-LD-A9QF-10A-01D-A41E-01 | Affymetrix SNP 6.0 | (TODO) -- GDC | CNV__snp6 |
| TCGA-LL-A440-10A-01D-A242-01 | Affymetrix SNP 6.0 | (TODO) -- GDC | CNV__unfiltered__snp6 |
| TCGA-LL-A440-10A-01D-A242-01 | Affymetrix SNP 6.0 | (TODO) -- GDC | CNV__snp6 |
| TCGA-LL-A441-10A-01D-A242-01 | Affymetrix SNP 6.0 | (TODO) -- GDC | CNV__unfiltered__snp6 |
| TCGA-LL-A441-10A-01D-A242-01 | Affymetrix SNP 6.0 | (TODO) -- GDC | CNV__snp6 |
| TCGA-LL-A442-10A-01D-A242-01 | Affymetrix SNP 6.0 | (TODO) -- GDC | CNV__unfiltered__snp6 |
| TCGA-LL-A442-10A-01D-A242-01 | Affymetrix SNP 6.0 | (TODO) -- GDC | CNV__snp6 |
| TCGA-LL-A50Y-10A-01D-A25N-01 | Affymetrix SNP 6.0 | (TODO) -- GDC | CNV__unfiltered__snp6 |
| TCGA-LL-A50Y-10A-01D-A25N-01 | Affymetrix SNP 6.0 | (TODO) -- GDC | CNV__snp6 |
| TCGA-LL-A5YL-10A-01D-A29M-01 | Affymetrix SNP 6.0 | (TODO) -- GDC | CNV__unfiltered__snp6 |
| TCGA-LL-A5YL-10A-01D-A29M-01 | Affymetrix SNP 6.0 | (TODO) -- GDC | CNV__snp6 |
| TCGA-LL-A5YM-10A-01D-A28D-01 | Affymetrix SNP 6.0 | (TODO) -- GDC | CNV__unfiltered__snp6 |
| TCGA-LL-A5YM-10A-01D-A28D-01 | Affymetrix SNP 6.0 | (TODO) -- GDC | CNV__snp6 |
| TCGA-LL-A5YN-10A-01D-A28D-01 | Affymetrix SNP 6.0 | (TODO) -- GDC | CNV__unfiltered__snp6 |
| TCGA-LL-A5YN-10A-01D-A28D-01 | Affymetrix SNP 6.0 | (TODO) -- GDC | CNV__snp6 |
| TCGA-LL-A5YO-10A-01D-A28D-01 | Affymetrix SNP 6.0 | (TODO) -- GDC | CNV__unfiltered__snp6 |
| TCGA-LL-A5YO-10A-01D-A28D-01 | Affymetrix SNP 6.0 | (TODO) -- GDC | CNV__snp6 |
| TCGA-LL-A5YP-10A-01D-A28D-01 | Affymetrix SNP 6.0 | (TODO) -- GDC | CNV__unfiltered__snp6 |
| TCGA-LL-A5YP-10A-01D-A28D-01 | Affymetrix SNP 6.0 | (TODO) -- GDC | CNV__snp6 |
| TCGA-LL-A6FP-10A-01D-A31T-01 | Affymetrix SNP 6.0 | (TODO) -- GDC | CNV__unfiltered__snp6 |
| TCGA-LL-A6FP-10A-01D-A31T-01 | Affymetrix SNP 6.0 | (TODO) -- GDC | CNV__snp6 |
| TCGA-LL-A6FQ-10A-01D-A31T-01 | Affymetrix SNP 6.0 | (TODO) -- GDC | CNV__unfiltered__snp6 |
| TCGA-LL-A6FQ-10A-01D-A31T-01 | Affymetrix SNP 6.0 | (TODO) -- GDC | CNV__snp6 |
| TCGA-LL-A6FR-10B-01D-A31T-01 | Affymetrix SNP 6.0 | (TODO) -- GDC | CNV__unfiltered__snp6 |
| TCGA-LL-A6FR-10B-01D-A31T-01 | Affymetrix SNP 6.0 | (TODO) -- GDC | CNV__snp6 |
| TCGA-LL-A73Y-10B-01D-A33G-01 | Affymetrix SNP 6.0 | (TODO) -- GDC | CNV__unfiltered__snp6 |
| TCGA-LL-A73Y-10B-01D-A33G-01 | Affymetrix SNP 6.0 | (TODO) -- GDC | CNV__snp6 |
| TCGA-LL-A73Z-10B-01D-A32H-01 | Affymetrix SNP 6.0 | (TODO) -- GDC | CNV__unfiltered__snp6 |
| TCGA-LL-A73Z-10B-01D-A32H-01 | Affymetrix SNP 6.0 | (TODO) -- GDC | CNV__snp6 |
| TCGA-LL-A740-10B-01D-A32H-01 | Affymetrix SNP 6.0 | (TODO) -- GDC | CNV__unfiltered__snp6 |
| TCGA-LL-A740-10B-01D-A32H-01 | Affymetrix SNP 6.0 | (TODO) -- GDC | CNV__snp6 |
| TCGA-LL-A7SZ-10A-01D-A350-01 | Affymetrix SNP 6.0 | (TODO) -- GDC | CNV__unfiltered__snp6 |
| TCGA-LL-A7SZ-10A-01D-A350-01 | Affymetrix SNP 6.0 | (TODO) -- GDC | CNV__snp6 |
| TCGA-LL-A7T0-10A-01D-A350-01 | Affymetrix SNP 6.0 | (TODO) -- GDC | CNV__unfiltered__snp6 |
| TCGA-LL-A7T0-10A-01D-A350-01 | Affymetrix SNP 6.0 | (TODO) -- GDC | CNV__snp6 |
| TCGA-LL-A8F5-10A-01D-A36L-01 | Affymetrix SNP 6.0 | (TODO) -- GDC | CNV__unfiltered__snp6 |
| TCGA-LL-A8F5-10A-01D-A36L-01 | Affymetrix SNP 6.0 | (TODO) -- GDC | CNV__snp6 |
| TCGA-LL-A9Q3-10A-01D-A41E-01 | Affymetrix SNP 6.0 | (TODO) -- GDC | CNV__unfiltered__snp6 |
| TCGA-LL-A9Q3-10A-01D-A41E-01 | Affymetrix SNP 6.0 | (TODO) -- GDC | CNV__snp6 |
| TCGA-LQ-A4E4-10A-01D-A25N-01 | Affymetrix SNP 6.0 | (TODO) -- GDC | CNV__unfiltered__snp6 |
| TCGA-LQ-A4E4-10A-01D-A25N-01 | Affymetrix SNP 6.0 | (TODO) -- GDC | CNV__snp6 |
| TCGA-MS-A51U-10A-01D-A25N-01 | Affymetrix SNP 6.0 | (TODO) -- GDC | CNV__unfiltered__snp6 |
| TCGA-MS-A51U-10A-01D-A25N-01 | Affymetrix SNP 6.0 | (TODO) -- GDC | CNV__snp6 |
| TCGA-OK-A5Q2-10A-01D-A27O-01 | Affymetrix SNP 6.0 | (TODO) -- GDC | CNV__unfiltered__snp6 |
| TCGA-OK-A5Q2-10A-01D-A27O-01 | Affymetrix SNP 6.0 | (TODO) -- GDC | CNV__snp6 |
| TCGA-OL-A5D6-10A-01D-A27O-01 | Affymetrix SNP 6.0 | (TODO) -- GDC | CNV__unfiltered__snp6 |
| TCGA-OL-A5D6-10A-01D-A27O-01 | Affymetrix SNP 6.0 | (TODO) -- GDC | CNV__snp6 |
| TCGA-OL-A5D7-10A-01D-A27O-01 | Affymetrix SNP 6.0 | (TODO) -- GDC | CNV__unfiltered__snp6 |
| TCGA-OL-A5D7-10A-01D-A27O-01 | Affymetrix SNP 6.0 | (TODO) -- GDC | CNV__snp6 |
| TCGA-OL-A5D8-10A-01D-A27O-01 | Affymetrix SNP 6.0 | (TODO) -- GDC | CNV__unfiltered__snp6 |
| TCGA-OL-A5D8-10A-01D-A27O-01 | Affymetrix SNP 6.0 | (TODO) -- GDC | CNV__snp6 |
| TCGA-OL-A5RU-10A-01D-A28D-01 | Affymetrix SNP 6.0 | (TODO) -- GDC | CNV__unfiltered__snp6 |
| TCGA-OL-A5RU-10A-01D-A28D-01 | Affymetrix SNP 6.0 | (TODO) -- GDC | CNV__snp6 |
| TCGA-OL-A5RV-10A-01D-A28D-01 | Affymetrix SNP 6.0 | (TODO) -- GDC | CNV__unfiltered__snp6 |
| TCGA-OL-A5RV-10A-01D-A28D-01 | Affymetrix SNP 6.0 | (TODO) -- GDC | CNV__snp6 |
| TCGA-OL-A5RW-10A-01D-A28D-01 | Affymetrix SNP 6.0 | (TODO) -- GDC | CNV__unfiltered__snp6 |
| TCGA-OL-A5RW-10A-01D-A28D-01 | Affymetrix SNP 6.0 | (TODO) -- GDC | CNV__snp6 |
| TCGA-OL-A5RX-10A-01D-A28D-01 | Affymetrix SNP 6.0 | (TODO) -- GDC | CNV__unfiltered__snp6 |
| TCGA-OL-A5RX-10A-01D-A28D-01 | Affymetrix SNP 6.0 | (TODO) -- GDC | CNV__snp6 |
| TCGA-OL-A5RY-10A-01D-A28D-01 | Affymetrix SNP 6.0 | (TODO) -- GDC | CNV__unfiltered__snp6 |
| TCGA-OL-A5RY-10A-01D-A28D-01 | Affymetrix SNP 6.0 | (TODO) -- GDC | CNV__snp6 |
| TCGA-OL-A5RZ-10A-01D-A28D-01 | Affymetrix SNP 6.0 | (TODO) -- GDC | CNV__unfiltered__snp6 |
| TCGA-OL-A5RZ-10A-01D-A28D-01 | Affymetrix SNP 6.0 | (TODO) -- GDC | CNV__snp6 |
| TCGA-OL-A5S0-10A-01D-A28D-01 | Affymetrix SNP 6.0 | (TODO) -- GDC | CNV__unfiltered__snp6 |
| TCGA-OL-A5S0-10A-01D-A28D-01 | Affymetrix SNP 6.0 | (TODO) -- GDC | CNV__snp6 |
| TCGA-OL-A66H-10A-01D-A29M-01 | Affymetrix SNP 6.0 | (TODO) -- GDC | CNV__unfiltered__snp6 |
| TCGA-OL-A66H-10A-01D-A29M-01 | Affymetrix SNP 6.0 | (TODO) -- GDC | CNV__snp6 |
| TCGA-OL-A66I-10A-01D-A29M-01 | Affymetrix SNP 6.0 | (TODO) -- GDC | CNV__unfiltered__snp6 |
| TCGA-OL-A66I-10A-01D-A29M-01 | Affymetrix SNP 6.0 | (TODO) -- GDC | CNV__snp6 |
| TCGA-OL-A66J-10A-01D-A29M-01 | Affymetrix SNP 6.0 | (TODO) -- GDC | CNV__unfiltered__snp6 |
| TCGA-OL-A66J-10A-01D-A29M-01 | Affymetrix SNP 6.0 | (TODO) -- GDC | CNV__snp6 |
| TCGA-OL-A66K-10A-01D-A29M-01 | Affymetrix SNP 6.0 | (TODO) -- GDC | CNV__unfiltered__snp6 |
| TCGA-OL-A66K-10A-01D-A29M-01 | Affymetrix SNP 6.0 | (TODO) -- GDC | CNV__snp6 |
| TCGA-OL-A66L-10A-01D-A31T-01 | Affymetrix SNP 6.0 | (TODO) -- GDC | CNV__unfiltered__snp6 |
| TCGA-OL-A66L-10A-01D-A31T-01 | Affymetrix SNP 6.0 | (TODO) -- GDC | CNV__snp6 |
| TCGA-OL-A66N-10A-01D-A31T-01 | Affymetrix SNP 6.0 | (TODO) -- GDC | CNV__unfiltered__snp6 |
| TCGA-OL-A66N-10A-01D-A31T-01 | Affymetrix SNP 6.0 | (TODO) -- GDC | CNV__snp6 |
| TCGA-OL-A66O-10A-01D-A31T-01 | Affymetrix SNP 6.0 | (TODO) -- GDC | CNV__unfiltered__snp6 |
| TCGA-OL-A66O-10A-01D-A31T-01 | Affymetrix SNP 6.0 | (TODO) -- GDC | CNV__snp6 |
| TCGA-OL-A66P-10A-01D-A31T-01 | Affymetrix SNP 6.0 | (TODO) -- GDC | CNV__unfiltered__snp6 |
| TCGA-OL-A66P-10A-01D-A31T-01 | Affymetrix SNP 6.0 | (TODO) -- GDC | CNV__snp6 |
| TCGA-OL-A6VO-10A-01D-A33G-01 | Affymetrix SNP 6.0 | (TODO) -- GDC | CNV__unfiltered__snp6 |
| TCGA-OL-A6VO-10A-01D-A33G-01 | Affymetrix SNP 6.0 | (TODO) -- GDC | CNV__snp6 |
| TCGA-OL-A6VQ-10B-01D-A41E-01 | Affymetrix SNP 6.0 | (TODO) -- GDC | CNV__unfiltered__snp6 |
| TCGA-OL-A6VQ-10B-01D-A41E-01 | Affymetrix SNP 6.0 | (TODO) -- GDC | CNV__snp6 |
| TCGA-OL-A6VR-10A-01D-A33G-01 | Affymetrix SNP 6.0 | (TODO) -- GDC | CNV__unfiltered__snp6 |
| TCGA-OL-A6VR-10A-01D-A33G-01 | Affymetrix SNP 6.0 | (TODO) -- GDC | CNV__snp6 |
| TCGA-OL-A97C-10A-01D-A41E-01 | Affymetrix SNP 6.0 | (TODO) -- GDC | CNV__unfiltered__snp6 |
| TCGA-OL-A97C-10A-01D-A41E-01 | Affymetrix SNP 6.0 | (TODO) -- GDC | CNV__snp6 |
| TCGA-PE-A5DC-10A-01D-A27O-01 | Affymetrix SNP 6.0 | (TODO) -- GDC | CNV__unfiltered__snp6 |
| TCGA-PE-A5DC-10A-01D-A27O-01 | Affymetrix SNP 6.0 | (TODO) -- GDC | CNV__snp6 |
| TCGA-PE-A5DD-10A-01D-A27O-01 | Affymetrix SNP 6.0 | (TODO) -- GDC | CNV__unfiltered__snp6 |
| TCGA-PE-A5DD-10A-01D-A27O-01 | Affymetrix SNP 6.0 | (TODO) -- GDC | CNV__snp6 |
| TCGA-PE-A5DE-10A-01D-A27O-01 | Affymetrix SNP 6.0 | (TODO) -- GDC | CNV__unfiltered__snp6 |
| TCGA-PE-A5DE-10A-01D-A27O-01 | Affymetrix SNP 6.0 | (TODO) -- GDC | CNV__snp6 |
| TCGA-PL-A8LV-10A-01D-A41E-01 | Affymetrix SNP 6.0 | (TODO) -- GDC | CNV__unfiltered__snp6 |
| TCGA-PL-A8LV-10A-01D-A41E-01 | Affymetrix SNP 6.0 | (TODO) -- GDC | CNV__snp6 |
| TCGA-PL-A8LX-10A-01D-A41E-01 | Affymetrix SNP 6.0 | (TODO) -- GDC | CNV__unfiltered__snp6 |
| TCGA-PL-A8LX-10A-01D-A41E-01 | Affymetrix SNP 6.0 | (TODO) -- GDC | CNV__snp6 |
| TCGA-PL-A8LY-10A-01D-A41E-01 | Affymetrix SNP 6.0 | (TODO) -- GDC | CNV__unfiltered__snp6 |
| TCGA-PL-A8LY-10A-01D-A41E-01 | Affymetrix SNP 6.0 | (TODO) -- GDC | CNV__snp6 |
| TCGA-PL-A8LZ-10A-01D-A40C-01 | Affymetrix SNP 6.0 | (TODO) -- GDC | CNV__unfiltered__snp6 |
| TCGA-PL-A8LZ-10A-01D-A40C-01 | Affymetrix SNP 6.0 | (TODO) -- GDC | CNV__snp6 |
| TCGA-S3-A6ZF-10B-01D-A32H-01 | Affymetrix SNP 6.0 | (TODO) -- GDC | CNV__unfiltered__snp6 |
| TCGA-S3-A6ZF-10B-01D-A32H-01 | Affymetrix SNP 6.0 | (TODO) -- GDC | CNV__snp6 |
| TCGA-S3-A6ZG-10B-01D-A32H-01 | Affymetrix SNP 6.0 | (TODO) -- GDC | CNV__unfiltered__snp6 |
| TCGA-S3-A6ZG-10B-01D-A32H-01 | Affymetrix SNP 6.0 | (TODO) -- GDC | CNV__snp6 |
| TCGA-S3-A6ZH-10B-01D-A32H-01 | Affymetrix SNP 6.0 | (TODO) -- GDC | CNV__unfiltered__snp6 |
| TCGA-S3-A6ZH-10B-01D-A32H-01 | Affymetrix SNP 6.0 | (TODO) -- GDC | CNV__snp6 |
| TCGA-S3-AA0Z-10A-01D-A41E-01 | Affymetrix SNP 6.0 | (TODO) -- GDC | CNV__unfiltered__snp6 |
| TCGA-S3-AA0Z-10A-01D-A41E-01 | Affymetrix SNP 6.0 | (TODO) -- GDC | CNV__snp6 |
| TCGA-S3-AA10-10A-01D-A41E-01 | Affymetrix SNP 6.0 | (TODO) -- GDC | CNV__unfiltered__snp6 |
| TCGA-S3-AA10-10A-01D-A41E-01 | Affymetrix SNP 6.0 | (TODO) -- GDC | CNV__snp6 |
| TCGA-S3-AA11-10B-01D-A41E-01 | Affymetrix SNP 6.0 | (TODO) -- GDC | CNV__unfiltered__snp6 |
| TCGA-S3-AA11-10B-01D-A41E-01 | Affymetrix SNP 6.0 | (TODO) -- GDC | CNV__snp6 |
| TCGA-S3-AA12-10A-01D-A41E-01 | Affymetrix SNP 6.0 | (TODO) -- GDC | CNV__unfiltered__snp6 |
| TCGA-S3-AA12-10A-01D-A41E-01 | Affymetrix SNP 6.0 | (TODO) -- GDC | CNV__snp6 |
| TCGA-S3-AA14-10A-01D-A41E-01 | Affymetrix SNP 6.0 | (TODO) -- GDC | CNV__unfiltered__snp6 |
| TCGA-S3-AA14-10A-01D-A41E-01 | Affymetrix SNP 6.0 | (TODO) -- GDC | CNV__snp6 |
| TCGA-S3-AA15-10A-01D-A41E-01 | Affymetrix SNP 6.0 | (TODO) -- GDC | CNV__unfiltered__snp6 |
| TCGA-S3-AA15-10A-01D-A41E-01 | Affymetrix SNP 6.0 | (TODO) -- GDC | CNV__snp6 |
| TCGA-S3-AA17-10A-01D-A41E-01 | Affymetrix SNP 6.0 | (TODO) -- GDC | CNV__unfiltered__snp6 |
| TCGA-S3-AA17-10A-01D-A41E-01 | Affymetrix SNP 6.0 | (TODO) -- GDC | CNV__snp6 |
| TCGA-UL-AAZ6-10A-01D-A41E-01 | Affymetrix SNP 6.0 | (TODO) -- GDC | CNV__unfiltered__snp6 |
| TCGA-UL-AAZ6-10A-01D-A41E-01 | Affymetrix SNP 6.0 | (TODO) -- GDC | CNV__snp6 |
| TCGA-UU-A93S-10A-01D-A41E-01 | Affymetrix SNP 6.0 | (TODO) -- GDC | CNV__unfiltered__snp6 |
| TCGA-UU-A93S-10A-01D-A41E-01 | Affymetrix SNP 6.0 | (TODO) -- GDC | CNV__snp6 |
| TCGA-V7-A7HQ-10A-01D-A33G-01 | Affymetrix SNP 6.0 | (TODO) -- GDC | CNV__unfiltered__snp6 |
| TCGA-V7-A7HQ-10A-01D-A33G-01 | Affymetrix SNP 6.0 | (TODO) -- GDC | CNV__snp6 |
| TCGA-W8-A86G-10A-01D-A36L-01 | Affymetrix SNP 6.0 | (TODO) -- GDC | CNV__unfiltered__snp6 |
| TCGA-W8-A86G-10A-01D-A36L-01 | Affymetrix SNP 6.0 | (TODO) -- GDC | CNV__snp6 |
| TCGA-WT-AB41-10A-01D-A41E-01 | Affymetrix SNP 6.0 | (TODO) -- GDC | CNV__unfiltered__snp6 |
| TCGA-WT-AB41-10A-01D-A41E-01 | Affymetrix SNP 6.0 | (TODO) -- GDC | CNV__snp6 |
| TCGA-WT-AB44-10A-01D-A41E-01 | Affymetrix SNP 6.0 | (TODO) -- GDC | CNV__unfiltered__snp6 |
| TCGA-WT-AB44-10A-01D-A41E-01 | Affymetrix SNP 6.0 | (TODO) -- GDC | CNV__snp6 |
| TCGA-XX-A899-10A-01D-A40C-01 | Affymetrix SNP 6.0 | (TODO) -- GDC | CNV__unfiltered__snp6 |
| TCGA-XX-A899-10A-01D-A40C-01 | Affymetrix SNP 6.0 | (TODO) -- GDC | CNV__snp6 |
| TCGA-XX-A89A-10A-01D-A36L-01 | Affymetrix SNP 6.0 | (TODO) -- GDC | CNV__unfiltered__snp6 |
| TCGA-XX-A89A-10A-01D-A36L-01 | Affymetrix SNP 6.0 | (TODO) -- GDC | CNV__snp6 |
| TCGA-Z7-A8R5-10A-01D-A41E-01 | Affymetrix SNP 6.0 | (TODO) -- GDC | CNV__unfiltered__snp6 |
| TCGA-Z7-A8R5-10A-01D-A41E-01 | Affymetrix SNP 6.0 | (TODO) -- GDC | CNV__snp6 |
| TCGA-Z7-A8R6-10A-01D-A41E-01 | Affymetrix SNP 6.0 | (TODO) -- GDC | CNV__unfiltered__snp6 |
| TCGA-Z7-A8R6-10A-01D-A41E-01 | Affymetrix SNP 6.0 | (TODO) -- GDC | CNV__snp6 |
Table S4.
| TCGA Barcode | Platform | Center | Annotation |
|---|---|---|---|
| TCGA-AC-A6IX | (TODO) -- GDC | clinical__biospecimen | |
| TCGA-BH-A18V | (TODO) -- GDC | clinical__biospecimen | |
| TCGA-BH-A1ES | (TODO) -- GDC | clinical__biospecimen | |
| TCGA-BH-A1FE | (TODO) -- GDC | clinical__biospecimen | |
| TCGA-E2-A15A | (TODO) -- GDC | clinical__biospecimen | |
| TCGA-E2-A15E | (TODO) -- GDC | clinical__biospecimen | |
| TCGA-E2-A15K | (TODO) -- GDC | clinical__biospecimen |
Table S5.
| TCGA Barcode | Platform | Center | Annotation |
|---|---|---|---|
| TCGA-AC-A6IX | (TODO) -- GDC | clinical__primary | |
| TCGA-BH-A18V | (TODO) -- GDC | clinical__primary | |
| TCGA-BH-A1ES | (TODO) -- GDC | clinical__primary | |
| TCGA-BH-A1FE | (TODO) -- GDC | clinical__primary | |
| TCGA-E2-A15A | (TODO) -- GDC | clinical__primary | |
| TCGA-E2-A15E | (TODO) -- GDC | clinical__primary | |
| TCGA-E2-A15K | (TODO) -- GDC | clinical__primary |
Table S6.
| TCGA Barcode | Platform | Center | Annotation |
|---|---|---|---|
| TCGA-AC-A6IX-06A-11D-A32H-01 | Affymetrix SNP 6.0 | (TODO) -- GDC | CNV__unfiltered__snp6 |
| TCGA-AC-A6IX-06A-11D-A32H-01 | Affymetrix SNP 6.0 | (TODO) -- GDC | CNV__snp6 |
| TCGA-BH-A18V-06A-11D-A20R-01 | Affymetrix SNP 6.0 | (TODO) -- GDC | CNV__unfiltered__snp6 |
| TCGA-BH-A18V-06A-11D-A20R-01 | Affymetrix SNP 6.0 | (TODO) -- GDC | CNV__snp6 |
| TCGA-BH-A1ES-06A-12D-A242-01 | Affymetrix SNP 6.0 | (TODO) -- GDC | CNV__unfiltered__snp6 |
| TCGA-BH-A1ES-06A-12D-A242-01 | Affymetrix SNP 6.0 | (TODO) -- GDC | CNV__snp6 |
| TCGA-BH-A1FE-06A-11D-A20R-01 | Affymetrix SNP 6.0 | (TODO) -- GDC | CNV__unfiltered__snp6 |
| TCGA-BH-A1FE-06A-11D-A20R-01 | Affymetrix SNP 6.0 | (TODO) -- GDC | CNV__snp6 |
| TCGA-E2-A15A-06A-11D-A12A-01 | Affymetrix SNP 6.0 | (TODO) -- GDC | CNV__unfiltered__snp6 |
| TCGA-E2-A15A-06A-11D-A12A-01 | Affymetrix SNP 6.0 | (TODO) -- GDC | CNV__snp6 |
| TCGA-E2-A15E-06A-11D-A12A-01 | Affymetrix SNP 6.0 | (TODO) -- GDC | CNV__unfiltered__snp6 |
| TCGA-E2-A15E-06A-11D-A12A-01 | Affymetrix SNP 6.0 | (TODO) -- GDC | CNV__snp6 |
| TCGA-E2-A15K-06A-11D-A12N-01 | Affymetrix SNP 6.0 | (TODO) -- GDC | CNV__unfiltered__snp6 |
| TCGA-E2-A15K-06A-11D-A12N-01 | Affymetrix SNP 6.0 | (TODO) -- GDC | CNV__snp6 |
Table S7.
| TCGA Barcode | Platform | Center | Annotation |
|---|---|---|---|
| TCGA-AC-A6IX-06A-11R-A32P-07 | (TODO) -- GDC | mRNA__geneExpNormed__FPKM | |
| TCGA-AC-A6IX-06A-11R-A32P-07 | (TODO) -- GDC | mRNA__geneExp__FPKM | |
| TCGA-AC-A6IX-06A-11R-A32P-07 | (TODO) -- GDC | mRNA__counts__FPKM | |
| TCGA-BH-A18V-06A-11R-A213-07 | (TODO) -- GDC | mRNA__geneExpNormed__FPKM | |
| TCGA-BH-A18V-06A-11R-A213-07 | (TODO) -- GDC | mRNA__geneExp__FPKM | |
| TCGA-BH-A18V-06A-11R-A213-07 | (TODO) -- GDC | mRNA__counts__FPKM | |
| TCGA-BH-A1ES-06A-12R-A24H-07 | (TODO) -- GDC | mRNA__geneExpNormed__FPKM | |
| TCGA-BH-A1ES-06A-12R-A24H-07 | (TODO) -- GDC | mRNA__geneExp__FPKM | |
| TCGA-BH-A1ES-06A-12R-A24H-07 | (TODO) -- GDC | mRNA__counts__FPKM | |
| TCGA-BH-A1FE-06A-11R-A213-07 | (TODO) -- GDC | mRNA__geneExpNormed__FPKM | |
| TCGA-BH-A1FE-06A-11R-A213-07 | (TODO) -- GDC | mRNA__geneExp__FPKM | |
| TCGA-BH-A1FE-06A-11R-A213-07 | (TODO) -- GDC | mRNA__counts__FPKM | |
| TCGA-E2-A15A-06A-11R-A12D-07 | (TODO) -- GDC | mRNA__geneExpNormed__FPKM | |
| TCGA-E2-A15A-06A-11R-A12D-07 | (TODO) -- GDC | mRNA__geneExp__FPKM | |
| TCGA-E2-A15A-06A-11R-A12D-07 | (TODO) -- GDC | mRNA__counts__FPKM | |
| TCGA-E2-A15E-06A-11R-A12D-07 | (TODO) -- GDC | mRNA__geneExpNormed__FPKM | |
| TCGA-E2-A15E-06A-11R-A12D-07 | (TODO) -- GDC | mRNA__geneExp__FPKM | |
| TCGA-E2-A15E-06A-11R-A12D-07 | (TODO) -- GDC | mRNA__counts__FPKM | |
| TCGA-E2-A15K-06A-11R-A12P-07 | (TODO) -- GDC | mRNA__geneExpNormed__FPKM | |
| TCGA-E2-A15K-06A-11R-A12P-07 | (TODO) -- GDC | mRNA__geneExp__FPKM | |
| TCGA-E2-A15K-06A-11R-A12P-07 | (TODO) -- GDC | mRNA__counts__FPKM |
Table S8.
| TCGA Barcode | Platform | Center | Annotation |
|---|---|---|---|
| TCGA-AC-A6IX-06A-11R-A32K-13 | (TODO) -- GDC | miR__geneExp | |
| TCGA-AC-A6IX-06A-11R-A32K-13 | (TODO) -- GDC | miR__isoformExp | |
| TCGA-BH-A18V-06A-11R-A214-13 | (TODO) -- GDC | miR__geneExp | |
| TCGA-BH-A18V-06A-11R-A214-13 | (TODO) -- GDC | miR__isoformExp | |
| TCGA-BH-A1ES-06A-12R-A24J-13 | (TODO) -- GDC | miR__geneExp | |
| TCGA-BH-A1ES-06A-12R-A24J-13 | (TODO) -- GDC | miR__isoformExp | |
| TCGA-BH-A1FE-06A-11R-A214-13 | (TODO) -- GDC | miR__geneExp | |
| TCGA-BH-A1FE-06A-11R-A214-13 | (TODO) -- GDC | miR__isoformExp | |
| TCGA-E2-A15A-06A-11R-A12C-13 | (TODO) -- GDC | miR__geneExp | |
| TCGA-E2-A15A-06A-11R-A12C-13 | (TODO) -- GDC | miR__isoformExp | |
| TCGA-E2-A15E-06A-11R-A12C-13 | (TODO) -- GDC | miR__geneExp | |
| TCGA-E2-A15E-06A-11R-A12C-13 | (TODO) -- GDC | miR__isoformExp | |
| TCGA-E2-A15K-06A-11R-A12O-13 | (TODO) -- GDC | miR__geneExp | |
| TCGA-E2-A15K-06A-11R-A12O-13 | (TODO) -- GDC | miR__isoformExp |
Table S9.
| TCGA Barcode | Platform | Center | Annotation |
|---|---|---|---|
| TCGA-AC-A6IX-06A-11D-A32I-09 | (TODO) -- GDC | SNV__mutect | |
| TCGA-BH-A18V-06A-11D-A20S-09 | (TODO) -- GDC | SNV__mutect | |
| TCGA-BH-A1ES-06A-12D-A243-09 | (TODO) -- GDC | SNV__mutect | |
| TCGA-BH-A1FE-06A-11D-A20S-09 | (TODO) -- GDC | SNV__mutect | |
| TCGA-E2-A15A-06A-11D-A12B-09 | (TODO) -- GDC | SNV__mutect | |
| TCGA-E2-A15E-06A-11D-A12B-09 | (TODO) -- GDC | SNV__mutect | |
| TCGA-E2-A15K-06A-11D-A12Q-09 | (TODO) -- GDC | SNV__mutect |
Table S10.
| TCGA Barcode | Platform | Center | Annotation |
|---|---|---|---|
| TCGA-AC-A6IX-06A-11D-A32T-05 | Illumina Human Methylation 450 | (TODO) -- GDC | methylation__HM450 |
| TCGA-BH-A18V-06A-11D-A212-05 | Illumina Human Methylation 450 | (TODO) -- GDC | methylation__HM450 |
| TCGA-BH-A1ES-06A-12D-A244-05 | Illumina Human Methylation 450 | (TODO) -- GDC | methylation__HM450 |
| TCGA-BH-A1FE-06A-11D-A212-05 | Illumina Human Methylation 450 | (TODO) -- GDC | methylation__HM450 |
| TCGA-E2-A15A-06A-11D-A12E-05 | Illumina Human Methylation 27 | (TODO) -- GDC | methylation__HM27 |
| TCGA-E2-A15E-06A-11D-A12E-05 | Illumina Human Methylation 27 | (TODO) -- GDC | methylation__HM27 |
| TCGA-E2-A15K-06A-11D-A12R-05 | Illumina Human Methylation 450 | (TODO) -- GDC | methylation__HM450 |
Table S11.
| TCGA Barcode | Platform | Center | Annotation |
|---|---|---|---|
| TCGA-A7-A0CE | (TODO) -- GDC | clinical__biospecimen | |
| TCGA-A7-A0CH | (TODO) -- GDC | clinical__biospecimen | |
| TCGA-A7-A0D9 | (TODO) -- GDC | clinical__biospecimen | |
| TCGA-A7-A0DB | (TODO) -- GDC | clinical__biospecimen | |
| TCGA-A7-A0DC | (TODO) -- GDC | clinical__biospecimen | |
| TCGA-A7-A13E | (TODO) -- GDC | clinical__biospecimen | |
| TCGA-A7-A13F | (TODO) -- GDC | clinical__biospecimen | |
| TCGA-A7-A13G | (TODO) -- GDC | clinical__biospecimen | |
| TCGA-A7-A4SA | (TODO) -- GDC | clinical__biospecimen | |
| TCGA-A7-A4SC | (TODO) -- GDC | clinical__biospecimen | |
| TCGA-A7-A4SD | (TODO) -- GDC | clinical__biospecimen | |
| TCGA-A7-A4SE | (TODO) -- GDC | clinical__biospecimen | |
| TCGA-A7-A56D | (TODO) -- GDC | clinical__biospecimen | |
| TCGA-A7-A5ZX | (TODO) -- GDC | clinical__biospecimen | |
| TCGA-AC-A23G | (TODO) -- GDC | clinical__biospecimen | |
| TCGA-AC-A23H | (TODO) -- GDC | clinical__biospecimen | |
| TCGA-AC-A2BK | (TODO) -- GDC | clinical__biospecimen | |
| TCGA-AC-A2BM | (TODO) -- GDC | clinical__biospecimen | |
| TCGA-AC-A2FB | (TODO) -- GDC | clinical__biospecimen | |
| TCGA-AC-A2FE | (TODO) -- GDC | clinical__biospecimen | |
| TCGA-AC-A2FF | (TODO) -- GDC | clinical__biospecimen | |
| TCGA-AC-A2FG | (TODO) -- GDC | clinical__biospecimen | |
| TCGA-AC-A2FK | (TODO) -- GDC | clinical__biospecimen | |
| TCGA-AC-A2FM | (TODO) -- GDC | clinical__biospecimen | |
| TCGA-AC-A2FO | (TODO) -- GDC | clinical__biospecimen | |
| TCGA-AC-A2QJ | (TODO) -- GDC | clinical__biospecimen | |
| TCGA-AC-A3EH | (TODO) -- GDC | clinical__biospecimen | |
| TCGA-AC-A5XS | (TODO) -- GDC | clinical__biospecimen | |
| TCGA-BH-A0AU | (TODO) -- GDC | clinical__biospecimen | |
| TCGA-BH-A0AY | (TODO) -- GDC | clinical__biospecimen | |
| TCGA-BH-A0AZ | (TODO) -- GDC | clinical__biospecimen | |
| TCGA-BH-A0B3 | (TODO) -- GDC | clinical__biospecimen | |
| TCGA-BH-A0B5 | (TODO) -- GDC | clinical__biospecimen | |
| TCGA-BH-A0B7 | (TODO) -- GDC | clinical__biospecimen | |
| TCGA-BH-A0B8 | (TODO) -- GDC | clinical__biospecimen | |
| TCGA-BH-A0BA | (TODO) -- GDC | clinical__biospecimen | |
| TCGA-BH-A0BC | (TODO) -- GDC | clinical__biospecimen | |
| TCGA-BH-A0BF | (TODO) -- GDC | clinical__biospecimen | |
| TCGA-BH-A0BJ | (TODO) -- GDC | clinical__biospecimen | |
| TCGA-BH-A0BL | (TODO) -- GDC | clinical__biospecimen | |
| TCGA-BH-A0BM | (TODO) -- GDC | clinical__biospecimen | |
| TCGA-BH-A0BO | (TODO) -- GDC | clinical__biospecimen | |
| TCGA-BH-A0BQ | (TODO) -- GDC | clinical__biospecimen | |
| TCGA-BH-A0BS | (TODO) -- GDC | clinical__biospecimen | |
| TCGA-BH-A0BT | (TODO) -- GDC | clinical__biospecimen | |
| TCGA-BH-A0BV | (TODO) -- GDC | clinical__biospecimen | |
| TCGA-BH-A0BW | (TODO) -- GDC | clinical__biospecimen | |
| TCGA-BH-A0BZ | (TODO) -- GDC | clinical__biospecimen | |
| TCGA-BH-A0C0 | (TODO) -- GDC | clinical__biospecimen | |
| TCGA-BH-A0C3 | (TODO) -- GDC | clinical__biospecimen | |
| TCGA-BH-A0DD | (TODO) -- GDC | clinical__biospecimen | |
| TCGA-BH-A0DE | (TODO) -- GDC | clinical__biospecimen | |
| TCGA-BH-A0DG | (TODO) -- GDC | clinical__biospecimen | |
| TCGA-BH-A0DH | (TODO) -- GDC | clinical__biospecimen | |
| TCGA-BH-A0DI | (TODO) -- GDC | clinical__biospecimen | |
| TCGA-BH-A0DK | (TODO) -- GDC | clinical__biospecimen | |
| TCGA-BH-A0DL | (TODO) -- GDC | clinical__biospecimen | |
| TCGA-BH-A0DO | (TODO) -- GDC | clinical__biospecimen | |
| TCGA-BH-A0DP | (TODO) -- GDC | clinical__biospecimen | |
| TCGA-BH-A0DQ | (TODO) -- GDC | clinical__biospecimen | |
| TCGA-BH-A0DT | (TODO) -- GDC | clinical__biospecimen | |
| TCGA-BH-A0DV | (TODO) -- GDC | clinical__biospecimen | |
| TCGA-BH-A0DZ | (TODO) -- GDC | clinical__biospecimen | |
| TCGA-BH-A0E0 | (TODO) -- GDC | clinical__biospecimen | |
| TCGA-BH-A0E1 | (TODO) -- GDC | clinical__biospecimen | |
| TCGA-BH-A0H3 | (TODO) -- GDC | clinical__biospecimen | |
| TCGA-BH-A0H5 | (TODO) -- GDC | clinical__biospecimen | |
| TCGA-BH-A0H7 | (TODO) -- GDC | clinical__biospecimen | |
| TCGA-BH-A0H9 | (TODO) -- GDC | clinical__biospecimen | |
| TCGA-BH-A0HA | (TODO) -- GDC | clinical__biospecimen | |
| TCGA-BH-A0HK | (TODO) -- GDC | clinical__biospecimen | |
| TCGA-BH-A18F | (TODO) -- GDC | clinical__biospecimen | |
| TCGA-BH-A18J | (TODO) -- GDC | clinical__biospecimen | |
| TCGA-BH-A18K | (TODO) -- GDC | clinical__biospecimen | |
| TCGA-BH-A18L | (TODO) -- GDC | clinical__biospecimen | |
| TCGA-BH-A18M | (TODO) -- GDC | clinical__biospecimen | |
| TCGA-BH-A18N | (TODO) -- GDC | clinical__biospecimen | |
| TCGA-BH-A18P | (TODO) -- GDC | clinical__biospecimen | |
| TCGA-BH-A18Q | (TODO) -- GDC | clinical__biospecimen | |
| TCGA-BH-A18R | (TODO) -- GDC | clinical__biospecimen | |
| TCGA-BH-A18S | (TODO) -- GDC | clinical__biospecimen | |
| TCGA-BH-A18T | (TODO) -- GDC | clinical__biospecimen | |
| TCGA-BH-A18U | (TODO) -- GDC | clinical__biospecimen | |
| TCGA-BH-A18V | (TODO) -- GDC | clinical__biospecimen | |
| TCGA-BH-A1EN | (TODO) -- GDC | clinical__biospecimen | |
| TCGA-BH-A1EO | (TODO) -- GDC | clinical__biospecimen | |
| TCGA-BH-A1ES | (TODO) -- GDC | clinical__biospecimen | |
| TCGA-BH-A1ET | (TODO) -- GDC | clinical__biospecimen | |
| TCGA-BH-A1EU | (TODO) -- GDC | clinical__biospecimen | |
| TCGA-BH-A1EV | (TODO) -- GDC | clinical__biospecimen | |
| TCGA-BH-A1EW | (TODO) -- GDC | clinical__biospecimen | |
| TCGA-BH-A1EX | (TODO) -- GDC | clinical__biospecimen | |
| TCGA-BH-A1EY | (TODO) -- GDC | clinical__biospecimen | |
| TCGA-BH-A1F0 | (TODO) -- GDC | clinical__biospecimen | |
| TCGA-BH-A1F2 | (TODO) -- GDC | clinical__biospecimen | |
| TCGA-BH-A1F5 | (TODO) -- GDC | clinical__biospecimen | |
| TCGA-BH-A1F6 | (TODO) -- GDC | clinical__biospecimen | |
| TCGA-BH-A1F8 | (TODO) -- GDC | clinical__biospecimen | |
| TCGA-BH-A1FB | (TODO) -- GDC | clinical__biospecimen | |
| TCGA-BH-A1FC | (TODO) -- GDC | clinical__biospecimen | |
| TCGA-BH-A1FD | (TODO) -- GDC | clinical__biospecimen | |
| TCGA-BH-A1FE | (TODO) -- GDC | clinical__biospecimen | |
| TCGA-BH-A1FG | (TODO) -- GDC | clinical__biospecimen | |
| TCGA-BH-A1FH | (TODO) -- GDC | clinical__biospecimen | |
| TCGA-BH-A1FJ | (TODO) -- GDC | clinical__biospecimen | |
| TCGA-BH-A1FL | (TODO) -- GDC | clinical__biospecimen | |
| TCGA-BH-A1FM | (TODO) -- GDC | clinical__biospecimen | |
| TCGA-BH-A1FN | (TODO) -- GDC | clinical__biospecimen | |
| TCGA-BH-A1FR | (TODO) -- GDC | clinical__biospecimen | |
| TCGA-BH-A1FU | (TODO) -- GDC | clinical__biospecimen | |
| TCGA-BH-A203 | (TODO) -- GDC | clinical__biospecimen | |
| TCGA-BH-A204 | (TODO) -- GDC | clinical__biospecimen | |
| TCGA-BH-A208 | (TODO) -- GDC | clinical__biospecimen | |
| TCGA-BH-A209 | (TODO) -- GDC | clinical__biospecimen | |
| TCGA-BH-A5IZ | (TODO) -- GDC | clinical__biospecimen | |
| TCGA-BH-AB28 | (TODO) -- GDC | clinical__biospecimen | |
| TCGA-E2-A14Y | (TODO) -- GDC | clinical__biospecimen | |
| TCGA-E2-A153 | (TODO) -- GDC | clinical__biospecimen | |
| TCGA-E2-A158 | (TODO) -- GDC | clinical__biospecimen | |
| TCGA-E2-A15I | (TODO) -- GDC | clinical__biospecimen | |
| TCGA-E2-A15K | (TODO) -- GDC | clinical__biospecimen | |
| TCGA-E2-A15L | (TODO) -- GDC | clinical__biospecimen | |
| TCGA-E2-A15M | (TODO) -- GDC | clinical__biospecimen | |
| TCGA-E2-A1B5 | (TODO) -- GDC | clinical__biospecimen | |
| TCGA-E2-A1BC | (TODO) -- GDC | clinical__biospecimen | |
| TCGA-E2-A1IF | (TODO) -- GDC | clinical__biospecimen | |
| TCGA-E2-A1IG | (TODO) -- GDC | clinical__biospecimen | |
| TCGA-E2-A1II | (TODO) -- GDC | clinical__biospecimen | |
| TCGA-E2-A1IO | (TODO) -- GDC | clinical__biospecimen | |
| TCGA-E2-A1IU | (TODO) -- GDC | clinical__biospecimen | |
| TCGA-E2-A1L7 | (TODO) -- GDC | clinical__biospecimen | |
| TCGA-E2-A1LB | (TODO) -- GDC | clinical__biospecimen | |
| TCGA-E2-A1LE | (TODO) -- GDC | clinical__biospecimen | |
| TCGA-E2-A1LG | (TODO) -- GDC | clinical__biospecimen | |
| TCGA-E2-A1LH | (TODO) -- GDC | clinical__biospecimen | |
| TCGA-E2-A1LI | (TODO) -- GDC | clinical__biospecimen | |
| TCGA-E2-A1LK | (TODO) -- GDC | clinical__biospecimen | |
| TCGA-E2-A1LL | (TODO) -- GDC | clinical__biospecimen | |
| TCGA-E2-A1LS | (TODO) -- GDC | clinical__biospecimen | |
| TCGA-E9-A1N4 | (TODO) -- GDC | clinical__biospecimen | |
| TCGA-E9-A1N5 | (TODO) -- GDC | clinical__biospecimen | |
| TCGA-E9-A1N6 | (TODO) -- GDC | clinical__biospecimen | |
| TCGA-E9-A1N8 | (TODO) -- GDC | clinical__biospecimen | |
| TCGA-E9-A1N9 | (TODO) -- GDC | clinical__biospecimen | |
| TCGA-E9-A1NA | (TODO) -- GDC | clinical__biospecimen | |
| TCGA-E9-A1ND | (TODO) -- GDC | clinical__biospecimen | |
| TCGA-E9-A1NE | (TODO) -- GDC | clinical__biospecimen | |
| TCGA-E9-A1NF | (TODO) -- GDC | clinical__biospecimen | |
| TCGA-E9-A1NG | (TODO) -- GDC | clinical__biospecimen | |
| TCGA-E9-A1NH | (TODO) -- GDC | clinical__biospecimen | |
| TCGA-E9-A1R7 | (TODO) -- GDC | clinical__biospecimen | |
| TCGA-E9-A1RB | (TODO) -- GDC | clinical__biospecimen | |
| TCGA-E9-A1RC | (TODO) -- GDC | clinical__biospecimen | |
| TCGA-E9-A1RD | (TODO) -- GDC | clinical__biospecimen | |
| TCGA-E9-A1RF | (TODO) -- GDC | clinical__biospecimen | |
| TCGA-E9-A1RH | (TODO) -- GDC | clinical__biospecimen | |
| TCGA-E9-A1RI | (TODO) -- GDC | clinical__biospecimen | |
| TCGA-GI-A2C8 | (TODO) -- GDC | clinical__biospecimen | |
| TCGA-GI-A2C9 | (TODO) -- GDC | clinical__biospecimen | |
| TCGA-GM-A2D9 | (TODO) -- GDC | clinical__biospecimen | |
| TCGA-GM-A2DI | (TODO) -- GDC | clinical__biospecimen | |
| TCGA-XX-A899 | (TODO) -- GDC | clinical__biospecimen |
Table S12.
| TCGA Barcode | Platform | Center | Annotation |
|---|---|---|---|
| TCGA-A7-A0CE | (TODO) -- GDC | clinical__primary | |
| TCGA-A7-A0CH | (TODO) -- GDC | clinical__primary | |
| TCGA-A7-A0D9 | (TODO) -- GDC | clinical__primary | |
| TCGA-A7-A0DB | (TODO) -- GDC | clinical__primary | |
| TCGA-A7-A0DC | (TODO) -- GDC | clinical__primary | |
| TCGA-A7-A13E | (TODO) -- GDC | clinical__primary | |
| TCGA-A7-A13F | (TODO) -- GDC | clinical__primary | |
| TCGA-A7-A13G | (TODO) -- GDC | clinical__primary | |
| TCGA-A7-A4SA | (TODO) -- GDC | clinical__primary | |
| TCGA-A7-A4SC | (TODO) -- GDC | clinical__primary | |
| TCGA-A7-A4SD | (TODO) -- GDC | clinical__primary | |
| TCGA-A7-A4SE | (TODO) -- GDC | clinical__primary | |
| TCGA-A7-A56D | (TODO) -- GDC | clinical__primary | |
| TCGA-A7-A5ZX | (TODO) -- GDC | clinical__primary | |
| TCGA-AC-A23G | (TODO) -- GDC | clinical__primary | |
| TCGA-AC-A23H | (TODO) -- GDC | clinical__primary | |
| TCGA-AC-A2BK | (TODO) -- GDC | clinical__primary | |
| TCGA-AC-A2BM | (TODO) -- GDC | clinical__primary | |
| TCGA-AC-A2FB | (TODO) -- GDC | clinical__primary | |
| TCGA-AC-A2FE | (TODO) -- GDC | clinical__primary | |
| TCGA-AC-A2FF | (TODO) -- GDC | clinical__primary | |
| TCGA-AC-A2FG | (TODO) -- GDC | clinical__primary | |
| TCGA-AC-A2FK | (TODO) -- GDC | clinical__primary | |
| TCGA-AC-A2FM | (TODO) -- GDC | clinical__primary | |
| TCGA-AC-A2FO | (TODO) -- GDC | clinical__primary | |
| TCGA-AC-A2QJ | (TODO) -- GDC | clinical__primary | |
| TCGA-AC-A3EH | (TODO) -- GDC | clinical__primary | |
| TCGA-AC-A5XS | (TODO) -- GDC | clinical__primary | |
| TCGA-BH-A0AU | (TODO) -- GDC | clinical__primary | |
| TCGA-BH-A0AY | (TODO) -- GDC | clinical__primary | |
| TCGA-BH-A0AZ | (TODO) -- GDC | clinical__primary | |
| TCGA-BH-A0B3 | (TODO) -- GDC | clinical__primary | |
| TCGA-BH-A0B5 | (TODO) -- GDC | clinical__primary | |
| TCGA-BH-A0B7 | (TODO) -- GDC | clinical__primary | |
| TCGA-BH-A0B8 | (TODO) -- GDC | clinical__primary | |
| TCGA-BH-A0BA | (TODO) -- GDC | clinical__primary | |
| TCGA-BH-A0BC | (TODO) -- GDC | clinical__primary | |
| TCGA-BH-A0BF | (TODO) -- GDC | clinical__primary | |
| TCGA-BH-A0BJ | (TODO) -- GDC | clinical__primary | |
| TCGA-BH-A0BL | (TODO) -- GDC | clinical__primary | |
| TCGA-BH-A0BM | (TODO) -- GDC | clinical__primary | |
| TCGA-BH-A0BO | (TODO) -- GDC | clinical__primary | |
| TCGA-BH-A0BQ | (TODO) -- GDC | clinical__primary | |
| TCGA-BH-A0BS | (TODO) -- GDC | clinical__primary | |
| TCGA-BH-A0BT | (TODO) -- GDC | clinical__primary | |
| TCGA-BH-A0BV | (TODO) -- GDC | clinical__primary | |
| TCGA-BH-A0BW | (TODO) -- GDC | clinical__primary | |
| TCGA-BH-A0BZ | (TODO) -- GDC | clinical__primary | |
| TCGA-BH-A0C0 | (TODO) -- GDC | clinical__primary | |
| TCGA-BH-A0C3 | (TODO) -- GDC | clinical__primary | |
| TCGA-BH-A0DD | (TODO) -- GDC | clinical__primary | |
| TCGA-BH-A0DE | (TODO) -- GDC | clinical__primary | |
| TCGA-BH-A0DG | (TODO) -- GDC | clinical__primary | |
| TCGA-BH-A0DH | (TODO) -- GDC | clinical__primary | |
| TCGA-BH-A0DI | (TODO) -- GDC | clinical__primary | |
| TCGA-BH-A0DK | (TODO) -- GDC | clinical__primary | |
| TCGA-BH-A0DL | (TODO) -- GDC | clinical__primary | |
| TCGA-BH-A0DO | (TODO) -- GDC | clinical__primary | |
| TCGA-BH-A0DP | (TODO) -- GDC | clinical__primary | |
| TCGA-BH-A0DQ | (TODO) -- GDC | clinical__primary | |
| TCGA-BH-A0DT | (TODO) -- GDC | clinical__primary | |
| TCGA-BH-A0DV | (TODO) -- GDC | clinical__primary | |
| TCGA-BH-A0DZ | (TODO) -- GDC | clinical__primary | |
| TCGA-BH-A0E0 | (TODO) -- GDC | clinical__primary | |
| TCGA-BH-A0E1 | (TODO) -- GDC | clinical__primary | |
| TCGA-BH-A0H3 | (TODO) -- GDC | clinical__primary | |
| TCGA-BH-A0H7 | (TODO) -- GDC | clinical__primary | |
| TCGA-BH-A0H9 | (TODO) -- GDC | clinical__primary | |
| TCGA-BH-A0HA | (TODO) -- GDC | clinical__primary | |
| TCGA-BH-A0HK | (TODO) -- GDC | clinical__primary | |
| TCGA-BH-A18F | (TODO) -- GDC | clinical__primary | |
| TCGA-BH-A18J | (TODO) -- GDC | clinical__primary | |
| TCGA-BH-A18K | (TODO) -- GDC | clinical__primary | |
| TCGA-BH-A18L | (TODO) -- GDC | clinical__primary | |
| TCGA-BH-A18M | (TODO) -- GDC | clinical__primary | |
| TCGA-BH-A18N | (TODO) -- GDC | clinical__primary | |
| TCGA-BH-A18P | (TODO) -- GDC | clinical__primary | |
| TCGA-BH-A18Q | (TODO) -- GDC | clinical__primary | |
| TCGA-BH-A18R | (TODO) -- GDC | clinical__primary | |
| TCGA-BH-A18S | (TODO) -- GDC | clinical__primary | |
| TCGA-BH-A18T | (TODO) -- GDC | clinical__primary | |
| TCGA-BH-A18U | (TODO) -- GDC | clinical__primary | |
| TCGA-BH-A18V | (TODO) -- GDC | clinical__primary | |
| TCGA-BH-A1EN | (TODO) -- GDC | clinical__primary | |
| TCGA-BH-A1EO | (TODO) -- GDC | clinical__primary | |
| TCGA-BH-A1ES | (TODO) -- GDC | clinical__primary | |
| TCGA-BH-A1ET | (TODO) -- GDC | clinical__primary | |
| TCGA-BH-A1EU | (TODO) -- GDC | clinical__primary | |
| TCGA-BH-A1EV | (TODO) -- GDC | clinical__primary | |
| TCGA-BH-A1EW | (TODO) -- GDC | clinical__primary | |
| TCGA-BH-A1EX | (TODO) -- GDC | clinical__primary | |
| TCGA-BH-A1EY | (TODO) -- GDC | clinical__primary | |
| TCGA-BH-A1F0 | (TODO) -- GDC | clinical__primary | |
| TCGA-BH-A1F2 | (TODO) -- GDC | clinical__primary | |
| TCGA-BH-A1F5 | (TODO) -- GDC | clinical__primary | |
| TCGA-BH-A1F6 | (TODO) -- GDC | clinical__primary | |
| TCGA-BH-A1F8 | (TODO) -- GDC | clinical__primary | |
| TCGA-BH-A1FB | (TODO) -- GDC | clinical__primary | |
| TCGA-BH-A1FC | (TODO) -- GDC | clinical__primary | |
| TCGA-BH-A1FD | (TODO) -- GDC | clinical__primary | |
| TCGA-BH-A1FE | (TODO) -- GDC | clinical__primary | |
| TCGA-BH-A1FG | (TODO) -- GDC | clinical__primary | |
| TCGA-BH-A1FH | (TODO) -- GDC | clinical__primary | |
| TCGA-BH-A1FJ | (TODO) -- GDC | clinical__primary | |
| TCGA-BH-A1FL | (TODO) -- GDC | clinical__primary | |
| TCGA-BH-A1FM | (TODO) -- GDC | clinical__primary | |
| TCGA-BH-A1FN | (TODO) -- GDC | clinical__primary | |
| TCGA-BH-A1FR | (TODO) -- GDC | clinical__primary | |
| TCGA-BH-A1FU | (TODO) -- GDC | clinical__primary | |
| TCGA-BH-A203 | (TODO) -- GDC | clinical__primary | |
| TCGA-BH-A204 | (TODO) -- GDC | clinical__primary | |
| TCGA-BH-A208 | (TODO) -- GDC | clinical__primary | |
| TCGA-BH-A209 | (TODO) -- GDC | clinical__primary | |
| TCGA-BH-A5IZ | (TODO) -- GDC | clinical__primary | |
| TCGA-BH-AB28 | (TODO) -- GDC | clinical__primary | |
| TCGA-E2-A14Y | (TODO) -- GDC | clinical__primary | |
| TCGA-E2-A153 | (TODO) -- GDC | clinical__primary | |
| TCGA-E2-A158 | (TODO) -- GDC | clinical__primary | |
| TCGA-E2-A15I | (TODO) -- GDC | clinical__primary | |
| TCGA-E2-A15K | (TODO) -- GDC | clinical__primary | |
| TCGA-E2-A15L | (TODO) -- GDC | clinical__primary | |
| TCGA-E2-A15M | (TODO) -- GDC | clinical__primary | |
| TCGA-E2-A1B5 | (TODO) -- GDC | clinical__primary | |
| TCGA-E2-A1BC | (TODO) -- GDC | clinical__primary | |
| TCGA-E2-A1IF | (TODO) -- GDC | clinical__primary | |
| TCGA-E2-A1IG | (TODO) -- GDC | clinical__primary | |
| TCGA-E2-A1II | (TODO) -- GDC | clinical__primary | |
| TCGA-E2-A1IO | (TODO) -- GDC | clinical__primary | |
| TCGA-E2-A1IU | (TODO) -- GDC | clinical__primary | |
| TCGA-E2-A1L7 | (TODO) -- GDC | clinical__primary | |
| TCGA-E2-A1LB | (TODO) -- GDC | clinical__primary | |
| TCGA-E2-A1LE | (TODO) -- GDC | clinical__primary | |
| TCGA-E2-A1LG | (TODO) -- GDC | clinical__primary | |
| TCGA-E2-A1LH | (TODO) -- GDC | clinical__primary | |
| TCGA-E2-A1LI | (TODO) -- GDC | clinical__primary | |
| TCGA-E2-A1LK | (TODO) -- GDC | clinical__primary | |
| TCGA-E2-A1LL | (TODO) -- GDC | clinical__primary | |
| TCGA-E2-A1LS | (TODO) -- GDC | clinical__primary | |
| TCGA-E9-A1N4 | (TODO) -- GDC | clinical__primary | |
| TCGA-E9-A1N5 | (TODO) -- GDC | clinical__primary | |
| TCGA-E9-A1N6 | (TODO) -- GDC | clinical__primary | |
| TCGA-E9-A1N8 | (TODO) -- GDC | clinical__primary | |
| TCGA-E9-A1N9 | (TODO) -- GDC | clinical__primary | |
| TCGA-E9-A1NA | (TODO) -- GDC | clinical__primary | |
| TCGA-E9-A1ND | (TODO) -- GDC | clinical__primary | |
| TCGA-E9-A1NE | (TODO) -- GDC | clinical__primary | |
| TCGA-E9-A1NF | (TODO) -- GDC | clinical__primary | |
| TCGA-E9-A1NG | (TODO) -- GDC | clinical__primary | |
| TCGA-E9-A1NH | (TODO) -- GDC | clinical__primary | |
| TCGA-E9-A1R7 | (TODO) -- GDC | clinical__primary | |
| TCGA-E9-A1RB | (TODO) -- GDC | clinical__primary | |
| TCGA-E9-A1RC | (TODO) -- GDC | clinical__primary | |
| TCGA-E9-A1RD | (TODO) -- GDC | clinical__primary | |
| TCGA-E9-A1RF | (TODO) -- GDC | clinical__primary | |
| TCGA-E9-A1RH | (TODO) -- GDC | clinical__primary | |
| TCGA-E9-A1RI | (TODO) -- GDC | clinical__primary | |
| TCGA-GI-A2C8 | (TODO) -- GDC | clinical__primary | |
| TCGA-GI-A2C9 | (TODO) -- GDC | clinical__primary | |
| TCGA-GM-A2D9 | (TODO) -- GDC | clinical__primary | |
| TCGA-GM-A2DI | (TODO) -- GDC | clinical__primary | |
| TCGA-XX-A899 | (TODO) -- GDC | clinical__primary |
Table S13.
| TCGA Barcode | Platform | Center | Annotation |
|---|---|---|---|
| TCGA-A7-A0CE-11A-21D-A092-01 | Affymetrix SNP 6.0 | (TODO) -- GDC | CNV__unfiltered__snp6 |
| TCGA-A7-A0CE-11A-21D-A092-01 | Affymetrix SNP 6.0 | (TODO) -- GDC | CNV__snp6 |
| TCGA-A7-A0CH-11A-32D-A092-01 | Affymetrix SNP 6.0 | (TODO) -- GDC | CNV__unfiltered__snp6 |
| TCGA-A7-A0CH-11A-32D-A092-01 | Affymetrix SNP 6.0 | (TODO) -- GDC | CNV__snp6 |
| TCGA-A7-A0D9-11A-53D-A092-01 | Affymetrix SNP 6.0 | (TODO) -- GDC | CNV__unfiltered__snp6 |
| TCGA-A7-A0D9-11A-53D-A092-01 | Affymetrix SNP 6.0 | (TODO) -- GDC | CNV__snp6 |
| TCGA-A7-A0DB-11A-33D-A092-01 | Affymetrix SNP 6.0 | (TODO) -- GDC | CNV__unfiltered__snp6 |
| TCGA-A7-A0DB-11A-33D-A092-01 | Affymetrix SNP 6.0 | (TODO) -- GDC | CNV__snp6 |
| TCGA-A7-A0DC-11A-41D-A092-01 | Affymetrix SNP 6.0 | (TODO) -- GDC | CNV__unfiltered__snp6 |
| TCGA-A7-A0DC-11A-41D-A092-01 | Affymetrix SNP 6.0 | (TODO) -- GDC | CNV__snp6 |
| TCGA-A7-A13E-11A-61D-A12N-01 | Affymetrix SNP 6.0 | (TODO) -- GDC | CNV__unfiltered__snp6 |
| TCGA-A7-A13E-11A-61D-A12N-01 | Affymetrix SNP 6.0 | (TODO) -- GDC | CNV__snp6 |
| TCGA-A7-A13F-11A-42D-A12N-01 | Affymetrix SNP 6.0 | (TODO) -- GDC | CNV__unfiltered__snp6 |
| TCGA-A7-A13F-11A-42D-A12N-01 | Affymetrix SNP 6.0 | (TODO) -- GDC | CNV__snp6 |
| TCGA-A7-A13G-11A-51D-A13N-01 | Affymetrix SNP 6.0 | (TODO) -- GDC | CNV__unfiltered__snp6 |
| TCGA-A7-A13G-11A-51D-A13N-01 | Affymetrix SNP 6.0 | (TODO) -- GDC | CNV__snp6 |
| TCGA-A7-A4SA-11A-44D-A25N-01 | Affymetrix SNP 6.0 | (TODO) -- GDC | CNV__unfiltered__snp6 |
| TCGA-A7-A4SA-11A-44D-A25N-01 | Affymetrix SNP 6.0 | (TODO) -- GDC | CNV__snp6 |
| TCGA-A7-A4SC-11A-52D-A25N-01 | Affymetrix SNP 6.0 | (TODO) -- GDC | CNV__unfiltered__snp6 |
| TCGA-A7-A4SC-11A-52D-A25N-01 | Affymetrix SNP 6.0 | (TODO) -- GDC | CNV__snp6 |
| TCGA-A7-A4SD-11A-43D-A25N-01 | Affymetrix SNP 6.0 | (TODO) -- GDC | CNV__unfiltered__snp6 |
| TCGA-A7-A4SD-11A-43D-A25N-01 | Affymetrix SNP 6.0 | (TODO) -- GDC | CNV__snp6 |
| TCGA-A7-A4SE-11A-61D-A26F-01 | Affymetrix SNP 6.0 | (TODO) -- GDC | CNV__unfiltered__snp6 |
| TCGA-A7-A4SE-11A-61D-A26F-01 | Affymetrix SNP 6.0 | (TODO) -- GDC | CNV__snp6 |
| TCGA-A7-A56D-11A-72D-A27O-01 | Affymetrix SNP 6.0 | (TODO) -- GDC | CNV__unfiltered__snp6 |
| TCGA-A7-A56D-11A-72D-A27O-01 | Affymetrix SNP 6.0 | (TODO) -- GDC | CNV__snp6 |
| TCGA-A7-A5ZX-11A-51D-A29M-01 | Affymetrix SNP 6.0 | (TODO) -- GDC | CNV__unfiltered__snp6 |
| TCGA-A7-A5ZX-11A-51D-A29M-01 | Affymetrix SNP 6.0 | (TODO) -- GDC | CNV__snp6 |
| TCGA-AC-A23G-11A-12D-A20R-01 | Affymetrix SNP 6.0 | (TODO) -- GDC | CNV__unfiltered__snp6 |
| TCGA-AC-A23G-11A-12D-A20R-01 | Affymetrix SNP 6.0 | (TODO) -- GDC | CNV__snp6 |
| TCGA-AC-A2BK-11A-13D-A21P-01 | Affymetrix SNP 6.0 | (TODO) -- GDC | CNV__unfiltered__snp6 |
| TCGA-AC-A2BK-11A-13D-A21P-01 | Affymetrix SNP 6.0 | (TODO) -- GDC | CNV__snp6 |
| TCGA-AC-A2BM-11A-13D-A21P-01 | Affymetrix SNP 6.0 | (TODO) -- GDC | CNV__unfiltered__snp6 |
| TCGA-AC-A2BM-11A-13D-A21P-01 | Affymetrix SNP 6.0 | (TODO) -- GDC | CNV__snp6 |
| TCGA-AC-A2FB-11A-13D-A17C-01 | Affymetrix SNP 6.0 | (TODO) -- GDC | CNV__unfiltered__snp6 |
| TCGA-AC-A2FB-11A-13D-A17C-01 | Affymetrix SNP 6.0 | (TODO) -- GDC | CNV__snp6 |
| TCGA-AC-A2FE-11B-22D-A19X-01 | Affymetrix SNP 6.0 | (TODO) -- GDC | CNV__unfiltered__snp6 |
| TCGA-AC-A2FE-11B-22D-A19X-01 | Affymetrix SNP 6.0 | (TODO) -- GDC | CNV__snp6 |
| TCGA-AC-A2FF-11A-13D-A17C-01 | Affymetrix SNP 6.0 | (TODO) -- GDC | CNV__unfiltered__snp6 |
| TCGA-AC-A2FF-11A-13D-A17C-01 | Affymetrix SNP 6.0 | (TODO) -- GDC | CNV__snp6 |
| TCGA-AC-A2FG-11A-22D-A17C-01 | Affymetrix SNP 6.0 | (TODO) -- GDC | CNV__unfiltered__snp6 |
| TCGA-AC-A2FG-11A-22D-A17C-01 | Affymetrix SNP 6.0 | (TODO) -- GDC | CNV__snp6 |
| TCGA-AC-A2FK-11A-22D-A17U-01 | Affymetrix SNP 6.0 | (TODO) -- GDC | CNV__unfiltered__snp6 |
| TCGA-AC-A2FK-11A-22D-A17U-01 | Affymetrix SNP 6.0 | (TODO) -- GDC | CNV__snp6 |
| TCGA-AC-A2FM-11B-32D-A19X-01 | Affymetrix SNP 6.0 | (TODO) -- GDC | CNV__unfiltered__snp6 |
| TCGA-AC-A2FM-11B-32D-A19X-01 | Affymetrix SNP 6.0 | (TODO) -- GDC | CNV__snp6 |
| TCGA-AC-A2FO-11A-12D-A17U-01 | Affymetrix SNP 6.0 | (TODO) -- GDC | CNV__unfiltered__snp6 |
| TCGA-AC-A2FO-11A-12D-A17U-01 | Affymetrix SNP 6.0 | (TODO) -- GDC | CNV__snp6 |
| TCGA-AC-A2QJ-11A-12D-A19X-01 | Affymetrix SNP 6.0 | (TODO) -- GDC | CNV__unfiltered__snp6 |
| TCGA-AC-A2QJ-11A-12D-A19X-01 | Affymetrix SNP 6.0 | (TODO) -- GDC | CNV__snp6 |
| TCGA-AC-A3EH-11B-21D-A229-01 | Affymetrix SNP 6.0 | (TODO) -- GDC | CNV__unfiltered__snp6 |
| TCGA-AC-A3EH-11B-21D-A229-01 | Affymetrix SNP 6.0 | (TODO) -- GDC | CNV__snp6 |
| TCGA-AC-A5XS-11A-13D-A29M-01 | Affymetrix SNP 6.0 | (TODO) -- GDC | CNV__unfiltered__snp6 |
| TCGA-AC-A5XS-11A-13D-A29M-01 | Affymetrix SNP 6.0 | (TODO) -- GDC | CNV__snp6 |
| TCGA-BH-A0AU-11A-11D-A12N-01 | Affymetrix SNP 6.0 | (TODO) -- GDC | CNV__unfiltered__snp6 |
| TCGA-BH-A0AU-11A-11D-A12N-01 | Affymetrix SNP 6.0 | (TODO) -- GDC | CNV__snp6 |
| TCGA-BH-A0AY-11A-23D-A092-01 | Affymetrix SNP 6.0 | (TODO) -- GDC | CNV__unfiltered__snp6 |
| TCGA-BH-A0AY-11A-23D-A092-01 | Affymetrix SNP 6.0 | (TODO) -- GDC | CNV__snp6 |
| TCGA-BH-A0AZ-11A-22D-A12N-01 | Affymetrix SNP 6.0 | (TODO) -- GDC | CNV__unfiltered__snp6 |
| TCGA-BH-A0AZ-11A-22D-A12N-01 | Affymetrix SNP 6.0 | (TODO) -- GDC | CNV__snp6 |
| TCGA-BH-A0B3-11B-21D-A092-01 | Affymetrix SNP 6.0 | (TODO) -- GDC | CNV__unfiltered__snp6 |
| TCGA-BH-A0B3-11B-21D-A092-01 | Affymetrix SNP 6.0 | (TODO) -- GDC | CNV__snp6 |
| TCGA-BH-A0B5-11A-23D-A12N-01 | Affymetrix SNP 6.0 | (TODO) -- GDC | CNV__unfiltered__snp6 |
| TCGA-BH-A0B5-11A-23D-A12N-01 | Affymetrix SNP 6.0 | (TODO) -- GDC | CNV__snp6 |
| TCGA-BH-A0B7-11A-34D-A111-01 | Affymetrix SNP 6.0 | (TODO) -- GDC | CNV__unfiltered__snp6 |
| TCGA-BH-A0B7-11A-34D-A111-01 | Affymetrix SNP 6.0 | (TODO) -- GDC | CNV__snp6 |
| TCGA-BH-A0B8-11A-41D-A092-01 | Affymetrix SNP 6.0 | (TODO) -- GDC | CNV__unfiltered__snp6 |
| TCGA-BH-A0B8-11A-41D-A092-01 | Affymetrix SNP 6.0 | (TODO) -- GDC | CNV__snp6 |
| TCGA-BH-A0BA-11A-22D-A092-01 | Affymetrix SNP 6.0 | (TODO) -- GDC | CNV__unfiltered__snp6 |
| TCGA-BH-A0BA-11A-22D-A092-01 | Affymetrix SNP 6.0 | (TODO) -- GDC | CNV__snp6 |
| TCGA-BH-A0BC-11A-22D-A092-01 | Affymetrix SNP 6.0 | (TODO) -- GDC | CNV__unfiltered__snp6 |
| TCGA-BH-A0BC-11A-22D-A092-01 | Affymetrix SNP 6.0 | (TODO) -- GDC | CNV__snp6 |
| TCGA-BH-A0BF-11A-31D-A12N-01 | Affymetrix SNP 6.0 | (TODO) -- GDC | CNV__unfiltered__snp6 |
| TCGA-BH-A0BF-11A-31D-A12N-01 | Affymetrix SNP 6.0 | (TODO) -- GDC | CNV__snp6 |
| TCGA-BH-A0BJ-11A-23D-A092-01 | Affymetrix SNP 6.0 | (TODO) -- GDC | CNV__unfiltered__snp6 |
| TCGA-BH-A0BJ-11A-23D-A092-01 | Affymetrix SNP 6.0 | (TODO) -- GDC | CNV__snp6 |
| TCGA-BH-A0BL-11A-12D-A111-01 | Affymetrix SNP 6.0 | (TODO) -- GDC | CNV__unfiltered__snp6 |
| TCGA-BH-A0BL-11A-12D-A111-01 | Affymetrix SNP 6.0 | (TODO) -- GDC | CNV__snp6 |
| TCGA-BH-A0BM-11A-12D-A092-01 | Affymetrix SNP 6.0 | (TODO) -- GDC | CNV__unfiltered__snp6 |
| TCGA-BH-A0BM-11A-12D-A092-01 | Affymetrix SNP 6.0 | (TODO) -- GDC | CNV__snp6 |
| TCGA-BH-A0BO-11A-11D-A12A-01 | Affymetrix SNP 6.0 | (TODO) -- GDC | CNV__unfiltered__snp6 |
| TCGA-BH-A0BO-11A-11D-A12A-01 | Affymetrix SNP 6.0 | (TODO) -- GDC | CNV__snp6 |
| TCGA-BH-A0BQ-11A-33D-A111-01 | Affymetrix SNP 6.0 | (TODO) -- GDC | CNV__unfiltered__snp6 |
| TCGA-BH-A0BQ-11A-33D-A111-01 | Affymetrix SNP 6.0 | (TODO) -- GDC | CNV__snp6 |
| TCGA-BH-A0BS-11A-11D-A12N-01 | Affymetrix SNP 6.0 | (TODO) -- GDC | CNV__unfiltered__snp6 |
| TCGA-BH-A0BS-11A-11D-A12N-01 | Affymetrix SNP 6.0 | (TODO) -- GDC | CNV__snp6 |
| TCGA-BH-A0BT-11A-21D-A12N-01 | Affymetrix SNP 6.0 | (TODO) -- GDC | CNV__unfiltered__snp6 |
| TCGA-BH-A0BT-11A-21D-A12N-01 | Affymetrix SNP 6.0 | (TODO) -- GDC | CNV__snp6 |
| TCGA-BH-A0BV-11A-31D-A092-01 | Affymetrix SNP 6.0 | (TODO) -- GDC | CNV__unfiltered__snp6 |
| TCGA-BH-A0BV-11A-31D-A092-01 | Affymetrix SNP 6.0 | (TODO) -- GDC | CNV__snp6 |
| TCGA-BH-A0BW-11A-12D-A111-01 | Affymetrix SNP 6.0 | (TODO) -- GDC | CNV__unfiltered__snp6 |
| TCGA-BH-A0BW-11A-12D-A111-01 | Affymetrix SNP 6.0 | (TODO) -- GDC | CNV__snp6 |
| TCGA-BH-A0BZ-11A-61D-A12N-01 | Affymetrix SNP 6.0 | (TODO) -- GDC | CNV__unfiltered__snp6 |
| TCGA-BH-A0BZ-11A-61D-A12N-01 | Affymetrix SNP 6.0 | (TODO) -- GDC | CNV__snp6 |
| TCGA-BH-A0C0-11A-21D-A092-01 | Affymetrix SNP 6.0 | (TODO) -- GDC | CNV__unfiltered__snp6 |
| TCGA-BH-A0C0-11A-21D-A092-01 | Affymetrix SNP 6.0 | (TODO) -- GDC | CNV__snp6 |
| TCGA-BH-A0C3-11A-23D-A12N-01 | Affymetrix SNP 6.0 | (TODO) -- GDC | CNV__unfiltered__snp6 |
| TCGA-BH-A0C3-11A-23D-A12N-01 | Affymetrix SNP 6.0 | (TODO) -- GDC | CNV__snp6 |
| TCGA-BH-A0DD-11A-23D-A12N-01 | Affymetrix SNP 6.0 | (TODO) -- GDC | CNV__unfiltered__snp6 |
| TCGA-BH-A0DD-11A-23D-A12N-01 | Affymetrix SNP 6.0 | (TODO) -- GDC | CNV__snp6 |
| TCGA-BH-A0DE-11A-23D-A111-01 | Affymetrix SNP 6.0 | (TODO) -- GDC | CNV__unfiltered__snp6 |
| TCGA-BH-A0DE-11A-23D-A111-01 | Affymetrix SNP 6.0 | (TODO) -- GDC | CNV__snp6 |
| TCGA-BH-A0DG-11A-43D-A12N-01 | Affymetrix SNP 6.0 | (TODO) -- GDC | CNV__unfiltered__snp6 |
| TCGA-BH-A0DG-11A-43D-A12N-01 | Affymetrix SNP 6.0 | (TODO) -- GDC | CNV__snp6 |
| TCGA-BH-A0DH-11A-31D-A092-01 | Affymetrix SNP 6.0 | (TODO) -- GDC | CNV__unfiltered__snp6 |
| TCGA-BH-A0DH-11A-31D-A092-01 | Affymetrix SNP 6.0 | (TODO) -- GDC | CNV__snp6 |
| TCGA-BH-A0DI-11A-32D-A12N-01 | Affymetrix SNP 6.0 | (TODO) -- GDC | CNV__unfiltered__snp6 |
| TCGA-BH-A0DI-11A-32D-A12N-01 | Affymetrix SNP 6.0 | (TODO) -- GDC | CNV__snp6 |
| TCGA-BH-A0DK-11A-13D-A092-01 | Affymetrix SNP 6.0 | (TODO) -- GDC | CNV__unfiltered__snp6 |
| TCGA-BH-A0DK-11A-13D-A092-01 | Affymetrix SNP 6.0 | (TODO) -- GDC | CNV__snp6 |
| TCGA-BH-A0DL-11A-13D-A111-01 | Affymetrix SNP 6.0 | (TODO) -- GDC | CNV__unfiltered__snp6 |
| TCGA-BH-A0DL-11A-13D-A111-01 | Affymetrix SNP 6.0 | (TODO) -- GDC | CNV__snp6 |
| TCGA-BH-A0DO-11A-22D-A12A-01 | Affymetrix SNP 6.0 | (TODO) -- GDC | CNV__unfiltered__snp6 |
| TCGA-BH-A0DO-11A-22D-A12A-01 | Affymetrix SNP 6.0 | (TODO) -- GDC | CNV__snp6 |
| TCGA-BH-A0DP-11A-12D-A092-01 | Affymetrix SNP 6.0 | (TODO) -- GDC | CNV__unfiltered__snp6 |
| TCGA-BH-A0DP-11A-12D-A092-01 | Affymetrix SNP 6.0 | (TODO) -- GDC | CNV__snp6 |
| TCGA-BH-A0DT-11A-12D-A12A-01 | Affymetrix SNP 6.0 | (TODO) -- GDC | CNV__unfiltered__snp6 |
| TCGA-BH-A0DT-11A-12D-A12A-01 | Affymetrix SNP 6.0 | (TODO) -- GDC | CNV__snp6 |
| TCGA-BH-A0DV-11A-22D-A12N-01 | Affymetrix SNP 6.0 | (TODO) -- GDC | CNV__unfiltered__snp6 |
| TCGA-BH-A0DV-11A-22D-A12N-01 | Affymetrix SNP 6.0 | (TODO) -- GDC | CNV__snp6 |
| TCGA-BH-A0DZ-11A-22D-A092-01 | Affymetrix SNP 6.0 | (TODO) -- GDC | CNV__unfiltered__snp6 |
| TCGA-BH-A0DZ-11A-22D-A092-01 | Affymetrix SNP 6.0 | (TODO) -- GDC | CNV__snp6 |
| TCGA-BH-A0E0-11A-13D-A092-01 | Affymetrix SNP 6.0 | (TODO) -- GDC | CNV__unfiltered__snp6 |
| TCGA-BH-A0E0-11A-13D-A092-01 | Affymetrix SNP 6.0 | (TODO) -- GDC | CNV__snp6 |
| TCGA-BH-A0E1-11A-13D-A092-01 | Affymetrix SNP 6.0 | (TODO) -- GDC | CNV__unfiltered__snp6 |
| TCGA-BH-A0E1-11A-13D-A092-01 | Affymetrix SNP 6.0 | (TODO) -- GDC | CNV__snp6 |
| TCGA-BH-A0H3-11A-12D-A12N-01 | Affymetrix SNP 6.0 | (TODO) -- GDC | CNV__unfiltered__snp6 |
| TCGA-BH-A0H3-11A-12D-A12N-01 | Affymetrix SNP 6.0 | (TODO) -- GDC | CNV__snp6 |
| TCGA-BH-A0H5-11A-62D-A111-01 | Affymetrix SNP 6.0 | (TODO) -- GDC | CNV__unfiltered__snp6 |
| TCGA-BH-A0H5-11A-62D-A111-01 | Affymetrix SNP 6.0 | (TODO) -- GDC | CNV__snp6 |
| TCGA-BH-A0H7-11A-13D-A092-01 | Affymetrix SNP 6.0 | (TODO) -- GDC | CNV__unfiltered__snp6 |
| TCGA-BH-A0H7-11A-13D-A092-01 | Affymetrix SNP 6.0 | (TODO) -- GDC | CNV__snp6 |
| TCGA-BH-A0H9-11A-22D-A092-01 | Affymetrix SNP 6.0 | (TODO) -- GDC | CNV__unfiltered__snp6 |
| TCGA-BH-A0H9-11A-22D-A092-01 | Affymetrix SNP 6.0 | (TODO) -- GDC | CNV__snp6 |
| TCGA-BH-A0HA-11A-31D-A12N-01 | Affymetrix SNP 6.0 | (TODO) -- GDC | CNV__unfiltered__snp6 |
| TCGA-BH-A0HA-11A-31D-A12N-01 | Affymetrix SNP 6.0 | (TODO) -- GDC | CNV__snp6 |
| TCGA-BH-A0HK-11A-11D-A092-01 | Affymetrix SNP 6.0 | (TODO) -- GDC | CNV__unfiltered__snp6 |
| TCGA-BH-A0HK-11A-11D-A092-01 | Affymetrix SNP 6.0 | (TODO) -- GDC | CNV__snp6 |
| TCGA-BH-A18F-11A-22D-A12A-01 | Affymetrix SNP 6.0 | (TODO) -- GDC | CNV__unfiltered__snp6 |
| TCGA-BH-A18F-11A-22D-A12A-01 | Affymetrix SNP 6.0 | (TODO) -- GDC | CNV__snp6 |
| TCGA-BH-A18J-11A-31D-A12A-01 | Affymetrix SNP 6.0 | (TODO) -- GDC | CNV__unfiltered__snp6 |
| TCGA-BH-A18J-11A-31D-A12A-01 | Affymetrix SNP 6.0 | (TODO) -- GDC | CNV__snp6 |
| TCGA-BH-A18K-11A-13D-A12A-01 | Affymetrix SNP 6.0 | (TODO) -- GDC | CNV__unfiltered__snp6 |
| TCGA-BH-A18K-11A-13D-A12A-01 | Affymetrix SNP 6.0 | (TODO) -- GDC | CNV__snp6 |
| TCGA-BH-A18L-11A-42D-A12A-01 | Affymetrix SNP 6.0 | (TODO) -- GDC | CNV__unfiltered__snp6 |
| TCGA-BH-A18L-11A-42D-A12A-01 | Affymetrix SNP 6.0 | (TODO) -- GDC | CNV__snp6 |
| TCGA-BH-A18M-11A-33D-A12A-01 | Affymetrix SNP 6.0 | (TODO) -- GDC | CNV__unfiltered__snp6 |
| TCGA-BH-A18M-11A-33D-A12A-01 | Affymetrix SNP 6.0 | (TODO) -- GDC | CNV__snp6 |
| TCGA-BH-A18N-11A-43D-A12A-01 | Affymetrix SNP 6.0 | (TODO) -- GDC | CNV__unfiltered__snp6 |
| TCGA-BH-A18N-11A-43D-A12A-01 | Affymetrix SNP 6.0 | (TODO) -- GDC | CNV__snp6 |
| TCGA-BH-A18Q-11A-34D-A12A-01 | Affymetrix SNP 6.0 | (TODO) -- GDC | CNV__unfiltered__snp6 |
| TCGA-BH-A18Q-11A-34D-A12A-01 | Affymetrix SNP 6.0 | (TODO) -- GDC | CNV__snp6 |
| TCGA-BH-A18R-11A-42D-A12A-01 | Affymetrix SNP 6.0 | (TODO) -- GDC | CNV__unfiltered__snp6 |
| TCGA-BH-A18R-11A-42D-A12A-01 | Affymetrix SNP 6.0 | (TODO) -- GDC | CNV__snp6 |
| TCGA-BH-A18S-11A-43D-A12A-01 | Affymetrix SNP 6.0 | (TODO) -- GDC | CNV__unfiltered__snp6 |
| TCGA-BH-A18S-11A-43D-A12A-01 | Affymetrix SNP 6.0 | (TODO) -- GDC | CNV__snp6 |
| TCGA-BH-A18T-11A-42D-A12A-01 | Affymetrix SNP 6.0 | (TODO) -- GDC | CNV__unfiltered__snp6 |
| TCGA-BH-A18T-11A-42D-A12A-01 | Affymetrix SNP 6.0 | (TODO) -- GDC | CNV__snp6 |
| TCGA-BH-A18U-11A-23D-A12A-01 | Affymetrix SNP 6.0 | (TODO) -- GDC | CNV__unfiltered__snp6 |
| TCGA-BH-A18U-11A-23D-A12A-01 | Affymetrix SNP 6.0 | (TODO) -- GDC | CNV__snp6 |
| TCGA-BH-A18V-11A-52D-A12A-01 | Affymetrix SNP 6.0 | (TODO) -- GDC | CNV__unfiltered__snp6 |
| TCGA-BH-A18V-11A-52D-A12A-01 | Affymetrix SNP 6.0 | (TODO) -- GDC | CNV__snp6 |
| TCGA-BH-A1EN-11A-23D-A13N-01 | Affymetrix SNP 6.0 | (TODO) -- GDC | CNV__unfiltered__snp6 |
| TCGA-BH-A1EN-11A-23D-A13N-01 | Affymetrix SNP 6.0 | (TODO) -- GDC | CNV__snp6 |
| TCGA-BH-A1EO-11A-31D-A134-01 | Affymetrix SNP 6.0 | (TODO) -- GDC | CNV__unfiltered__snp6 |
| TCGA-BH-A1EO-11A-31D-A134-01 | Affymetrix SNP 6.0 | (TODO) -- GDC | CNV__snp6 |
| TCGA-BH-A1ES-11A-33D-A134-01 | Affymetrix SNP 6.0 | (TODO) -- GDC | CNV__unfiltered__snp6 |
| TCGA-BH-A1ES-11A-33D-A134-01 | Affymetrix SNP 6.0 | (TODO) -- GDC | CNV__snp6 |
| TCGA-BH-A1ET-11B-23D-A134-01 | Affymetrix SNP 6.0 | (TODO) -- GDC | CNV__unfiltered__snp6 |
| TCGA-BH-A1ET-11B-23D-A134-01 | Affymetrix SNP 6.0 | (TODO) -- GDC | CNV__snp6 |
| TCGA-BH-A1EU-11A-23D-A134-01 | Affymetrix SNP 6.0 | (TODO) -- GDC | CNV__unfiltered__snp6 |
| TCGA-BH-A1EU-11A-23D-A134-01 | Affymetrix SNP 6.0 | (TODO) -- GDC | CNV__snp6 |
| TCGA-BH-A1EV-11A-24D-A134-01 | Affymetrix SNP 6.0 | (TODO) -- GDC | CNV__unfiltered__snp6 |
| TCGA-BH-A1EV-11A-24D-A134-01 | Affymetrix SNP 6.0 | (TODO) -- GDC | CNV__snp6 |
| TCGA-BH-A1EW-11B-33D-A134-01 | Affymetrix SNP 6.0 | (TODO) -- GDC | CNV__unfiltered__snp6 |
| TCGA-BH-A1EW-11B-33D-A134-01 | Affymetrix SNP 6.0 | (TODO) -- GDC | CNV__snp6 |
| TCGA-BH-A1EX-11A-21D-A13N-01 | Affymetrix SNP 6.0 | (TODO) -- GDC | CNV__unfiltered__snp6 |
| TCGA-BH-A1EX-11A-21D-A13N-01 | Affymetrix SNP 6.0 | (TODO) -- GDC | CNV__snp6 |
| TCGA-BH-A1EY-11B-21D-A13N-01 | Affymetrix SNP 6.0 | (TODO) -- GDC | CNV__unfiltered__snp6 |
| TCGA-BH-A1EY-11B-21D-A13N-01 | Affymetrix SNP 6.0 | (TODO) -- GDC | CNV__snp6 |
| TCGA-BH-A1F0-11B-23D-A134-01 | Affymetrix SNP 6.0 | (TODO) -- GDC | CNV__unfiltered__snp6 |
| TCGA-BH-A1F0-11B-23D-A134-01 | Affymetrix SNP 6.0 | (TODO) -- GDC | CNV__snp6 |
| TCGA-BH-A1F2-11A-32D-A13N-01 | Affymetrix SNP 6.0 | (TODO) -- GDC | CNV__unfiltered__snp6 |
| TCGA-BH-A1F2-11A-32D-A13N-01 | Affymetrix SNP 6.0 | (TODO) -- GDC | CNV__snp6 |
| TCGA-BH-A1F5-11A-43D-A13N-01 | Affymetrix SNP 6.0 | (TODO) -- GDC | CNV__unfiltered__snp6 |
| TCGA-BH-A1F5-11A-43D-A13N-01 | Affymetrix SNP 6.0 | (TODO) -- GDC | CNV__snp6 |
| TCGA-BH-A1F6-11B-94D-A13N-01 | Affymetrix SNP 6.0 | (TODO) -- GDC | CNV__unfiltered__snp6 |
| TCGA-BH-A1F6-11B-94D-A13N-01 | Affymetrix SNP 6.0 | (TODO) -- GDC | CNV__snp6 |
| TCGA-BH-A1F8-11B-21D-A13N-01 | Affymetrix SNP 6.0 | (TODO) -- GDC | CNV__unfiltered__snp6 |
| TCGA-BH-A1F8-11B-21D-A13N-01 | Affymetrix SNP 6.0 | (TODO) -- GDC | CNV__snp6 |
| TCGA-BH-A1FC-11A-32D-A13N-01 | Affymetrix SNP 6.0 | (TODO) -- GDC | CNV__unfiltered__snp6 |
| TCGA-BH-A1FC-11A-32D-A13N-01 | Affymetrix SNP 6.0 | (TODO) -- GDC | CNV__snp6 |
| TCGA-BH-A1FD-11B-21D-A13N-01 | Affymetrix SNP 6.0 | (TODO) -- GDC | CNV__unfiltered__snp6 |
| TCGA-BH-A1FD-11B-21D-A13N-01 | Affymetrix SNP 6.0 | (TODO) -- GDC | CNV__snp6 |
| TCGA-BH-A1FE-11B-14D-A13N-01 | Affymetrix SNP 6.0 | (TODO) -- GDC | CNV__unfiltered__snp6 |
| TCGA-BH-A1FE-11B-14D-A13N-01 | Affymetrix SNP 6.0 | (TODO) -- GDC | CNV__snp6 |
| TCGA-BH-A1FG-11B-12D-A13N-01 | Affymetrix SNP 6.0 | (TODO) -- GDC | CNV__unfiltered__snp6 |
| TCGA-BH-A1FG-11B-12D-A13N-01 | Affymetrix SNP 6.0 | (TODO) -- GDC | CNV__snp6 |
| TCGA-BH-A1FH-11B-42D-A13N-01 | Affymetrix SNP 6.0 | (TODO) -- GDC | CNV__unfiltered__snp6 |
| TCGA-BH-A1FH-11B-42D-A13N-01 | Affymetrix SNP 6.0 | (TODO) -- GDC | CNV__snp6 |
| TCGA-BH-A1FJ-11B-42D-A13N-01 | Affymetrix SNP 6.0 | (TODO) -- GDC | CNV__unfiltered__snp6 |
| TCGA-BH-A1FJ-11B-42D-A13N-01 | Affymetrix SNP 6.0 | (TODO) -- GDC | CNV__snp6 |
| TCGA-BH-A1FL-11A-13D-A13N-01 | Affymetrix SNP 6.0 | (TODO) -- GDC | CNV__unfiltered__snp6 |
| TCGA-BH-A1FL-11A-13D-A13N-01 | Affymetrix SNP 6.0 | (TODO) -- GDC | CNV__snp6 |
| TCGA-BH-A1FM-11B-23D-A13N-01 | Affymetrix SNP 6.0 | (TODO) -- GDC | CNV__unfiltered__snp6 |
| TCGA-BH-A1FM-11B-23D-A13N-01 | Affymetrix SNP 6.0 | (TODO) -- GDC | CNV__snp6 |
| TCGA-BH-A1FN-11A-34D-A13N-01 | Affymetrix SNP 6.0 | (TODO) -- GDC | CNV__unfiltered__snp6 |
| TCGA-BH-A1FN-11A-34D-A13N-01 | Affymetrix SNP 6.0 | (TODO) -- GDC | CNV__snp6 |
| TCGA-BH-A1FR-11B-42D-A13N-01 | Affymetrix SNP 6.0 | (TODO) -- GDC | CNV__unfiltered__snp6 |
| TCGA-BH-A1FR-11B-42D-A13N-01 | Affymetrix SNP 6.0 | (TODO) -- GDC | CNV__snp6 |
| TCGA-BH-A1FU-11A-23D-A14F-01 | Affymetrix SNP 6.0 | (TODO) -- GDC | CNV__unfiltered__snp6 |
| TCGA-BH-A1FU-11A-23D-A14F-01 | Affymetrix SNP 6.0 | (TODO) -- GDC | CNV__snp6 |
| TCGA-BH-A203-11A-42D-A166-01 | Affymetrix SNP 6.0 | (TODO) -- GDC | CNV__unfiltered__snp6 |
| TCGA-BH-A203-11A-42D-A166-01 | Affymetrix SNP 6.0 | (TODO) -- GDC | CNV__snp6 |
| TCGA-BH-A204-11A-53D-A160-01 | Affymetrix SNP 6.0 | (TODO) -- GDC | CNV__unfiltered__snp6 |
| TCGA-BH-A204-11A-53D-A160-01 | Affymetrix SNP 6.0 | (TODO) -- GDC | CNV__snp6 |
| TCGA-BH-A208-11A-51D-A160-01 | Affymetrix SNP 6.0 | (TODO) -- GDC | CNV__unfiltered__snp6 |
| TCGA-BH-A208-11A-51D-A160-01 | Affymetrix SNP 6.0 | (TODO) -- GDC | CNV__snp6 |
| TCGA-BH-A209-11A-42D-A160-01 | Affymetrix SNP 6.0 | (TODO) -- GDC | CNV__unfiltered__snp6 |
| TCGA-BH-A209-11A-42D-A160-01 | Affymetrix SNP 6.0 | (TODO) -- GDC | CNV__snp6 |
| TCGA-BH-A5IZ-11A-13D-A27O-01 | Affymetrix SNP 6.0 | (TODO) -- GDC | CNV__unfiltered__snp6 |
| TCGA-BH-A5IZ-11A-13D-A27O-01 | Affymetrix SNP 6.0 | (TODO) -- GDC | CNV__snp6 |
| TCGA-BH-AB28-11A-31D-A41E-01 | Affymetrix SNP 6.0 | (TODO) -- GDC | CNV__unfiltered__snp6 |
| TCGA-BH-AB28-11A-31D-A41E-01 | Affymetrix SNP 6.0 | (TODO) -- GDC | CNV__snp6 |
| TCGA-E2-A14Y-11A-33D-A12A-01 | Affymetrix SNP 6.0 | (TODO) -- GDC | CNV__unfiltered__snp6 |
| TCGA-E2-A14Y-11A-33D-A12A-01 | Affymetrix SNP 6.0 | (TODO) -- GDC | CNV__snp6 |
| TCGA-E2-A153-11A-31D-A12A-01 | Affymetrix SNP 6.0 | (TODO) -- GDC | CNV__unfiltered__snp6 |
| TCGA-E2-A153-11A-31D-A12A-01 | Affymetrix SNP 6.0 | (TODO) -- GDC | CNV__snp6 |
| TCGA-E2-A158-11A-22D-A12A-01 | Affymetrix SNP 6.0 | (TODO) -- GDC | CNV__unfiltered__snp6 |
| TCGA-E2-A158-11A-22D-A12A-01 | Affymetrix SNP 6.0 | (TODO) -- GDC | CNV__snp6 |
| TCGA-E2-A15I-11A-32D-A134-01 | Affymetrix SNP 6.0 | (TODO) -- GDC | CNV__unfiltered__snp6 |
| TCGA-E2-A15I-11A-32D-A134-01 | Affymetrix SNP 6.0 | (TODO) -- GDC | CNV__snp6 |
| TCGA-E2-A15K-11A-13D-A12N-01 | Affymetrix SNP 6.0 | (TODO) -- GDC | CNV__unfiltered__snp6 |
| TCGA-E2-A15K-11A-13D-A12N-01 | Affymetrix SNP 6.0 | (TODO) -- GDC | CNV__snp6 |
| TCGA-E2-A15L-11A-31D-A12A-01 | Affymetrix SNP 6.0 | (TODO) -- GDC | CNV__unfiltered__snp6 |
| TCGA-E2-A15L-11A-31D-A12A-01 | Affymetrix SNP 6.0 | (TODO) -- GDC | CNV__snp6 |
| TCGA-E2-A15M-11A-22D-A12A-01 | Affymetrix SNP 6.0 | (TODO) -- GDC | CNV__unfiltered__snp6 |
| TCGA-E2-A15M-11A-22D-A12A-01 | Affymetrix SNP 6.0 | (TODO) -- GDC | CNV__snp6 |
| TCGA-E2-A1BC-11A-32D-A12N-01 | Affymetrix SNP 6.0 | (TODO) -- GDC | CNV__unfiltered__snp6 |
| TCGA-E2-A1BC-11A-32D-A12N-01 | Affymetrix SNP 6.0 | (TODO) -- GDC | CNV__snp6 |
| TCGA-E2-A1IU-11A-61D-A14F-01 | Affymetrix SNP 6.0 | (TODO) -- GDC | CNV__unfiltered__snp6 |
| TCGA-E2-A1IU-11A-61D-A14F-01 | Affymetrix SNP 6.0 | (TODO) -- GDC | CNV__snp6 |
| TCGA-E2-A1LB-11A-22D-A141-01 | Affymetrix SNP 6.0 | (TODO) -- GDC | CNV__unfiltered__snp6 |
| TCGA-E2-A1LB-11A-22D-A141-01 | Affymetrix SNP 6.0 | (TODO) -- GDC | CNV__snp6 |
| TCGA-E2-A1LE-11A-23D-A19X-01 | Affymetrix SNP 6.0 | (TODO) -- GDC | CNV__unfiltered__snp6 |
| TCGA-E2-A1LE-11A-23D-A19X-01 | Affymetrix SNP 6.0 | (TODO) -- GDC | CNV__snp6 |
| TCGA-E2-A1LG-11A-42D-A14J-01 | Affymetrix SNP 6.0 | (TODO) -- GDC | CNV__unfiltered__snp6 |
| TCGA-E2-A1LG-11A-42D-A14J-01 | Affymetrix SNP 6.0 | (TODO) -- GDC | CNV__snp6 |
| TCGA-E2-A1LH-11A-22D-A14F-01 | Affymetrix SNP 6.0 | (TODO) -- GDC | CNV__unfiltered__snp6 |
| TCGA-E2-A1LH-11A-22D-A14F-01 | Affymetrix SNP 6.0 | (TODO) -- GDC | CNV__snp6 |
| TCGA-E2-A1LI-11A-23D-A160-01 | Affymetrix SNP 6.0 | (TODO) -- GDC | CNV__unfiltered__snp6 |
| TCGA-E2-A1LI-11A-23D-A160-01 | Affymetrix SNP 6.0 | (TODO) -- GDC | CNV__snp6 |
| TCGA-E2-A1LK-11A-12D-A14F-01 | Affymetrix SNP 6.0 | (TODO) -- GDC | CNV__unfiltered__snp6 |
| TCGA-E2-A1LK-11A-12D-A14F-01 | Affymetrix SNP 6.0 | (TODO) -- GDC | CNV__snp6 |
| TCGA-E2-A1LL-11A-21D-A141-01 | Affymetrix SNP 6.0 | (TODO) -- GDC | CNV__unfiltered__snp6 |
| TCGA-E2-A1LL-11A-21D-A141-01 | Affymetrix SNP 6.0 | (TODO) -- GDC | CNV__snp6 |
| TCGA-E2-A1LS-11A-32D-A160-01 | Affymetrix SNP 6.0 | (TODO) -- GDC | CNV__unfiltered__snp6 |
| TCGA-E2-A1LS-11A-32D-A160-01 | Affymetrix SNP 6.0 | (TODO) -- GDC | CNV__snp6 |
| TCGA-E9-A1NH-11A-33D-A14F-01 | Affymetrix SNP 6.0 | (TODO) -- GDC | CNV__unfiltered__snp6 |
| TCGA-E9-A1NH-11A-33D-A14F-01 | Affymetrix SNP 6.0 | (TODO) -- GDC | CNV__snp6 |
| TCGA-GI-A2C8-11A-22D-A16C-01 | Affymetrix SNP 6.0 | (TODO) -- GDC | CNV__unfiltered__snp6 |
| TCGA-GI-A2C8-11A-22D-A16C-01 | Affymetrix SNP 6.0 | (TODO) -- GDC | CNV__snp6 |
| TCGA-GI-A2C9-11A-22D-A21P-01 | Affymetrix SNP 6.0 | (TODO) -- GDC | CNV__unfiltered__snp6 |
| TCGA-GI-A2C9-11A-22D-A21P-01 | Affymetrix SNP 6.0 | (TODO) -- GDC | CNV__snp6 |
| TCGA-GM-A2D9-11A-42D-A18N-01 | Affymetrix SNP 6.0 | (TODO) -- GDC | CNV__unfiltered__snp6 |
| TCGA-GM-A2D9-11A-42D-A18N-01 | Affymetrix SNP 6.0 | (TODO) -- GDC | CNV__snp6 |
| TCGA-GM-A2DI-11A-13D-A18N-01 | Affymetrix SNP 6.0 | (TODO) -- GDC | CNV__unfiltered__snp6 |
| TCGA-GM-A2DI-11A-13D-A18N-01 | Affymetrix SNP 6.0 | (TODO) -- GDC | CNV__snp6 |
| TCGA-XX-A899-11A-41D-A36L-01 | Affymetrix SNP 6.0 | (TODO) -- GDC | CNV__unfiltered__snp6 |
| TCGA-XX-A899-11A-41D-A36L-01 | Affymetrix SNP 6.0 | (TODO) -- GDC | CNV__snp6 |
Table S14.
| TCGA Barcode | Platform | Center | Annotation |
|---|---|---|---|
| TCGA-A7-A0CE-11A-21R-A089-07 | (TODO) -- GDC | mRNA__geneExpNormed__FPKM | |
| TCGA-A7-A0CE-11A-21R-A089-07 | (TODO) -- GDC | mRNA__geneExp__FPKM | |
| TCGA-A7-A0CE-11A-21R-A089-07 | (TODO) -- GDC | mRNA__counts__FPKM | |
| TCGA-A7-A0CH-11A-32R-A089-07 | (TODO) -- GDC | mRNA__geneExpNormed__FPKM | |
| TCGA-A7-A0CH-11A-32R-A089-07 | (TODO) -- GDC | mRNA__geneExp__FPKM | |
| TCGA-A7-A0CH-11A-32R-A089-07 | (TODO) -- GDC | mRNA__counts__FPKM | |
| TCGA-A7-A0D9-11A-53R-A089-07 | (TODO) -- GDC | mRNA__geneExpNormed__FPKM | |
| TCGA-A7-A0D9-11A-53R-A089-07 | (TODO) -- GDC | mRNA__geneExp__FPKM | |
| TCGA-A7-A0D9-11A-53R-A089-07 | (TODO) -- GDC | mRNA__counts__FPKM | |
| TCGA-A7-A0DB-11A-33R-A089-07 | (TODO) -- GDC | mRNA__geneExpNormed__FPKM | |
| TCGA-A7-A0DB-11A-33R-A089-07 | (TODO) -- GDC | mRNA__geneExp__FPKM | |
| TCGA-A7-A0DB-11A-33R-A089-07 | (TODO) -- GDC | mRNA__counts__FPKM | |
| TCGA-A7-A0DC-11A-41R-A089-07 | (TODO) -- GDC | mRNA__geneExpNormed__FPKM | |
| TCGA-A7-A0DC-11A-41R-A089-07 | (TODO) -- GDC | mRNA__geneExp__FPKM | |
| TCGA-A7-A0DC-11A-41R-A089-07 | (TODO) -- GDC | mRNA__counts__FPKM | |
| TCGA-A7-A13E-11A-61R-A12P-07 | (TODO) -- GDC | mRNA__geneExpNormed__FPKM | |
| TCGA-A7-A13E-11A-61R-A12P-07 | (TODO) -- GDC | mRNA__geneExp__FPKM | |
| TCGA-A7-A13E-11A-61R-A12P-07 | (TODO) -- GDC | mRNA__counts__FPKM | |
| TCGA-A7-A13F-11A-42R-A12P-07 | (TODO) -- GDC | mRNA__geneExpNormed__FPKM | |
| TCGA-A7-A13F-11A-42R-A12P-07 | (TODO) -- GDC | mRNA__geneExp__FPKM | |
| TCGA-A7-A13F-11A-42R-A12P-07 | (TODO) -- GDC | mRNA__counts__FPKM | |
| TCGA-A7-A13G-11A-51R-A13Q-07 | (TODO) -- GDC | mRNA__geneExpNormed__FPKM | |
| TCGA-A7-A13G-11A-51R-A13Q-07 | (TODO) -- GDC | mRNA__geneExp__FPKM | |
| TCGA-A7-A13G-11A-51R-A13Q-07 | (TODO) -- GDC | mRNA__counts__FPKM | |
| TCGA-AC-A23H-11A-12R-A157-07 | (TODO) -- GDC | mRNA__geneExpNormed__FPKM | |
| TCGA-AC-A23H-11A-12R-A157-07 | (TODO) -- GDC | mRNA__geneExp__FPKM | |
| TCGA-AC-A23H-11A-12R-A157-07 | (TODO) -- GDC | mRNA__counts__FPKM | |
| TCGA-AC-A2FB-11A-13R-A17B-07 | (TODO) -- GDC | mRNA__geneExpNormed__FPKM | |
| TCGA-AC-A2FB-11A-13R-A17B-07 | (TODO) -- GDC | mRNA__geneExp__FPKM | |
| TCGA-AC-A2FB-11A-13R-A17B-07 | (TODO) -- GDC | mRNA__counts__FPKM | |
| TCGA-AC-A2FF-11A-13R-A17B-07 | (TODO) -- GDC | mRNA__geneExpNormed__FPKM | |
| TCGA-AC-A2FF-11A-13R-A17B-07 | (TODO) -- GDC | mRNA__geneExp__FPKM | |
| TCGA-AC-A2FF-11A-13R-A17B-07 | (TODO) -- GDC | mRNA__counts__FPKM | |
| TCGA-AC-A2FM-11B-32R-A19W-07 | (TODO) -- GDC | mRNA__geneExpNormed__FPKM | |
| TCGA-AC-A2FM-11B-32R-A19W-07 | (TODO) -- GDC | mRNA__geneExp__FPKM | |
| TCGA-AC-A2FM-11B-32R-A19W-07 | (TODO) -- GDC | mRNA__counts__FPKM | |
| TCGA-BH-A0AU-11A-11R-A12P-07 | (TODO) -- GDC | mRNA__geneExpNormed__FPKM | |
| TCGA-BH-A0AU-11A-11R-A12P-07 | (TODO) -- GDC | mRNA__geneExp__FPKM | |
| TCGA-BH-A0AU-11A-11R-A12P-07 | (TODO) -- GDC | mRNA__counts__FPKM | |
| TCGA-BH-A0AY-11A-23R-A089-07 | (TODO) -- GDC | mRNA__geneExpNormed__FPKM | |
| TCGA-BH-A0AY-11A-23R-A089-07 | (TODO) -- GDC | mRNA__geneExp__FPKM | |
| TCGA-BH-A0AY-11A-23R-A089-07 | (TODO) -- GDC | mRNA__counts__FPKM | |
| TCGA-BH-A0AZ-11A-22R-A12P-07 | (TODO) -- GDC | mRNA__geneExpNormed__FPKM | |
| TCGA-BH-A0AZ-11A-22R-A12P-07 | (TODO) -- GDC | mRNA__geneExp__FPKM | |
| TCGA-BH-A0AZ-11A-22R-A12P-07 | (TODO) -- GDC | mRNA__counts__FPKM | |
| TCGA-BH-A0B3-11B-21R-A089-07 | (TODO) -- GDC | mRNA__geneExpNormed__FPKM | |
| TCGA-BH-A0B3-11B-21R-A089-07 | (TODO) -- GDC | mRNA__geneExp__FPKM | |
| TCGA-BH-A0B3-11B-21R-A089-07 | (TODO) -- GDC | mRNA__counts__FPKM | |
| TCGA-BH-A0B5-11A-23R-A12P-07 | (TODO) -- GDC | mRNA__geneExpNormed__FPKM | |
| TCGA-BH-A0B5-11A-23R-A12P-07 | (TODO) -- GDC | mRNA__geneExp__FPKM | |
| TCGA-BH-A0B5-11A-23R-A12P-07 | (TODO) -- GDC | mRNA__counts__FPKM | |
| TCGA-BH-A0B7-11A-34R-A115-07 | (TODO) -- GDC | mRNA__geneExpNormed__FPKM | |
| TCGA-BH-A0B7-11A-34R-A115-07 | (TODO) -- GDC | mRNA__geneExp__FPKM | |
| TCGA-BH-A0B7-11A-34R-A115-07 | (TODO) -- GDC | mRNA__counts__FPKM | |
| TCGA-BH-A0B8-11A-41R-A089-07 | (TODO) -- GDC | mRNA__geneExpNormed__FPKM | |
| TCGA-BH-A0B8-11A-41R-A089-07 | (TODO) -- GDC | mRNA__geneExp__FPKM | |
| TCGA-BH-A0B8-11A-41R-A089-07 | (TODO) -- GDC | mRNA__counts__FPKM | |
| TCGA-BH-A0BA-11A-22R-A19E-07 | (TODO) -- GDC | mRNA__geneExpNormed__FPKM | |
| TCGA-BH-A0BA-11A-22R-A19E-07 | (TODO) -- GDC | mRNA__geneExp__FPKM | |
| TCGA-BH-A0BA-11A-22R-A19E-07 | (TODO) -- GDC | mRNA__counts__FPKM | |
| TCGA-BH-A0BC-11A-22R-A089-07 | (TODO) -- GDC | mRNA__geneExpNormed__FPKM | |
| TCGA-BH-A0BC-11A-22R-A089-07 | (TODO) -- GDC | mRNA__geneExp__FPKM | |
| TCGA-BH-A0BC-11A-22R-A089-07 | (TODO) -- GDC | mRNA__counts__FPKM | |
| TCGA-BH-A0BJ-11A-23R-A089-07 | (TODO) -- GDC | mRNA__geneExpNormed__FPKM | |
| TCGA-BH-A0BJ-11A-23R-A089-07 | (TODO) -- GDC | mRNA__geneExp__FPKM | |
| TCGA-BH-A0BJ-11A-23R-A089-07 | (TODO) -- GDC | mRNA__counts__FPKM | |
| TCGA-BH-A0BM-11A-12R-A089-07 | (TODO) -- GDC | mRNA__geneExpNormed__FPKM | |
| TCGA-BH-A0BM-11A-12R-A089-07 | (TODO) -- GDC | mRNA__geneExp__FPKM | |
| TCGA-BH-A0BM-11A-12R-A089-07 | (TODO) -- GDC | mRNA__counts__FPKM | |
| TCGA-BH-A0BQ-11A-33R-A115-07 | (TODO) -- GDC | mRNA__geneExpNormed__FPKM | |
| TCGA-BH-A0BQ-11A-33R-A115-07 | (TODO) -- GDC | mRNA__geneExp__FPKM | |
| TCGA-BH-A0BQ-11A-33R-A115-07 | (TODO) -- GDC | mRNA__counts__FPKM | |
| TCGA-BH-A0BS-11A-11R-A12P-07 | (TODO) -- GDC | mRNA__geneExpNormed__FPKM | |
| TCGA-BH-A0BS-11A-11R-A12P-07 | (TODO) -- GDC | mRNA__geneExp__FPKM | |
| TCGA-BH-A0BS-11A-11R-A12P-07 | (TODO) -- GDC | mRNA__counts__FPKM | |
| TCGA-BH-A0BT-11A-21R-A12P-07 | (TODO) -- GDC | mRNA__geneExpNormed__FPKM | |
| TCGA-BH-A0BT-11A-21R-A12P-07 | (TODO) -- GDC | mRNA__geneExp__FPKM | |
| TCGA-BH-A0BT-11A-21R-A12P-07 | (TODO) -- GDC | mRNA__counts__FPKM | |
| TCGA-BH-A0BV-11A-31R-A089-07 | (TODO) -- GDC | mRNA__geneExpNormed__FPKM | |
| TCGA-BH-A0BV-11A-31R-A089-07 | (TODO) -- GDC | mRNA__geneExp__FPKM | |
| TCGA-BH-A0BV-11A-31R-A089-07 | (TODO) -- GDC | mRNA__counts__FPKM | |
| TCGA-BH-A0BW-11A-12R-A115-07 | (TODO) -- GDC | mRNA__geneExpNormed__FPKM | |
| TCGA-BH-A0BW-11A-12R-A115-07 | (TODO) -- GDC | mRNA__geneExp__FPKM | |
| TCGA-BH-A0BW-11A-12R-A115-07 | (TODO) -- GDC | mRNA__counts__FPKM | |
| TCGA-BH-A0BZ-11A-61R-A12P-07 | (TODO) -- GDC | mRNA__geneExpNormed__FPKM | |
| TCGA-BH-A0BZ-11A-61R-A12P-07 | (TODO) -- GDC | mRNA__geneExp__FPKM | |
| TCGA-BH-A0BZ-11A-61R-A12P-07 | (TODO) -- GDC | mRNA__counts__FPKM | |
| TCGA-BH-A0C0-11A-21R-A089-07 | (TODO) -- GDC | mRNA__geneExpNormed__FPKM | |
| TCGA-BH-A0C0-11A-21R-A089-07 | (TODO) -- GDC | mRNA__geneExp__FPKM | |
| TCGA-BH-A0C0-11A-21R-A089-07 | (TODO) -- GDC | mRNA__counts__FPKM | |
| TCGA-BH-A0C3-11A-23R-A12P-07 | (TODO) -- GDC | mRNA__geneExpNormed__FPKM | |
| TCGA-BH-A0C3-11A-23R-A12P-07 | (TODO) -- GDC | mRNA__geneExp__FPKM | |
| TCGA-BH-A0C3-11A-23R-A12P-07 | (TODO) -- GDC | mRNA__counts__FPKM | |
| TCGA-BH-A0DD-11A-23R-A12P-07 | (TODO) -- GDC | mRNA__geneExpNormed__FPKM | |
| TCGA-BH-A0DD-11A-23R-A12P-07 | (TODO) -- GDC | mRNA__geneExp__FPKM | |
| TCGA-BH-A0DD-11A-23R-A12P-07 | (TODO) -- GDC | mRNA__counts__FPKM | |
| TCGA-BH-A0DG-11A-43R-A12P-07 | (TODO) -- GDC | mRNA__geneExpNormed__FPKM | |
| TCGA-BH-A0DG-11A-43R-A12P-07 | (TODO) -- GDC | mRNA__geneExp__FPKM | |
| TCGA-BH-A0DG-11A-43R-A12P-07 | (TODO) -- GDC | mRNA__counts__FPKM | |
| TCGA-BH-A0DH-11A-31R-A089-07 | (TODO) -- GDC | mRNA__geneExpNormed__FPKM | |
| TCGA-BH-A0DH-11A-31R-A089-07 | (TODO) -- GDC | mRNA__geneExp__FPKM | |
| TCGA-BH-A0DH-11A-31R-A089-07 | (TODO) -- GDC | mRNA__counts__FPKM | |
| TCGA-BH-A0DK-11A-13R-A089-07 | (TODO) -- GDC | mRNA__geneExpNormed__FPKM | |
| TCGA-BH-A0DK-11A-13R-A089-07 | (TODO) -- GDC | mRNA__geneExp__FPKM | |
| TCGA-BH-A0DK-11A-13R-A089-07 | (TODO) -- GDC | mRNA__counts__FPKM | |
| TCGA-BH-A0DL-11A-13R-A115-07 | (TODO) -- GDC | mRNA__geneExpNormed__FPKM | |
| TCGA-BH-A0DL-11A-13R-A115-07 | (TODO) -- GDC | mRNA__geneExp__FPKM | |
| TCGA-BH-A0DL-11A-13R-A115-07 | (TODO) -- GDC | mRNA__counts__FPKM | |
| TCGA-BH-A0DO-11A-22R-A12D-07 | (TODO) -- GDC | mRNA__geneExpNormed__FPKM | |
| TCGA-BH-A0DO-11A-22R-A12D-07 | (TODO) -- GDC | mRNA__geneExp__FPKM | |
| TCGA-BH-A0DO-11A-22R-A12D-07 | (TODO) -- GDC | mRNA__counts__FPKM | |
| TCGA-BH-A0DP-11A-12R-A089-07 | (TODO) -- GDC | mRNA__geneExpNormed__FPKM | |
| TCGA-BH-A0DP-11A-12R-A089-07 | (TODO) -- GDC | mRNA__geneExp__FPKM | |
| TCGA-BH-A0DP-11A-12R-A089-07 | (TODO) -- GDC | mRNA__counts__FPKM | |
| TCGA-BH-A0DQ-11A-12R-A089-07 | (TODO) -- GDC | mRNA__geneExpNormed__FPKM | |
| TCGA-BH-A0DQ-11A-12R-A089-07 | (TODO) -- GDC | mRNA__geneExp__FPKM | |
| TCGA-BH-A0DQ-11A-12R-A089-07 | (TODO) -- GDC | mRNA__counts__FPKM | |
| TCGA-BH-A0DT-11A-12R-A12D-07 | (TODO) -- GDC | mRNA__geneExpNormed__FPKM | |
| TCGA-BH-A0DT-11A-12R-A12D-07 | (TODO) -- GDC | mRNA__geneExp__FPKM | |
| TCGA-BH-A0DT-11A-12R-A12D-07 | (TODO) -- GDC | mRNA__counts__FPKM | |
| TCGA-BH-A0DV-11A-22R-A12P-07 | (TODO) -- GDC | mRNA__geneExpNormed__FPKM | |
| TCGA-BH-A0DV-11A-22R-A12P-07 | (TODO) -- GDC | mRNA__geneExp__FPKM | |
| TCGA-BH-A0DV-11A-22R-A12P-07 | (TODO) -- GDC | mRNA__counts__FPKM | |
| TCGA-BH-A0DZ-11A-22R-A089-07 | (TODO) -- GDC | mRNA__geneExpNormed__FPKM | |
| TCGA-BH-A0DZ-11A-22R-A089-07 | (TODO) -- GDC | mRNA__geneExp__FPKM | |
| TCGA-BH-A0DZ-11A-22R-A089-07 | (TODO) -- GDC | mRNA__counts__FPKM | |
| TCGA-BH-A0E0-11A-13R-A089-07 | (TODO) -- GDC | mRNA__geneExpNormed__FPKM | |
| TCGA-BH-A0E0-11A-13R-A089-07 | (TODO) -- GDC | mRNA__geneExp__FPKM | |
| TCGA-BH-A0E0-11A-13R-A089-07 | (TODO) -- GDC | mRNA__counts__FPKM | |
| TCGA-BH-A0E1-11A-13R-A089-07 | (TODO) -- GDC | mRNA__geneExpNormed__FPKM | |
| TCGA-BH-A0E1-11A-13R-A089-07 | (TODO) -- GDC | mRNA__geneExp__FPKM | |
| TCGA-BH-A0E1-11A-13R-A089-07 | (TODO) -- GDC | mRNA__counts__FPKM | |
| TCGA-BH-A0H5-11A-62R-A115-07 | (TODO) -- GDC | mRNA__geneExpNormed__FPKM | |
| TCGA-BH-A0H5-11A-62R-A115-07 | (TODO) -- GDC | mRNA__geneExp__FPKM | |
| TCGA-BH-A0H5-11A-62R-A115-07 | (TODO) -- GDC | mRNA__counts__FPKM | |
| TCGA-BH-A0H7-11A-13R-A089-07 | (TODO) -- GDC | mRNA__geneExpNormed__FPKM | |
| TCGA-BH-A0H7-11A-13R-A089-07 | (TODO) -- GDC | mRNA__geneExp__FPKM | |
| TCGA-BH-A0H7-11A-13R-A089-07 | (TODO) -- GDC | mRNA__counts__FPKM | |
| TCGA-BH-A0H9-11A-22R-A466-07 | (TODO) -- GDC | mRNA__geneExpNormed__FPKM | |
| TCGA-BH-A0H9-11A-22R-A466-07 | (TODO) -- GDC | mRNA__geneExp__FPKM | |
| TCGA-BH-A0H9-11A-22R-A466-07 | (TODO) -- GDC | mRNA__counts__FPKM | |
| TCGA-BH-A0HA-11A-31R-A12P-07 | (TODO) -- GDC | mRNA__geneExpNormed__FPKM | |
| TCGA-BH-A0HA-11A-31R-A12P-07 | (TODO) -- GDC | mRNA__geneExp__FPKM | |
| TCGA-BH-A0HA-11A-31R-A12P-07 | (TODO) -- GDC | mRNA__counts__FPKM | |
| TCGA-BH-A0HK-11A-11R-A089-07 | (TODO) -- GDC | mRNA__geneExpNormed__FPKM | |
| TCGA-BH-A0HK-11A-11R-A089-07 | (TODO) -- GDC | mRNA__geneExp__FPKM | |
| TCGA-BH-A0HK-11A-11R-A089-07 | (TODO) -- GDC | mRNA__counts__FPKM | |
| TCGA-BH-A18J-11A-31R-A12D-07 | (TODO) -- GDC | mRNA__geneExpNormed__FPKM | |
| TCGA-BH-A18J-11A-31R-A12D-07 | (TODO) -- GDC | mRNA__geneExp__FPKM | |
| TCGA-BH-A18J-11A-31R-A12D-07 | (TODO) -- GDC | mRNA__counts__FPKM | |
| TCGA-BH-A18K-11A-13R-A12D-07 | (TODO) -- GDC | mRNA__geneExpNormed__FPKM | |
| TCGA-BH-A18K-11A-13R-A12D-07 | (TODO) -- GDC | mRNA__geneExp__FPKM | |
| TCGA-BH-A18K-11A-13R-A12D-07 | (TODO) -- GDC | mRNA__counts__FPKM | |
| TCGA-BH-A18L-11A-42R-A12D-07 | (TODO) -- GDC | mRNA__geneExpNormed__FPKM | |
| TCGA-BH-A18L-11A-42R-A12D-07 | (TODO) -- GDC | mRNA__geneExp__FPKM | |
| TCGA-BH-A18L-11A-42R-A12D-07 | (TODO) -- GDC | mRNA__counts__FPKM | |
| TCGA-BH-A18M-11A-33R-A12D-07 | (TODO) -- GDC | mRNA__geneExpNormed__FPKM | |
| TCGA-BH-A18M-11A-33R-A12D-07 | (TODO) -- GDC | mRNA__geneExp__FPKM | |
| TCGA-BH-A18M-11A-33R-A12D-07 | (TODO) -- GDC | mRNA__counts__FPKM | |
| TCGA-BH-A18N-11A-43R-A12D-07 | (TODO) -- GDC | mRNA__geneExpNormed__FPKM | |
| TCGA-BH-A18N-11A-43R-A12D-07 | (TODO) -- GDC | mRNA__geneExp__FPKM | |
| TCGA-BH-A18N-11A-43R-A12D-07 | (TODO) -- GDC | mRNA__counts__FPKM | |
| TCGA-BH-A18P-11A-43R-A12D-07 | (TODO) -- GDC | mRNA__geneExpNormed__FPKM | |
| TCGA-BH-A18P-11A-43R-A12D-07 | (TODO) -- GDC | mRNA__geneExp__FPKM | |
| TCGA-BH-A18P-11A-43R-A12D-07 | (TODO) -- GDC | mRNA__counts__FPKM | |
| TCGA-BH-A18Q-11A-34R-A12D-07 | (TODO) -- GDC | mRNA__geneExpNormed__FPKM | |
| TCGA-BH-A18Q-11A-34R-A12D-07 | (TODO) -- GDC | mRNA__geneExp__FPKM | |
| TCGA-BH-A18Q-11A-34R-A12D-07 | (TODO) -- GDC | mRNA__counts__FPKM | |
| TCGA-BH-A18R-11A-42R-A12D-07 | (TODO) -- GDC | mRNA__geneExpNormed__FPKM | |
| TCGA-BH-A18R-11A-42R-A12D-07 | (TODO) -- GDC | mRNA__geneExp__FPKM | |
| TCGA-BH-A18R-11A-42R-A12D-07 | (TODO) -- GDC | mRNA__counts__FPKM | |
| TCGA-BH-A18S-11A-43R-A12D-07 | (TODO) -- GDC | mRNA__geneExpNormed__FPKM | |
| TCGA-BH-A18S-11A-43R-A12D-07 | (TODO) -- GDC | mRNA__geneExp__FPKM | |
| TCGA-BH-A18S-11A-43R-A12D-07 | (TODO) -- GDC | mRNA__counts__FPKM | |
| TCGA-BH-A18U-11A-23R-A12D-07 | (TODO) -- GDC | mRNA__geneExpNormed__FPKM | |
| TCGA-BH-A18U-11A-23R-A12D-07 | (TODO) -- GDC | mRNA__geneExp__FPKM | |
| TCGA-BH-A18U-11A-23R-A12D-07 | (TODO) -- GDC | mRNA__counts__FPKM | |
| TCGA-BH-A18V-11A-52R-A12D-07 | (TODO) -- GDC | mRNA__geneExpNormed__FPKM | |
| TCGA-BH-A18V-11A-52R-A12D-07 | (TODO) -- GDC | mRNA__geneExp__FPKM | |
| TCGA-BH-A18V-11A-52R-A12D-07 | (TODO) -- GDC | mRNA__counts__FPKM | |
| TCGA-BH-A1EN-11A-23R-A13Q-07 | (TODO) -- GDC | mRNA__geneExpNormed__FPKM | |
| TCGA-BH-A1EN-11A-23R-A13Q-07 | (TODO) -- GDC | mRNA__geneExp__FPKM | |
| TCGA-BH-A1EN-11A-23R-A13Q-07 | (TODO) -- GDC | mRNA__counts__FPKM | |
| TCGA-BH-A1EO-11A-31R-A137-07 | (TODO) -- GDC | mRNA__geneExpNormed__FPKM | |
| TCGA-BH-A1EO-11A-31R-A137-07 | (TODO) -- GDC | mRNA__geneExp__FPKM | |
| TCGA-BH-A1EO-11A-31R-A137-07 | (TODO) -- GDC | mRNA__counts__FPKM | |
| TCGA-BH-A1ET-11B-23R-A137-07 | (TODO) -- GDC | mRNA__geneExpNormed__FPKM | |
| TCGA-BH-A1ET-11B-23R-A137-07 | (TODO) -- GDC | mRNA__geneExp__FPKM | |
| TCGA-BH-A1ET-11B-23R-A137-07 | (TODO) -- GDC | mRNA__counts__FPKM | |
| TCGA-BH-A1EU-11A-23R-A137-07 | (TODO) -- GDC | mRNA__geneExpNormed__FPKM | |
| TCGA-BH-A1EU-11A-23R-A137-07 | (TODO) -- GDC | mRNA__geneExp__FPKM | |
| TCGA-BH-A1EU-11A-23R-A137-07 | (TODO) -- GDC | mRNA__counts__FPKM | |
| TCGA-BH-A1EV-11A-24R-A137-07 | (TODO) -- GDC | mRNA__geneExpNormed__FPKM | |
| TCGA-BH-A1EV-11A-24R-A137-07 | (TODO) -- GDC | mRNA__geneExp__FPKM | |
| TCGA-BH-A1EV-11A-24R-A137-07 | (TODO) -- GDC | mRNA__counts__FPKM | |
| TCGA-BH-A1EW-11B-33R-A137-07 | (TODO) -- GDC | mRNA__geneExpNormed__FPKM | |
| TCGA-BH-A1EW-11B-33R-A137-07 | (TODO) -- GDC | mRNA__geneExp__FPKM | |
| TCGA-BH-A1EW-11B-33R-A137-07 | (TODO) -- GDC | mRNA__counts__FPKM | |
| TCGA-BH-A1F0-11B-23R-A137-07 | (TODO) -- GDC | mRNA__geneExpNormed__FPKM | |
| TCGA-BH-A1F0-11B-23R-A137-07 | (TODO) -- GDC | mRNA__geneExp__FPKM | |
| TCGA-BH-A1F0-11B-23R-A137-07 | (TODO) -- GDC | mRNA__counts__FPKM | |
| TCGA-BH-A1F2-11A-32R-A13Q-07 | (TODO) -- GDC | mRNA__geneExpNormed__FPKM | |
| TCGA-BH-A1F2-11A-32R-A13Q-07 | (TODO) -- GDC | mRNA__geneExp__FPKM | |
| TCGA-BH-A1F2-11A-32R-A13Q-07 | (TODO) -- GDC | mRNA__counts__FPKM | |
| TCGA-BH-A1F6-11B-94R-A13Q-07 | (TODO) -- GDC | mRNA__geneExpNormed__FPKM | |
| TCGA-BH-A1F6-11B-94R-A13Q-07 | (TODO) -- GDC | mRNA__geneExp__FPKM | |
| TCGA-BH-A1F6-11B-94R-A13Q-07 | (TODO) -- GDC | mRNA__counts__FPKM | |
| TCGA-BH-A1F8-11B-21R-A13Q-07 | (TODO) -- GDC | mRNA__geneExpNormed__FPKM | |
| TCGA-BH-A1F8-11B-21R-A13Q-07 | (TODO) -- GDC | mRNA__geneExp__FPKM | |
| TCGA-BH-A1F8-11B-21R-A13Q-07 | (TODO) -- GDC | mRNA__counts__FPKM | |
| TCGA-BH-A1FB-11A-33R-A13Q-07 | (TODO) -- GDC | mRNA__geneExpNormed__FPKM | |
| TCGA-BH-A1FB-11A-33R-A13Q-07 | (TODO) -- GDC | mRNA__geneExp__FPKM | |
| TCGA-BH-A1FB-11A-33R-A13Q-07 | (TODO) -- GDC | mRNA__counts__FPKM | |
| TCGA-BH-A1FC-11A-32R-A13Q-07 | (TODO) -- GDC | mRNA__geneExpNormed__FPKM | |
| TCGA-BH-A1FC-11A-32R-A13Q-07 | (TODO) -- GDC | mRNA__geneExp__FPKM | |
| TCGA-BH-A1FC-11A-32R-A13Q-07 | (TODO) -- GDC | mRNA__counts__FPKM | |
| TCGA-BH-A1FD-11B-21R-A13Q-07 | (TODO) -- GDC | mRNA__geneExpNormed__FPKM | |
| TCGA-BH-A1FD-11B-21R-A13Q-07 | (TODO) -- GDC | mRNA__geneExp__FPKM | |
| TCGA-BH-A1FD-11B-21R-A13Q-07 | (TODO) -- GDC | mRNA__counts__FPKM | |
| TCGA-BH-A1FE-11B-14R-A13Q-07 | (TODO) -- GDC | mRNA__geneExpNormed__FPKM | |
| TCGA-BH-A1FE-11B-14R-A13Q-07 | (TODO) -- GDC | mRNA__geneExp__FPKM | |
| TCGA-BH-A1FE-11B-14R-A13Q-07 | (TODO) -- GDC | mRNA__counts__FPKM | |
| TCGA-BH-A1FG-11B-12R-A13Q-07 | (TODO) -- GDC | mRNA__geneExpNormed__FPKM | |
| TCGA-BH-A1FG-11B-12R-A13Q-07 | (TODO) -- GDC | mRNA__geneExp__FPKM | |
| TCGA-BH-A1FG-11B-12R-A13Q-07 | (TODO) -- GDC | mRNA__counts__FPKM | |
| TCGA-BH-A1FH-11B-42R-A13Q-07 | (TODO) -- GDC | mRNA__geneExpNormed__FPKM | |
| TCGA-BH-A1FH-11B-42R-A13Q-07 | (TODO) -- GDC | mRNA__geneExp__FPKM | |
| TCGA-BH-A1FH-11B-42R-A13Q-07 | (TODO) -- GDC | mRNA__counts__FPKM | |
| TCGA-BH-A1FJ-11B-42R-A13Q-07 | (TODO) -- GDC | mRNA__geneExpNormed__FPKM | |
| TCGA-BH-A1FJ-11B-42R-A13Q-07 | (TODO) -- GDC | mRNA__geneExp__FPKM | |
| TCGA-BH-A1FJ-11B-42R-A13Q-07 | (TODO) -- GDC | mRNA__counts__FPKM | |
| TCGA-BH-A1FM-11B-23R-A13Q-07 | (TODO) -- GDC | mRNA__geneExpNormed__FPKM | |
| TCGA-BH-A1FM-11B-23R-A13Q-07 | (TODO) -- GDC | mRNA__geneExp__FPKM | |
| TCGA-BH-A1FM-11B-23R-A13Q-07 | (TODO) -- GDC | mRNA__counts__FPKM | |
| TCGA-BH-A1FN-11A-34R-A13Q-07 | (TODO) -- GDC | mRNA__geneExpNormed__FPKM | |
| TCGA-BH-A1FN-11A-34R-A13Q-07 | (TODO) -- GDC | mRNA__geneExp__FPKM | |
| TCGA-BH-A1FN-11A-34R-A13Q-07 | (TODO) -- GDC | mRNA__counts__FPKM | |
| TCGA-BH-A1FR-11B-42R-A13Q-07 | (TODO) -- GDC | mRNA__geneExpNormed__FPKM | |
| TCGA-BH-A1FR-11B-42R-A13Q-07 | (TODO) -- GDC | mRNA__geneExp__FPKM | |
| TCGA-BH-A1FR-11B-42R-A13Q-07 | (TODO) -- GDC | mRNA__counts__FPKM | |
| TCGA-BH-A1FU-11A-23R-A14D-07 | (TODO) -- GDC | mRNA__geneExpNormed__FPKM | |
| TCGA-BH-A1FU-11A-23R-A14D-07 | (TODO) -- GDC | mRNA__geneExp__FPKM | |
| TCGA-BH-A1FU-11A-23R-A14D-07 | (TODO) -- GDC | mRNA__counts__FPKM | |
| TCGA-BH-A203-11A-42R-A169-07 | (TODO) -- GDC | mRNA__geneExpNormed__FPKM | |
| TCGA-BH-A203-11A-42R-A169-07 | (TODO) -- GDC | mRNA__geneExp__FPKM | |
| TCGA-BH-A203-11A-42R-A169-07 | (TODO) -- GDC | mRNA__counts__FPKM | |
| TCGA-BH-A204-11A-53R-A157-07 | (TODO) -- GDC | mRNA__geneExpNormed__FPKM | |
| TCGA-BH-A204-11A-53R-A157-07 | (TODO) -- GDC | mRNA__geneExp__FPKM | |
| TCGA-BH-A204-11A-53R-A157-07 | (TODO) -- GDC | mRNA__counts__FPKM | |
| TCGA-BH-A208-11A-51R-A157-07 | (TODO) -- GDC | mRNA__geneExpNormed__FPKM | |
| TCGA-BH-A208-11A-51R-A157-07 | (TODO) -- GDC | mRNA__geneExp__FPKM | |
| TCGA-BH-A208-11A-51R-A157-07 | (TODO) -- GDC | mRNA__counts__FPKM | |
| TCGA-BH-A209-11A-42R-A157-07 | (TODO) -- GDC | mRNA__geneExpNormed__FPKM | |
| TCGA-BH-A209-11A-42R-A157-07 | (TODO) -- GDC | mRNA__geneExp__FPKM | |
| TCGA-BH-A209-11A-42R-A157-07 | (TODO) -- GDC | mRNA__counts__FPKM | |
| TCGA-E2-A153-11A-31R-A12D-07 | (TODO) -- GDC | mRNA__geneExpNormed__FPKM | |
| TCGA-E2-A153-11A-31R-A12D-07 | (TODO) -- GDC | mRNA__geneExp__FPKM | |
| TCGA-E2-A153-11A-31R-A12D-07 | (TODO) -- GDC | mRNA__counts__FPKM | |
| TCGA-E2-A158-11A-22R-A12D-07 | (TODO) -- GDC | mRNA__geneExpNormed__FPKM | |
| TCGA-E2-A158-11A-22R-A12D-07 | (TODO) -- GDC | mRNA__geneExp__FPKM | |
| TCGA-E2-A158-11A-22R-A12D-07 | (TODO) -- GDC | mRNA__counts__FPKM | |
| TCGA-E2-A15I-11A-32R-A137-07 | (TODO) -- GDC | mRNA__geneExpNormed__FPKM | |
| TCGA-E2-A15I-11A-32R-A137-07 | (TODO) -- GDC | mRNA__geneExp__FPKM | |
| TCGA-E2-A15I-11A-32R-A137-07 | (TODO) -- GDC | mRNA__counts__FPKM | |
| TCGA-E2-A15K-11A-13R-A12P-07 | (TODO) -- GDC | mRNA__geneExpNormed__FPKM | |
| TCGA-E2-A15K-11A-13R-A12P-07 | (TODO) -- GDC | mRNA__geneExp__FPKM | |
| TCGA-E2-A15K-11A-13R-A12P-07 | (TODO) -- GDC | mRNA__counts__FPKM | |
| TCGA-E2-A15M-11A-22R-A12D-07 | (TODO) -- GDC | mRNA__geneExpNormed__FPKM | |
| TCGA-E2-A15M-11A-22R-A12D-07 | (TODO) -- GDC | mRNA__geneExp__FPKM | |
| TCGA-E2-A15M-11A-22R-A12D-07 | (TODO) -- GDC | mRNA__counts__FPKM | |
| TCGA-E2-A1BC-11A-32R-A12P-07 | (TODO) -- GDC | mRNA__geneExpNormed__FPKM | |
| TCGA-E2-A1BC-11A-32R-A12P-07 | (TODO) -- GDC | mRNA__geneExp__FPKM | |
| TCGA-E2-A1BC-11A-32R-A12P-07 | (TODO) -- GDC | mRNA__counts__FPKM | |
| TCGA-E2-A1IG-11A-22R-A144-07 | (TODO) -- GDC | mRNA__geneExpNormed__FPKM | |
| TCGA-E2-A1IG-11A-22R-A144-07 | (TODO) -- GDC | mRNA__geneExp__FPKM | |
| TCGA-E2-A1IG-11A-22R-A144-07 | (TODO) -- GDC | mRNA__counts__FPKM | |
| TCGA-E2-A1L7-11A-33R-A144-07 | (TODO) -- GDC | mRNA__geneExpNormed__FPKM | |
| TCGA-E2-A1L7-11A-33R-A144-07 | (TODO) -- GDC | mRNA__geneExp__FPKM | |
| TCGA-E2-A1L7-11A-33R-A144-07 | (TODO) -- GDC | mRNA__counts__FPKM | |
| TCGA-E2-A1LB-11A-22R-A144-07 | (TODO) -- GDC | mRNA__geneExpNormed__FPKM | |
| TCGA-E2-A1LB-11A-22R-A144-07 | (TODO) -- GDC | mRNA__geneExp__FPKM | |
| TCGA-E2-A1LB-11A-22R-A144-07 | (TODO) -- GDC | mRNA__counts__FPKM | |
| TCGA-E2-A1LH-11A-22R-A14D-07 | (TODO) -- GDC | mRNA__geneExpNormed__FPKM | |
| TCGA-E2-A1LH-11A-22R-A14D-07 | (TODO) -- GDC | mRNA__geneExp__FPKM | |
| TCGA-E2-A1LH-11A-22R-A14D-07 | (TODO) -- GDC | mRNA__counts__FPKM | |
| TCGA-E2-A1LS-11A-32R-A157-07 | (TODO) -- GDC | mRNA__geneExpNormed__FPKM | |
| TCGA-E2-A1LS-11A-32R-A157-07 | (TODO) -- GDC | mRNA__geneExp__FPKM | |
| TCGA-E2-A1LS-11A-32R-A157-07 | (TODO) -- GDC | mRNA__counts__FPKM | |
| TCGA-E9-A1N4-11A-33R-A14M-07 | (TODO) -- GDC | mRNA__geneExpNormed__FPKM | |
| TCGA-E9-A1N4-11A-33R-A14M-07 | (TODO) -- GDC | mRNA__geneExp__FPKM | |
| TCGA-E9-A1N4-11A-33R-A14M-07 | (TODO) -- GDC | mRNA__counts__FPKM | |
| TCGA-E9-A1N5-11A-41R-A14D-07 | (TODO) -- GDC | mRNA__geneExpNormed__FPKM | |
| TCGA-E9-A1N5-11A-41R-A14D-07 | (TODO) -- GDC | mRNA__geneExp__FPKM | |
| TCGA-E9-A1N5-11A-41R-A14D-07 | (TODO) -- GDC | mRNA__counts__FPKM | |
| TCGA-E9-A1N6-11A-32R-A144-07 | (TODO) -- GDC | mRNA__geneExpNormed__FPKM | |
| TCGA-E9-A1N6-11A-32R-A144-07 | (TODO) -- GDC | mRNA__geneExp__FPKM | |
| TCGA-E9-A1N6-11A-32R-A144-07 | (TODO) -- GDC | mRNA__counts__FPKM | |
| TCGA-E9-A1N9-11A-71R-A14D-07 | (TODO) -- GDC | mRNA__geneExpNormed__FPKM | |
| TCGA-E9-A1N9-11A-71R-A14D-07 | (TODO) -- GDC | mRNA__geneExp__FPKM | |
| TCGA-E9-A1N9-11A-71R-A14D-07 | (TODO) -- GDC | mRNA__counts__FPKM | |
| TCGA-E9-A1NA-11A-33R-A144-07 | (TODO) -- GDC | mRNA__geneExpNormed__FPKM | |
| TCGA-E9-A1NA-11A-33R-A144-07 | (TODO) -- GDC | mRNA__geneExp__FPKM | |
| TCGA-E9-A1NA-11A-33R-A144-07 | (TODO) -- GDC | mRNA__counts__FPKM | |
| TCGA-E9-A1ND-11A-43R-A144-07 | (TODO) -- GDC | mRNA__geneExpNormed__FPKM | |
| TCGA-E9-A1ND-11A-43R-A144-07 | (TODO) -- GDC | mRNA__geneExp__FPKM | |
| TCGA-E9-A1ND-11A-43R-A144-07 | (TODO) -- GDC | mRNA__counts__FPKM | |
| TCGA-E9-A1NF-11A-73R-A14D-07 | (TODO) -- GDC | mRNA__geneExpNormed__FPKM | |
| TCGA-E9-A1NF-11A-73R-A14D-07 | (TODO) -- GDC | mRNA__geneExp__FPKM | |
| TCGA-E9-A1NF-11A-73R-A14D-07 | (TODO) -- GDC | mRNA__counts__FPKM | |
| TCGA-E9-A1NG-11A-52R-A14M-07 | (TODO) -- GDC | mRNA__geneExpNormed__FPKM | |
| TCGA-E9-A1NG-11A-52R-A14M-07 | (TODO) -- GDC | mRNA__geneExp__FPKM | |
| TCGA-E9-A1NG-11A-52R-A14M-07 | (TODO) -- GDC | mRNA__counts__FPKM | |
| TCGA-E9-A1R7-11A-42R-A14M-07 | (TODO) -- GDC | mRNA__geneExpNormed__FPKM | |
| TCGA-E9-A1R7-11A-42R-A14M-07 | (TODO) -- GDC | mRNA__geneExp__FPKM | |
| TCGA-E9-A1R7-11A-42R-A14M-07 | (TODO) -- GDC | mRNA__counts__FPKM | |
| TCGA-E9-A1RB-11A-33R-A157-07 | (TODO) -- GDC | mRNA__geneExpNormed__FPKM | |
| TCGA-E9-A1RB-11A-33R-A157-07 | (TODO) -- GDC | mRNA__geneExp__FPKM | |
| TCGA-E9-A1RB-11A-33R-A157-07 | (TODO) -- GDC | mRNA__counts__FPKM | |
| TCGA-E9-A1RC-11A-33R-A157-07 | (TODO) -- GDC | mRNA__geneExpNormed__FPKM | |
| TCGA-E9-A1RC-11A-33R-A157-07 | (TODO) -- GDC | mRNA__geneExp__FPKM | |
| TCGA-E9-A1RC-11A-33R-A157-07 | (TODO) -- GDC | mRNA__counts__FPKM | |
| TCGA-E9-A1RD-11A-33R-A157-07 | (TODO) -- GDC | mRNA__geneExpNormed__FPKM | |
| TCGA-E9-A1RD-11A-33R-A157-07 | (TODO) -- GDC | mRNA__geneExp__FPKM | |
| TCGA-E9-A1RD-11A-33R-A157-07 | (TODO) -- GDC | mRNA__counts__FPKM | |
| TCGA-E9-A1RF-11A-32R-A157-07 | (TODO) -- GDC | mRNA__geneExpNormed__FPKM | |
| TCGA-E9-A1RF-11A-32R-A157-07 | (TODO) -- GDC | mRNA__geneExp__FPKM | |
| TCGA-E9-A1RF-11A-32R-A157-07 | (TODO) -- GDC | mRNA__counts__FPKM | |
| TCGA-E9-A1RH-11A-34R-A169-07 | (TODO) -- GDC | mRNA__geneExpNormed__FPKM | |
| TCGA-E9-A1RH-11A-34R-A169-07 | (TODO) -- GDC | mRNA__geneExp__FPKM | |
| TCGA-E9-A1RH-11A-34R-A169-07 | (TODO) -- GDC | mRNA__counts__FPKM | |
| TCGA-E9-A1RI-11A-41R-A169-07 | (TODO) -- GDC | mRNA__geneExpNormed__FPKM | |
| TCGA-E9-A1RI-11A-41R-A169-07 | (TODO) -- GDC | mRNA__geneExp__FPKM | |
| TCGA-E9-A1RI-11A-41R-A169-07 | (TODO) -- GDC | mRNA__counts__FPKM | |
| TCGA-GI-A2C8-11A-22R-A16F-07 | (TODO) -- GDC | mRNA__geneExpNormed__FPKM | |
| TCGA-GI-A2C8-11A-22R-A16F-07 | (TODO) -- GDC | mRNA__geneExp__FPKM | |
| TCGA-GI-A2C8-11A-22R-A16F-07 | (TODO) -- GDC | mRNA__counts__FPKM | |
| TCGA-GI-A2C9-11A-22R-A21T-07 | (TODO) -- GDC | mRNA__geneExpNormed__FPKM | |
| TCGA-GI-A2C9-11A-22R-A21T-07 | (TODO) -- GDC | mRNA__geneExp__FPKM | |
| TCGA-GI-A2C9-11A-22R-A21T-07 | (TODO) -- GDC | mRNA__counts__FPKM |
Table S15.
| TCGA Barcode | Platform | Center | Annotation |
|---|---|---|---|
| TCGA-A7-A0CE-11A-21R-A090-13 | (TODO) -- GDC | miR__geneExp | |
| TCGA-A7-A0CE-11A-21R-A090-13 | (TODO) -- GDC | miR__isoformExp | |
| TCGA-A7-A0D9-11A-53R-A090-13 | (TODO) -- GDC | miR__geneExp | |
| TCGA-A7-A0D9-11A-53R-A090-13 | (TODO) -- GDC | miR__isoformExp | |
| TCGA-A7-A0DB-11A-33R-A090-13 | (TODO) -- GDC | miR__geneExp | |
| TCGA-A7-A0DB-11A-33R-A090-13 | (TODO) -- GDC | miR__isoformExp | |
| TCGA-A7-A0DC-11A-41R-A090-13 | (TODO) -- GDC | miR__geneExp | |
| TCGA-A7-A0DC-11A-41R-A090-13 | (TODO) -- GDC | miR__isoformExp | |
| TCGA-A7-A13E-11A-61R-A12O-13 | (TODO) -- GDC | miR__geneExp | |
| TCGA-A7-A13E-11A-61R-A12O-13 | (TODO) -- GDC | miR__isoformExp | |
| TCGA-A7-A13F-11A-42R-A12O-13 | (TODO) -- GDC | miR__geneExp | |
| TCGA-A7-A13F-11A-42R-A12O-13 | (TODO) -- GDC | miR__isoformExp | |
| TCGA-A7-A13G-11A-51R-A13P-13 | (TODO) -- GDC | miR__geneExp | |
| TCGA-A7-A13G-11A-51R-A13P-13 | (TODO) -- GDC | miR__isoformExp | |
| TCGA-AC-A23H-11A-12R-A156-13 | (TODO) -- GDC | miR__geneExp | |
| TCGA-AC-A23H-11A-12R-A156-13 | (TODO) -- GDC | miR__isoformExp | |
| TCGA-AC-A2FB-11A-13R-A17A-13 | (TODO) -- GDC | miR__geneExp | |
| TCGA-AC-A2FB-11A-13R-A17A-13 | (TODO) -- GDC | miR__isoformExp | |
| TCGA-AC-A2FM-11B-32R-A19V-13 | (TODO) -- GDC | miR__geneExp | |
| TCGA-AC-A2FM-11B-32R-A19V-13 | (TODO) -- GDC | miR__isoformExp | |
| TCGA-BH-A0AU-11A-11R-A12O-13 | (TODO) -- GDC | miR__geneExp | |
| TCGA-BH-A0AU-11A-11R-A12O-13 | (TODO) -- GDC | miR__isoformExp | |
| TCGA-BH-A0AY-11A-23R-A090-13 | (TODO) -- GDC | miR__geneExp | |
| TCGA-BH-A0AY-11A-23R-A090-13 | (TODO) -- GDC | miR__isoformExp | |
| TCGA-BH-A0AZ-11A-22R-A12O-13 | (TODO) -- GDC | miR__geneExp | |
| TCGA-BH-A0AZ-11A-22R-A12O-13 | (TODO) -- GDC | miR__isoformExp | |
| TCGA-BH-A0B3-11B-21R-A090-13 | (TODO) -- GDC | miR__geneExp | |
| TCGA-BH-A0B3-11B-21R-A090-13 | (TODO) -- GDC | miR__isoformExp | |
| TCGA-BH-A0B5-11A-23R-A12O-13 | (TODO) -- GDC | miR__geneExp | |
| TCGA-BH-A0B5-11A-23R-A12O-13 | (TODO) -- GDC | miR__isoformExp | |
| TCGA-BH-A0B7-11A-34R-A114-13 | (TODO) -- GDC | miR__geneExp | |
| TCGA-BH-A0B7-11A-34R-A114-13 | (TODO) -- GDC | miR__isoformExp | |
| TCGA-BH-A0BC-11A-22R-A090-13 | (TODO) -- GDC | miR__geneExp | |
| TCGA-BH-A0BC-11A-22R-A090-13 | (TODO) -- GDC | miR__isoformExp | |
| TCGA-BH-A0BJ-11A-23R-A090-13 | (TODO) -- GDC | miR__geneExp | |
| TCGA-BH-A0BJ-11A-23R-A090-13 | (TODO) -- GDC | miR__isoformExp | |
| TCGA-BH-A0BQ-11A-33R-A114-13 | (TODO) -- GDC | miR__geneExp | |
| TCGA-BH-A0BQ-11A-33R-A114-13 | (TODO) -- GDC | miR__isoformExp | |
| TCGA-BH-A0BS-11A-11R-A12O-13 | (TODO) -- GDC | miR__geneExp | |
| TCGA-BH-A0BS-11A-11R-A12O-13 | (TODO) -- GDC | miR__isoformExp | |
| TCGA-BH-A0BT-11A-21R-A12O-13 | (TODO) -- GDC | miR__geneExp | |
| TCGA-BH-A0BT-11A-21R-A12O-13 | (TODO) -- GDC | miR__isoformExp | |
| TCGA-BH-A0BV-11A-31R-A090-13 | (TODO) -- GDC | miR__geneExp | |
| TCGA-BH-A0BV-11A-31R-A090-13 | (TODO) -- GDC | miR__isoformExp | |
| TCGA-BH-A0BW-11A-12R-A114-13 | (TODO) -- GDC | miR__geneExp | |
| TCGA-BH-A0BW-11A-12R-A114-13 | (TODO) -- GDC | miR__isoformExp | |
| TCGA-BH-A0BZ-11A-61R-A12O-13 | (TODO) -- GDC | miR__geneExp | |
| TCGA-BH-A0BZ-11A-61R-A12O-13 | (TODO) -- GDC | miR__isoformExp | |
| TCGA-BH-A0C0-11A-21R-A090-13 | (TODO) -- GDC | miR__geneExp | |
| TCGA-BH-A0C0-11A-21R-A090-13 | (TODO) -- GDC | miR__isoformExp | |
| TCGA-BH-A0C3-11A-23R-A12O-13 | (TODO) -- GDC | miR__geneExp | |
| TCGA-BH-A0C3-11A-23R-A12O-13 | (TODO) -- GDC | miR__isoformExp | |
| TCGA-BH-A0DD-11A-23R-A12O-13 | (TODO) -- GDC | miR__geneExp | |
| TCGA-BH-A0DD-11A-23R-A12O-13 | (TODO) -- GDC | miR__isoformExp | |
| TCGA-BH-A0DG-11A-43R-A12O-13 | (TODO) -- GDC | miR__geneExp | |
| TCGA-BH-A0DG-11A-43R-A12O-13 | (TODO) -- GDC | miR__isoformExp | |
| TCGA-BH-A0DK-11A-13R-A090-13 | (TODO) -- GDC | miR__geneExp | |
| TCGA-BH-A0DK-11A-13R-A090-13 | (TODO) -- GDC | miR__isoformExp | |
| TCGA-BH-A0DL-11A-13R-A114-13 | (TODO) -- GDC | miR__geneExp | |
| TCGA-BH-A0DL-11A-13R-A114-13 | (TODO) -- GDC | miR__isoformExp | |
| TCGA-BH-A0DO-11A-22R-A12C-13 | (TODO) -- GDC | miR__geneExp | |
| TCGA-BH-A0DO-11A-22R-A12C-13 | (TODO) -- GDC | miR__isoformExp | |
| TCGA-BH-A0DP-11A-12R-A090-13 | (TODO) -- GDC | miR__geneExp | |
| TCGA-BH-A0DP-11A-12R-A090-13 | (TODO) -- GDC | miR__isoformExp | |
| TCGA-BH-A0DQ-11A-12R-A090-13 | (TODO) -- GDC | miR__geneExp | |
| TCGA-BH-A0DQ-11A-12R-A090-13 | (TODO) -- GDC | miR__isoformExp | |
| TCGA-BH-A0DT-11A-12R-A12C-13 | (TODO) -- GDC | miR__geneExp | |
| TCGA-BH-A0DT-11A-12R-A12C-13 | (TODO) -- GDC | miR__isoformExp | |
| TCGA-BH-A0DV-11A-22R-A12O-13 | (TODO) -- GDC | miR__geneExp | |
| TCGA-BH-A0DV-11A-22R-A12O-13 | (TODO) -- GDC | miR__isoformExp | |
| TCGA-BH-A0DZ-11A-22R-A090-13 | (TODO) -- GDC | miR__geneExp | |
| TCGA-BH-A0DZ-11A-22R-A090-13 | (TODO) -- GDC | miR__isoformExp | |
| TCGA-BH-A0E1-11A-13R-A090-13 | (TODO) -- GDC | miR__geneExp | |
| TCGA-BH-A0E1-11A-13R-A090-13 | (TODO) -- GDC | miR__isoformExp | |
| TCGA-BH-A0H5-11A-62R-A114-13 | (TODO) -- GDC | miR__geneExp | |
| TCGA-BH-A0H5-11A-62R-A114-13 | (TODO) -- GDC | miR__isoformExp | |
| TCGA-BH-A0H7-11A-13R-A090-13 | (TODO) -- GDC | miR__geneExp | |
| TCGA-BH-A0H7-11A-13R-A090-13 | (TODO) -- GDC | miR__isoformExp | |
| TCGA-BH-A0HA-11A-31R-A12O-13 | (TODO) -- GDC | miR__geneExp | |
| TCGA-BH-A0HA-11A-31R-A12O-13 | (TODO) -- GDC | miR__isoformExp | |
| TCGA-BH-A0HK-11A-11R-A090-13 | (TODO) -- GDC | miR__geneExp | |
| TCGA-BH-A0HK-11A-11R-A090-13 | (TODO) -- GDC | miR__isoformExp | |
| TCGA-BH-A18J-11A-31R-A12C-13 | (TODO) -- GDC | miR__geneExp | |
| TCGA-BH-A18J-11A-31R-A12C-13 | (TODO) -- GDC | miR__isoformExp | |
| TCGA-BH-A18K-11A-13R-A12C-13 | (TODO) -- GDC | miR__geneExp | |
| TCGA-BH-A18K-11A-13R-A12C-13 | (TODO) -- GDC | miR__isoformExp | |
| TCGA-BH-A18L-11A-42R-A12C-13 | (TODO) -- GDC | miR__geneExp | |
| TCGA-BH-A18L-11A-42R-A12C-13 | (TODO) -- GDC | miR__isoformExp | |
| TCGA-BH-A18M-11A-33R-A12C-13 | (TODO) -- GDC | miR__geneExp | |
| TCGA-BH-A18M-11A-33R-A12C-13 | (TODO) -- GDC | miR__isoformExp | |
| TCGA-BH-A18N-11A-43R-A12C-13 | (TODO) -- GDC | miR__geneExp | |
| TCGA-BH-A18N-11A-43R-A12C-13 | (TODO) -- GDC | miR__isoformExp | |
| TCGA-BH-A18P-11A-43R-A12C-13 | (TODO) -- GDC | miR__geneExp | |
| TCGA-BH-A18P-11A-43R-A12C-13 | (TODO) -- GDC | miR__isoformExp | |
| TCGA-BH-A18Q-11A-34R-A12C-13 | (TODO) -- GDC | miR__geneExp | |
| TCGA-BH-A18Q-11A-34R-A12C-13 | (TODO) -- GDC | miR__isoformExp | |
| TCGA-BH-A18R-11A-42R-A12C-13 | (TODO) -- GDC | miR__geneExp | |
| TCGA-BH-A18R-11A-42R-A12C-13 | (TODO) -- GDC | miR__isoformExp | |
| TCGA-BH-A18S-11A-43R-A12C-13 | (TODO) -- GDC | miR__geneExp | |
| TCGA-BH-A18S-11A-43R-A12C-13 | (TODO) -- GDC | miR__isoformExp | |
| TCGA-BH-A18U-11A-23R-A12C-13 | (TODO) -- GDC | miR__geneExp | |
| TCGA-BH-A18U-11A-23R-A12C-13 | (TODO) -- GDC | miR__isoformExp | |
| TCGA-BH-A1EN-11A-23R-A13P-13 | (TODO) -- GDC | miR__geneExp | |
| TCGA-BH-A1EN-11A-23R-A13P-13 | (TODO) -- GDC | miR__isoformExp | |
| TCGA-BH-A1EO-11A-31R-A136-13 | (TODO) -- GDC | miR__geneExp | |
| TCGA-BH-A1EO-11A-31R-A136-13 | (TODO) -- GDC | miR__isoformExp | |
| TCGA-BH-A1ET-11B-23R-A136-13 | (TODO) -- GDC | miR__geneExp | |
| TCGA-BH-A1ET-11B-23R-A136-13 | (TODO) -- GDC | miR__isoformExp | |
| TCGA-BH-A1EU-11A-23R-A136-13 | (TODO) -- GDC | miR__geneExp | |
| TCGA-BH-A1EU-11A-23R-A136-13 | (TODO) -- GDC | miR__isoformExp | |
| TCGA-BH-A1EV-11A-24R-A136-13 | (TODO) -- GDC | miR__geneExp | |
| TCGA-BH-A1EV-11A-24R-A136-13 | (TODO) -- GDC | miR__isoformExp | |
| TCGA-BH-A1EW-11B-33R-A136-13 | (TODO) -- GDC | miR__geneExp | |
| TCGA-BH-A1EW-11B-33R-A136-13 | (TODO) -- GDC | miR__isoformExp | |
| TCGA-BH-A1F0-11B-23R-A136-13 | (TODO) -- GDC | miR__geneExp | |
| TCGA-BH-A1F0-11B-23R-A136-13 | (TODO) -- GDC | miR__isoformExp | |
| TCGA-BH-A1F2-11A-32R-A13P-13 | (TODO) -- GDC | miR__geneExp | |
| TCGA-BH-A1F2-11A-32R-A13P-13 | (TODO) -- GDC | miR__isoformExp | |
| TCGA-BH-A1F6-11B-94R-A13P-13 | (TODO) -- GDC | miR__geneExp | |
| TCGA-BH-A1F6-11B-94R-A13P-13 | (TODO) -- GDC | miR__isoformExp | |
| TCGA-BH-A1F8-11B-21R-A13P-13 | (TODO) -- GDC | miR__geneExp | |
| TCGA-BH-A1F8-11B-21R-A13P-13 | (TODO) -- GDC | miR__isoformExp | |
| TCGA-BH-A1FB-11A-33R-A13P-13 | (TODO) -- GDC | miR__geneExp | |
| TCGA-BH-A1FB-11A-33R-A13P-13 | (TODO) -- GDC | miR__isoformExp | |
| TCGA-BH-A1FC-11A-32R-A13P-13 | (TODO) -- GDC | miR__geneExp | |
| TCGA-BH-A1FC-11A-32R-A13P-13 | (TODO) -- GDC | miR__isoformExp | |
| TCGA-BH-A1FD-11B-21R-A13P-13 | (TODO) -- GDC | miR__geneExp | |
| TCGA-BH-A1FD-11B-21R-A13P-13 | (TODO) -- GDC | miR__isoformExp | |
| TCGA-BH-A1FE-11B-14R-A13P-13 | (TODO) -- GDC | miR__geneExp | |
| TCGA-BH-A1FE-11B-14R-A13P-13 | (TODO) -- GDC | miR__isoformExp | |
| TCGA-BH-A1FG-11B-12R-A13P-13 | (TODO) -- GDC | miR__geneExp | |
| TCGA-BH-A1FG-11B-12R-A13P-13 | (TODO) -- GDC | miR__isoformExp | |
| TCGA-BH-A1FH-11B-42R-A13P-13 | (TODO) -- GDC | miR__geneExp | |
| TCGA-BH-A1FH-11B-42R-A13P-13 | (TODO) -- GDC | miR__isoformExp | |
| TCGA-BH-A1FJ-11B-42R-A13P-13 | (TODO) -- GDC | miR__geneExp | |
| TCGA-BH-A1FJ-11B-42R-A13P-13 | (TODO) -- GDC | miR__isoformExp | |
| TCGA-BH-A1FM-11B-23R-A13P-13 | (TODO) -- GDC | miR__geneExp | |
| TCGA-BH-A1FM-11B-23R-A13P-13 | (TODO) -- GDC | miR__isoformExp | |
| TCGA-BH-A1FN-11A-34R-A13P-13 | (TODO) -- GDC | miR__geneExp | |
| TCGA-BH-A1FN-11A-34R-A13P-13 | (TODO) -- GDC | miR__isoformExp | |
| TCGA-BH-A1FR-11B-42R-A13P-13 | (TODO) -- GDC | miR__geneExp | |
| TCGA-BH-A1FR-11B-42R-A13P-13 | (TODO) -- GDC | miR__isoformExp | |
| TCGA-BH-A1FU-11A-23R-A14C-13 | (TODO) -- GDC | miR__geneExp | |
| TCGA-BH-A1FU-11A-23R-A14C-13 | (TODO) -- GDC | miR__isoformExp | |
| TCGA-BH-A203-11A-42R-A168-13 | (TODO) -- GDC | miR__geneExp | |
| TCGA-BH-A203-11A-42R-A168-13 | (TODO) -- GDC | miR__isoformExp | |
| TCGA-BH-A204-11A-53R-A156-13 | (TODO) -- GDC | miR__geneExp | |
| TCGA-BH-A204-11A-53R-A156-13 | (TODO) -- GDC | miR__isoformExp | |
| TCGA-BH-A208-11A-51R-A156-13 | (TODO) -- GDC | miR__geneExp | |
| TCGA-BH-A208-11A-51R-A156-13 | (TODO) -- GDC | miR__isoformExp | |
| TCGA-BH-A209-11A-42R-A156-13 | (TODO) -- GDC | miR__geneExp | |
| TCGA-BH-A209-11A-42R-A156-13 | (TODO) -- GDC | miR__isoformExp | |
| TCGA-E2-A153-11A-31R-A12C-13 | (TODO) -- GDC | miR__geneExp | |
| TCGA-E2-A153-11A-31R-A12C-13 | (TODO) -- GDC | miR__isoformExp | |
| TCGA-E2-A158-11A-22R-A12C-13 | (TODO) -- GDC | miR__geneExp | |
| TCGA-E2-A158-11A-22R-A12C-13 | (TODO) -- GDC | miR__isoformExp | |
| TCGA-E2-A15I-11A-32R-A136-13 | (TODO) -- GDC | miR__geneExp | |
| TCGA-E2-A15I-11A-32R-A136-13 | (TODO) -- GDC | miR__isoformExp | |
| TCGA-E2-A15K-11A-13R-A12O-13 | (TODO) -- GDC | miR__geneExp | |
| TCGA-E2-A15K-11A-13R-A12O-13 | (TODO) -- GDC | miR__isoformExp | |
| TCGA-E2-A15M-11A-22R-A12C-13 | (TODO) -- GDC | miR__geneExp | |
| TCGA-E2-A15M-11A-22R-A12C-13 | (TODO) -- GDC | miR__isoformExp | |
| TCGA-E2-A1BC-11A-32R-A12O-13 | (TODO) -- GDC | miR__geneExp | |
| TCGA-E2-A1BC-11A-32R-A12O-13 | (TODO) -- GDC | miR__isoformExp | |
| TCGA-E2-A1IG-11A-22R-A143-13 | (TODO) -- GDC | miR__geneExp | |
| TCGA-E2-A1IG-11A-22R-A143-13 | (TODO) -- GDC | miR__isoformExp | |
| TCGA-E2-A1L7-11A-33R-A143-13 | (TODO) -- GDC | miR__geneExp | |
| TCGA-E2-A1L7-11A-33R-A143-13 | (TODO) -- GDC | miR__isoformExp | |
| TCGA-E2-A1LB-11A-22R-A143-13 | (TODO) -- GDC | miR__geneExp | |
| TCGA-E2-A1LB-11A-22R-A143-13 | (TODO) -- GDC | miR__isoformExp | |
| TCGA-E2-A1LH-11A-22R-A14C-13 | (TODO) -- GDC | miR__geneExp | |
| TCGA-E2-A1LH-11A-22R-A14C-13 | (TODO) -- GDC | miR__isoformExp | |
| TCGA-E2-A1LS-11A-32R-A156-13 | (TODO) -- GDC | miR__geneExp | |
| TCGA-E2-A1LS-11A-32R-A156-13 | (TODO) -- GDC | miR__isoformExp | |
| TCGA-E9-A1N4-11A-33R-A14L-13 | (TODO) -- GDC | miR__geneExp | |
| TCGA-E9-A1N4-11A-33R-A14L-13 | (TODO) -- GDC | miR__isoformExp | |
| TCGA-E9-A1N5-11A-41R-A14C-13 | (TODO) -- GDC | miR__geneExp | |
| TCGA-E9-A1N5-11A-41R-A14C-13 | (TODO) -- GDC | miR__isoformExp | |
| TCGA-E9-A1N6-11A-32R-A143-13 | (TODO) -- GDC | miR__geneExp | |
| TCGA-E9-A1N6-11A-32R-A143-13 | (TODO) -- GDC | miR__isoformExp | |
| TCGA-E9-A1N9-11A-71R-A14C-13 | (TODO) -- GDC | miR__geneExp | |
| TCGA-E9-A1N9-11A-71R-A14C-13 | (TODO) -- GDC | miR__isoformExp | |
| TCGA-E9-A1NA-11A-33R-A143-13 | (TODO) -- GDC | miR__geneExp | |
| TCGA-E9-A1NA-11A-33R-A143-13 | (TODO) -- GDC | miR__isoformExp | |
| TCGA-E9-A1ND-11A-43R-A143-13 | (TODO) -- GDC | miR__geneExp | |
| TCGA-E9-A1ND-11A-43R-A143-13 | (TODO) -- GDC | miR__isoformExp | |
| TCGA-E9-A1NF-11A-73R-A14C-13 | (TODO) -- GDC | miR__geneExp | |
| TCGA-E9-A1NF-11A-73R-A14C-13 | (TODO) -- GDC | miR__isoformExp | |
| TCGA-E9-A1NG-11A-52R-A14L-13 | (TODO) -- GDC | miR__geneExp | |
| TCGA-E9-A1NG-11A-52R-A14L-13 | (TODO) -- GDC | miR__isoformExp | |
| TCGA-E9-A1R7-11A-42R-A14L-13 | (TODO) -- GDC | miR__geneExp | |
| TCGA-E9-A1R7-11A-42R-A14L-13 | (TODO) -- GDC | miR__isoformExp | |
| TCGA-E9-A1RB-11A-33R-A156-13 | (TODO) -- GDC | miR__geneExp | |
| TCGA-E9-A1RB-11A-33R-A156-13 | (TODO) -- GDC | miR__isoformExp | |
| TCGA-E9-A1RC-11A-33R-A156-13 | (TODO) -- GDC | miR__geneExp | |
| TCGA-E9-A1RC-11A-33R-A156-13 | (TODO) -- GDC | miR__isoformExp | |
| TCGA-E9-A1RD-11A-33R-A156-13 | (TODO) -- GDC | miR__geneExp | |
| TCGA-E9-A1RD-11A-33R-A156-13 | (TODO) -- GDC | miR__isoformExp | |
| TCGA-E9-A1RF-11A-32R-A156-13 | (TODO) -- GDC | miR__geneExp | |
| TCGA-E9-A1RF-11A-32R-A156-13 | (TODO) -- GDC | miR__isoformExp | |
| TCGA-E9-A1RH-11A-34R-A168-13 | (TODO) -- GDC | miR__geneExp | |
| TCGA-E9-A1RH-11A-34R-A168-13 | (TODO) -- GDC | miR__isoformExp | |
| TCGA-E9-A1RI-11A-41R-A168-13 | (TODO) -- GDC | miR__geneExp | |
| TCGA-E9-A1RI-11A-41R-A168-13 | (TODO) -- GDC | miR__isoformExp | |
| TCGA-GI-A2C8-11A-22R-A16E-13 | (TODO) -- GDC | miR__geneExp | |
| TCGA-GI-A2C8-11A-22R-A16E-13 | (TODO) -- GDC | miR__isoformExp | |
| TCGA-GI-A2C9-11A-22R-A21U-13 | (TODO) -- GDC | miR__geneExp | |
| TCGA-GI-A2C9-11A-22R-A21U-13 | (TODO) -- GDC | miR__isoformExp |
Table S16.
| TCGA Barcode | Platform | Center | Annotation |
|---|---|---|---|
| TCGA-A7-A0CE-11A-21D-A10Q-05 | Illumina Human Methylation 450 | (TODO) -- GDC | methylation__HM450 |
| TCGA-A7-A0CH-11A-32D-A10Q-05 | Illumina Human Methylation 450 | (TODO) -- GDC | methylation__HM450 |
| TCGA-A7-A0D9-11A-53D-A10Q-05 | Illumina Human Methylation 450 | (TODO) -- GDC | methylation__HM450 |
| TCGA-A7-A0DB-11A-33D-A093-05 | Illumina Human Methylation 450 | (TODO) -- GDC | methylation__HM450 |
| TCGA-A7-A13E-11A-61D-A12R-05 | Illumina Human Methylation 450 | (TODO) -- GDC | methylation__HM450 |
| TCGA-A7-A13F-11A-42D-A12R-05 | Illumina Human Methylation 450 | (TODO) -- GDC | methylation__HM450 |
| TCGA-A7-A13G-11A-51D-A13T-05 | Illumina Human Methylation 450 | (TODO) -- GDC | methylation__HM450 |
| TCGA-AC-A23H-11A-12D-A161-05 | Illumina Human Methylation 450 | (TODO) -- GDC | methylation__HM450 |
| TCGA-AC-A2FB-11A-13D-A17F-05 | Illumina Human Methylation 450 | (TODO) -- GDC | methylation__HM450 |
| TCGA-AC-A2FF-11A-13D-A17F-05 | Illumina Human Methylation 450 | (TODO) -- GDC | methylation__HM450 |
| TCGA-AC-A2FG-11A-22D-A17F-05 | Illumina Human Methylation 450 | (TODO) -- GDC | methylation__HM450 |
| TCGA-AC-A2FM-11B-32D-A19Z-05 | Illumina Human Methylation 450 | (TODO) -- GDC | methylation__HM450 |
| TCGA-BH-A0AU-11A-11D-A12R-05 | Illumina Human Methylation 450 | (TODO) -- GDC | methylation__HM450 |
| TCGA-BH-A0AY-11A-23D-A10Q-05 | Illumina Human Methylation 450 | (TODO) -- GDC | methylation__HM450 |
| TCGA-BH-A0AZ-11A-22D-A12R-05 | Illumina Human Methylation 450 | (TODO) -- GDC | methylation__HM450 |
| TCGA-BH-A0B3-11B-21D-A10Q-05 | Illumina Human Methylation 450 | (TODO) -- GDC | methylation__HM450 |
| TCGA-BH-A0B7-11A-34D-A112-05 | Illumina Human Methylation 27 | (TODO) -- GDC | methylation__HM27 |
| TCGA-BH-A0B8-11A-41D-A093-05 | Illumina Human Methylation 450 | (TODO) -- GDC | methylation__HM450 |
| TCGA-BH-A0BA-11A-22D-A10Q-05 | Illumina Human Methylation 450 | (TODO) -- GDC | methylation__HM450 |
| TCGA-BH-A0BC-11A-22D-A093-05 | Illumina Human Methylation 450 | (TODO) -- GDC | methylation__HM450 |
| TCGA-BH-A0BF-11A-31D-A12R-05 | Illumina Human Methylation 450 | (TODO) -- GDC | methylation__HM450 |
| TCGA-BH-A0BJ-11A-23D-A10Q-05 | Illumina Human Methylation 450 | (TODO) -- GDC | methylation__HM450 |
| TCGA-BH-A0BL-11A-12D-A112-05 | Illumina Human Methylation 27 | (TODO) -- GDC | methylation__HM27 |
| TCGA-BH-A0BM-11A-12D-A093-05 | Illumina Human Methylation 450 | (TODO) -- GDC | methylation__HM450 |
| TCGA-BH-A0BO-11A-11D-A12E-05 | Illumina Human Methylation 27 | (TODO) -- GDC | methylation__HM27 |
| TCGA-BH-A0BQ-11A-33D-A112-05 | Illumina Human Methylation 27 | (TODO) -- GDC | methylation__HM27 |
| TCGA-BH-A0BS-11A-11D-A12R-05 | Illumina Human Methylation 450 | (TODO) -- GDC | methylation__HM450 |
| TCGA-BH-A0BT-11A-21D-A12R-05 | Illumina Human Methylation 450 | (TODO) -- GDC | methylation__HM450 |
| TCGA-BH-A0BV-11A-31D-A10Q-05 | Illumina Human Methylation 450 | (TODO) -- GDC | methylation__HM450 |
| TCGA-BH-A0BW-11A-12D-A112-05 | Illumina Human Methylation 27 | (TODO) -- GDC | methylation__HM27 |
| TCGA-BH-A0BZ-11A-61D-A12R-05 | Illumina Human Methylation 450 | (TODO) -- GDC | methylation__HM450 |
| TCGA-BH-A0C0-11A-21D-A10Q-05 | Illumina Human Methylation 450 | (TODO) -- GDC | methylation__HM450 |
| TCGA-BH-A0C3-11A-23D-A12R-05 | Illumina Human Methylation 450 | (TODO) -- GDC | methylation__HM450 |
| TCGA-BH-A0DE-11A-23D-A112-05 | Illumina Human Methylation 27 | (TODO) -- GDC | methylation__HM27 |
| TCGA-BH-A0DG-11A-43D-A12R-05 | Illumina Human Methylation 450 | (TODO) -- GDC | methylation__HM450 |
| TCGA-BH-A0DH-11A-31D-A10Q-05 | Illumina Human Methylation 450 | (TODO) -- GDC | methylation__HM450 |
| TCGA-BH-A0DI-11A-32D-A12R-05 | Illumina Human Methylation 450 | (TODO) -- GDC | methylation__HM450 |
| TCGA-BH-A0DK-11A-13D-A10Q-05 | Illumina Human Methylation 450 | (TODO) -- GDC | methylation__HM450 |
| TCGA-BH-A0DL-11A-13D-A112-05 | Illumina Human Methylation 27 | (TODO) -- GDC | methylation__HM27 |
| TCGA-BH-A0DO-11A-22D-A12E-05 | Illumina Human Methylation 27 | (TODO) -- GDC | methylation__HM27 |
| TCGA-BH-A0DP-11A-12D-A10Q-05 | Illumina Human Methylation 450 | (TODO) -- GDC | methylation__HM450 |
| TCGA-BH-A0DQ-11A-12D-A10Q-05 | Illumina Human Methylation 450 | (TODO) -- GDC | methylation__HM450 |
| TCGA-BH-A0DT-11A-12D-A12E-05 | Illumina Human Methylation 27 | (TODO) -- GDC | methylation__HM27 |
| TCGA-BH-A0DV-11A-22D-A12R-05 | Illumina Human Methylation 450 | (TODO) -- GDC | methylation__HM450 |
| TCGA-BH-A0DZ-11A-22D-A10Q-05 | Illumina Human Methylation 450 | (TODO) -- GDC | methylation__HM450 |
| TCGA-BH-A0E0-11A-13D-A10Q-05 | Illumina Human Methylation 450 | (TODO) -- GDC | methylation__HM450 |
| TCGA-BH-A0E1-11A-13D-A10Q-05 | Illumina Human Methylation 450 | (TODO) -- GDC | methylation__HM450 |
| TCGA-BH-A0H5-11A-62D-A112-05 | Illumina Human Methylation 27 | (TODO) -- GDC | methylation__HM27 |
| TCGA-BH-A0H7-11A-13D-A10Q-05 | Illumina Human Methylation 450 | (TODO) -- GDC | methylation__HM450 |
| TCGA-BH-A0H9-11A-22D-A093-05 | Illumina Human Methylation 450 | (TODO) -- GDC | methylation__HM450 |
| TCGA-BH-A0HA-11A-31D-A12R-05 | Illumina Human Methylation 450 | (TODO) -- GDC | methylation__HM450 |
| TCGA-BH-A0HK-11A-11D-A10Q-05 | Illumina Human Methylation 450 | (TODO) -- GDC | methylation__HM450 |
| TCGA-BH-A18F-11A-22D-A12E-05 | Illumina Human Methylation 27 | (TODO) -- GDC | methylation__HM27 |
| TCGA-BH-A18J-11A-31D-A12E-05 | Illumina Human Methylation 27 | (TODO) -- GDC | methylation__HM27 |
| TCGA-BH-A18K-11A-13D-A12E-05 | Illumina Human Methylation 27 | (TODO) -- GDC | methylation__HM27 |
| TCGA-BH-A18L-11A-42D-A12E-05 | Illumina Human Methylation 27 | (TODO) -- GDC | methylation__HM27 |
| TCGA-BH-A18M-11A-33D-A12E-05 | Illumina Human Methylation 27 | (TODO) -- GDC | methylation__HM27 |
| TCGA-BH-A18N-11A-43D-A12E-05 | Illumina Human Methylation 27 | (TODO) -- GDC | methylation__HM27 |
| TCGA-BH-A18P-11A-43D-A12E-05 | Illumina Human Methylation 27 | (TODO) -- GDC | methylation__HM27 |
| TCGA-BH-A18Q-11A-34D-A12E-05 | Illumina Human Methylation 27 | (TODO) -- GDC | methylation__HM27 |
| TCGA-BH-A18R-11A-42D-A12E-05 | Illumina Human Methylation 27 | (TODO) -- GDC | methylation__HM27 |
| TCGA-BH-A18S-11A-43D-A12E-05 | Illumina Human Methylation 27 | (TODO) -- GDC | methylation__HM27 |
| TCGA-BH-A18U-11A-23D-A12E-05 | Illumina Human Methylation 27 | (TODO) -- GDC | methylation__HM27 |
| TCGA-BH-A18V-11A-52D-A12E-05 | Illumina Human Methylation 27 | (TODO) -- GDC | methylation__HM27 |
| TCGA-BH-A1EN-11A-23D-A13T-05 | Illumina Human Methylation 450 | (TODO) -- GDC | methylation__HM450 |
| TCGA-BH-A1EO-11A-31D-A138-05 | Illumina Human Methylation 450 | (TODO) -- GDC | methylation__HM450 |
| TCGA-BH-A1ES-11A-33D-A138-05 | Illumina Human Methylation 450 | (TODO) -- GDC | methylation__HM450 |
| TCGA-BH-A1ET-11B-23D-A138-05 | Illumina Human Methylation 450 | (TODO) -- GDC | methylation__HM450 |
| TCGA-BH-A1EU-11A-23D-A138-05 | Illumina Human Methylation 450 | (TODO) -- GDC | methylation__HM450 |
| TCGA-BH-A1EV-11A-24D-A138-05 | Illumina Human Methylation 450 | (TODO) -- GDC | methylation__HM450 |
| TCGA-BH-A1EW-11B-33D-A138-05 | Illumina Human Methylation 450 | (TODO) -- GDC | methylation__HM450 |
| TCGA-BH-A1EY-11B-21D-A13T-05 | Illumina Human Methylation 450 | (TODO) -- GDC | methylation__HM450 |
| TCGA-BH-A1F0-11B-23D-A138-05 | Illumina Human Methylation 450 | (TODO) -- GDC | methylation__HM450 |
| TCGA-BH-A1F2-11A-32D-A13T-05 | Illumina Human Methylation 450 | (TODO) -- GDC | methylation__HM450 |
| TCGA-BH-A1F5-11A-43D-A13T-05 | Illumina Human Methylation 450 | (TODO) -- GDC | methylation__HM450 |
| TCGA-BH-A1F6-11B-94D-A13T-05 | Illumina Human Methylation 450 | (TODO) -- GDC | methylation__HM450 |
| TCGA-BH-A1F8-11B-21D-A13T-05 | Illumina Human Methylation 450 | (TODO) -- GDC | methylation__HM450 |
| TCGA-BH-A1FB-11A-33D-A13T-05 | Illumina Human Methylation 450 | (TODO) -- GDC | methylation__HM450 |
| TCGA-BH-A1FC-11A-32D-A13T-05 | Illumina Human Methylation 450 | (TODO) -- GDC | methylation__HM450 |
| TCGA-BH-A1FD-11B-21D-A13T-05 | Illumina Human Methylation 450 | (TODO) -- GDC | methylation__HM450 |
| TCGA-BH-A1FE-11B-14D-A13T-05 | Illumina Human Methylation 450 | (TODO) -- GDC | methylation__HM450 |
| TCGA-BH-A1FG-11B-12D-A13T-05 | Illumina Human Methylation 450 | (TODO) -- GDC | methylation__HM450 |
| TCGA-BH-A1FH-11B-42D-A13T-05 | Illumina Human Methylation 450 | (TODO) -- GDC | methylation__HM450 |
| TCGA-BH-A1FJ-11B-42D-A13T-05 | Illumina Human Methylation 450 | (TODO) -- GDC | methylation__HM450 |
| TCGA-BH-A1FM-11B-23D-A13T-05 | Illumina Human Methylation 450 | (TODO) -- GDC | methylation__HM450 |
| TCGA-BH-A1FN-11A-34D-A13T-05 | Illumina Human Methylation 450 | (TODO) -- GDC | methylation__HM450 |
| TCGA-BH-A1FR-11B-42D-A13T-05 | Illumina Human Methylation 450 | (TODO) -- GDC | methylation__HM450 |
| TCGA-BH-A203-11A-42D-A16A-05 | Illumina Human Methylation 450 | (TODO) -- GDC | methylation__HM450 |
| TCGA-BH-A204-11A-53D-A161-05 | Illumina Human Methylation 450 | (TODO) -- GDC | methylation__HM450 |
| TCGA-BH-A208-11A-51D-A161-05 | Illumina Human Methylation 450 | (TODO) -- GDC | methylation__HM450 |
| TCGA-BH-A209-11A-42D-A161-05 | Illumina Human Methylation 450 | (TODO) -- GDC | methylation__HM450 |
| TCGA-E2-A14Y-11A-33D-A12E-05 | Illumina Human Methylation 27 | (TODO) -- GDC | methylation__HM27 |
| TCGA-E2-A153-11A-31D-A12E-05 | Illumina Human Methylation 27 | (TODO) -- GDC | methylation__HM27 |
| TCGA-E2-A158-11A-22D-A12E-05 | Illumina Human Methylation 27 | (TODO) -- GDC | methylation__HM27 |
| TCGA-E2-A15I-11A-32D-A138-05 | Illumina Human Methylation 450 | (TODO) -- GDC | methylation__HM450 |
| TCGA-E2-A15K-11A-13D-A12R-05 | Illumina Human Methylation 450 | (TODO) -- GDC | methylation__HM450 |
| TCGA-E2-A15L-11A-31D-A12E-05 | Illumina Human Methylation 27 | (TODO) -- GDC | methylation__HM27 |
| TCGA-E2-A15M-11A-22D-A12E-05 | Illumina Human Methylation 27 | (TODO) -- GDC | methylation__HM27 |
| TCGA-E2-A1B5-11A-23D-A12R-05 | Illumina Human Methylation 450 | (TODO) -- GDC | methylation__HM450 |
| TCGA-E2-A1BC-11A-32D-A12R-05 | Illumina Human Methylation 450 | (TODO) -- GDC | methylation__HM450 |
| TCGA-E2-A1IF-11A-22D-A145-05 | Illumina Human Methylation 450 | (TODO) -- GDC | methylation__HM450 |
| TCGA-E2-A1II-11A-21D-A145-05 | Illumina Human Methylation 450 | (TODO) -- GDC | methylation__HM450 |
| TCGA-E2-A1IO-11A-21D-A145-05 | Illumina Human Methylation 450 | (TODO) -- GDC | methylation__HM450 |
| TCGA-E2-A1L7-11A-33D-A145-05 | Illumina Human Methylation 450 | (TODO) -- GDC | methylation__HM450 |
| TCGA-E2-A1LB-11A-22D-A145-05 | Illumina Human Methylation 450 | (TODO) -- GDC | methylation__HM450 |
| TCGA-E2-A1LI-11A-23D-A161-05 | Illumina Human Methylation 450 | (TODO) -- GDC | methylation__HM450 |
| TCGA-E2-A1LS-11A-32D-A161-05 | Illumina Human Methylation 450 | (TODO) -- GDC | methylation__HM450 |
| TCGA-E9-A1N4-11A-33D-A14N-05 | Illumina Human Methylation 450 | (TODO) -- GDC | methylation__HM450 |
| TCGA-E9-A1N5-11A-41D-A14H-05 | Illumina Human Methylation 450 | (TODO) -- GDC | methylation__HM450 |
| TCGA-E9-A1N6-11A-32D-A145-05 | Illumina Human Methylation 450 | (TODO) -- GDC | methylation__HM450 |
| TCGA-E9-A1N8-11A-42D-A145-05 | Illumina Human Methylation 450 | (TODO) -- GDC | methylation__HM450 |
| TCGA-E9-A1NA-11A-33D-A145-05 | Illumina Human Methylation 450 | (TODO) -- GDC | methylation__HM450 |
| TCGA-E9-A1ND-11A-43D-A145-05 | Illumina Human Methylation 450 | (TODO) -- GDC | methylation__HM450 |
| TCGA-E9-A1NE-11A-43D-A14N-05 | Illumina Human Methylation 450 | (TODO) -- GDC | methylation__HM450 |
| TCGA-E9-A1NF-11A-73D-A14H-05 | Illumina Human Methylation 450 | (TODO) -- GDC | methylation__HM450 |
| TCGA-E9-A1NG-11A-52D-A14N-05 | Illumina Human Methylation 450 | (TODO) -- GDC | methylation__HM450 |
| TCGA-E9-A1R7-11A-42D-A14N-05 | Illumina Human Methylation 450 | (TODO) -- GDC | methylation__HM450 |
| TCGA-E9-A1RB-11A-33D-A161-05 | Illumina Human Methylation 450 | (TODO) -- GDC | methylation__HM450 |
| TCGA-E9-A1RC-11A-33D-A161-05 | Illumina Human Methylation 450 | (TODO) -- GDC | methylation__HM450 |
| TCGA-E9-A1RD-11A-33D-A161-05 | Illumina Human Methylation 450 | (TODO) -- GDC | methylation__HM450 |
| TCGA-E9-A1RF-11A-32D-A161-05 | Illumina Human Methylation 450 | (TODO) -- GDC | methylation__HM450 |
| TCGA-E9-A1RH-11A-34D-A16A-05 | Illumina Human Methylation 450 | (TODO) -- GDC | methylation__HM450 |
| TCGA-E9-A1RI-11A-41D-A16A-05 | Illumina Human Methylation 450 | (TODO) -- GDC | methylation__HM450 |
Table S17.
| TCGA Barcode | Platform | Center | Annotation |
|---|---|---|---|
| TCGA-A7-A0DB | (TODO) -- GDC | clinical__biospecimen | |
| TCGA-A7-A0DC | (TODO) -- GDC | clinical__biospecimen | |
| TCGA-A7-A13D | (TODO) -- GDC | clinical__biospecimen | |
| TCGA-A7-A13E | (TODO) -- GDC | clinical__biospecimen | |
| TCGA-A7-A13G | (TODO) -- GDC | clinical__biospecimen | |
| TCGA-A7-A26E | (TODO) -- GDC | clinical__biospecimen | |
| TCGA-A7-A26F | (TODO) -- GDC | clinical__biospecimen | |
| TCGA-A7-A26I | (TODO) -- GDC | clinical__biospecimen | |
| TCGA-A7-A26J | (TODO) -- GDC | clinical__biospecimen | |
| TCGA-AC-A2QH | (TODO) -- GDC | clinical__biospecimen | |
| TCGA-AC-A3OD | (TODO) -- GDC | clinical__biospecimen | |
| TCGA-AC-A3QQ | (TODO) -- GDC | clinical__biospecimen | |
| TCGA-PL-A8LV | (TODO) -- GDC | clinical__biospecimen | |
| TCGA-PL-A8LX | (TODO) -- GDC | clinical__biospecimen | |
| TCGA-PL-A8LY | (TODO) -- GDC | clinical__biospecimen | |
| TCGA-PL-A8LZ | (TODO) -- GDC | clinical__biospecimen |
Table S18.
| TCGA Barcode | Platform | Center | Annotation |
|---|---|---|---|
| TCGA-A7-A0DB | (TODO) -- GDC | clinical__primary | |
| TCGA-A7-A0DC | (TODO) -- GDC | clinical__primary | |
| TCGA-A7-A13D | (TODO) -- GDC | clinical__primary | |
| TCGA-A7-A13E | (TODO) -- GDC | clinical__primary | |
| TCGA-A7-A13G | (TODO) -- GDC | clinical__primary | |
| TCGA-A7-A26E | (TODO) -- GDC | clinical__primary | |
| TCGA-A7-A26F | (TODO) -- GDC | clinical__primary | |
| TCGA-A7-A26I | (TODO) -- GDC | clinical__primary | |
| TCGA-A7-A26J | (TODO) -- GDC | clinical__primary | |
| TCGA-AC-A2QH | (TODO) -- GDC | clinical__primary | |
| TCGA-AC-A3OD | (TODO) -- GDC | clinical__primary | |
| TCGA-AC-A3QQ | (TODO) -- GDC | clinical__primary | |
| TCGA-PL-A8LV | (TODO) -- GDC | clinical__primary | |
| TCGA-PL-A8LX | (TODO) -- GDC | clinical__primary | |
| TCGA-PL-A8LY | (TODO) -- GDC | clinical__primary | |
| TCGA-PL-A8LZ | (TODO) -- GDC | clinical__primary |
Table S19.
| TCGA Barcode | Platform | Center | Annotation |
|---|---|---|---|
| TCGA-A7-A0DC-01B-04D-A22Q-01 | Affymetrix SNP 6.0 | (TODO) -- GDC | CNV__unfiltered__snp6 |
| TCGA-A7-A0DC-01B-04D-A22Q-01 | Affymetrix SNP 6.0 | (TODO) -- GDC | CNV__snp6 |
| TCGA-A7-A13G-01B-04D-A22Q-01 | Affymetrix SNP 6.0 | (TODO) -- GDC | CNV__unfiltered__snp6 |
| TCGA-A7-A13G-01B-04D-A22Q-01 | Affymetrix SNP 6.0 | (TODO) -- GDC | CNV__snp6 |
| TCGA-A7-A26E-01B-06D-A275-01 | Affymetrix SNP 6.0 | (TODO) -- GDC | CNV__unfiltered__snp6 |
| TCGA-A7-A26E-01B-06D-A275-01 | Affymetrix SNP 6.0 | (TODO) -- GDC | CNV__snp6 |
| TCGA-A7-A26F-01B-04D-A22Q-01 | Affymetrix SNP 6.0 | (TODO) -- GDC | CNV__unfiltered__snp6 |
| TCGA-A7-A26F-01B-04D-A22Q-01 | Affymetrix SNP 6.0 | (TODO) -- GDC | CNV__snp6 |
| TCGA-A7-A26J-01B-02D-A275-01 | Affymetrix SNP 6.0 | (TODO) -- GDC | CNV__unfiltered__snp6 |
| TCGA-A7-A26J-01B-02D-A275-01 | Affymetrix SNP 6.0 | (TODO) -- GDC | CNV__snp6 |
| TCGA-AC-A2QH-01B-04D-A22Q-01 | Affymetrix SNP 6.0 | (TODO) -- GDC | CNV__unfiltered__snp6 |
| TCGA-AC-A2QH-01B-04D-A22Q-01 | Affymetrix SNP 6.0 | (TODO) -- GDC | CNV__snp6 |
| TCGA-AC-A3OD-01B-06D-A22Q-01 | Affymetrix SNP 6.0 | (TODO) -- GDC | CNV__unfiltered__snp6 |
| TCGA-AC-A3OD-01B-06D-A22Q-01 | Affymetrix SNP 6.0 | (TODO) -- GDC | CNV__snp6 |
| TCGA-PL-A8LV-01A-21D-A41E-01 | Affymetrix SNP 6.0 | (TODO) -- GDC | CNV__unfiltered__snp6 |
| TCGA-PL-A8LV-01A-21D-A41E-01 | Affymetrix SNP 6.0 | (TODO) -- GDC | CNV__snp6 |
| TCGA-PL-A8LX-01A-11D-A41E-01 | Affymetrix SNP 6.0 | (TODO) -- GDC | CNV__unfiltered__snp6 |
| TCGA-PL-A8LX-01A-11D-A41E-01 | Affymetrix SNP 6.0 | (TODO) -- GDC | CNV__snp6 |
| TCGA-PL-A8LY-01A-11D-A41E-01 | Affymetrix SNP 6.0 | (TODO) -- GDC | CNV__unfiltered__snp6 |
| TCGA-PL-A8LY-01A-11D-A41E-01 | Affymetrix SNP 6.0 | (TODO) -- GDC | CNV__snp6 |
| TCGA-PL-A8LZ-01A-31D-A36I-01 | Affymetrix SNP 6.0 | (TODO) -- GDC | CNV__unfiltered__snp6 |
| TCGA-PL-A8LZ-01A-31D-A36I-01 | Affymetrix SNP 6.0 | (TODO) -- GDC | CNV__snp6 |
Table S20.
| TCGA Barcode | Platform | Center | Annotation |
|---|---|---|---|
| TCGA-A7-A0DB-01C-02R-A277-07 | (TODO) -- GDC | mRNA__geneExpNormed__FPKM | |
| TCGA-A7-A0DB-01C-02R-A277-07 | (TODO) -- GDC | mRNA__geneExp__FPKM | |
| TCGA-A7-A0DB-01C-02R-A277-07 | (TODO) -- GDC | mRNA__counts__FPKM | |
| TCGA-A7-A0DC-01B-04R-A22O-07 | (TODO) -- GDC | mRNA__geneExpNormed__FPKM | |
| TCGA-A7-A0DC-01B-04R-A22O-07 | (TODO) -- GDC | mRNA__geneExp__FPKM | |
| TCGA-A7-A0DC-01B-04R-A22O-07 | (TODO) -- GDC | mRNA__counts__FPKM | |
| TCGA-A7-A13D-01B-04R-A277-07 | (TODO) -- GDC | mRNA__geneExpNormed__FPKM | |
| TCGA-A7-A13D-01B-04R-A277-07 | (TODO) -- GDC | mRNA__geneExp__FPKM | |
| TCGA-A7-A13D-01B-04R-A277-07 | (TODO) -- GDC | mRNA__counts__FPKM | |
| TCGA-A7-A13E-01B-06R-A277-07 | (TODO) -- GDC | mRNA__geneExpNormed__FPKM | |
| TCGA-A7-A13E-01B-06R-A277-07 | (TODO) -- GDC | mRNA__geneExp__FPKM | |
| TCGA-A7-A13E-01B-06R-A277-07 | (TODO) -- GDC | mRNA__counts__FPKM | |
| TCGA-A7-A13G-01B-04R-A22O-07 | (TODO) -- GDC | mRNA__geneExpNormed__FPKM | |
| TCGA-A7-A13G-01B-04R-A22O-07 | (TODO) -- GDC | mRNA__geneExp__FPKM | |
| TCGA-A7-A13G-01B-04R-A22O-07 | (TODO) -- GDC | mRNA__counts__FPKM | |
| TCGA-A7-A26E-01B-06R-A277-07 | (TODO) -- GDC | mRNA__geneExpNormed__FPKM | |
| TCGA-A7-A26E-01B-06R-A277-07 | (TODO) -- GDC | mRNA__geneExp__FPKM | |
| TCGA-A7-A26E-01B-06R-A277-07 | (TODO) -- GDC | mRNA__counts__FPKM | |
| TCGA-A7-A26F-01B-04R-A22O-07 | (TODO) -- GDC | mRNA__geneExpNormed__FPKM | |
| TCGA-A7-A26F-01B-04R-A22O-07 | (TODO) -- GDC | mRNA__geneExp__FPKM | |
| TCGA-A7-A26F-01B-04R-A22O-07 | (TODO) -- GDC | mRNA__counts__FPKM | |
| TCGA-A7-A26I-01B-06R-A22O-07 | (TODO) -- GDC | mRNA__geneExpNormed__FPKM | |
| TCGA-A7-A26I-01B-06R-A22O-07 | (TODO) -- GDC | mRNA__geneExp__FPKM | |
| TCGA-A7-A26I-01B-06R-A22O-07 | (TODO) -- GDC | mRNA__counts__FPKM | |
| TCGA-A7-A26J-01B-02R-A277-07 | (TODO) -- GDC | mRNA__geneExpNormed__FPKM | |
| TCGA-A7-A26J-01B-02R-A277-07 | (TODO) -- GDC | mRNA__geneExp__FPKM | |
| TCGA-A7-A26J-01B-02R-A277-07 | (TODO) -- GDC | mRNA__counts__FPKM | |
| TCGA-AC-A2QH-01B-04R-A22O-07 | (TODO) -- GDC | mRNA__geneExpNormed__FPKM | |
| TCGA-AC-A2QH-01B-04R-A22O-07 | (TODO) -- GDC | mRNA__geneExp__FPKM | |
| TCGA-AC-A2QH-01B-04R-A22O-07 | (TODO) -- GDC | mRNA__counts__FPKM | |
| TCGA-AC-A3OD-01B-06R-A22O-07 | (TODO) -- GDC | mRNA__geneExpNormed__FPKM | |
| TCGA-AC-A3OD-01B-06R-A22O-07 | (TODO) -- GDC | mRNA__geneExp__FPKM | |
| TCGA-AC-A3OD-01B-06R-A22O-07 | (TODO) -- GDC | mRNA__counts__FPKM | |
| TCGA-AC-A3QQ-01B-06R-A22O-07 | (TODO) -- GDC | mRNA__geneExpNormed__FPKM | |
| TCGA-AC-A3QQ-01B-06R-A22O-07 | (TODO) -- GDC | mRNA__geneExp__FPKM | |
| TCGA-AC-A3QQ-01B-06R-A22O-07 | (TODO) -- GDC | mRNA__counts__FPKM | |
| TCGA-PL-A8LV-01A-21R-A41B-07 | (TODO) -- GDC | mRNA__geneExpNormed__FPKM | |
| TCGA-PL-A8LV-01A-21R-A41B-07 | (TODO) -- GDC | mRNA__geneExp__FPKM | |
| TCGA-PL-A8LV-01A-21R-A41B-07 | (TODO) -- GDC | mRNA__counts__FPKM | |
| TCGA-PL-A8LX-01A-11R-A41B-07 | (TODO) -- GDC | mRNA__geneExpNormed__FPKM | |
| TCGA-PL-A8LX-01A-11R-A41B-07 | (TODO) -- GDC | mRNA__geneExp__FPKM | |
| TCGA-PL-A8LX-01A-11R-A41B-07 | (TODO) -- GDC | mRNA__counts__FPKM | |
| TCGA-PL-A8LY-01A-11R-A41B-07 | (TODO) -- GDC | mRNA__geneExpNormed__FPKM | |
| TCGA-PL-A8LY-01A-11R-A41B-07 | (TODO) -- GDC | mRNA__geneExp__FPKM | |
| TCGA-PL-A8LY-01A-11R-A41B-07 | (TODO) -- GDC | mRNA__counts__FPKM | |
| TCGA-PL-A8LZ-01A-31R-A36F-07 | (TODO) -- GDC | mRNA__geneExpNormed__FPKM | |
| TCGA-PL-A8LZ-01A-31R-A36F-07 | (TODO) -- GDC | mRNA__geneExp__FPKM | |
| TCGA-PL-A8LZ-01A-31R-A36F-07 | (TODO) -- GDC | mRNA__counts__FPKM |
Table S21.
| TCGA Barcode | Platform | Center | Annotation |
|---|---|---|---|
| TCGA-A7-A0DB-01C-02R-A27D-13 | (TODO) -- GDC | miR__geneExp | |
| TCGA-A7-A0DB-01C-02R-A27D-13 | (TODO) -- GDC | miR__isoformExp | |
| TCGA-A7-A0DC-01B-04R-A22P-13 | (TODO) -- GDC | miR__geneExp | |
| TCGA-A7-A0DC-01B-04R-A22P-13 | (TODO) -- GDC | miR__isoformExp | |
| TCGA-A7-A13D-01B-04R-A27D-13 | (TODO) -- GDC | miR__geneExp | |
| TCGA-A7-A13D-01B-04R-A27D-13 | (TODO) -- GDC | miR__isoformExp | |
| TCGA-A7-A13E-01B-06R-A27D-13 | (TODO) -- GDC | miR__geneExp | |
| TCGA-A7-A13E-01B-06R-A27D-13 | (TODO) -- GDC | miR__isoformExp | |
| TCGA-A7-A13G-01B-04R-A22P-13 | (TODO) -- GDC | miR__geneExp | |
| TCGA-A7-A13G-01B-04R-A22P-13 | (TODO) -- GDC | miR__isoformExp | |
| TCGA-A7-A26E-01B-06R-A27D-13 | (TODO) -- GDC | miR__geneExp | |
| TCGA-A7-A26E-01B-06R-A27D-13 | (TODO) -- GDC | miR__isoformExp | |
| TCGA-A7-A26F-01B-04R-A22P-13 | (TODO) -- GDC | miR__geneExp | |
| TCGA-A7-A26F-01B-04R-A22P-13 | (TODO) -- GDC | miR__isoformExp | |
| TCGA-A7-A26I-01B-06R-A22P-13 | (TODO) -- GDC | miR__geneExp | |
| TCGA-A7-A26I-01B-06R-A22P-13 | (TODO) -- GDC | miR__isoformExp | |
| TCGA-A7-A26J-01B-02R-A27D-13 | (TODO) -- GDC | miR__geneExp | |
| TCGA-A7-A26J-01B-02R-A27D-13 | (TODO) -- GDC | miR__isoformExp | |
| TCGA-AC-A2QH-01B-04R-A22P-13 | (TODO) -- GDC | miR__geneExp | |
| TCGA-AC-A2QH-01B-04R-A22P-13 | (TODO) -- GDC | miR__isoformExp | |
| TCGA-AC-A3OD-01B-06R-A22P-13 | (TODO) -- GDC | miR__geneExp | |
| TCGA-AC-A3OD-01B-06R-A22P-13 | (TODO) -- GDC | miR__isoformExp | |
| TCGA-AC-A3QQ-01B-06R-A22P-13 | (TODO) -- GDC | miR__geneExp | |
| TCGA-AC-A3QQ-01B-06R-A22P-13 | (TODO) -- GDC | miR__isoformExp | |
| TCGA-PL-A8LV-01A-21R-A41G-13 | (TODO) -- GDC | miR__geneExp | |
| TCGA-PL-A8LV-01A-21R-A41G-13 | (TODO) -- GDC | miR__isoformExp | |
| TCGA-PL-A8LX-01A-11R-A41G-13 | (TODO) -- GDC | miR__geneExp | |
| TCGA-PL-A8LX-01A-11R-A41G-13 | (TODO) -- GDC | miR__isoformExp | |
| TCGA-PL-A8LY-01A-11R-A41G-13 | (TODO) -- GDC | miR__geneExp | |
| TCGA-PL-A8LY-01A-11R-A41G-13 | (TODO) -- GDC | miR__isoformExp | |
| TCGA-PL-A8LZ-01A-31R-A36A-13 | (TODO) -- GDC | miR__geneExp | |
| TCGA-PL-A8LZ-01A-31R-A36A-13 | (TODO) -- GDC | miR__isoformExp |
Table S22.
| TCGA Barcode | Platform | Center | Annotation |
|---|---|---|---|
| TCGA-A7-A0DB-01C-02D-A272-09 | (TODO) -- GDC | SNV__mutect | |
| TCGA-A7-A13D-01B-04D-A272-09 | (TODO) -- GDC | SNV__mutect | |
| TCGA-A7-A13E-01B-06D-A272-09 | (TODO) -- GDC | SNV__mutect | |
| TCGA-A7-A13G-01B-04D-A22N-09 | (TODO) -- GDC | SNV__mutect | |
| TCGA-A7-A26E-01B-06D-A272-09 | (TODO) -- GDC | SNV__mutect | |
| TCGA-A7-A26F-01B-04D-A22N-09 | (TODO) -- GDC | SNV__mutect | |
| TCGA-A7-A26I-01B-06D-A22N-09 | (TODO) -- GDC | SNV__mutect | |
| TCGA-A7-A26J-01B-02D-A272-09 | (TODO) -- GDC | SNV__mutect | |
| TCGA-AC-A2QH-01B-04D-A22N-09 | (TODO) -- GDC | SNV__mutect | |
| TCGA-AC-A3OD-01B-06D-A22N-09 | (TODO) -- GDC | SNV__mutect | |
| TCGA-AC-A3QQ-01B-06D-A22N-09 | (TODO) -- GDC | SNV__mutect | |
| TCGA-PL-A8LV-01A-21D-A41F-09 | (TODO) -- GDC | SNV__mutect | |
| TCGA-PL-A8LX-01A-11D-A41F-09 | (TODO) -- GDC | SNV__mutect | |
| TCGA-PL-A8LY-01A-11D-A41F-09 | (TODO) -- GDC | SNV__mutect | |
| TCGA-PL-A8LZ-01A-31D-A36J-09 | (TODO) -- GDC | SNV__mutect |
Table S23.
| TCGA Barcode | Platform | Center | Annotation |
|---|---|---|---|
| TCGA-A7-A13G-01B-04D-A22R-05 | Illumina Human Methylation 450 | (TODO) -- GDC | methylation__HM450 |
| TCGA-A7-A26E-01B-06D-A27B-05 | Illumina Human Methylation 450 | (TODO) -- GDC | methylation__HM450 |
| TCGA-A7-A26F-01B-04D-A22R-05 | Illumina Human Methylation 450 | (TODO) -- GDC | methylation__HM450 |
| TCGA-A7-A26J-01B-02D-A27B-05 | Illumina Human Methylation 450 | (TODO) -- GDC | methylation__HM450 |
| TCGA-AC-A2QH-01B-04D-A22R-05 | Illumina Human Methylation 450 | (TODO) -- GDC | methylation__HM450 |
| TCGA-AC-A3OD-01B-06D-A22R-05 | Illumina Human Methylation 450 | (TODO) -- GDC | methylation__HM450 |
| TCGA-PL-A8LV-01A-21D-A41Q-05 | Illumina Human Methylation 450 | (TODO) -- GDC | methylation__HM450 |
| TCGA-PL-A8LX-01A-11D-A41Q-05 | Illumina Human Methylation 450 | (TODO) -- GDC | methylation__HM450 |
| TCGA-PL-A8LY-01A-11D-A41Q-05 | Illumina Human Methylation 450 | (TODO) -- GDC | methylation__HM450 |
| TCGA-PL-A8LZ-01A-31D-A36K-05 | Illumina Human Methylation 450 | (TODO) -- GDC | methylation__HM450 |
Table S24.
| TCGA Barcode | Platform | Center | Annotation |
|---|---|---|---|
| TCGA-3C-AAAU | (TODO) -- GDC | clinical__biospecimen | |
| TCGA-3C-AALI | (TODO) -- GDC | clinical__biospecimen | |
| TCGA-3C-AALJ | (TODO) -- GDC | clinical__biospecimen | |
| TCGA-3C-AALK | (TODO) -- GDC | clinical__biospecimen | |
| TCGA-4H-AAAK | (TODO) -- GDC | clinical__biospecimen | |
| TCGA-5L-AAT0 | (TODO) -- GDC | clinical__biospecimen | |
| TCGA-5L-AAT1 | (TODO) -- GDC | clinical__biospecimen | |
| TCGA-5T-A9QA | (TODO) -- GDC | clinical__biospecimen | |
| TCGA-A1-A0SB | (TODO) -- GDC | clinical__biospecimen | |
| TCGA-A1-A0SD | (TODO) -- GDC | clinical__biospecimen | |
| TCGA-A1-A0SE | (TODO) -- GDC | clinical__biospecimen | |
| TCGA-A1-A0SF | (TODO) -- GDC | clinical__biospecimen | |
| TCGA-A1-A0SG | (TODO) -- GDC | clinical__biospecimen | |
| TCGA-A1-A0SH | (TODO) -- GDC | clinical__biospecimen | |
| TCGA-A1-A0SI | (TODO) -- GDC | clinical__biospecimen | |
| TCGA-A1-A0SJ | (TODO) -- GDC | clinical__biospecimen | |
| TCGA-A1-A0SK | (TODO) -- GDC | clinical__biospecimen | |
| TCGA-A1-A0SM | (TODO) -- GDC | clinical__biospecimen | |
| TCGA-A1-A0SN | (TODO) -- GDC | clinical__biospecimen | |
| TCGA-A1-A0SO | (TODO) -- GDC | clinical__biospecimen | |
| TCGA-A1-A0SP | (TODO) -- GDC | clinical__biospecimen | |
| TCGA-A1-A0SQ | (TODO) -- GDC | clinical__biospecimen | |
| TCGA-A2-A04N | (TODO) -- GDC | clinical__biospecimen | |
| TCGA-A2-A04P | (TODO) -- GDC | clinical__biospecimen | |
| TCGA-A2-A04Q | (TODO) -- GDC | clinical__biospecimen | |
| TCGA-A2-A04R | (TODO) -- GDC | clinical__biospecimen | |
| TCGA-A2-A04T | (TODO) -- GDC | clinical__biospecimen | |
| TCGA-A2-A04U | (TODO) -- GDC | clinical__biospecimen | |
| TCGA-A2-A04V | (TODO) -- GDC | clinical__biospecimen | |
| TCGA-A2-A04W | (TODO) -- GDC | clinical__biospecimen | |
| TCGA-A2-A04X | (TODO) -- GDC | clinical__biospecimen | |
| TCGA-A2-A04Y | (TODO) -- GDC | clinical__biospecimen | |
| TCGA-A2-A0CK | (TODO) -- GDC | clinical__biospecimen | |
| TCGA-A2-A0CL | (TODO) -- GDC | clinical__biospecimen | |
| TCGA-A2-A0CM | (TODO) -- GDC | clinical__biospecimen | |
| TCGA-A2-A0CO | (TODO) -- GDC | clinical__biospecimen | |
| TCGA-A2-A0CP | (TODO) -- GDC | clinical__biospecimen | |
| TCGA-A2-A0CQ | (TODO) -- GDC | clinical__biospecimen | |
| TCGA-A2-A0CR | (TODO) -- GDC | clinical__biospecimen | |
| TCGA-A2-A0CS | (TODO) -- GDC | clinical__biospecimen | |
| TCGA-A2-A0CT | (TODO) -- GDC | clinical__biospecimen | |
| TCGA-A2-A0CU | (TODO) -- GDC | clinical__biospecimen | |
| TCGA-A2-A0CV | (TODO) -- GDC | clinical__biospecimen | |
| TCGA-A2-A0CW | (TODO) -- GDC | clinical__biospecimen | |
| TCGA-A2-A0CX | (TODO) -- GDC | clinical__biospecimen | |
| TCGA-A2-A0CY | (TODO) -- GDC | clinical__biospecimen | |
| TCGA-A2-A0CZ | (TODO) -- GDC | clinical__biospecimen | |
| TCGA-A2-A0D0 | (TODO) -- GDC | clinical__biospecimen | |
| TCGA-A2-A0D1 | (TODO) -- GDC | clinical__biospecimen | |
| TCGA-A2-A0D2 | (TODO) -- GDC | clinical__biospecimen | |
| TCGA-A2-A0D3 | (TODO) -- GDC | clinical__biospecimen | |
| TCGA-A2-A0D4 | (TODO) -- GDC | clinical__biospecimen | |
| TCGA-A2-A0EM | (TODO) -- GDC | clinical__biospecimen | |
| TCGA-A2-A0EN | (TODO) -- GDC | clinical__biospecimen | |
| TCGA-A2-A0EO | (TODO) -- GDC | clinical__biospecimen | |
| TCGA-A2-A0EP | (TODO) -- GDC | clinical__biospecimen | |
| TCGA-A2-A0EQ | (TODO) -- GDC | clinical__biospecimen | |
| TCGA-A2-A0ER | (TODO) -- GDC | clinical__biospecimen | |
| TCGA-A2-A0ES | (TODO) -- GDC | clinical__biospecimen | |
| TCGA-A2-A0ET | (TODO) -- GDC | clinical__biospecimen | |
| TCGA-A2-A0EU | (TODO) -- GDC | clinical__biospecimen | |
| TCGA-A2-A0EV | (TODO) -- GDC | clinical__biospecimen | |
| TCGA-A2-A0EW | (TODO) -- GDC | clinical__biospecimen | |
| TCGA-A2-A0EX | (TODO) -- GDC | clinical__biospecimen | |
| TCGA-A2-A0EY | (TODO) -- GDC | clinical__biospecimen | |
| TCGA-A2-A0ST | (TODO) -- GDC | clinical__biospecimen | |
| TCGA-A2-A0SU | (TODO) -- GDC | clinical__biospecimen | |
| TCGA-A2-A0SV | (TODO) -- GDC | clinical__biospecimen | |
| TCGA-A2-A0SW | (TODO) -- GDC | clinical__biospecimen | |
| TCGA-A2-A0SX | (TODO) -- GDC | clinical__biospecimen | |
| TCGA-A2-A0SY | (TODO) -- GDC | clinical__biospecimen | |
| TCGA-A2-A0T0 | (TODO) -- GDC | clinical__biospecimen | |
| TCGA-A2-A0T1 | (TODO) -- GDC | clinical__biospecimen | |
| TCGA-A2-A0T2 | (TODO) -- GDC | clinical__biospecimen | |
| TCGA-A2-A0T3 | (TODO) -- GDC | clinical__biospecimen | |
| TCGA-A2-A0T4 | (TODO) -- GDC | clinical__biospecimen | |
| TCGA-A2-A0T5 | (TODO) -- GDC | clinical__biospecimen | |
| TCGA-A2-A0T6 | (TODO) -- GDC | clinical__biospecimen | |
| TCGA-A2-A0T7 | (TODO) -- GDC | clinical__biospecimen | |
| TCGA-A2-A0YC | (TODO) -- GDC | clinical__biospecimen | |
| TCGA-A2-A0YD | (TODO) -- GDC | clinical__biospecimen | |
| TCGA-A2-A0YE | (TODO) -- GDC | clinical__biospecimen | |
| TCGA-A2-A0YF | (TODO) -- GDC | clinical__biospecimen | |
| TCGA-A2-A0YG | (TODO) -- GDC | clinical__biospecimen | |
| TCGA-A2-A0YH | (TODO) -- GDC | clinical__biospecimen | |
| TCGA-A2-A0YI | (TODO) -- GDC | clinical__biospecimen | |
| TCGA-A2-A0YJ | (TODO) -- GDC | clinical__biospecimen | |
| TCGA-A2-A0YK | (TODO) -- GDC | clinical__biospecimen | |
| TCGA-A2-A0YL | (TODO) -- GDC | clinical__biospecimen | |
| TCGA-A2-A0YM | (TODO) -- GDC | clinical__biospecimen | |
| TCGA-A2-A0YT | (TODO) -- GDC | clinical__biospecimen | |
| TCGA-A2-A1FV | (TODO) -- GDC | clinical__biospecimen | |
| TCGA-A2-A1FW | (TODO) -- GDC | clinical__biospecimen | |
| TCGA-A2-A1FX | (TODO) -- GDC | clinical__biospecimen | |
| TCGA-A2-A1FZ | (TODO) -- GDC | clinical__biospecimen | |
| TCGA-A2-A1G0 | (TODO) -- GDC | clinical__biospecimen | |
| TCGA-A2-A1G1 | (TODO) -- GDC | clinical__biospecimen | |
| TCGA-A2-A1G4 | (TODO) -- GDC | clinical__biospecimen | |
| TCGA-A2-A1G6 | (TODO) -- GDC | clinical__biospecimen | |
| TCGA-A2-A259 | (TODO) -- GDC | clinical__biospecimen | |
| TCGA-A2-A25A | (TODO) -- GDC | clinical__biospecimen | |
| TCGA-A2-A25B | (TODO) -- GDC | clinical__biospecimen | |
| TCGA-A2-A25C | (TODO) -- GDC | clinical__biospecimen | |
| TCGA-A2-A25D | (TODO) -- GDC | clinical__biospecimen | |
| TCGA-A2-A25E | (TODO) -- GDC | clinical__biospecimen | |
| TCGA-A2-A25F | (TODO) -- GDC | clinical__biospecimen | |
| TCGA-A2-A3KC | (TODO) -- GDC | clinical__biospecimen | |
| TCGA-A2-A3KD | (TODO) -- GDC | clinical__biospecimen | |
| TCGA-A2-A3XS | (TODO) -- GDC | clinical__biospecimen | |
| TCGA-A2-A3XT | (TODO) -- GDC | clinical__biospecimen | |
| TCGA-A2-A3XU | (TODO) -- GDC | clinical__biospecimen | |
| TCGA-A2-A3XV | (TODO) -- GDC | clinical__biospecimen | |
| TCGA-A2-A3XW | (TODO) -- GDC | clinical__biospecimen | |
| TCGA-A2-A3XX | (TODO) -- GDC | clinical__biospecimen | |
| TCGA-A2-A3XY | (TODO) -- GDC | clinical__biospecimen | |
| TCGA-A2-A3XZ | (TODO) -- GDC | clinical__biospecimen | |
| TCGA-A2-A3Y0 | (TODO) -- GDC | clinical__biospecimen | |
| TCGA-A2-A4RW | (TODO) -- GDC | clinical__biospecimen | |
| TCGA-A2-A4RX | (TODO) -- GDC | clinical__biospecimen | |
| TCGA-A2-A4RY | (TODO) -- GDC | clinical__biospecimen | |
| TCGA-A2-A4S0 | (TODO) -- GDC | clinical__biospecimen | |
| TCGA-A2-A4S1 | (TODO) -- GDC | clinical__biospecimen | |
| TCGA-A2-A4S2 | (TODO) -- GDC | clinical__biospecimen | |
| TCGA-A2-A4S3 | (TODO) -- GDC | clinical__biospecimen | |
| TCGA-A7-A0CD | (TODO) -- GDC | clinical__biospecimen | |
| TCGA-A7-A0CE | (TODO) -- GDC | clinical__biospecimen | |
| TCGA-A7-A0CG | (TODO) -- GDC | clinical__biospecimen | |
| TCGA-A7-A0CH | (TODO) -- GDC | clinical__biospecimen | |
| TCGA-A7-A0CJ | (TODO) -- GDC | clinical__biospecimen | |
| TCGA-A7-A0D9 | (TODO) -- GDC | clinical__biospecimen | |
| TCGA-A7-A0DA | (TODO) -- GDC | clinical__biospecimen | |
| TCGA-A7-A0DB | (TODO) -- GDC | clinical__biospecimen | |
| TCGA-A7-A0DC | (TODO) -- GDC | clinical__biospecimen | |
| TCGA-A7-A13D | (TODO) -- GDC | clinical__biospecimen | |
| TCGA-A7-A13E | (TODO) -- GDC | clinical__biospecimen | |
| TCGA-A7-A13F | (TODO) -- GDC | clinical__biospecimen | |
| TCGA-A7-A13G | (TODO) -- GDC | clinical__biospecimen | |
| TCGA-A7-A13H | (TODO) -- GDC | clinical__biospecimen | |
| TCGA-A7-A26E | (TODO) -- GDC | clinical__biospecimen | |
| TCGA-A7-A26F | (TODO) -- GDC | clinical__biospecimen | |
| TCGA-A7-A26G | (TODO) -- GDC | clinical__biospecimen | |
| TCGA-A7-A26H | (TODO) -- GDC | clinical__biospecimen | |
| TCGA-A7-A26I | (TODO) -- GDC | clinical__biospecimen | |
| TCGA-A7-A26J | (TODO) -- GDC | clinical__biospecimen | |
| TCGA-A7-A2KD | (TODO) -- GDC | clinical__biospecimen | |
| TCGA-A7-A3IY | (TODO) -- GDC | clinical__biospecimen | |
| TCGA-A7-A3IZ | (TODO) -- GDC | clinical__biospecimen | |
| TCGA-A7-A3J0 | (TODO) -- GDC | clinical__biospecimen | |
| TCGA-A7-A3J1 | (TODO) -- GDC | clinical__biospecimen | |
| TCGA-A7-A3RF | (TODO) -- GDC | clinical__biospecimen | |
| TCGA-A7-A425 | (TODO) -- GDC | clinical__biospecimen | |
| TCGA-A7-A426 | (TODO) -- GDC | clinical__biospecimen | |
| TCGA-A7-A4SA | (TODO) -- GDC | clinical__biospecimen | |
| TCGA-A7-A4SB | (TODO) -- GDC | clinical__biospecimen | |
| TCGA-A7-A4SC | (TODO) -- GDC | clinical__biospecimen | |
| TCGA-A7-A4SD | (TODO) -- GDC | clinical__biospecimen | |
| TCGA-A7-A4SE | (TODO) -- GDC | clinical__biospecimen | |
| TCGA-A7-A4SF | (TODO) -- GDC | clinical__biospecimen | |
| TCGA-A7-A56D | (TODO) -- GDC | clinical__biospecimen | |
| TCGA-A7-A5ZV | (TODO) -- GDC | clinical__biospecimen | |
| TCGA-A7-A5ZW | (TODO) -- GDC | clinical__biospecimen | |
| TCGA-A7-A5ZX | (TODO) -- GDC | clinical__biospecimen | |
| TCGA-A7-A6VV | (TODO) -- GDC | clinical__biospecimen | |
| TCGA-A7-A6VW | (TODO) -- GDC | clinical__biospecimen | |
| TCGA-A7-A6VX | (TODO) -- GDC | clinical__biospecimen | |
| TCGA-A7-A6VY | (TODO) -- GDC | clinical__biospecimen | |
| TCGA-A8-A06N | (TODO) -- GDC | clinical__biospecimen | |
| TCGA-A8-A06O | (TODO) -- GDC | clinical__biospecimen | |
| TCGA-A8-A06P | (TODO) -- GDC | clinical__biospecimen | |
| TCGA-A8-A06Q | (TODO) -- GDC | clinical__biospecimen | |
| TCGA-A8-A06R | (TODO) -- GDC | clinical__biospecimen | |
| TCGA-A8-A06T | (TODO) -- GDC | clinical__biospecimen | |
| TCGA-A8-A06U | (TODO) -- GDC | clinical__biospecimen | |
| TCGA-A8-A06X | (TODO) -- GDC | clinical__biospecimen | |
| TCGA-A8-A06Y | (TODO) -- GDC | clinical__biospecimen | |
| TCGA-A8-A06Z | (TODO) -- GDC | clinical__biospecimen | |
| TCGA-A8-A075 | (TODO) -- GDC | clinical__biospecimen | |
| TCGA-A8-A076 | (TODO) -- GDC | clinical__biospecimen | |
| TCGA-A8-A079 | (TODO) -- GDC | clinical__biospecimen | |
| TCGA-A8-A07B | (TODO) -- GDC | clinical__biospecimen | |
| TCGA-A8-A07C | (TODO) -- GDC | clinical__biospecimen | |
| TCGA-A8-A07E | (TODO) -- GDC | clinical__biospecimen | |
| TCGA-A8-A07F | (TODO) -- GDC | clinical__biospecimen | |
| TCGA-A8-A07G | (TODO) -- GDC | clinical__biospecimen | |
| TCGA-A8-A07I | (TODO) -- GDC | clinical__biospecimen | |
| TCGA-A8-A07J | (TODO) -- GDC | clinical__biospecimen | |
| TCGA-A8-A07L | (TODO) -- GDC | clinical__biospecimen | |
| TCGA-A8-A07O | (TODO) -- GDC | clinical__biospecimen | |
| TCGA-A8-A07P | (TODO) -- GDC | clinical__biospecimen | |
| TCGA-A8-A07R | (TODO) -- GDC | clinical__biospecimen | |
| TCGA-A8-A07S | (TODO) -- GDC | clinical__biospecimen | |
| TCGA-A8-A07U | (TODO) -- GDC | clinical__biospecimen | |
| TCGA-A8-A07W | (TODO) -- GDC | clinical__biospecimen | |
| TCGA-A8-A07Z | (TODO) -- GDC | clinical__biospecimen | |
| TCGA-A8-A081 | (TODO) -- GDC | clinical__biospecimen | |
| TCGA-A8-A082 | (TODO) -- GDC | clinical__biospecimen | |
| TCGA-A8-A083 | (TODO) -- GDC | clinical__biospecimen | |
| TCGA-A8-A084 | (TODO) -- GDC | clinical__biospecimen | |
| TCGA-A8-A085 | (TODO) -- GDC | clinical__biospecimen | |
| TCGA-A8-A086 | (TODO) -- GDC | clinical__biospecimen | |
| TCGA-A8-A08A | (TODO) -- GDC | clinical__biospecimen | |
| TCGA-A8-A08B | (TODO) -- GDC | clinical__biospecimen | |
| TCGA-A8-A08C | (TODO) -- GDC | clinical__biospecimen | |
| TCGA-A8-A08F | (TODO) -- GDC | clinical__biospecimen | |
| TCGA-A8-A08G | (TODO) -- GDC | clinical__biospecimen | |
| TCGA-A8-A08H | (TODO) -- GDC | clinical__biospecimen | |
| TCGA-A8-A08I | (TODO) -- GDC | clinical__biospecimen | |
| TCGA-A8-A08J | (TODO) -- GDC | clinical__biospecimen | |
| TCGA-A8-A08L | (TODO) -- GDC | clinical__biospecimen | |
| TCGA-A8-A08O | (TODO) -- GDC | clinical__biospecimen | |
| TCGA-A8-A08P | (TODO) -- GDC | clinical__biospecimen | |
| TCGA-A8-A08R | (TODO) -- GDC | clinical__biospecimen | |
| TCGA-A8-A08S | (TODO) -- GDC | clinical__biospecimen | |
| TCGA-A8-A08T | (TODO) -- GDC | clinical__biospecimen | |
| TCGA-A8-A08X | (TODO) -- GDC | clinical__biospecimen | |
| TCGA-A8-A08Z | (TODO) -- GDC | clinical__biospecimen | |
| TCGA-A8-A090 | (TODO) -- GDC | clinical__biospecimen | |
| TCGA-A8-A091 | (TODO) -- GDC | clinical__biospecimen | |
| TCGA-A8-A092 | (TODO) -- GDC | clinical__biospecimen | |
| TCGA-A8-A093 | (TODO) -- GDC | clinical__biospecimen | |
| TCGA-A8-A094 | (TODO) -- GDC | clinical__biospecimen | |
| TCGA-A8-A095 | (TODO) -- GDC | clinical__biospecimen | |
| TCGA-A8-A096 | (TODO) -- GDC | clinical__biospecimen | |
| TCGA-A8-A097 | (TODO) -- GDC | clinical__biospecimen | |
| TCGA-A8-A099 | (TODO) -- GDC | clinical__biospecimen | |
| TCGA-A8-A09A | (TODO) -- GDC | clinical__biospecimen | |
| TCGA-A8-A09B | (TODO) -- GDC | clinical__biospecimen | |
| TCGA-A8-A09C | (TODO) -- GDC | clinical__biospecimen | |
| TCGA-A8-A09D | (TODO) -- GDC | clinical__biospecimen | |
| TCGA-A8-A09E | (TODO) -- GDC | clinical__biospecimen | |
| TCGA-A8-A09G | (TODO) -- GDC | clinical__biospecimen | |
| TCGA-A8-A09I | (TODO) -- GDC | clinical__biospecimen | |
| TCGA-A8-A09K | (TODO) -- GDC | clinical__biospecimen | |
| TCGA-A8-A09M | (TODO) -- GDC | clinical__biospecimen | |
| TCGA-A8-A09N | (TODO) -- GDC | clinical__biospecimen | |
| TCGA-A8-A09Q | (TODO) -- GDC | clinical__biospecimen | |
| TCGA-A8-A09R | (TODO) -- GDC | clinical__biospecimen | |
| TCGA-A8-A09T | (TODO) -- GDC | clinical__biospecimen | |
| TCGA-A8-A09V | (TODO) -- GDC | clinical__biospecimen | |
| TCGA-A8-A09W | (TODO) -- GDC | clinical__biospecimen | |
| TCGA-A8-A09X | (TODO) -- GDC | clinical__biospecimen | |
| TCGA-A8-A09Z | (TODO) -- GDC | clinical__biospecimen | |
| TCGA-A8-A0A1 | (TODO) -- GDC | clinical__biospecimen | |
| TCGA-A8-A0A2 | (TODO) -- GDC | clinical__biospecimen | |
| TCGA-A8-A0A4 | (TODO) -- GDC | clinical__biospecimen | |
| TCGA-A8-A0A6 | (TODO) -- GDC | clinical__biospecimen | |
| TCGA-A8-A0A7 | (TODO) -- GDC | clinical__biospecimen | |
| TCGA-A8-A0A9 | (TODO) -- GDC | clinical__biospecimen | |
| TCGA-A8-A0AB | (TODO) -- GDC | clinical__biospecimen | |
| TCGA-A8-A0AD | (TODO) -- GDC | clinical__biospecimen | |
| TCGA-AC-A23C | (TODO) -- GDC | clinical__biospecimen | |
| TCGA-AC-A23E | (TODO) -- GDC | clinical__biospecimen | |
| TCGA-AC-A23G | (TODO) -- GDC | clinical__biospecimen | |
| TCGA-AC-A23H | (TODO) -- GDC | clinical__biospecimen | |
| TCGA-AC-A2B8 | (TODO) -- GDC | clinical__biospecimen | |
| TCGA-AC-A2BK | (TODO) -- GDC | clinical__biospecimen | |
| TCGA-AC-A2BM | (TODO) -- GDC | clinical__biospecimen | |
| TCGA-AC-A2FB | (TODO) -- GDC | clinical__biospecimen | |
| TCGA-AC-A2FE | (TODO) -- GDC | clinical__biospecimen | |
| TCGA-AC-A2FF | (TODO) -- GDC | clinical__biospecimen | |
| TCGA-AC-A2FG | (TODO) -- GDC | clinical__biospecimen | |
| TCGA-AC-A2FK | (TODO) -- GDC | clinical__biospecimen | |
| TCGA-AC-A2FM | (TODO) -- GDC | clinical__biospecimen | |
| TCGA-AC-A2FO | (TODO) -- GDC | clinical__biospecimen | |
| TCGA-AC-A2QH | (TODO) -- GDC | clinical__biospecimen | |
| TCGA-AC-A2QI | (TODO) -- GDC | clinical__biospecimen | |
| TCGA-AC-A2QJ | (TODO) -- GDC | clinical__biospecimen | |
| TCGA-AC-A3BB | (TODO) -- GDC | clinical__biospecimen | |
| TCGA-AC-A3EH | (TODO) -- GDC | clinical__biospecimen | |
| TCGA-AC-A3HN | (TODO) -- GDC | clinical__biospecimen | |
| TCGA-AC-A3OD | (TODO) -- GDC | clinical__biospecimen | |
| TCGA-AC-A3QP | (TODO) -- GDC | clinical__biospecimen | |
| TCGA-AC-A3QQ | (TODO) -- GDC | clinical__biospecimen | |
| TCGA-AC-A3TM | (TODO) -- GDC | clinical__biospecimen | |
| TCGA-AC-A3TN | (TODO) -- GDC | clinical__biospecimen | |
| TCGA-AC-A3W5 | (TODO) -- GDC | clinical__biospecimen | |
| TCGA-AC-A3W6 | (TODO) -- GDC | clinical__biospecimen | |
| TCGA-AC-A3W7 | (TODO) -- GDC | clinical__biospecimen | |
| TCGA-AC-A3YI | (TODO) -- GDC | clinical__biospecimen | |
| TCGA-AC-A3YJ | (TODO) -- GDC | clinical__biospecimen | |
| TCGA-AC-A4ZE | (TODO) -- GDC | clinical__biospecimen | |
| TCGA-AC-A5EH | (TODO) -- GDC | clinical__biospecimen | |
| TCGA-AC-A5EI | (TODO) -- GDC | clinical__biospecimen | |
| TCGA-AC-A5XS | (TODO) -- GDC | clinical__biospecimen | |
| TCGA-AC-A5XU | (TODO) -- GDC | clinical__biospecimen | |
| TCGA-AC-A62V | (TODO) -- GDC | clinical__biospecimen | |
| TCGA-AC-A62X | (TODO) -- GDC | clinical__biospecimen | |
| TCGA-AC-A62Y | (TODO) -- GDC | clinical__biospecimen | |
| TCGA-AC-A6IV | (TODO) -- GDC | clinical__biospecimen | |
| TCGA-AC-A6IW | (TODO) -- GDC | clinical__biospecimen | |
| TCGA-AC-A6IX | (TODO) -- GDC | clinical__biospecimen | |
| TCGA-AC-A6NO | (TODO) -- GDC | clinical__biospecimen | |
| TCGA-AC-A7VB | (TODO) -- GDC | clinical__biospecimen | |
| TCGA-AC-A7VC | (TODO) -- GDC | clinical__biospecimen | |
| TCGA-AC-A8OP | (TODO) -- GDC | clinical__biospecimen | |
| TCGA-AC-A8OQ | (TODO) -- GDC | clinical__biospecimen | |
| TCGA-AC-A8OR | (TODO) -- GDC | clinical__biospecimen | |
| TCGA-AC-A8OS | (TODO) -- GDC | clinical__biospecimen | |
| TCGA-AN-A03X | (TODO) -- GDC | clinical__biospecimen | |
| TCGA-AN-A03Y | (TODO) -- GDC | clinical__biospecimen | |
| TCGA-AN-A041 | (TODO) -- GDC | clinical__biospecimen | |
| TCGA-AN-A046 | (TODO) -- GDC | clinical__biospecimen | |
| TCGA-AN-A049 | (TODO) -- GDC | clinical__biospecimen | |
| TCGA-AN-A04A | (TODO) -- GDC | clinical__biospecimen | |
| TCGA-AN-A04C | (TODO) -- GDC | clinical__biospecimen | |
| TCGA-AN-A04D | (TODO) -- GDC | clinical__biospecimen | |
| TCGA-AN-A0AJ | (TODO) -- GDC | clinical__biospecimen | |
| TCGA-AN-A0AK | (TODO) -- GDC | clinical__biospecimen | |
| TCGA-AN-A0AL | (TODO) -- GDC | clinical__biospecimen | |
| TCGA-AN-A0AM | (TODO) -- GDC | clinical__biospecimen | |
| TCGA-AN-A0AR | (TODO) -- GDC | clinical__biospecimen | |
| TCGA-AN-A0AS | (TODO) -- GDC | clinical__biospecimen | |
| TCGA-AN-A0AT | (TODO) -- GDC | clinical__biospecimen | |
| TCGA-AN-A0FD | (TODO) -- GDC | clinical__biospecimen | |
| TCGA-AN-A0FF | (TODO) -- GDC | clinical__biospecimen | |
| TCGA-AN-A0FJ | (TODO) -- GDC | clinical__biospecimen | |
| TCGA-AN-A0FK | (TODO) -- GDC | clinical__biospecimen | |
| TCGA-AN-A0FL | (TODO) -- GDC | clinical__biospecimen | |
| TCGA-AN-A0FN | (TODO) -- GDC | clinical__biospecimen | |
| TCGA-AN-A0FS | (TODO) -- GDC | clinical__biospecimen | |
| TCGA-AN-A0FT | (TODO) -- GDC | clinical__biospecimen | |
| TCGA-AN-A0FV | (TODO) -- GDC | clinical__biospecimen | |
| TCGA-AN-A0FW | (TODO) -- GDC | clinical__biospecimen | |
| TCGA-AN-A0FX | (TODO) -- GDC | clinical__biospecimen | |
| TCGA-AN-A0FY | (TODO) -- GDC | clinical__biospecimen | |
| TCGA-AN-A0FZ | (TODO) -- GDC | clinical__biospecimen | |
| TCGA-AN-A0G0 | (TODO) -- GDC | clinical__biospecimen | |
| TCGA-AN-A0XL | (TODO) -- GDC | clinical__biospecimen | |
| TCGA-AN-A0XN | (TODO) -- GDC | clinical__biospecimen | |
| TCGA-AN-A0XO | (TODO) -- GDC | clinical__biospecimen | |
| TCGA-AN-A0XP | (TODO) -- GDC | clinical__biospecimen | |
| TCGA-AN-A0XR | (TODO) -- GDC | clinical__biospecimen | |
| TCGA-AN-A0XS | (TODO) -- GDC | clinical__biospecimen | |
| TCGA-AN-A0XT | (TODO) -- GDC | clinical__biospecimen | |
| TCGA-AN-A0XU | (TODO) -- GDC | clinical__biospecimen | |
| TCGA-AN-A0XV | (TODO) -- GDC | clinical__biospecimen | |
| TCGA-AN-A0XW | (TODO) -- GDC | clinical__biospecimen | |
| TCGA-AO-A03L | (TODO) -- GDC | clinical__biospecimen | |
| TCGA-AO-A03M | (TODO) -- GDC | clinical__biospecimen | |
| TCGA-AO-A03N | (TODO) -- GDC | clinical__biospecimen | |
| TCGA-AO-A03O | (TODO) -- GDC | clinical__biospecimen | |
| TCGA-AO-A03P | (TODO) -- GDC | clinical__biospecimen | |
| TCGA-AO-A03R | (TODO) -- GDC | clinical__biospecimen | |
| TCGA-AO-A03T | (TODO) -- GDC | clinical__biospecimen | |
| TCGA-AO-A03U | (TODO) -- GDC | clinical__biospecimen | |
| TCGA-AO-A03V | (TODO) -- GDC | clinical__biospecimen | |
| TCGA-AO-A0J2 | (TODO) -- GDC | clinical__biospecimen | |
| TCGA-AO-A0J3 | (TODO) -- GDC | clinical__biospecimen | |
| TCGA-AO-A0J4 | (TODO) -- GDC | clinical__biospecimen | |
| TCGA-AO-A0J5 | (TODO) -- GDC | clinical__biospecimen | |
| TCGA-AO-A0J6 | (TODO) -- GDC | clinical__biospecimen | |
| TCGA-AO-A0J7 | (TODO) -- GDC | clinical__biospecimen | |
| TCGA-AO-A0J8 | (TODO) -- GDC | clinical__biospecimen | |
| TCGA-AO-A0J9 | (TODO) -- GDC | clinical__biospecimen | |
| TCGA-AO-A0JA | (TODO) -- GDC | clinical__biospecimen | |
| TCGA-AO-A0JB | (TODO) -- GDC | clinical__biospecimen | |
| TCGA-AO-A0JC | (TODO) -- GDC | clinical__biospecimen | |
| TCGA-AO-A0JD | (TODO) -- GDC | clinical__biospecimen | |
| TCGA-AO-A0JE | (TODO) -- GDC | clinical__biospecimen | |
| TCGA-AO-A0JF | (TODO) -- GDC | clinical__biospecimen | |
| TCGA-AO-A0JG | (TODO) -- GDC | clinical__biospecimen | |
| TCGA-AO-A0JI | (TODO) -- GDC | clinical__biospecimen | |
| TCGA-AO-A0JJ | (TODO) -- GDC | clinical__biospecimen | |
| TCGA-AO-A0JL | (TODO) -- GDC | clinical__biospecimen | |
| TCGA-AO-A0JM | (TODO) -- GDC | clinical__biospecimen | |
| TCGA-AO-A124 | (TODO) -- GDC | clinical__biospecimen | |
| TCGA-AO-A125 | (TODO) -- GDC | clinical__biospecimen | |
| TCGA-AO-A126 | (TODO) -- GDC | clinical__biospecimen | |
| TCGA-AO-A128 | (TODO) -- GDC | clinical__biospecimen | |
| TCGA-AO-A129 | (TODO) -- GDC | clinical__biospecimen | |
| TCGA-AO-A12A | (TODO) -- GDC | clinical__biospecimen | |
| TCGA-AO-A12B | (TODO) -- GDC | clinical__biospecimen | |
| TCGA-AO-A12C | (TODO) -- GDC | clinical__biospecimen | |
| TCGA-AO-A12D | (TODO) -- GDC | clinical__biospecimen | |
| TCGA-AO-A12E | (TODO) -- GDC | clinical__biospecimen | |
| TCGA-AO-A12F | (TODO) -- GDC | clinical__biospecimen | |
| TCGA-AO-A12G | (TODO) -- GDC | clinical__biospecimen | |
| TCGA-AO-A12H | (TODO) -- GDC | clinical__biospecimen | |
| TCGA-AO-A1KO | (TODO) -- GDC | clinical__biospecimen | |
| TCGA-AO-A1KP | (TODO) -- GDC | clinical__biospecimen | |
| TCGA-AO-A1KQ | (TODO) -- GDC | clinical__biospecimen | |
| TCGA-AO-A1KR | (TODO) -- GDC | clinical__biospecimen | |
| TCGA-AO-A1KS | (TODO) -- GDC | clinical__biospecimen | |
| TCGA-AO-A1KT | (TODO) -- GDC | clinical__biospecimen | |
| TCGA-AQ-A04H | (TODO) -- GDC | clinical__biospecimen | |
| TCGA-AQ-A04J | (TODO) -- GDC | clinical__biospecimen | |
| TCGA-AQ-A04L | (TODO) -- GDC | clinical__biospecimen | |
| TCGA-AQ-A0Y5 | (TODO) -- GDC | clinical__biospecimen | |
| TCGA-AQ-A1H2 | (TODO) -- GDC | clinical__biospecimen | |
| TCGA-AQ-A1H3 | (TODO) -- GDC | clinical__biospecimen | |
| TCGA-AQ-A54N | (TODO) -- GDC | clinical__biospecimen | |
| TCGA-AQ-A54O | (TODO) -- GDC | clinical__biospecimen | |
| TCGA-AQ-A7U7 | (TODO) -- GDC | clinical__biospecimen | |
| TCGA-AR-A0TP | (TODO) -- GDC | clinical__biospecimen | |
| TCGA-AR-A0TQ | (TODO) -- GDC | clinical__biospecimen | |
| TCGA-AR-A0TR | (TODO) -- GDC | clinical__biospecimen | |
| TCGA-AR-A0TS | (TODO) -- GDC | clinical__biospecimen | |
| TCGA-AR-A0TT | (TODO) -- GDC | clinical__biospecimen | |
| TCGA-AR-A0TU | (TODO) -- GDC | clinical__biospecimen | |
| TCGA-AR-A0TV | (TODO) -- GDC | clinical__biospecimen | |
| TCGA-AR-A0TW | (TODO) -- GDC | clinical__biospecimen | |
| TCGA-AR-A0TX | (TODO) -- GDC | clinical__biospecimen | |
| TCGA-AR-A0TY | (TODO) -- GDC | clinical__biospecimen | |
| TCGA-AR-A0TZ | (TODO) -- GDC | clinical__biospecimen | |
| TCGA-AR-A0U0 | (TODO) -- GDC | clinical__biospecimen | |
| TCGA-AR-A0U1 | (TODO) -- GDC | clinical__biospecimen | |
| TCGA-AR-A0U2 | (TODO) -- GDC | clinical__biospecimen | |
| TCGA-AR-A0U3 | (TODO) -- GDC | clinical__biospecimen | |
| TCGA-AR-A0U4 | (TODO) -- GDC | clinical__biospecimen | |
| TCGA-AR-A1AH | (TODO) -- GDC | clinical__biospecimen | |
| TCGA-AR-A1AI | (TODO) -- GDC | clinical__biospecimen | |
| TCGA-AR-A1AJ | (TODO) -- GDC | clinical__biospecimen | |
| TCGA-AR-A1AK | (TODO) -- GDC | clinical__biospecimen | |
| TCGA-AR-A1AL | (TODO) -- GDC | clinical__biospecimen | |
| TCGA-AR-A1AM | (TODO) -- GDC | clinical__biospecimen | |
| TCGA-AR-A1AN | (TODO) -- GDC | clinical__biospecimen | |
| TCGA-AR-A1AO | (TODO) -- GDC | clinical__biospecimen | |
| TCGA-AR-A1AP | (TODO) -- GDC | clinical__biospecimen | |
| TCGA-AR-A1AQ | (TODO) -- GDC | clinical__biospecimen | |
| TCGA-AR-A1AR | (TODO) -- GDC | clinical__biospecimen | |
| TCGA-AR-A1AS | (TODO) -- GDC | clinical__biospecimen | |
| TCGA-AR-A1AT | (TODO) -- GDC | clinical__biospecimen | |
| TCGA-AR-A1AU | (TODO) -- GDC | clinical__biospecimen | |
| TCGA-AR-A1AV | (TODO) -- GDC | clinical__biospecimen | |
| TCGA-AR-A1AW | (TODO) -- GDC | clinical__biospecimen | |
| TCGA-AR-A1AX | (TODO) -- GDC | clinical__biospecimen | |
| TCGA-AR-A1AY | (TODO) -- GDC | clinical__biospecimen | |
| TCGA-AR-A24H | (TODO) -- GDC | clinical__biospecimen | |
| TCGA-AR-A24K | (TODO) -- GDC | clinical__biospecimen | |
| TCGA-AR-A24L | (TODO) -- GDC | clinical__biospecimen | |
| TCGA-AR-A24M | (TODO) -- GDC | clinical__biospecimen | |
| TCGA-AR-A24N | (TODO) -- GDC | clinical__biospecimen | |
| TCGA-AR-A24O | (TODO) -- GDC | clinical__biospecimen | |
| TCGA-AR-A24P | (TODO) -- GDC | clinical__biospecimen | |
| TCGA-AR-A24Q | (TODO) -- GDC | clinical__biospecimen | |
| TCGA-AR-A24R | (TODO) -- GDC | clinical__biospecimen | |
| TCGA-AR-A24S | (TODO) -- GDC | clinical__biospecimen | |
| TCGA-AR-A24T | (TODO) -- GDC | clinical__biospecimen | |
| TCGA-AR-A24U | (TODO) -- GDC | clinical__biospecimen | |
| TCGA-AR-A24V | (TODO) -- GDC | clinical__biospecimen | |
| TCGA-AR-A24W | (TODO) -- GDC | clinical__biospecimen | |
| TCGA-AR-A24X | (TODO) -- GDC | clinical__biospecimen | |
| TCGA-AR-A24Z | (TODO) -- GDC | clinical__biospecimen | |
| TCGA-AR-A250 | (TODO) -- GDC | clinical__biospecimen | |
| TCGA-AR-A251 | (TODO) -- GDC | clinical__biospecimen | |
| TCGA-AR-A252 | (TODO) -- GDC | clinical__biospecimen | |
| TCGA-AR-A254 | (TODO) -- GDC | clinical__biospecimen | |
| TCGA-AR-A255 | (TODO) -- GDC | clinical__biospecimen | |
| TCGA-AR-A256 | (TODO) -- GDC | clinical__biospecimen | |
| TCGA-AR-A2LE | (TODO) -- GDC | clinical__biospecimen | |
| TCGA-AR-A2LH | (TODO) -- GDC | clinical__biospecimen | |
| TCGA-AR-A2LJ | (TODO) -- GDC | clinical__biospecimen | |
| TCGA-AR-A2LK | (TODO) -- GDC | clinical__biospecimen | |
| TCGA-AR-A2LL | (TODO) -- GDC | clinical__biospecimen | |
| TCGA-AR-A2LM | (TODO) -- GDC | clinical__biospecimen | |
| TCGA-AR-A2LN | (TODO) -- GDC | clinical__biospecimen | |
| TCGA-AR-A2LO | (TODO) -- GDC | clinical__biospecimen | |
| TCGA-AR-A2LQ | (TODO) -- GDC | clinical__biospecimen | |
| TCGA-AR-A2LR | (TODO) -- GDC | clinical__biospecimen | |
| TCGA-AR-A5QM | (TODO) -- GDC | clinical__biospecimen | |
| TCGA-AR-A5QN | (TODO) -- GDC | clinical__biospecimen | |
| TCGA-AR-A5QP | (TODO) -- GDC | clinical__biospecimen | |
| TCGA-AR-A5QQ | (TODO) -- GDC | clinical__biospecimen | |
| TCGA-B6-A0I1 | (TODO) -- GDC | clinical__biospecimen | |
| TCGA-B6-A0I2 | (TODO) -- GDC | clinical__biospecimen | |
| TCGA-B6-A0I5 | (TODO) -- GDC | clinical__biospecimen | |
| TCGA-B6-A0I6 | (TODO) -- GDC | clinical__biospecimen | |
| TCGA-B6-A0I8 | (TODO) -- GDC | clinical__biospecimen | |
| TCGA-B6-A0I9 | (TODO) -- GDC | clinical__biospecimen | |
| TCGA-B6-A0IA | (TODO) -- GDC | clinical__biospecimen | |
| TCGA-B6-A0IB | (TODO) -- GDC | clinical__biospecimen | |
| TCGA-B6-A0IC | (TODO) -- GDC | clinical__biospecimen | |
| TCGA-B6-A0IE | (TODO) -- GDC | clinical__biospecimen | |
| TCGA-B6-A0IG | (TODO) -- GDC | clinical__biospecimen | |
| TCGA-B6-A0IH | (TODO) -- GDC | clinical__biospecimen | |
| TCGA-B6-A0IJ | (TODO) -- GDC | clinical__biospecimen | |
| TCGA-B6-A0IK | (TODO) -- GDC | clinical__biospecimen | |
| TCGA-B6-A0IM | (TODO) -- GDC | clinical__biospecimen | |
| TCGA-B6-A0IN | (TODO) -- GDC | clinical__biospecimen | |
| TCGA-B6-A0IO | (TODO) -- GDC | clinical__biospecimen | |
| TCGA-B6-A0IP | (TODO) -- GDC | clinical__biospecimen | |
| TCGA-B6-A0IQ | (TODO) -- GDC | clinical__biospecimen | |
| TCGA-B6-A0RE | (TODO) -- GDC | clinical__biospecimen | |
| TCGA-B6-A0RG | (TODO) -- GDC | clinical__biospecimen | |
| TCGA-B6-A0RH | (TODO) -- GDC | clinical__biospecimen | |
| TCGA-B6-A0RI | (TODO) -- GDC | clinical__biospecimen | |
| TCGA-B6-A0RL | (TODO) -- GDC | clinical__biospecimen | |
| TCGA-B6-A0RM | (TODO) -- GDC | clinical__biospecimen | |
| TCGA-B6-A0RN | (TODO) -- GDC | clinical__biospecimen | |
| TCGA-B6-A0RO | (TODO) -- GDC | clinical__biospecimen | |
| TCGA-B6-A0RP | (TODO) -- GDC | clinical__biospecimen | |
| TCGA-B6-A0RQ | (TODO) -- GDC | clinical__biospecimen | |
| TCGA-B6-A0RS | (TODO) -- GDC | clinical__biospecimen | |
| TCGA-B6-A0RT | (TODO) -- GDC | clinical__biospecimen | |
| TCGA-B6-A0RU | (TODO) -- GDC | clinical__biospecimen | |
| TCGA-B6-A0RV | (TODO) -- GDC | clinical__biospecimen | |
| TCGA-B6-A0WS | (TODO) -- GDC | clinical__biospecimen | |
| TCGA-B6-A0WT | (TODO) -- GDC | clinical__biospecimen | |
| TCGA-B6-A0WV | (TODO) -- GDC | clinical__biospecimen | |
| TCGA-B6-A0WW | (TODO) -- GDC | clinical__biospecimen | |
| TCGA-B6-A0WX | (TODO) -- GDC | clinical__biospecimen | |
| TCGA-B6-A0WY | (TODO) -- GDC | clinical__biospecimen | |
| TCGA-B6-A0WZ | (TODO) -- GDC | clinical__biospecimen | |
| TCGA-B6-A0X0 | (TODO) -- GDC | clinical__biospecimen | |
| TCGA-B6-A0X1 | (TODO) -- GDC | clinical__biospecimen | |
| TCGA-B6-A0X4 | (TODO) -- GDC | clinical__biospecimen | |
| TCGA-B6-A0X5 | (TODO) -- GDC | clinical__biospecimen | |
| TCGA-B6-A0X7 | (TODO) -- GDC | clinical__biospecimen | |
| TCGA-B6-A1KC | (TODO) -- GDC | clinical__biospecimen | |
| TCGA-B6-A1KF | (TODO) -- GDC | clinical__biospecimen | |
| TCGA-B6-A1KI | (TODO) -- GDC | clinical__biospecimen | |
| TCGA-B6-A1KN | (TODO) -- GDC | clinical__biospecimen | |
| TCGA-B6-A2IU | (TODO) -- GDC | clinical__biospecimen | |
| TCGA-B6-A3ZX | (TODO) -- GDC | clinical__biospecimen | |
| TCGA-B6-A400 | (TODO) -- GDC | clinical__biospecimen | |
| TCGA-B6-A401 | (TODO) -- GDC | clinical__biospecimen | |
| TCGA-B6-A402 | (TODO) -- GDC | clinical__biospecimen | |
| TCGA-B6-A408 | (TODO) -- GDC | clinical__biospecimen | |
| TCGA-B6-A409 | (TODO) -- GDC | clinical__biospecimen | |
| TCGA-B6-A40B | (TODO) -- GDC | clinical__biospecimen | |
| TCGA-B6-A40C | (TODO) -- GDC | clinical__biospecimen | |
| TCGA-BH-A0AU | (TODO) -- GDC | clinical__biospecimen | |
| TCGA-BH-A0AV | (TODO) -- GDC | clinical__biospecimen | |
| TCGA-BH-A0AW | (TODO) -- GDC | clinical__biospecimen | |
| TCGA-BH-A0AY | (TODO) -- GDC | clinical__biospecimen | |
| TCGA-BH-A0AZ | (TODO) -- GDC | clinical__biospecimen | |
| TCGA-BH-A0B0 | (TODO) -- GDC | clinical__biospecimen | |
| TCGA-BH-A0B1 | (TODO) -- GDC | clinical__biospecimen | |
| TCGA-BH-A0B2 | (TODO) -- GDC | clinical__biospecimen | |
| TCGA-BH-A0B3 | (TODO) -- GDC | clinical__biospecimen | |
| TCGA-BH-A0B4 | (TODO) -- GDC | clinical__biospecimen | |
| TCGA-BH-A0B5 | (TODO) -- GDC | clinical__biospecimen | |
| TCGA-BH-A0B6 | (TODO) -- GDC | clinical__biospecimen | |
| TCGA-BH-A0B7 | (TODO) -- GDC | clinical__biospecimen | |
| TCGA-BH-A0B8 | (TODO) -- GDC | clinical__biospecimen | |
| TCGA-BH-A0B9 | (TODO) -- GDC | clinical__biospecimen | |
| TCGA-BH-A0BA | (TODO) -- GDC | clinical__biospecimen | |
| TCGA-BH-A0BC | (TODO) -- GDC | clinical__biospecimen | |
| TCGA-BH-A0BD | (TODO) -- GDC | clinical__biospecimen | |
| TCGA-BH-A0BF | (TODO) -- GDC | clinical__biospecimen | |
| TCGA-BH-A0BG | (TODO) -- GDC | clinical__biospecimen | |
| TCGA-BH-A0BJ | (TODO) -- GDC | clinical__biospecimen | |
| TCGA-BH-A0BL | (TODO) -- GDC | clinical__biospecimen | |
| TCGA-BH-A0BM | (TODO) -- GDC | clinical__biospecimen | |
| TCGA-BH-A0BO | (TODO) -- GDC | clinical__biospecimen | |
| TCGA-BH-A0BP | (TODO) -- GDC | clinical__biospecimen | |
| TCGA-BH-A0BQ | (TODO) -- GDC | clinical__biospecimen | |
| TCGA-BH-A0BR | (TODO) -- GDC | clinical__biospecimen | |
| TCGA-BH-A0BS | (TODO) -- GDC | clinical__biospecimen | |
| TCGA-BH-A0BT | (TODO) -- GDC | clinical__biospecimen | |
| TCGA-BH-A0BV | (TODO) -- GDC | clinical__biospecimen | |
| TCGA-BH-A0BW | (TODO) -- GDC | clinical__biospecimen | |
| TCGA-BH-A0BZ | (TODO) -- GDC | clinical__biospecimen | |
| TCGA-BH-A0C0 | (TODO) -- GDC | clinical__biospecimen | |
| TCGA-BH-A0C1 | (TODO) -- GDC | clinical__biospecimen | |
| TCGA-BH-A0C3 | (TODO) -- GDC | clinical__biospecimen | |
| TCGA-BH-A0C7 | (TODO) -- GDC | clinical__biospecimen | |
| TCGA-BH-A0DD | (TODO) -- GDC | clinical__biospecimen | |
| TCGA-BH-A0DE | (TODO) -- GDC | clinical__biospecimen | |
| TCGA-BH-A0DG | (TODO) -- GDC | clinical__biospecimen | |
| TCGA-BH-A0DH | (TODO) -- GDC | clinical__biospecimen | |
| TCGA-BH-A0DI | (TODO) -- GDC | clinical__biospecimen | |
| TCGA-BH-A0DK | (TODO) -- GDC | clinical__biospecimen | |
| TCGA-BH-A0DL | (TODO) -- GDC | clinical__biospecimen | |
| TCGA-BH-A0DO | (TODO) -- GDC | clinical__biospecimen | |
| TCGA-BH-A0DP | (TODO) -- GDC | clinical__biospecimen | |
| TCGA-BH-A0DQ | (TODO) -- GDC | clinical__biospecimen | |
| TCGA-BH-A0DS | (TODO) -- GDC | clinical__biospecimen | |
| TCGA-BH-A0DT | (TODO) -- GDC | clinical__biospecimen | |
| TCGA-BH-A0DV | (TODO) -- GDC | clinical__biospecimen | |
| TCGA-BH-A0DX | (TODO) -- GDC | clinical__biospecimen | |
| TCGA-BH-A0DZ | (TODO) -- GDC | clinical__biospecimen | |
| TCGA-BH-A0E0 | (TODO) -- GDC | clinical__biospecimen | |
| TCGA-BH-A0E1 | (TODO) -- GDC | clinical__biospecimen | |
| TCGA-BH-A0E2 | (TODO) -- GDC | clinical__biospecimen | |
| TCGA-BH-A0E6 | (TODO) -- GDC | clinical__biospecimen | |
| TCGA-BH-A0E7 | (TODO) -- GDC | clinical__biospecimen | |
| TCGA-BH-A0E9 | (TODO) -- GDC | clinical__biospecimen | |
| TCGA-BH-A0EA | (TODO) -- GDC | clinical__biospecimen | |
| TCGA-BH-A0EB | (TODO) -- GDC | clinical__biospecimen | |
| TCGA-BH-A0EE | (TODO) -- GDC | clinical__biospecimen | |
| TCGA-BH-A0EI | (TODO) -- GDC | clinical__biospecimen | |
| TCGA-BH-A0GY | (TODO) -- GDC | clinical__biospecimen | |
| TCGA-BH-A0GZ | (TODO) -- GDC | clinical__biospecimen | |
| TCGA-BH-A0H0 | (TODO) -- GDC | clinical__biospecimen | |
| TCGA-BH-A0H3 | (TODO) -- GDC | clinical__biospecimen | |
| TCGA-BH-A0H5 | (TODO) -- GDC | clinical__biospecimen | |
| TCGA-BH-A0H6 | (TODO) -- GDC | clinical__biospecimen | |
| TCGA-BH-A0H7 | (TODO) -- GDC | clinical__biospecimen | |
| TCGA-BH-A0H9 | (TODO) -- GDC | clinical__biospecimen | |
| TCGA-BH-A0HA | (TODO) -- GDC | clinical__biospecimen | |
| TCGA-BH-A0HB | (TODO) -- GDC | clinical__biospecimen | |
| TCGA-BH-A0HF | (TODO) -- GDC | clinical__biospecimen | |
| TCGA-BH-A0HI | (TODO) -- GDC | clinical__biospecimen | |
| TCGA-BH-A0HK | (TODO) -- GDC | clinical__biospecimen | |
| TCGA-BH-A0HL | (TODO) -- GDC | clinical__biospecimen | |
| TCGA-BH-A0HN | (TODO) -- GDC | clinical__biospecimen | |
| TCGA-BH-A0HO | (TODO) -- GDC | clinical__biospecimen | |
| TCGA-BH-A0HP | (TODO) -- GDC | clinical__biospecimen | |
| TCGA-BH-A0HQ | (TODO) -- GDC | clinical__biospecimen | |
| TCGA-BH-A0HU | (TODO) -- GDC | clinical__biospecimen | |
| TCGA-BH-A0HW | (TODO) -- GDC | clinical__biospecimen | |
| TCGA-BH-A0HX | (TODO) -- GDC | clinical__biospecimen | |
| TCGA-BH-A0HY | (TODO) -- GDC | clinical__biospecimen | |
| TCGA-BH-A0RX | (TODO) -- GDC | clinical__biospecimen | |
| TCGA-BH-A0W3 | (TODO) -- GDC | clinical__biospecimen | |
| TCGA-BH-A0W4 | (TODO) -- GDC | clinical__biospecimen | |
| TCGA-BH-A0W5 | (TODO) -- GDC | clinical__biospecimen | |
| TCGA-BH-A0W7 | (TODO) -- GDC | clinical__biospecimen | |
| TCGA-BH-A0WA | (TODO) -- GDC | clinical__biospecimen | |
| TCGA-BH-A18F | (TODO) -- GDC | clinical__biospecimen | |
| TCGA-BH-A18G | (TODO) -- GDC | clinical__biospecimen | |
| TCGA-BH-A18H | (TODO) -- GDC | clinical__biospecimen | |
| TCGA-BH-A18I | (TODO) -- GDC | clinical__biospecimen | |
| TCGA-BH-A18J | (TODO) -- GDC | clinical__biospecimen | |
| TCGA-BH-A18K | (TODO) -- GDC | clinical__biospecimen | |
| TCGA-BH-A18L | (TODO) -- GDC | clinical__biospecimen | |
| TCGA-BH-A18M | (TODO) -- GDC | clinical__biospecimen | |
| TCGA-BH-A18N | (TODO) -- GDC | clinical__biospecimen | |
| TCGA-BH-A18P | (TODO) -- GDC | clinical__biospecimen | |
| TCGA-BH-A18Q | (TODO) -- GDC | clinical__biospecimen | |
| TCGA-BH-A18R | (TODO) -- GDC | clinical__biospecimen | |
| TCGA-BH-A18S | (TODO) -- GDC | clinical__biospecimen | |
| TCGA-BH-A18T | (TODO) -- GDC | clinical__biospecimen | |
| TCGA-BH-A18U | (TODO) -- GDC | clinical__biospecimen | |
| TCGA-BH-A18V | (TODO) -- GDC | clinical__biospecimen | |
| TCGA-BH-A1EN | (TODO) -- GDC | clinical__biospecimen | |
| TCGA-BH-A1EO | (TODO) -- GDC | clinical__biospecimen | |
| TCGA-BH-A1ES | (TODO) -- GDC | clinical__biospecimen | |
| TCGA-BH-A1ET | (TODO) -- GDC | clinical__biospecimen | |
| TCGA-BH-A1EU | (TODO) -- GDC | clinical__biospecimen | |
| TCGA-BH-A1EV | (TODO) -- GDC | clinical__biospecimen | |
| TCGA-BH-A1EW | (TODO) -- GDC | clinical__biospecimen | |
| TCGA-BH-A1EX | (TODO) -- GDC | clinical__biospecimen | |
| TCGA-BH-A1EY | (TODO) -- GDC | clinical__biospecimen | |
| TCGA-BH-A1F0 | (TODO) -- GDC | clinical__biospecimen | |
| TCGA-BH-A1F2 | (TODO) -- GDC | clinical__biospecimen | |
| TCGA-BH-A1F5 | (TODO) -- GDC | clinical__biospecimen | |
| TCGA-BH-A1F6 | (TODO) -- GDC | clinical__biospecimen | |
| TCGA-BH-A1F8 | (TODO) -- GDC | clinical__biospecimen | |
| TCGA-BH-A1FB | (TODO) -- GDC | clinical__biospecimen | |
| TCGA-BH-A1FC | (TODO) -- GDC | clinical__biospecimen | |
| TCGA-BH-A1FD | (TODO) -- GDC | clinical__biospecimen | |
| TCGA-BH-A1FE | (TODO) -- GDC | clinical__biospecimen | |
| TCGA-BH-A1FG | (TODO) -- GDC | clinical__biospecimen | |
| TCGA-BH-A1FH | (TODO) -- GDC | clinical__biospecimen | |
| TCGA-BH-A1FJ | (TODO) -- GDC | clinical__biospecimen | |
| TCGA-BH-A1FL | (TODO) -- GDC | clinical__biospecimen | |
| TCGA-BH-A1FM | (TODO) -- GDC | clinical__biospecimen | |
| TCGA-BH-A1FN | (TODO) -- GDC | clinical__biospecimen | |
| TCGA-BH-A1FR | (TODO) -- GDC | clinical__biospecimen | |
| TCGA-BH-A1FU | (TODO) -- GDC | clinical__biospecimen | |
| TCGA-BH-A201 | (TODO) -- GDC | clinical__biospecimen | |
| TCGA-BH-A202 | (TODO) -- GDC | clinical__biospecimen | |
| TCGA-BH-A203 | (TODO) -- GDC | clinical__biospecimen | |
| TCGA-BH-A204 | (TODO) -- GDC | clinical__biospecimen | |
| TCGA-BH-A208 | (TODO) -- GDC | clinical__biospecimen | |
| TCGA-BH-A209 | (TODO) -- GDC | clinical__biospecimen | |
| TCGA-BH-A28O | (TODO) -- GDC | clinical__biospecimen | |
| TCGA-BH-A28Q | (TODO) -- GDC | clinical__biospecimen | |
| TCGA-BH-A2L8 | (TODO) -- GDC | clinical__biospecimen | |
| TCGA-BH-A42T | (TODO) -- GDC | clinical__biospecimen | |
| TCGA-BH-A42U | (TODO) -- GDC | clinical__biospecimen | |
| TCGA-BH-A42V | (TODO) -- GDC | clinical__biospecimen | |
| TCGA-BH-A5IZ | (TODO) -- GDC | clinical__biospecimen | |
| TCGA-BH-A5J0 | (TODO) -- GDC | clinical__biospecimen | |
| TCGA-BH-A6R8 | (TODO) -- GDC | clinical__biospecimen | |
| TCGA-BH-A6R9 | (TODO) -- GDC | clinical__biospecimen | |
| TCGA-BH-A8FY | (TODO) -- GDC | clinical__biospecimen | |
| TCGA-BH-A8FZ | (TODO) -- GDC | clinical__biospecimen | |
| TCGA-BH-A8G0 | (TODO) -- GDC | clinical__biospecimen | |
| TCGA-BH-AB28 | (TODO) -- GDC | clinical__biospecimen | |
| TCGA-C8-A12K | (TODO) -- GDC | clinical__biospecimen | |
| TCGA-C8-A12L | (TODO) -- GDC | clinical__biospecimen | |
| TCGA-C8-A12M | (TODO) -- GDC | clinical__biospecimen | |
| TCGA-C8-A12N | (TODO) -- GDC | clinical__biospecimen | |
| TCGA-C8-A12O | (TODO) -- GDC | clinical__biospecimen | |
| TCGA-C8-A12P | (TODO) -- GDC | clinical__biospecimen | |
| TCGA-C8-A12Q | (TODO) -- GDC | clinical__biospecimen | |
| TCGA-C8-A12T | (TODO) -- GDC | clinical__biospecimen | |
| TCGA-C8-A12U | (TODO) -- GDC | clinical__biospecimen | |
| TCGA-C8-A12V | (TODO) -- GDC | clinical__biospecimen | |
| TCGA-C8-A12W | (TODO) -- GDC | clinical__biospecimen | |
| TCGA-C8-A12X | (TODO) -- GDC | clinical__biospecimen | |
| TCGA-C8-A12Y | (TODO) -- GDC | clinical__biospecimen | |
| TCGA-C8-A12Z | (TODO) -- GDC | clinical__biospecimen | |
| TCGA-C8-A130 | (TODO) -- GDC | clinical__biospecimen | |
| TCGA-C8-A131 | (TODO) -- GDC | clinical__biospecimen | |
| TCGA-C8-A132 | (TODO) -- GDC | clinical__biospecimen | |
| TCGA-C8-A133 | (TODO) -- GDC | clinical__biospecimen | |
| TCGA-C8-A134 | (TODO) -- GDC | clinical__biospecimen | |
| TCGA-C8-A135 | (TODO) -- GDC | clinical__biospecimen | |
| TCGA-C8-A137 | (TODO) -- GDC | clinical__biospecimen | |
| TCGA-C8-A138 | (TODO) -- GDC | clinical__biospecimen | |
| TCGA-C8-A1HE | (TODO) -- GDC | clinical__biospecimen | |
| TCGA-C8-A1HF | (TODO) -- GDC | clinical__biospecimen | |
| TCGA-C8-A1HG | (TODO) -- GDC | clinical__biospecimen | |
| TCGA-C8-A1HI | (TODO) -- GDC | clinical__biospecimen | |
| TCGA-C8-A1HJ | (TODO) -- GDC | clinical__biospecimen | |
| TCGA-C8-A1HK | (TODO) -- GDC | clinical__biospecimen | |
| TCGA-C8-A1HL | (TODO) -- GDC | clinical__biospecimen | |
| TCGA-C8-A1HM | (TODO) -- GDC | clinical__biospecimen | |
| TCGA-C8-A1HN | (TODO) -- GDC | clinical__biospecimen | |
| TCGA-C8-A1HO | (TODO) -- GDC | clinical__biospecimen | |
| TCGA-C8-A26V | (TODO) -- GDC | clinical__biospecimen | |
| TCGA-C8-A26W | (TODO) -- GDC | clinical__biospecimen | |
| TCGA-C8-A26X | (TODO) -- GDC | clinical__biospecimen | |
| TCGA-C8-A26Y | (TODO) -- GDC | clinical__biospecimen | |
| TCGA-C8-A26Z | (TODO) -- GDC | clinical__biospecimen | |
| TCGA-C8-A273 | (TODO) -- GDC | clinical__biospecimen | |
| TCGA-C8-A274 | (TODO) -- GDC | clinical__biospecimen | |
| TCGA-C8-A275 | (TODO) -- GDC | clinical__biospecimen | |
| TCGA-C8-A278 | (TODO) -- GDC | clinical__biospecimen | |
| TCGA-C8-A27A | (TODO) -- GDC | clinical__biospecimen | |
| TCGA-C8-A27B | (TODO) -- GDC | clinical__biospecimen | |
| TCGA-C8-A3M7 | (TODO) -- GDC | clinical__biospecimen | |
| TCGA-C8-A3M8 | (TODO) -- GDC | clinical__biospecimen | |
| TCGA-C8-A8HP | (TODO) -- GDC | clinical__biospecimen | |
| TCGA-C8-A8HQ | (TODO) -- GDC | clinical__biospecimen | |
| TCGA-C8-A8HR | (TODO) -- GDC | clinical__biospecimen | |
| TCGA-C8-A9FZ | (TODO) -- GDC | clinical__biospecimen | |
| TCGA-D8-A13Y | (TODO) -- GDC | clinical__biospecimen | |
| TCGA-D8-A13Z | (TODO) -- GDC | clinical__biospecimen | |
| TCGA-D8-A140 | (TODO) -- GDC | clinical__biospecimen | |
| TCGA-D8-A141 | (TODO) -- GDC | clinical__biospecimen | |
| TCGA-D8-A142 | (TODO) -- GDC | clinical__biospecimen | |
| TCGA-D8-A143 | (TODO) -- GDC | clinical__biospecimen | |
| TCGA-D8-A145 | (TODO) -- GDC | clinical__biospecimen | |
| TCGA-D8-A146 | (TODO) -- GDC | clinical__biospecimen | |
| TCGA-D8-A147 | (TODO) -- GDC | clinical__biospecimen | |
| TCGA-D8-A1J8 | (TODO) -- GDC | clinical__biospecimen | |
| TCGA-D8-A1J9 | (TODO) -- GDC | clinical__biospecimen | |
| TCGA-D8-A1JA | (TODO) -- GDC | clinical__biospecimen | |
| TCGA-D8-A1JB | (TODO) -- GDC | clinical__biospecimen | |
| TCGA-D8-A1JC | (TODO) -- GDC | clinical__biospecimen | |
| TCGA-D8-A1JD | (TODO) -- GDC | clinical__biospecimen | |
| TCGA-D8-A1JE | (TODO) -- GDC | clinical__biospecimen | |
| TCGA-D8-A1JF | (TODO) -- GDC | clinical__biospecimen | |
| TCGA-D8-A1JG | (TODO) -- GDC | clinical__biospecimen | |
| TCGA-D8-A1JH | (TODO) -- GDC | clinical__biospecimen | |
| TCGA-D8-A1JI | (TODO) -- GDC | clinical__biospecimen | |
| TCGA-D8-A1JJ | (TODO) -- GDC | clinical__biospecimen | |
| TCGA-D8-A1JK | (TODO) -- GDC | clinical__biospecimen | |
| TCGA-D8-A1JL | (TODO) -- GDC | clinical__biospecimen | |
| TCGA-D8-A1JM | (TODO) -- GDC | clinical__biospecimen | |
| TCGA-D8-A1JN | (TODO) -- GDC | clinical__biospecimen | |
| TCGA-D8-A1JP | (TODO) -- GDC | clinical__biospecimen | |
| TCGA-D8-A1JS | (TODO) -- GDC | clinical__biospecimen | |
| TCGA-D8-A1JT | (TODO) -- GDC | clinical__biospecimen | |
| TCGA-D8-A1JU | (TODO) -- GDC | clinical__biospecimen | |
| TCGA-D8-A1X5 | (TODO) -- GDC | clinical__biospecimen | |
| TCGA-D8-A1X6 | (TODO) -- GDC | clinical__biospecimen | |
| TCGA-D8-A1X7 | (TODO) -- GDC | clinical__biospecimen | |
| TCGA-D8-A1X8 | (TODO) -- GDC | clinical__biospecimen | |
| TCGA-D8-A1X9 | (TODO) -- GDC | clinical__biospecimen | |
| TCGA-D8-A1XA | (TODO) -- GDC | clinical__biospecimen | |
| TCGA-D8-A1XB | (TODO) -- GDC | clinical__biospecimen | |
| TCGA-D8-A1XC | (TODO) -- GDC | clinical__biospecimen | |
| TCGA-D8-A1XD | (TODO) -- GDC | clinical__biospecimen | |
| TCGA-D8-A1XF | (TODO) -- GDC | clinical__biospecimen | |
| TCGA-D8-A1XG | (TODO) -- GDC | clinical__biospecimen | |
| TCGA-D8-A1XJ | (TODO) -- GDC | clinical__biospecimen | |
| TCGA-D8-A1XK | (TODO) -- GDC | clinical__biospecimen | |
| TCGA-D8-A1XL | (TODO) -- GDC | clinical__biospecimen | |
| TCGA-D8-A1XM | (TODO) -- GDC | clinical__biospecimen | |
| TCGA-D8-A1XO | (TODO) -- GDC | clinical__biospecimen | |
| TCGA-D8-A1XQ | (TODO) -- GDC | clinical__biospecimen | |
| TCGA-D8-A1XR | (TODO) -- GDC | clinical__biospecimen | |
| TCGA-D8-A1XS | (TODO) -- GDC | clinical__biospecimen | |
| TCGA-D8-A1XT | (TODO) -- GDC | clinical__biospecimen | |
| TCGA-D8-A1XU | (TODO) -- GDC | clinical__biospecimen | |
| TCGA-D8-A1XV | (TODO) -- GDC | clinical__biospecimen | |
| TCGA-D8-A1XW | (TODO) -- GDC | clinical__biospecimen | |
| TCGA-D8-A1XY | (TODO) -- GDC | clinical__biospecimen | |
| TCGA-D8-A1XZ | (TODO) -- GDC | clinical__biospecimen | |
| TCGA-D8-A1Y0 | (TODO) -- GDC | clinical__biospecimen | |
| TCGA-D8-A1Y1 | (TODO) -- GDC | clinical__biospecimen | |
| TCGA-D8-A1Y2 | (TODO) -- GDC | clinical__biospecimen | |
| TCGA-D8-A1Y3 | (TODO) -- GDC | clinical__biospecimen | |
| TCGA-D8-A27E | (TODO) -- GDC | clinical__biospecimen | |
| TCGA-D8-A27F | (TODO) -- GDC | clinical__biospecimen | |
| TCGA-D8-A27G | (TODO) -- GDC | clinical__biospecimen | |
| TCGA-D8-A27H | (TODO) -- GDC | clinical__biospecimen | |
| TCGA-D8-A27I | (TODO) -- GDC | clinical__biospecimen | |
| TCGA-D8-A27K | (TODO) -- GDC | clinical__biospecimen | |
| TCGA-D8-A27L | (TODO) -- GDC | clinical__biospecimen | |
| TCGA-D8-A27M | (TODO) -- GDC | clinical__biospecimen | |
| TCGA-D8-A27N | (TODO) -- GDC | clinical__biospecimen | |
| TCGA-D8-A27P | (TODO) -- GDC | clinical__biospecimen | |
| TCGA-D8-A27R | (TODO) -- GDC | clinical__biospecimen | |
| TCGA-D8-A27T | (TODO) -- GDC | clinical__biospecimen | |
| TCGA-D8-A27V | (TODO) -- GDC | clinical__biospecimen | |
| TCGA-D8-A27W | (TODO) -- GDC | clinical__biospecimen | |
| TCGA-D8-A3Z5 | (TODO) -- GDC | clinical__biospecimen | |
| TCGA-D8-A3Z6 | (TODO) -- GDC | clinical__biospecimen | |
| TCGA-D8-A4Z1 | (TODO) -- GDC | clinical__biospecimen | |
| TCGA-D8-A73U | (TODO) -- GDC | clinical__biospecimen | |
| TCGA-D8-A73W | (TODO) -- GDC | clinical__biospecimen | |
| TCGA-D8-A73X | (TODO) -- GDC | clinical__biospecimen | |
| TCGA-E2-A105 | (TODO) -- GDC | clinical__biospecimen | |
| TCGA-E2-A106 | (TODO) -- GDC | clinical__biospecimen | |
| TCGA-E2-A107 | (TODO) -- GDC | clinical__biospecimen | |
| TCGA-E2-A108 | (TODO) -- GDC | clinical__biospecimen | |
| TCGA-E2-A109 | (TODO) -- GDC | clinical__biospecimen | |
| TCGA-E2-A10A | (TODO) -- GDC | clinical__biospecimen | |
| TCGA-E2-A10B | (TODO) -- GDC | clinical__biospecimen | |
| TCGA-E2-A10C | (TODO) -- GDC | clinical__biospecimen | |
| TCGA-E2-A10E | (TODO) -- GDC | clinical__biospecimen | |
| TCGA-E2-A10F | (TODO) -- GDC | clinical__biospecimen | |
| TCGA-E2-A14N | (TODO) -- GDC | clinical__biospecimen | |
| TCGA-E2-A14O | (TODO) -- GDC | clinical__biospecimen | |
| TCGA-E2-A14P | (TODO) -- GDC | clinical__biospecimen | |
| TCGA-E2-A14Q | (TODO) -- GDC | clinical__biospecimen | |
| TCGA-E2-A14R | (TODO) -- GDC | clinical__biospecimen | |
| TCGA-E2-A14S | (TODO) -- GDC | clinical__biospecimen | |
| TCGA-E2-A14T | (TODO) -- GDC | clinical__biospecimen | |
| TCGA-E2-A14U | (TODO) -- GDC | clinical__biospecimen | |
| TCGA-E2-A14V | (TODO) -- GDC | clinical__biospecimen | |
| TCGA-E2-A14W | (TODO) -- GDC | clinical__biospecimen | |
| TCGA-E2-A14X | (TODO) -- GDC | clinical__biospecimen | |
| TCGA-E2-A14Y | (TODO) -- GDC | clinical__biospecimen | |
| TCGA-E2-A14Z | (TODO) -- GDC | clinical__biospecimen | |
| TCGA-E2-A150 | (TODO) -- GDC | clinical__biospecimen | |
| TCGA-E2-A152 | (TODO) -- GDC | clinical__biospecimen | |
| TCGA-E2-A153 | (TODO) -- GDC | clinical__biospecimen | |
| TCGA-E2-A154 | (TODO) -- GDC | clinical__biospecimen | |
| TCGA-E2-A155 | (TODO) -- GDC | clinical__biospecimen | |
| TCGA-E2-A156 | (TODO) -- GDC | clinical__biospecimen | |
| TCGA-E2-A158 | (TODO) -- GDC | clinical__biospecimen | |
| TCGA-E2-A159 | (TODO) -- GDC | clinical__biospecimen | |
| TCGA-E2-A15A | (TODO) -- GDC | clinical__biospecimen | |
| TCGA-E2-A15C | (TODO) -- GDC | clinical__biospecimen | |
| TCGA-E2-A15D | (TODO) -- GDC | clinical__biospecimen | |
| TCGA-E2-A15E | (TODO) -- GDC | clinical__biospecimen | |
| TCGA-E2-A15F | (TODO) -- GDC | clinical__biospecimen | |
| TCGA-E2-A15G | (TODO) -- GDC | clinical__biospecimen | |
| TCGA-E2-A15H | (TODO) -- GDC | clinical__biospecimen | |
| TCGA-E2-A15I | (TODO) -- GDC | clinical__biospecimen | |
| TCGA-E2-A15J | (TODO) -- GDC | clinical__biospecimen | |
| TCGA-E2-A15K | (TODO) -- GDC | clinical__biospecimen | |
| TCGA-E2-A15L | (TODO) -- GDC | clinical__biospecimen | |
| TCGA-E2-A15M | (TODO) -- GDC | clinical__biospecimen | |
| TCGA-E2-A15O | (TODO) -- GDC | clinical__biospecimen | |
| TCGA-E2-A15P | (TODO) -- GDC | clinical__biospecimen | |
| TCGA-E2-A15R | (TODO) -- GDC | clinical__biospecimen | |
| TCGA-E2-A15S | (TODO) -- GDC | clinical__biospecimen | |
| TCGA-E2-A15T | (TODO) -- GDC | clinical__biospecimen | |
| TCGA-E2-A1AZ | (TODO) -- GDC | clinical__biospecimen | |
| TCGA-E2-A1B0 | (TODO) -- GDC | clinical__biospecimen | |
| TCGA-E2-A1B1 | (TODO) -- GDC | clinical__biospecimen | |
| TCGA-E2-A1B4 | (TODO) -- GDC | clinical__biospecimen | |
| TCGA-E2-A1B5 | (TODO) -- GDC | clinical__biospecimen | |
| TCGA-E2-A1B6 | (TODO) -- GDC | clinical__biospecimen | |
| TCGA-E2-A1BC | (TODO) -- GDC | clinical__biospecimen | |
| TCGA-E2-A1BD | (TODO) -- GDC | clinical__biospecimen | |
| TCGA-E2-A1IE | (TODO) -- GDC | clinical__biospecimen | |
| TCGA-E2-A1IF | (TODO) -- GDC | clinical__biospecimen | |
| TCGA-E2-A1IG | (TODO) -- GDC | clinical__biospecimen | |
| TCGA-E2-A1IH | (TODO) -- GDC | clinical__biospecimen | |
| TCGA-E2-A1II | (TODO) -- GDC | clinical__biospecimen | |
| TCGA-E2-A1IJ | (TODO) -- GDC | clinical__biospecimen | |
| TCGA-E2-A1IK | (TODO) -- GDC | clinical__biospecimen | |
| TCGA-E2-A1IL | (TODO) -- GDC | clinical__biospecimen | |
| TCGA-E2-A1IN | (TODO) -- GDC | clinical__biospecimen | |
| TCGA-E2-A1IO | (TODO) -- GDC | clinical__biospecimen | |
| TCGA-E2-A1IU | (TODO) -- GDC | clinical__biospecimen | |
| TCGA-E2-A1L6 | (TODO) -- GDC | clinical__biospecimen | |
| TCGA-E2-A1L7 | (TODO) -- GDC | clinical__biospecimen | |
| TCGA-E2-A1L8 | (TODO) -- GDC | clinical__biospecimen | |
| TCGA-E2-A1L9 | (TODO) -- GDC | clinical__biospecimen | |
| TCGA-E2-A1LA | (TODO) -- GDC | clinical__biospecimen | |
| TCGA-E2-A1LB | (TODO) -- GDC | clinical__biospecimen | |
| TCGA-E2-A1LE | (TODO) -- GDC | clinical__biospecimen | |
| TCGA-E2-A1LG | (TODO) -- GDC | clinical__biospecimen | |
| TCGA-E2-A1LH | (TODO) -- GDC | clinical__biospecimen | |
| TCGA-E2-A1LI | (TODO) -- GDC | clinical__biospecimen | |
| TCGA-E2-A1LK | (TODO) -- GDC | clinical__biospecimen | |
| TCGA-E2-A1LL | (TODO) -- GDC | clinical__biospecimen | |
| TCGA-E2-A1LS | (TODO) -- GDC | clinical__biospecimen | |
| TCGA-E2-A2P5 | (TODO) -- GDC | clinical__biospecimen | |
| TCGA-E2-A2P6 | (TODO) -- GDC | clinical__biospecimen | |
| TCGA-E2-A3DX | (TODO) -- GDC | clinical__biospecimen | |
| TCGA-E2-A56Z | (TODO) -- GDC | clinical__biospecimen | |
| TCGA-E2-A570 | (TODO) -- GDC | clinical__biospecimen | |
| TCGA-E2-A572 | (TODO) -- GDC | clinical__biospecimen | |
| TCGA-E2-A573 | (TODO) -- GDC | clinical__biospecimen | |
| TCGA-E2-A574 | (TODO) -- GDC | clinical__biospecimen | |
| TCGA-E2-A576 | (TODO) -- GDC | clinical__biospecimen | |
| TCGA-E2-A9RU | (TODO) -- GDC | clinical__biospecimen | |
| TCGA-E9-A1N3 | (TODO) -- GDC | clinical__biospecimen | |
| TCGA-E9-A1N4 | (TODO) -- GDC | clinical__biospecimen | |
| TCGA-E9-A1N5 | (TODO) -- GDC | clinical__biospecimen | |
| TCGA-E9-A1N6 | (TODO) -- GDC | clinical__biospecimen | |
| TCGA-E9-A1N8 | (TODO) -- GDC | clinical__biospecimen | |
| TCGA-E9-A1N9 | (TODO) -- GDC | clinical__biospecimen | |
| TCGA-E9-A1NA | (TODO) -- GDC | clinical__biospecimen | |
| TCGA-E9-A1NC | (TODO) -- GDC | clinical__biospecimen | |
| TCGA-E9-A1ND | (TODO) -- GDC | clinical__biospecimen | |
| TCGA-E9-A1NE | (TODO) -- GDC | clinical__biospecimen | |
| TCGA-E9-A1NF | (TODO) -- GDC | clinical__biospecimen | |
| TCGA-E9-A1NG | (TODO) -- GDC | clinical__biospecimen | |
| TCGA-E9-A1NH | (TODO) -- GDC | clinical__biospecimen | |
| TCGA-E9-A1NI | (TODO) -- GDC | clinical__biospecimen | |
| TCGA-E9-A1QZ | (TODO) -- GDC | clinical__biospecimen | |
| TCGA-E9-A1R0 | (TODO) -- GDC | clinical__biospecimen | |
| TCGA-E9-A1R2 | (TODO) -- GDC | clinical__biospecimen | |
| TCGA-E9-A1R3 | (TODO) -- GDC | clinical__biospecimen | |
| TCGA-E9-A1R4 | (TODO) -- GDC | clinical__biospecimen | |
| TCGA-E9-A1R5 | (TODO) -- GDC | clinical__biospecimen | |
| TCGA-E9-A1R6 | (TODO) -- GDC | clinical__biospecimen | |
| TCGA-E9-A1R7 | (TODO) -- GDC | clinical__biospecimen | |
| TCGA-E9-A1RA | (TODO) -- GDC | clinical__biospecimen | |
| TCGA-E9-A1RB | (TODO) -- GDC | clinical__biospecimen | |
| TCGA-E9-A1RC | (TODO) -- GDC | clinical__biospecimen | |
| TCGA-E9-A1RD | (TODO) -- GDC | clinical__biospecimen | |
| TCGA-E9-A1RE | (TODO) -- GDC | clinical__biospecimen | |
| TCGA-E9-A1RF | (TODO) -- GDC | clinical__biospecimen | |
| TCGA-E9-A1RG | (TODO) -- GDC | clinical__biospecimen | |
| TCGA-E9-A1RH | (TODO) -- GDC | clinical__biospecimen | |
| TCGA-E9-A1RI | (TODO) -- GDC | clinical__biospecimen | |
| TCGA-E9-A226 | (TODO) -- GDC | clinical__biospecimen | |
| TCGA-E9-A227 | (TODO) -- GDC | clinical__biospecimen | |
| TCGA-E9-A228 | (TODO) -- GDC | clinical__biospecimen | |
| TCGA-E9-A229 | (TODO) -- GDC | clinical__biospecimen | |
| TCGA-E9-A22A | (TODO) -- GDC | clinical__biospecimen | |
| TCGA-E9-A22B | (TODO) -- GDC | clinical__biospecimen | |
| TCGA-E9-A22D | (TODO) -- GDC | clinical__biospecimen | |
| TCGA-E9-A22E | (TODO) -- GDC | clinical__biospecimen | |
| TCGA-E9-A22G | (TODO) -- GDC | clinical__biospecimen | |
| TCGA-E9-A22H | (TODO) -- GDC | clinical__biospecimen | |
| TCGA-E9-A243 | (TODO) -- GDC | clinical__biospecimen | |
| TCGA-E9-A244 | (TODO) -- GDC | clinical__biospecimen | |
| TCGA-E9-A245 | (TODO) -- GDC | clinical__biospecimen | |
| TCGA-E9-A247 | (TODO) -- GDC | clinical__biospecimen | |
| TCGA-E9-A248 | (TODO) -- GDC | clinical__biospecimen | |
| TCGA-E9-A249 | (TODO) -- GDC | clinical__biospecimen | |
| TCGA-E9-A24A | (TODO) -- GDC | clinical__biospecimen | |
| TCGA-E9-A295 | (TODO) -- GDC | clinical__biospecimen | |
| TCGA-E9-A2JS | (TODO) -- GDC | clinical__biospecimen | |
| TCGA-E9-A2JT | (TODO) -- GDC | clinical__biospecimen | |
| TCGA-E9-A3HO | (TODO) -- GDC | clinical__biospecimen | |
| TCGA-E9-A3Q9 | (TODO) -- GDC | clinical__biospecimen | |
| TCGA-E9-A3QA | (TODO) -- GDC | clinical__biospecimen | |
| TCGA-E9-A3X8 | (TODO) -- GDC | clinical__biospecimen | |
| TCGA-E9-A54X | (TODO) -- GDC | clinical__biospecimen | |
| TCGA-E9-A54Y | (TODO) -- GDC | clinical__biospecimen | |
| TCGA-E9-A5FK | (TODO) -- GDC | clinical__biospecimen | |
| TCGA-E9-A5FL | (TODO) -- GDC | clinical__biospecimen | |
| TCGA-E9-A5UO | (TODO) -- GDC | clinical__biospecimen | |
| TCGA-E9-A5UP | (TODO) -- GDC | clinical__biospecimen | |
| TCGA-E9-A6HE | (TODO) -- GDC | clinical__biospecimen | |
| TCGA-EW-A1IW | (TODO) -- GDC | clinical__biospecimen | |
| TCGA-EW-A1IX | (TODO) -- GDC | clinical__biospecimen | |
| TCGA-EW-A1IY | (TODO) -- GDC | clinical__biospecimen | |
| TCGA-EW-A1IZ | (TODO) -- GDC | clinical__biospecimen | |
| TCGA-EW-A1J1 | (TODO) -- GDC | clinical__biospecimen | |
| TCGA-EW-A1J2 | (TODO) -- GDC | clinical__biospecimen | |
| TCGA-EW-A1J3 | (TODO) -- GDC | clinical__biospecimen | |
| TCGA-EW-A1J5 | (TODO) -- GDC | clinical__biospecimen | |
| TCGA-EW-A1J6 | (TODO) -- GDC | clinical__biospecimen | |
| TCGA-EW-A1OV | (TODO) -- GDC | clinical__biospecimen | |
| TCGA-EW-A1OW | (TODO) -- GDC | clinical__biospecimen | |
| TCGA-EW-A1OX | (TODO) -- GDC | clinical__biospecimen | |
| TCGA-EW-A1OY | (TODO) -- GDC | clinical__biospecimen | |
| TCGA-EW-A1OZ | (TODO) -- GDC | clinical__biospecimen | |
| TCGA-EW-A1P0 | (TODO) -- GDC | clinical__biospecimen | |
| TCGA-EW-A1P1 | (TODO) -- GDC | clinical__biospecimen | |
| TCGA-EW-A1P3 | (TODO) -- GDC | clinical__biospecimen | |
| TCGA-EW-A1P4 | (TODO) -- GDC | clinical__biospecimen | |
| TCGA-EW-A1P5 | (TODO) -- GDC | clinical__biospecimen | |
| TCGA-EW-A1P6 | (TODO) -- GDC | clinical__biospecimen | |
| TCGA-EW-A1P7 | (TODO) -- GDC | clinical__biospecimen | |
| TCGA-EW-A1P8 | (TODO) -- GDC | clinical__biospecimen | |
| TCGA-EW-A1PA | (TODO) -- GDC | clinical__biospecimen | |
| TCGA-EW-A1PB | (TODO) -- GDC | clinical__biospecimen | |
| TCGA-EW-A1PC | (TODO) -- GDC | clinical__biospecimen | |
| TCGA-EW-A1PD | (TODO) -- GDC | clinical__biospecimen | |
| TCGA-EW-A1PE | (TODO) -- GDC | clinical__biospecimen | |
| TCGA-EW-A1PF | (TODO) -- GDC | clinical__biospecimen | |
| TCGA-EW-A1PG | (TODO) -- GDC | clinical__biospecimen | |
| TCGA-EW-A1PH | (TODO) -- GDC | clinical__biospecimen | |
| TCGA-EW-A2FR | (TODO) -- GDC | clinical__biospecimen | |
| TCGA-EW-A2FS | (TODO) -- GDC | clinical__biospecimen | |
| TCGA-EW-A2FV | (TODO) -- GDC | clinical__biospecimen | |
| TCGA-EW-A2FW | (TODO) -- GDC | clinical__biospecimen | |
| TCGA-EW-A3E8 | (TODO) -- GDC | clinical__biospecimen | |
| TCGA-EW-A3U0 | (TODO) -- GDC | clinical__biospecimen | |
| TCGA-EW-A423 | (TODO) -- GDC | clinical__biospecimen | |
| TCGA-EW-A424 | (TODO) -- GDC | clinical__biospecimen | |
| TCGA-EW-A6S9 | (TODO) -- GDC | clinical__biospecimen | |
| TCGA-EW-A6SA | (TODO) -- GDC | clinical__biospecimen | |
| TCGA-EW-A6SB | (TODO) -- GDC | clinical__biospecimen | |
| TCGA-EW-A6SC | (TODO) -- GDC | clinical__biospecimen | |
| TCGA-EW-A6SD | (TODO) -- GDC | clinical__biospecimen | |
| TCGA-GI-A2C8 | (TODO) -- GDC | clinical__biospecimen | |
| TCGA-GI-A2C9 | (TODO) -- GDC | clinical__biospecimen | |
| TCGA-GM-A2D9 | (TODO) -- GDC | clinical__biospecimen | |
| TCGA-GM-A2DA | (TODO) -- GDC | clinical__biospecimen | |
| TCGA-GM-A2DB | (TODO) -- GDC | clinical__biospecimen | |
| TCGA-GM-A2DC | (TODO) -- GDC | clinical__biospecimen | |
| TCGA-GM-A2DD | (TODO) -- GDC | clinical__biospecimen | |
| TCGA-GM-A2DF | (TODO) -- GDC | clinical__biospecimen | |
| TCGA-GM-A2DH | (TODO) -- GDC | clinical__biospecimen | |
| TCGA-GM-A2DI | (TODO) -- GDC | clinical__biospecimen | |
| TCGA-GM-A2DK | (TODO) -- GDC | clinical__biospecimen | |
| TCGA-GM-A2DL | (TODO) -- GDC | clinical__biospecimen | |
| TCGA-GM-A2DM | (TODO) -- GDC | clinical__biospecimen | |
| TCGA-GM-A2DN | (TODO) -- GDC | clinical__biospecimen | |
| TCGA-GM-A2DO | (TODO) -- GDC | clinical__biospecimen | |
| TCGA-GM-A3NW | (TODO) -- GDC | clinical__biospecimen | |
| TCGA-GM-A3NY | (TODO) -- GDC | clinical__biospecimen | |
| TCGA-GM-A3XG | (TODO) -- GDC | clinical__biospecimen | |
| TCGA-GM-A3XL | (TODO) -- GDC | clinical__biospecimen | |
| TCGA-GM-A3XN | (TODO) -- GDC | clinical__biospecimen | |
| TCGA-GM-A4E0 | (TODO) -- GDC | clinical__biospecimen | |
| TCGA-GM-A5PV | (TODO) -- GDC | clinical__biospecimen | |
| TCGA-GM-A5PX | (TODO) -- GDC | clinical__biospecimen | |
| TCGA-HN-A2NL | (TODO) -- GDC | clinical__biospecimen | |
| TCGA-HN-A2OB | (TODO) -- GDC | clinical__biospecimen | |
| TCGA-JL-A3YW | (TODO) -- GDC | clinical__biospecimen | |
| TCGA-JL-A3YX | (TODO) -- GDC | clinical__biospecimen | |
| TCGA-LD-A66U | (TODO) -- GDC | clinical__biospecimen | |
| TCGA-LD-A74U | (TODO) -- GDC | clinical__biospecimen | |
| TCGA-LD-A7W5 | (TODO) -- GDC | clinical__biospecimen | |
| TCGA-LD-A7W6 | (TODO) -- GDC | clinical__biospecimen | |
| TCGA-LD-A9QF | (TODO) -- GDC | clinical__biospecimen | |
| TCGA-LL-A440 | (TODO) -- GDC | clinical__biospecimen | |
| TCGA-LL-A441 | (TODO) -- GDC | clinical__biospecimen | |
| TCGA-LL-A442 | (TODO) -- GDC | clinical__biospecimen | |
| TCGA-LL-A50Y | (TODO) -- GDC | clinical__biospecimen | |
| TCGA-LL-A5YL | (TODO) -- GDC | clinical__biospecimen | |
| TCGA-LL-A5YM | (TODO) -- GDC | clinical__biospecimen | |
| TCGA-LL-A5YN | (TODO) -- GDC | clinical__biospecimen | |
| TCGA-LL-A5YO | (TODO) -- GDC | clinical__biospecimen | |
| TCGA-LL-A5YP | (TODO) -- GDC | clinical__biospecimen | |
| TCGA-LL-A6FP | (TODO) -- GDC | clinical__biospecimen | |
| TCGA-LL-A6FQ | (TODO) -- GDC | clinical__biospecimen | |
| TCGA-LL-A6FR | (TODO) -- GDC | clinical__biospecimen | |
| TCGA-LL-A73Y | (TODO) -- GDC | clinical__biospecimen | |
| TCGA-LL-A73Z | (TODO) -- GDC | clinical__biospecimen | |
| TCGA-LL-A740 | (TODO) -- GDC | clinical__biospecimen | |
| TCGA-LL-A7SZ | (TODO) -- GDC | clinical__biospecimen | |
| TCGA-LL-A7T0 | (TODO) -- GDC | clinical__biospecimen | |
| TCGA-LL-A8F5 | (TODO) -- GDC | clinical__biospecimen | |
| TCGA-LL-A9Q3 | (TODO) -- GDC | clinical__biospecimen | |
| TCGA-LQ-A4E4 | (TODO) -- GDC | clinical__biospecimen | |
| TCGA-MS-A51U | (TODO) -- GDC | clinical__biospecimen | |
| TCGA-OK-A5Q2 | (TODO) -- GDC | clinical__biospecimen | |
| TCGA-OL-A5D6 | (TODO) -- GDC | clinical__biospecimen | |
| TCGA-OL-A5D7 | (TODO) -- GDC | clinical__biospecimen | |
| TCGA-OL-A5D8 | (TODO) -- GDC | clinical__biospecimen | |
| TCGA-OL-A5DA | (TODO) -- GDC | clinical__biospecimen | |
| TCGA-OL-A5RU | (TODO) -- GDC | clinical__biospecimen | |
| TCGA-OL-A5RV | (TODO) -- GDC | clinical__biospecimen | |
| TCGA-OL-A5RW | (TODO) -- GDC | clinical__biospecimen | |
| TCGA-OL-A5RX | (TODO) -- GDC | clinical__biospecimen | |
| TCGA-OL-A5RY | (TODO) -- GDC | clinical__biospecimen | |
| TCGA-OL-A5RZ | (TODO) -- GDC | clinical__biospecimen | |
| TCGA-OL-A5S0 | (TODO) -- GDC | clinical__biospecimen | |
| TCGA-OL-A66H | (TODO) -- GDC | clinical__biospecimen | |
| TCGA-OL-A66I | (TODO) -- GDC | clinical__biospecimen | |
| TCGA-OL-A66J | (TODO) -- GDC | clinical__biospecimen | |
| TCGA-OL-A66K | (TODO) -- GDC | clinical__biospecimen | |
| TCGA-OL-A66L | (TODO) -- GDC | clinical__biospecimen | |
| TCGA-OL-A66N | (TODO) -- GDC | clinical__biospecimen | |
| TCGA-OL-A66O | (TODO) -- GDC | clinical__biospecimen | |
| TCGA-OL-A66P | (TODO) -- GDC | clinical__biospecimen | |
| TCGA-OL-A6VO | (TODO) -- GDC | clinical__biospecimen | |
| TCGA-OL-A6VQ | (TODO) -- GDC | clinical__biospecimen | |
| TCGA-OL-A6VR | (TODO) -- GDC | clinical__biospecimen | |
| TCGA-OL-A97C | (TODO) -- GDC | clinical__biospecimen | |
| TCGA-PE-A5DC | (TODO) -- GDC | clinical__biospecimen | |
| TCGA-PE-A5DD | (TODO) -- GDC | clinical__biospecimen | |
| TCGA-PE-A5DE | (TODO) -- GDC | clinical__biospecimen | |
| TCGA-PL-A8LV | (TODO) -- GDC | clinical__biospecimen | |
| TCGA-PL-A8LX | (TODO) -- GDC | clinical__biospecimen | |
| TCGA-PL-A8LY | (TODO) -- GDC | clinical__biospecimen | |
| TCGA-PL-A8LZ | (TODO) -- GDC | clinical__biospecimen | |
| TCGA-S3-A6ZF | (TODO) -- GDC | clinical__biospecimen | |
| TCGA-S3-A6ZG | (TODO) -- GDC | clinical__biospecimen | |
| TCGA-S3-A6ZH | (TODO) -- GDC | clinical__biospecimen | |
| TCGA-S3-AA0Z | (TODO) -- GDC | clinical__biospecimen | |
| TCGA-S3-AA10 | (TODO) -- GDC | clinical__biospecimen | |
| TCGA-S3-AA11 | (TODO) -- GDC | clinical__biospecimen | |
| TCGA-S3-AA12 | (TODO) -- GDC | clinical__biospecimen | |
| TCGA-S3-AA14 | (TODO) -- GDC | clinical__biospecimen | |
| TCGA-S3-AA15 | (TODO) -- GDC | clinical__biospecimen | |
| TCGA-S3-AA17 | (TODO) -- GDC | clinical__biospecimen | |
| TCGA-UL-AAZ6 | (TODO) -- GDC | clinical__biospecimen | |
| TCGA-UU-A93S | (TODO) -- GDC | clinical__biospecimen | |
| TCGA-V7-A7HQ | (TODO) -- GDC | clinical__biospecimen | |
| TCGA-W8-A86G | (TODO) -- GDC | clinical__biospecimen | |
| TCGA-WT-AB41 | (TODO) -- GDC | clinical__biospecimen | |
| TCGA-WT-AB44 | (TODO) -- GDC | clinical__biospecimen | |
| TCGA-XX-A899 | (TODO) -- GDC | clinical__biospecimen | |
| TCGA-XX-A89A | (TODO) -- GDC | clinical__biospecimen | |
| TCGA-Z7-A8R5 | (TODO) -- GDC | clinical__biospecimen | |
| TCGA-Z7-A8R6 | (TODO) -- GDC | clinical__biospecimen |
Table S25.
| TCGA Barcode | Platform | Center | Annotation |
|---|---|---|---|
| TCGA-3C-AAAU | (TODO) -- GDC | clinical__primary | |
| TCGA-3C-AALI | (TODO) -- GDC | clinical__primary | |
| TCGA-3C-AALJ | (TODO) -- GDC | clinical__primary | |
| TCGA-3C-AALK | (TODO) -- GDC | clinical__primary | |
| TCGA-4H-AAAK | (TODO) -- GDC | clinical__primary | |
| TCGA-5L-AAT0 | (TODO) -- GDC | clinical__primary | |
| TCGA-5L-AAT1 | (TODO) -- GDC | clinical__primary | |
| TCGA-5T-A9QA | (TODO) -- GDC | clinical__primary | |
| TCGA-A1-A0SB | (TODO) -- GDC | clinical__primary | |
| TCGA-A1-A0SD | (TODO) -- GDC | clinical__primary | |
| TCGA-A1-A0SE | (TODO) -- GDC | clinical__primary | |
| TCGA-A1-A0SF | (TODO) -- GDC | clinical__primary | |
| TCGA-A1-A0SG | (TODO) -- GDC | clinical__primary | |
| TCGA-A1-A0SH | (TODO) -- GDC | clinical__primary | |
| TCGA-A1-A0SI | (TODO) -- GDC | clinical__primary | |
| TCGA-A1-A0SJ | (TODO) -- GDC | clinical__primary | |
| TCGA-A1-A0SK | (TODO) -- GDC | clinical__primary | |
| TCGA-A1-A0SM | (TODO) -- GDC | clinical__primary | |
| TCGA-A1-A0SN | (TODO) -- GDC | clinical__primary | |
| TCGA-A1-A0SO | (TODO) -- GDC | clinical__primary | |
| TCGA-A1-A0SP | (TODO) -- GDC | clinical__primary | |
| TCGA-A1-A0SQ | (TODO) -- GDC | clinical__primary | |
| TCGA-A2-A04N | (TODO) -- GDC | clinical__primary | |
| TCGA-A2-A04P | (TODO) -- GDC | clinical__primary | |
| TCGA-A2-A04Q | (TODO) -- GDC | clinical__primary | |
| TCGA-A2-A04R | (TODO) -- GDC | clinical__primary | |
| TCGA-A2-A04T | (TODO) -- GDC | clinical__primary | |
| TCGA-A2-A04U | (TODO) -- GDC | clinical__primary | |
| TCGA-A2-A04V | (TODO) -- GDC | clinical__primary | |
| TCGA-A2-A04W | (TODO) -- GDC | clinical__primary | |
| TCGA-A2-A04X | (TODO) -- GDC | clinical__primary | |
| TCGA-A2-A04Y | (TODO) -- GDC | clinical__primary | |
| TCGA-A2-A0CK | (TODO) -- GDC | clinical__primary | |
| TCGA-A2-A0CL | (TODO) -- GDC | clinical__primary | |
| TCGA-A2-A0CM | (TODO) -- GDC | clinical__primary | |
| TCGA-A2-A0CO | (TODO) -- GDC | clinical__primary | |
| TCGA-A2-A0CP | (TODO) -- GDC | clinical__primary | |
| TCGA-A2-A0CQ | (TODO) -- GDC | clinical__primary | |
| TCGA-A2-A0CR | (TODO) -- GDC | clinical__primary | |
| TCGA-A2-A0CS | (TODO) -- GDC | clinical__primary | |
| TCGA-A2-A0CT | (TODO) -- GDC | clinical__primary | |
| TCGA-A2-A0CU | (TODO) -- GDC | clinical__primary | |
| TCGA-A2-A0CV | (TODO) -- GDC | clinical__primary | |
| TCGA-A2-A0CW | (TODO) -- GDC | clinical__primary | |
| TCGA-A2-A0CX | (TODO) -- GDC | clinical__primary | |
| TCGA-A2-A0CY | (TODO) -- GDC | clinical__primary | |
| TCGA-A2-A0CZ | (TODO) -- GDC | clinical__primary | |
| TCGA-A2-A0D0 | (TODO) -- GDC | clinical__primary | |
| TCGA-A2-A0D1 | (TODO) -- GDC | clinical__primary | |
| TCGA-A2-A0D2 | (TODO) -- GDC | clinical__primary | |
| TCGA-A2-A0D3 | (TODO) -- GDC | clinical__primary | |
| TCGA-A2-A0D4 | (TODO) -- GDC | clinical__primary | |
| TCGA-A2-A0EM | (TODO) -- GDC | clinical__primary | |
| TCGA-A2-A0EN | (TODO) -- GDC | clinical__primary | |
| TCGA-A2-A0EO | (TODO) -- GDC | clinical__primary | |
| TCGA-A2-A0EP | (TODO) -- GDC | clinical__primary | |
| TCGA-A2-A0EQ | (TODO) -- GDC | clinical__primary | |
| TCGA-A2-A0ER | (TODO) -- GDC | clinical__primary | |
| TCGA-A2-A0ES | (TODO) -- GDC | clinical__primary | |
| TCGA-A2-A0ET | (TODO) -- GDC | clinical__primary | |
| TCGA-A2-A0EU | (TODO) -- GDC | clinical__primary | |
| TCGA-A2-A0EV | (TODO) -- GDC | clinical__primary | |
| TCGA-A2-A0EW | (TODO) -- GDC | clinical__primary | |
| TCGA-A2-A0EX | (TODO) -- GDC | clinical__primary | |
| TCGA-A2-A0EY | (TODO) -- GDC | clinical__primary | |
| TCGA-A2-A0ST | (TODO) -- GDC | clinical__primary | |
| TCGA-A2-A0SU | (TODO) -- GDC | clinical__primary | |
| TCGA-A2-A0SV | (TODO) -- GDC | clinical__primary | |
| TCGA-A2-A0SW | (TODO) -- GDC | clinical__primary | |
| TCGA-A2-A0SX | (TODO) -- GDC | clinical__primary | |
| TCGA-A2-A0SY | (TODO) -- GDC | clinical__primary | |
| TCGA-A2-A0T0 | (TODO) -- GDC | clinical__primary | |
| TCGA-A2-A0T1 | (TODO) -- GDC | clinical__primary | |
| TCGA-A2-A0T2 | (TODO) -- GDC | clinical__primary | |
| TCGA-A2-A0T3 | (TODO) -- GDC | clinical__primary | |
| TCGA-A2-A0T4 | (TODO) -- GDC | clinical__primary | |
| TCGA-A2-A0T5 | (TODO) -- GDC | clinical__primary | |
| TCGA-A2-A0T6 | (TODO) -- GDC | clinical__primary | |
| TCGA-A2-A0T7 | (TODO) -- GDC | clinical__primary | |
| TCGA-A2-A0YC | (TODO) -- GDC | clinical__primary | |
| TCGA-A2-A0YD | (TODO) -- GDC | clinical__primary | |
| TCGA-A2-A0YE | (TODO) -- GDC | clinical__primary | |
| TCGA-A2-A0YF | (TODO) -- GDC | clinical__primary | |
| TCGA-A2-A0YG | (TODO) -- GDC | clinical__primary | |
| TCGA-A2-A0YH | (TODO) -- GDC | clinical__primary | |
| TCGA-A2-A0YI | (TODO) -- GDC | clinical__primary | |
| TCGA-A2-A0YJ | (TODO) -- GDC | clinical__primary | |
| TCGA-A2-A0YK | (TODO) -- GDC | clinical__primary | |
| TCGA-A2-A0YL | (TODO) -- GDC | clinical__primary | |
| TCGA-A2-A0YM | (TODO) -- GDC | clinical__primary | |
| TCGA-A2-A0YT | (TODO) -- GDC | clinical__primary | |
| TCGA-A2-A1FV | (TODO) -- GDC | clinical__primary | |
| TCGA-A2-A1FW | (TODO) -- GDC | clinical__primary | |
| TCGA-A2-A1FX | (TODO) -- GDC | clinical__primary | |
| TCGA-A2-A1FZ | (TODO) -- GDC | clinical__primary | |
| TCGA-A2-A1G0 | (TODO) -- GDC | clinical__primary | |
| TCGA-A2-A1G1 | (TODO) -- GDC | clinical__primary | |
| TCGA-A2-A1G4 | (TODO) -- GDC | clinical__primary | |
| TCGA-A2-A1G6 | (TODO) -- GDC | clinical__primary | |
| TCGA-A2-A259 | (TODO) -- GDC | clinical__primary | |
| TCGA-A2-A25A | (TODO) -- GDC | clinical__primary | |
| TCGA-A2-A25B | (TODO) -- GDC | clinical__primary | |
| TCGA-A2-A25C | (TODO) -- GDC | clinical__primary | |
| TCGA-A2-A25D | (TODO) -- GDC | clinical__primary | |
| TCGA-A2-A25E | (TODO) -- GDC | clinical__primary | |
| TCGA-A2-A25F | (TODO) -- GDC | clinical__primary | |
| TCGA-A2-A3KC | (TODO) -- GDC | clinical__primary | |
| TCGA-A2-A3KD | (TODO) -- GDC | clinical__primary | |
| TCGA-A2-A3XS | (TODO) -- GDC | clinical__primary | |
| TCGA-A2-A3XT | (TODO) -- GDC | clinical__primary | |
| TCGA-A2-A3XU | (TODO) -- GDC | clinical__primary | |
| TCGA-A2-A3XV | (TODO) -- GDC | clinical__primary | |
| TCGA-A2-A3XW | (TODO) -- GDC | clinical__primary | |
| TCGA-A2-A3XX | (TODO) -- GDC | clinical__primary | |
| TCGA-A2-A3XY | (TODO) -- GDC | clinical__primary | |
| TCGA-A2-A3XZ | (TODO) -- GDC | clinical__primary | |
| TCGA-A2-A3Y0 | (TODO) -- GDC | clinical__primary | |
| TCGA-A2-A4RW | (TODO) -- GDC | clinical__primary | |
| TCGA-A2-A4RX | (TODO) -- GDC | clinical__primary | |
| TCGA-A2-A4RY | (TODO) -- GDC | clinical__primary | |
| TCGA-A2-A4S0 | (TODO) -- GDC | clinical__primary | |
| TCGA-A2-A4S1 | (TODO) -- GDC | clinical__primary | |
| TCGA-A2-A4S2 | (TODO) -- GDC | clinical__primary | |
| TCGA-A2-A4S3 | (TODO) -- GDC | clinical__primary | |
| TCGA-A7-A0CD | (TODO) -- GDC | clinical__primary | |
| TCGA-A7-A0CE | (TODO) -- GDC | clinical__primary | |
| TCGA-A7-A0CG | (TODO) -- GDC | clinical__primary | |
| TCGA-A7-A0CH | (TODO) -- GDC | clinical__primary | |
| TCGA-A7-A0CJ | (TODO) -- GDC | clinical__primary | |
| TCGA-A7-A0D9 | (TODO) -- GDC | clinical__primary | |
| TCGA-A7-A0DA | (TODO) -- GDC | clinical__primary | |
| TCGA-A7-A0DB | (TODO) -- GDC | clinical__primary | |
| TCGA-A7-A0DC | (TODO) -- GDC | clinical__primary | |
| TCGA-A7-A13D | (TODO) -- GDC | clinical__primary | |
| TCGA-A7-A13E | (TODO) -- GDC | clinical__primary | |
| TCGA-A7-A13F | (TODO) -- GDC | clinical__primary | |
| TCGA-A7-A13G | (TODO) -- GDC | clinical__primary | |
| TCGA-A7-A13H | (TODO) -- GDC | clinical__primary | |
| TCGA-A7-A26E | (TODO) -- GDC | clinical__primary | |
| TCGA-A7-A26F | (TODO) -- GDC | clinical__primary | |
| TCGA-A7-A26G | (TODO) -- GDC | clinical__primary | |
| TCGA-A7-A26H | (TODO) -- GDC | clinical__primary | |
| TCGA-A7-A26I | (TODO) -- GDC | clinical__primary | |
| TCGA-A7-A26J | (TODO) -- GDC | clinical__primary | |
| TCGA-A7-A2KD | (TODO) -- GDC | clinical__primary | |
| TCGA-A7-A3IY | (TODO) -- GDC | clinical__primary | |
| TCGA-A7-A3IZ | (TODO) -- GDC | clinical__primary | |
| TCGA-A7-A3J0 | (TODO) -- GDC | clinical__primary | |
| TCGA-A7-A3J1 | (TODO) -- GDC | clinical__primary | |
| TCGA-A7-A3RF | (TODO) -- GDC | clinical__primary | |
| TCGA-A7-A425 | (TODO) -- GDC | clinical__primary | |
| TCGA-A7-A426 | (TODO) -- GDC | clinical__primary | |
| TCGA-A7-A4SA | (TODO) -- GDC | clinical__primary | |
| TCGA-A7-A4SB | (TODO) -- GDC | clinical__primary | |
| TCGA-A7-A4SC | (TODO) -- GDC | clinical__primary | |
| TCGA-A7-A4SD | (TODO) -- GDC | clinical__primary | |
| TCGA-A7-A4SE | (TODO) -- GDC | clinical__primary | |
| TCGA-A7-A4SF | (TODO) -- GDC | clinical__primary | |
| TCGA-A7-A56D | (TODO) -- GDC | clinical__primary | |
| TCGA-A7-A5ZV | (TODO) -- GDC | clinical__primary | |
| TCGA-A7-A5ZW | (TODO) -- GDC | clinical__primary | |
| TCGA-A7-A5ZX | (TODO) -- GDC | clinical__primary | |
| TCGA-A7-A6VV | (TODO) -- GDC | clinical__primary | |
| TCGA-A7-A6VW | (TODO) -- GDC | clinical__primary | |
| TCGA-A7-A6VX | (TODO) -- GDC | clinical__primary | |
| TCGA-A7-A6VY | (TODO) -- GDC | clinical__primary | |
| TCGA-A8-A06N | (TODO) -- GDC | clinical__primary | |
| TCGA-A8-A06O | (TODO) -- GDC | clinical__primary | |
| TCGA-A8-A06P | (TODO) -- GDC | clinical__primary | |
| TCGA-A8-A06Q | (TODO) -- GDC | clinical__primary | |
| TCGA-A8-A06R | (TODO) -- GDC | clinical__primary | |
| TCGA-A8-A06T | (TODO) -- GDC | clinical__primary | |
| TCGA-A8-A06U | (TODO) -- GDC | clinical__primary | |
| TCGA-A8-A06X | (TODO) -- GDC | clinical__primary | |
| TCGA-A8-A06Y | (TODO) -- GDC | clinical__primary | |
| TCGA-A8-A06Z | (TODO) -- GDC | clinical__primary | |
| TCGA-A8-A075 | (TODO) -- GDC | clinical__primary | |
| TCGA-A8-A076 | (TODO) -- GDC | clinical__primary | |
| TCGA-A8-A079 | (TODO) -- GDC | clinical__primary | |
| TCGA-A8-A07B | (TODO) -- GDC | clinical__primary | |
| TCGA-A8-A07C | (TODO) -- GDC | clinical__primary | |
| TCGA-A8-A07E | (TODO) -- GDC | clinical__primary | |
| TCGA-A8-A07F | (TODO) -- GDC | clinical__primary | |
| TCGA-A8-A07G | (TODO) -- GDC | clinical__primary | |
| TCGA-A8-A07I | (TODO) -- GDC | clinical__primary | |
| TCGA-A8-A07J | (TODO) -- GDC | clinical__primary | |
| TCGA-A8-A07L | (TODO) -- GDC | clinical__primary | |
| TCGA-A8-A07O | (TODO) -- GDC | clinical__primary | |
| TCGA-A8-A07P | (TODO) -- GDC | clinical__primary | |
| TCGA-A8-A07R | (TODO) -- GDC | clinical__primary | |
| TCGA-A8-A07S | (TODO) -- GDC | clinical__primary | |
| TCGA-A8-A07U | (TODO) -- GDC | clinical__primary | |
| TCGA-A8-A07W | (TODO) -- GDC | clinical__primary | |
| TCGA-A8-A07Z | (TODO) -- GDC | clinical__primary | |
| TCGA-A8-A081 | (TODO) -- GDC | clinical__primary | |
| TCGA-A8-A082 | (TODO) -- GDC | clinical__primary | |
| TCGA-A8-A083 | (TODO) -- GDC | clinical__primary | |
| TCGA-A8-A084 | (TODO) -- GDC | clinical__primary | |
| TCGA-A8-A085 | (TODO) -- GDC | clinical__primary | |
| TCGA-A8-A086 | (TODO) -- GDC | clinical__primary | |
| TCGA-A8-A08A | (TODO) -- GDC | clinical__primary | |
| TCGA-A8-A08B | (TODO) -- GDC | clinical__primary | |
| TCGA-A8-A08C | (TODO) -- GDC | clinical__primary | |
| TCGA-A8-A08F | (TODO) -- GDC | clinical__primary | |
| TCGA-A8-A08G | (TODO) -- GDC | clinical__primary | |
| TCGA-A8-A08H | (TODO) -- GDC | clinical__primary | |
| TCGA-A8-A08I | (TODO) -- GDC | clinical__primary | |
| TCGA-A8-A08J | (TODO) -- GDC | clinical__primary | |
| TCGA-A8-A08L | (TODO) -- GDC | clinical__primary | |
| TCGA-A8-A08O | (TODO) -- GDC | clinical__primary | |
| TCGA-A8-A08P | (TODO) -- GDC | clinical__primary | |
| TCGA-A8-A08R | (TODO) -- GDC | clinical__primary | |
| TCGA-A8-A08S | (TODO) -- GDC | clinical__primary | |
| TCGA-A8-A08T | (TODO) -- GDC | clinical__primary | |
| TCGA-A8-A08X | (TODO) -- GDC | clinical__primary | |
| TCGA-A8-A08Z | (TODO) -- GDC | clinical__primary | |
| TCGA-A8-A090 | (TODO) -- GDC | clinical__primary | |
| TCGA-A8-A091 | (TODO) -- GDC | clinical__primary | |
| TCGA-A8-A092 | (TODO) -- GDC | clinical__primary | |
| TCGA-A8-A093 | (TODO) -- GDC | clinical__primary | |
| TCGA-A8-A094 | (TODO) -- GDC | clinical__primary | |
| TCGA-A8-A095 | (TODO) -- GDC | clinical__primary | |
| TCGA-A8-A096 | (TODO) -- GDC | clinical__primary | |
| TCGA-A8-A097 | (TODO) -- GDC | clinical__primary | |
| TCGA-A8-A099 | (TODO) -- GDC | clinical__primary | |
| TCGA-A8-A09A | (TODO) -- GDC | clinical__primary | |
| TCGA-A8-A09B | (TODO) -- GDC | clinical__primary | |
| TCGA-A8-A09C | (TODO) -- GDC | clinical__primary | |
| TCGA-A8-A09D | (TODO) -- GDC | clinical__primary | |
| TCGA-A8-A09E | (TODO) -- GDC | clinical__primary | |
| TCGA-A8-A09G | (TODO) -- GDC | clinical__primary | |
| TCGA-A8-A09I | (TODO) -- GDC | clinical__primary | |
| TCGA-A8-A09K | (TODO) -- GDC | clinical__primary | |
| TCGA-A8-A09M | (TODO) -- GDC | clinical__primary | |
| TCGA-A8-A09N | (TODO) -- GDC | clinical__primary | |
| TCGA-A8-A09Q | (TODO) -- GDC | clinical__primary | |
| TCGA-A8-A09R | (TODO) -- GDC | clinical__primary | |
| TCGA-A8-A09T | (TODO) -- GDC | clinical__primary | |
| TCGA-A8-A09V | (TODO) -- GDC | clinical__primary | |
| TCGA-A8-A09W | (TODO) -- GDC | clinical__primary | |
| TCGA-A8-A09X | (TODO) -- GDC | clinical__primary | |
| TCGA-A8-A09Z | (TODO) -- GDC | clinical__primary | |
| TCGA-A8-A0A1 | (TODO) -- GDC | clinical__primary | |
| TCGA-A8-A0A2 | (TODO) -- GDC | clinical__primary | |
| TCGA-A8-A0A4 | (TODO) -- GDC | clinical__primary | |
| TCGA-A8-A0A6 | (TODO) -- GDC | clinical__primary | |
| TCGA-A8-A0A7 | (TODO) -- GDC | clinical__primary | |
| TCGA-A8-A0A9 | (TODO) -- GDC | clinical__primary | |
| TCGA-A8-A0AB | (TODO) -- GDC | clinical__primary | |
| TCGA-A8-A0AD | (TODO) -- GDC | clinical__primary | |
| TCGA-AC-A23C | (TODO) -- GDC | clinical__primary | |
| TCGA-AC-A23E | (TODO) -- GDC | clinical__primary | |
| TCGA-AC-A23G | (TODO) -- GDC | clinical__primary | |
| TCGA-AC-A23H | (TODO) -- GDC | clinical__primary | |
| TCGA-AC-A2B8 | (TODO) -- GDC | clinical__primary | |
| TCGA-AC-A2BK | (TODO) -- GDC | clinical__primary | |
| TCGA-AC-A2BM | (TODO) -- GDC | clinical__primary | |
| TCGA-AC-A2FB | (TODO) -- GDC | clinical__primary | |
| TCGA-AC-A2FE | (TODO) -- GDC | clinical__primary | |
| TCGA-AC-A2FF | (TODO) -- GDC | clinical__primary | |
| TCGA-AC-A2FG | (TODO) -- GDC | clinical__primary | |
| TCGA-AC-A2FK | (TODO) -- GDC | clinical__primary | |
| TCGA-AC-A2FM | (TODO) -- GDC | clinical__primary | |
| TCGA-AC-A2FO | (TODO) -- GDC | clinical__primary | |
| TCGA-AC-A2QH | (TODO) -- GDC | clinical__primary | |
| TCGA-AC-A2QI | (TODO) -- GDC | clinical__primary | |
| TCGA-AC-A2QJ | (TODO) -- GDC | clinical__primary | |
| TCGA-AC-A3BB | (TODO) -- GDC | clinical__primary | |
| TCGA-AC-A3EH | (TODO) -- GDC | clinical__primary | |
| TCGA-AC-A3HN | (TODO) -- GDC | clinical__primary | |
| TCGA-AC-A3OD | (TODO) -- GDC | clinical__primary | |
| TCGA-AC-A3QP | (TODO) -- GDC | clinical__primary | |
| TCGA-AC-A3QQ | (TODO) -- GDC | clinical__primary | |
| TCGA-AC-A3TM | (TODO) -- GDC | clinical__primary | |
| TCGA-AC-A3TN | (TODO) -- GDC | clinical__primary | |
| TCGA-AC-A3W5 | (TODO) -- GDC | clinical__primary | |
| TCGA-AC-A3W6 | (TODO) -- GDC | clinical__primary | |
| TCGA-AC-A3W7 | (TODO) -- GDC | clinical__primary | |
| TCGA-AC-A3YI | (TODO) -- GDC | clinical__primary | |
| TCGA-AC-A3YJ | (TODO) -- GDC | clinical__primary | |
| TCGA-AC-A4ZE | (TODO) -- GDC | clinical__primary | |
| TCGA-AC-A5EH | (TODO) -- GDC | clinical__primary | |
| TCGA-AC-A5EI | (TODO) -- GDC | clinical__primary | |
| TCGA-AC-A5XS | (TODO) -- GDC | clinical__primary | |
| TCGA-AC-A5XU | (TODO) -- GDC | clinical__primary | |
| TCGA-AC-A62V | (TODO) -- GDC | clinical__primary | |
| TCGA-AC-A62X | (TODO) -- GDC | clinical__primary | |
| TCGA-AC-A62Y | (TODO) -- GDC | clinical__primary | |
| TCGA-AC-A6IV | (TODO) -- GDC | clinical__primary | |
| TCGA-AC-A6IW | (TODO) -- GDC | clinical__primary | |
| TCGA-AC-A6IX | (TODO) -- GDC | clinical__primary | |
| TCGA-AC-A6NO | (TODO) -- GDC | clinical__primary | |
| TCGA-AC-A7VB | (TODO) -- GDC | clinical__primary | |
| TCGA-AC-A7VC | (TODO) -- GDC | clinical__primary | |
| TCGA-AC-A8OP | (TODO) -- GDC | clinical__primary | |
| TCGA-AC-A8OQ | (TODO) -- GDC | clinical__primary | |
| TCGA-AC-A8OR | (TODO) -- GDC | clinical__primary | |
| TCGA-AC-A8OS | (TODO) -- GDC | clinical__primary | |
| TCGA-AN-A03X | (TODO) -- GDC | clinical__primary | |
| TCGA-AN-A03Y | (TODO) -- GDC | clinical__primary | |
| TCGA-AN-A041 | (TODO) -- GDC | clinical__primary | |
| TCGA-AN-A046 | (TODO) -- GDC | clinical__primary | |
| TCGA-AN-A049 | (TODO) -- GDC | clinical__primary | |
| TCGA-AN-A04A | (TODO) -- GDC | clinical__primary | |
| TCGA-AN-A04C | (TODO) -- GDC | clinical__primary | |
| TCGA-AN-A04D | (TODO) -- GDC | clinical__primary | |
| TCGA-AN-A0AJ | (TODO) -- GDC | clinical__primary | |
| TCGA-AN-A0AK | (TODO) -- GDC | clinical__primary | |
| TCGA-AN-A0AL | (TODO) -- GDC | clinical__primary | |
| TCGA-AN-A0AM | (TODO) -- GDC | clinical__primary | |
| TCGA-AN-A0AR | (TODO) -- GDC | clinical__primary | |
| TCGA-AN-A0AS | (TODO) -- GDC | clinical__primary | |
| TCGA-AN-A0AT | (TODO) -- GDC | clinical__primary | |
| TCGA-AN-A0FD | (TODO) -- GDC | clinical__primary | |
| TCGA-AN-A0FF | (TODO) -- GDC | clinical__primary | |
| TCGA-AN-A0FJ | (TODO) -- GDC | clinical__primary | |
| TCGA-AN-A0FK | (TODO) -- GDC | clinical__primary | |
| TCGA-AN-A0FL | (TODO) -- GDC | clinical__primary | |
| TCGA-AN-A0FN | (TODO) -- GDC | clinical__primary | |
| TCGA-AN-A0FS | (TODO) -- GDC | clinical__primary | |
| TCGA-AN-A0FT | (TODO) -- GDC | clinical__primary | |
| TCGA-AN-A0FV | (TODO) -- GDC | clinical__primary | |
| TCGA-AN-A0FW | (TODO) -- GDC | clinical__primary | |
| TCGA-AN-A0FX | (TODO) -- GDC | clinical__primary | |
| TCGA-AN-A0FY | (TODO) -- GDC | clinical__primary | |
| TCGA-AN-A0FZ | (TODO) -- GDC | clinical__primary | |
| TCGA-AN-A0G0 | (TODO) -- GDC | clinical__primary | |
| TCGA-AN-A0XL | (TODO) -- GDC | clinical__primary | |
| TCGA-AN-A0XN | (TODO) -- GDC | clinical__primary | |
| TCGA-AN-A0XO | (TODO) -- GDC | clinical__primary | |
| TCGA-AN-A0XP | (TODO) -- GDC | clinical__primary | |
| TCGA-AN-A0XR | (TODO) -- GDC | clinical__primary | |
| TCGA-AN-A0XS | (TODO) -- GDC | clinical__primary | |
| TCGA-AN-A0XT | (TODO) -- GDC | clinical__primary | |
| TCGA-AN-A0XU | (TODO) -- GDC | clinical__primary | |
| TCGA-AN-A0XV | (TODO) -- GDC | clinical__primary | |
| TCGA-AN-A0XW | (TODO) -- GDC | clinical__primary | |
| TCGA-AO-A03L | (TODO) -- GDC | clinical__primary | |
| TCGA-AO-A03M | (TODO) -- GDC | clinical__primary | |
| TCGA-AO-A03N | (TODO) -- GDC | clinical__primary | |
| TCGA-AO-A03O | (TODO) -- GDC | clinical__primary | |
| TCGA-AO-A03P | (TODO) -- GDC | clinical__primary | |
| TCGA-AO-A03R | (TODO) -- GDC | clinical__primary | |
| TCGA-AO-A03T | (TODO) -- GDC | clinical__primary | |
| TCGA-AO-A03U | (TODO) -- GDC | clinical__primary | |
| TCGA-AO-A03V | (TODO) -- GDC | clinical__primary | |
| TCGA-AO-A0J2 | (TODO) -- GDC | clinical__primary | |
| TCGA-AO-A0J3 | (TODO) -- GDC | clinical__primary | |
| TCGA-AO-A0J4 | (TODO) -- GDC | clinical__primary | |
| TCGA-AO-A0J5 | (TODO) -- GDC | clinical__primary | |
| TCGA-AO-A0J6 | (TODO) -- GDC | clinical__primary | |
| TCGA-AO-A0J7 | (TODO) -- GDC | clinical__primary | |
| TCGA-AO-A0J8 | (TODO) -- GDC | clinical__primary | |
| TCGA-AO-A0J9 | (TODO) -- GDC | clinical__primary | |
| TCGA-AO-A0JA | (TODO) -- GDC | clinical__primary | |
| TCGA-AO-A0JB | (TODO) -- GDC | clinical__primary | |
| TCGA-AO-A0JC | (TODO) -- GDC | clinical__primary | |
| TCGA-AO-A0JD | (TODO) -- GDC | clinical__primary | |
| TCGA-AO-A0JE | (TODO) -- GDC | clinical__primary | |
| TCGA-AO-A0JF | (TODO) -- GDC | clinical__primary | |
| TCGA-AO-A0JG | (TODO) -- GDC | clinical__primary | |
| TCGA-AO-A0JI | (TODO) -- GDC | clinical__primary | |
| TCGA-AO-A0JJ | (TODO) -- GDC | clinical__primary | |
| TCGA-AO-A0JL | (TODO) -- GDC | clinical__primary | |
| TCGA-AO-A0JM | (TODO) -- GDC | clinical__primary | |
| TCGA-AO-A124 | (TODO) -- GDC | clinical__primary | |
| TCGA-AO-A125 | (TODO) -- GDC | clinical__primary | |
| TCGA-AO-A126 | (TODO) -- GDC | clinical__primary | |
| TCGA-AO-A128 | (TODO) -- GDC | clinical__primary | |
| TCGA-AO-A129 | (TODO) -- GDC | clinical__primary | |
| TCGA-AO-A12A | (TODO) -- GDC | clinical__primary | |
| TCGA-AO-A12B | (TODO) -- GDC | clinical__primary | |
| TCGA-AO-A12C | (TODO) -- GDC | clinical__primary | |
| TCGA-AO-A12D | (TODO) -- GDC | clinical__primary | |
| TCGA-AO-A12E | (TODO) -- GDC | clinical__primary | |
| TCGA-AO-A12F | (TODO) -- GDC | clinical__primary | |
| TCGA-AO-A12G | (TODO) -- GDC | clinical__primary | |
| TCGA-AO-A12H | (TODO) -- GDC | clinical__primary | |
| TCGA-AO-A1KO | (TODO) -- GDC | clinical__primary | |
| TCGA-AO-A1KP | (TODO) -- GDC | clinical__primary | |
| TCGA-AO-A1KQ | (TODO) -- GDC | clinical__primary | |
| TCGA-AO-A1KR | (TODO) -- GDC | clinical__primary | |
| TCGA-AO-A1KS | (TODO) -- GDC | clinical__primary | |
| TCGA-AO-A1KT | (TODO) -- GDC | clinical__primary | |
| TCGA-AQ-A04H | (TODO) -- GDC | clinical__primary | |
| TCGA-AQ-A04J | (TODO) -- GDC | clinical__primary | |
| TCGA-AQ-A04L | (TODO) -- GDC | clinical__primary | |
| TCGA-AQ-A0Y5 | (TODO) -- GDC | clinical__primary | |
| TCGA-AQ-A1H2 | (TODO) -- GDC | clinical__primary | |
| TCGA-AQ-A1H3 | (TODO) -- GDC | clinical__primary | |
| TCGA-AQ-A54N | (TODO) -- GDC | clinical__primary | |
| TCGA-AQ-A54O | (TODO) -- GDC | clinical__primary | |
| TCGA-AQ-A7U7 | (TODO) -- GDC | clinical__primary | |
| TCGA-AR-A0TP | (TODO) -- GDC | clinical__primary | |
| TCGA-AR-A0TQ | (TODO) -- GDC | clinical__primary | |
| TCGA-AR-A0TR | (TODO) -- GDC | clinical__primary | |
| TCGA-AR-A0TS | (TODO) -- GDC | clinical__primary | |
| TCGA-AR-A0TT | (TODO) -- GDC | clinical__primary | |
| TCGA-AR-A0TU | (TODO) -- GDC | clinical__primary | |
| TCGA-AR-A0TV | (TODO) -- GDC | clinical__primary | |
| TCGA-AR-A0TW | (TODO) -- GDC | clinical__primary | |
| TCGA-AR-A0TX | (TODO) -- GDC | clinical__primary | |
| TCGA-AR-A0TY | (TODO) -- GDC | clinical__primary | |
| TCGA-AR-A0TZ | (TODO) -- GDC | clinical__primary | |
| TCGA-AR-A0U0 | (TODO) -- GDC | clinical__primary | |
| TCGA-AR-A0U1 | (TODO) -- GDC | clinical__primary | |
| TCGA-AR-A0U2 | (TODO) -- GDC | clinical__primary | |
| TCGA-AR-A0U3 | (TODO) -- GDC | clinical__primary | |
| TCGA-AR-A0U4 | (TODO) -- GDC | clinical__primary | |
| TCGA-AR-A1AH | (TODO) -- GDC | clinical__primary | |
| TCGA-AR-A1AI | (TODO) -- GDC | clinical__primary | |
| TCGA-AR-A1AJ | (TODO) -- GDC | clinical__primary | |
| TCGA-AR-A1AK | (TODO) -- GDC | clinical__primary | |
| TCGA-AR-A1AL | (TODO) -- GDC | clinical__primary | |
| TCGA-AR-A1AM | (TODO) -- GDC | clinical__primary | |
| TCGA-AR-A1AN | (TODO) -- GDC | clinical__primary | |
| TCGA-AR-A1AO | (TODO) -- GDC | clinical__primary | |
| TCGA-AR-A1AP | (TODO) -- GDC | clinical__primary | |
| TCGA-AR-A1AQ | (TODO) -- GDC | clinical__primary | |
| TCGA-AR-A1AR | (TODO) -- GDC | clinical__primary | |
| TCGA-AR-A1AS | (TODO) -- GDC | clinical__primary | |
| TCGA-AR-A1AT | (TODO) -- GDC | clinical__primary | |
| TCGA-AR-A1AU | (TODO) -- GDC | clinical__primary | |
| TCGA-AR-A1AV | (TODO) -- GDC | clinical__primary | |
| TCGA-AR-A1AW | (TODO) -- GDC | clinical__primary | |
| TCGA-AR-A1AX | (TODO) -- GDC | clinical__primary | |
| TCGA-AR-A1AY | (TODO) -- GDC | clinical__primary | |
| TCGA-AR-A24H | (TODO) -- GDC | clinical__primary | |
| TCGA-AR-A24K | (TODO) -- GDC | clinical__primary | |
| TCGA-AR-A24L | (TODO) -- GDC | clinical__primary | |
| TCGA-AR-A24M | (TODO) -- GDC | clinical__primary | |
| TCGA-AR-A24N | (TODO) -- GDC | clinical__primary | |
| TCGA-AR-A24O | (TODO) -- GDC | clinical__primary | |
| TCGA-AR-A24P | (TODO) -- GDC | clinical__primary | |
| TCGA-AR-A24Q | (TODO) -- GDC | clinical__primary | |
| TCGA-AR-A24R | (TODO) -- GDC | clinical__primary | |
| TCGA-AR-A24S | (TODO) -- GDC | clinical__primary | |
| TCGA-AR-A24T | (TODO) -- GDC | clinical__primary | |
| TCGA-AR-A24U | (TODO) -- GDC | clinical__primary | |
| TCGA-AR-A24V | (TODO) -- GDC | clinical__primary | |
| TCGA-AR-A24W | (TODO) -- GDC | clinical__primary | |
| TCGA-AR-A24X | (TODO) -- GDC | clinical__primary | |
| TCGA-AR-A24Z | (TODO) -- GDC | clinical__primary | |
| TCGA-AR-A250 | (TODO) -- GDC | clinical__primary | |
| TCGA-AR-A251 | (TODO) -- GDC | clinical__primary | |
| TCGA-AR-A252 | (TODO) -- GDC | clinical__primary | |
| TCGA-AR-A254 | (TODO) -- GDC | clinical__primary | |
| TCGA-AR-A255 | (TODO) -- GDC | clinical__primary | |
| TCGA-AR-A256 | (TODO) -- GDC | clinical__primary | |
| TCGA-AR-A2LE | (TODO) -- GDC | clinical__primary | |
| TCGA-AR-A2LH | (TODO) -- GDC | clinical__primary | |
| TCGA-AR-A2LJ | (TODO) -- GDC | clinical__primary | |
| TCGA-AR-A2LK | (TODO) -- GDC | clinical__primary | |
| TCGA-AR-A2LL | (TODO) -- GDC | clinical__primary | |
| TCGA-AR-A2LM | (TODO) -- GDC | clinical__primary | |
| TCGA-AR-A2LN | (TODO) -- GDC | clinical__primary | |
| TCGA-AR-A2LO | (TODO) -- GDC | clinical__primary | |
| TCGA-AR-A2LQ | (TODO) -- GDC | clinical__primary | |
| TCGA-AR-A2LR | (TODO) -- GDC | clinical__primary | |
| TCGA-AR-A5QM | (TODO) -- GDC | clinical__primary | |
| TCGA-AR-A5QN | (TODO) -- GDC | clinical__primary | |
| TCGA-AR-A5QP | (TODO) -- GDC | clinical__primary | |
| TCGA-AR-A5QQ | (TODO) -- GDC | clinical__primary | |
| TCGA-B6-A0I1 | (TODO) -- GDC | clinical__primary | |
| TCGA-B6-A0I2 | (TODO) -- GDC | clinical__primary | |
| TCGA-B6-A0I5 | (TODO) -- GDC | clinical__primary | |
| TCGA-B6-A0I6 | (TODO) -- GDC | clinical__primary | |
| TCGA-B6-A0I8 | (TODO) -- GDC | clinical__primary | |
| TCGA-B6-A0I9 | (TODO) -- GDC | clinical__primary | |
| TCGA-B6-A0IA | (TODO) -- GDC | clinical__primary | |
| TCGA-B6-A0IB | (TODO) -- GDC | clinical__primary | |
| TCGA-B6-A0IC | (TODO) -- GDC | clinical__primary | |
| TCGA-B6-A0IE | (TODO) -- GDC | clinical__primary | |
| TCGA-B6-A0IG | (TODO) -- GDC | clinical__primary | |
| TCGA-B6-A0IH | (TODO) -- GDC | clinical__primary | |
| TCGA-B6-A0IJ | (TODO) -- GDC | clinical__primary | |
| TCGA-B6-A0IK | (TODO) -- GDC | clinical__primary | |
| TCGA-B6-A0IM | (TODO) -- GDC | clinical__primary | |
| TCGA-B6-A0IN | (TODO) -- GDC | clinical__primary | |
| TCGA-B6-A0IO | (TODO) -- GDC | clinical__primary | |
| TCGA-B6-A0IP | (TODO) -- GDC | clinical__primary | |
| TCGA-B6-A0IQ | (TODO) -- GDC | clinical__primary | |
| TCGA-B6-A0RE | (TODO) -- GDC | clinical__primary | |
| TCGA-B6-A0RG | (TODO) -- GDC | clinical__primary | |
| TCGA-B6-A0RH | (TODO) -- GDC | clinical__primary | |
| TCGA-B6-A0RI | (TODO) -- GDC | clinical__primary | |
| TCGA-B6-A0RL | (TODO) -- GDC | clinical__primary | |
| TCGA-B6-A0RM | (TODO) -- GDC | clinical__primary | |
| TCGA-B6-A0RN | (TODO) -- GDC | clinical__primary | |
| TCGA-B6-A0RO | (TODO) -- GDC | clinical__primary | |
| TCGA-B6-A0RP | (TODO) -- GDC | clinical__primary | |
| TCGA-B6-A0RQ | (TODO) -- GDC | clinical__primary | |
| TCGA-B6-A0RS | (TODO) -- GDC | clinical__primary | |
| TCGA-B6-A0RT | (TODO) -- GDC | clinical__primary | |
| TCGA-B6-A0RU | (TODO) -- GDC | clinical__primary | |
| TCGA-B6-A0RV | (TODO) -- GDC | clinical__primary | |
| TCGA-B6-A0WS | (TODO) -- GDC | clinical__primary | |
| TCGA-B6-A0WT | (TODO) -- GDC | clinical__primary | |
| TCGA-B6-A0WV | (TODO) -- GDC | clinical__primary | |
| TCGA-B6-A0WW | (TODO) -- GDC | clinical__primary | |
| TCGA-B6-A0WX | (TODO) -- GDC | clinical__primary | |
| TCGA-B6-A0WY | (TODO) -- GDC | clinical__primary | |
| TCGA-B6-A0WZ | (TODO) -- GDC | clinical__primary | |
| TCGA-B6-A0X0 | (TODO) -- GDC | clinical__primary | |
| TCGA-B6-A0X1 | (TODO) -- GDC | clinical__primary | |
| TCGA-B6-A0X4 | (TODO) -- GDC | clinical__primary | |
| TCGA-B6-A0X5 | (TODO) -- GDC | clinical__primary | |
| TCGA-B6-A0X7 | (TODO) -- GDC | clinical__primary | |
| TCGA-B6-A1KC | (TODO) -- GDC | clinical__primary | |
| TCGA-B6-A1KF | (TODO) -- GDC | clinical__primary | |
| TCGA-B6-A1KI | (TODO) -- GDC | clinical__primary | |
| TCGA-B6-A1KN | (TODO) -- GDC | clinical__primary | |
| TCGA-B6-A2IU | (TODO) -- GDC | clinical__primary | |
| TCGA-B6-A3ZX | (TODO) -- GDC | clinical__primary | |
| TCGA-B6-A400 | (TODO) -- GDC | clinical__primary | |
| TCGA-B6-A401 | (TODO) -- GDC | clinical__primary | |
| TCGA-B6-A402 | (TODO) -- GDC | clinical__primary | |
| TCGA-B6-A408 | (TODO) -- GDC | clinical__primary | |
| TCGA-B6-A409 | (TODO) -- GDC | clinical__primary | |
| TCGA-B6-A40B | (TODO) -- GDC | clinical__primary | |
| TCGA-B6-A40C | (TODO) -- GDC | clinical__primary | |
| TCGA-BH-A0AU | (TODO) -- GDC | clinical__primary | |
| TCGA-BH-A0AV | (TODO) -- GDC | clinical__primary | |
| TCGA-BH-A0AW | (TODO) -- GDC | clinical__primary | |
| TCGA-BH-A0AY | (TODO) -- GDC | clinical__primary | |
| TCGA-BH-A0AZ | (TODO) -- GDC | clinical__primary | |
| TCGA-BH-A0B0 | (TODO) -- GDC | clinical__primary | |
| TCGA-BH-A0B1 | (TODO) -- GDC | clinical__primary | |
| TCGA-BH-A0B3 | (TODO) -- GDC | clinical__primary | |
| TCGA-BH-A0B4 | (TODO) -- GDC | clinical__primary | |
| TCGA-BH-A0B5 | (TODO) -- GDC | clinical__primary | |
| TCGA-BH-A0B6 | (TODO) -- GDC | clinical__primary | |
| TCGA-BH-A0B7 | (TODO) -- GDC | clinical__primary | |
| TCGA-BH-A0B8 | (TODO) -- GDC | clinical__primary | |
| TCGA-BH-A0B9 | (TODO) -- GDC | clinical__primary | |
| TCGA-BH-A0BA | (TODO) -- GDC | clinical__primary | |
| TCGA-BH-A0BC | (TODO) -- GDC | clinical__primary | |
| TCGA-BH-A0BD | (TODO) -- GDC | clinical__primary | |
| TCGA-BH-A0BF | (TODO) -- GDC | clinical__primary | |
| TCGA-BH-A0BG | (TODO) -- GDC | clinical__primary | |
| TCGA-BH-A0BJ | (TODO) -- GDC | clinical__primary | |
| TCGA-BH-A0BL | (TODO) -- GDC | clinical__primary | |
| TCGA-BH-A0BM | (TODO) -- GDC | clinical__primary | |
| TCGA-BH-A0BO | (TODO) -- GDC | clinical__primary | |
| TCGA-BH-A0BP | (TODO) -- GDC | clinical__primary | |
| TCGA-BH-A0BQ | (TODO) -- GDC | clinical__primary | |
| TCGA-BH-A0BR | (TODO) -- GDC | clinical__primary | |
| TCGA-BH-A0BS | (TODO) -- GDC | clinical__primary | |
| TCGA-BH-A0BT | (TODO) -- GDC | clinical__primary | |
| TCGA-BH-A0BV | (TODO) -- GDC | clinical__primary | |
| TCGA-BH-A0BW | (TODO) -- GDC | clinical__primary | |
| TCGA-BH-A0BZ | (TODO) -- GDC | clinical__primary | |
| TCGA-BH-A0C0 | (TODO) -- GDC | clinical__primary | |
| TCGA-BH-A0C1 | (TODO) -- GDC | clinical__primary | |
| TCGA-BH-A0C3 | (TODO) -- GDC | clinical__primary | |
| TCGA-BH-A0C7 | (TODO) -- GDC | clinical__primary | |
| TCGA-BH-A0DD | (TODO) -- GDC | clinical__primary | |
| TCGA-BH-A0DE | (TODO) -- GDC | clinical__primary | |
| TCGA-BH-A0DG | (TODO) -- GDC | clinical__primary | |
| TCGA-BH-A0DH | (TODO) -- GDC | clinical__primary | |
| TCGA-BH-A0DI | (TODO) -- GDC | clinical__primary | |
| TCGA-BH-A0DK | (TODO) -- GDC | clinical__primary | |
| TCGA-BH-A0DL | (TODO) -- GDC | clinical__primary | |
| TCGA-BH-A0DO | (TODO) -- GDC | clinical__primary | |
| TCGA-BH-A0DP | (TODO) -- GDC | clinical__primary | |
| TCGA-BH-A0DQ | (TODO) -- GDC | clinical__primary | |
| TCGA-BH-A0DS | (TODO) -- GDC | clinical__primary | |
| TCGA-BH-A0DT | (TODO) -- GDC | clinical__primary | |
| TCGA-BH-A0DV | (TODO) -- GDC | clinical__primary | |
| TCGA-BH-A0DX | (TODO) -- GDC | clinical__primary | |
| TCGA-BH-A0DZ | (TODO) -- GDC | clinical__primary | |
| TCGA-BH-A0E0 | (TODO) -- GDC | clinical__primary | |
| TCGA-BH-A0E1 | (TODO) -- GDC | clinical__primary | |
| TCGA-BH-A0E2 | (TODO) -- GDC | clinical__primary | |
| TCGA-BH-A0E6 | (TODO) -- GDC | clinical__primary | |
| TCGA-BH-A0E7 | (TODO) -- GDC | clinical__primary | |
| TCGA-BH-A0E9 | (TODO) -- GDC | clinical__primary | |
| TCGA-BH-A0EA | (TODO) -- GDC | clinical__primary | |
| TCGA-BH-A0EB | (TODO) -- GDC | clinical__primary | |
| TCGA-BH-A0EE | (TODO) -- GDC | clinical__primary | |
| TCGA-BH-A0EI | (TODO) -- GDC | clinical__primary | |
| TCGA-BH-A0GY | (TODO) -- GDC | clinical__primary | |
| TCGA-BH-A0GZ | (TODO) -- GDC | clinical__primary | |
| TCGA-BH-A0H0 | (TODO) -- GDC | clinical__primary | |
| TCGA-BH-A0H3 | (TODO) -- GDC | clinical__primary | |
| TCGA-BH-A0H6 | (TODO) -- GDC | clinical__primary | |
| TCGA-BH-A0H7 | (TODO) -- GDC | clinical__primary | |
| TCGA-BH-A0H9 | (TODO) -- GDC | clinical__primary | |
| TCGA-BH-A0HA | (TODO) -- GDC | clinical__primary | |
| TCGA-BH-A0HB | (TODO) -- GDC | clinical__primary | |
| TCGA-BH-A0HF | (TODO) -- GDC | clinical__primary | |
| TCGA-BH-A0HI | (TODO) -- GDC | clinical__primary | |
| TCGA-BH-A0HK | (TODO) -- GDC | clinical__primary | |
| TCGA-BH-A0HL | (TODO) -- GDC | clinical__primary | |
| TCGA-BH-A0HN | (TODO) -- GDC | clinical__primary | |
| TCGA-BH-A0HO | (TODO) -- GDC | clinical__primary | |
| TCGA-BH-A0HP | (TODO) -- GDC | clinical__primary | |
| TCGA-BH-A0HQ | (TODO) -- GDC | clinical__primary | |
| TCGA-BH-A0HU | (TODO) -- GDC | clinical__primary | |
| TCGA-BH-A0HW | (TODO) -- GDC | clinical__primary | |
| TCGA-BH-A0HX | (TODO) -- GDC | clinical__primary | |
| TCGA-BH-A0HY | (TODO) -- GDC | clinical__primary | |
| TCGA-BH-A0RX | (TODO) -- GDC | clinical__primary | |
| TCGA-BH-A0W3 | (TODO) -- GDC | clinical__primary | |
| TCGA-BH-A0W4 | (TODO) -- GDC | clinical__primary | |
| TCGA-BH-A0W5 | (TODO) -- GDC | clinical__primary | |
| TCGA-BH-A0W7 | (TODO) -- GDC | clinical__primary | |
| TCGA-BH-A0WA | (TODO) -- GDC | clinical__primary | |
| TCGA-BH-A18F | (TODO) -- GDC | clinical__primary | |
| TCGA-BH-A18G | (TODO) -- GDC | clinical__primary | |
| TCGA-BH-A18H | (TODO) -- GDC | clinical__primary | |
| TCGA-BH-A18I | (TODO) -- GDC | clinical__primary | |
| TCGA-BH-A18J | (TODO) -- GDC | clinical__primary | |
| TCGA-BH-A18K | (TODO) -- GDC | clinical__primary | |
| TCGA-BH-A18L | (TODO) -- GDC | clinical__primary | |
| TCGA-BH-A18M | (TODO) -- GDC | clinical__primary | |
| TCGA-BH-A18N | (TODO) -- GDC | clinical__primary | |
| TCGA-BH-A18P | (TODO) -- GDC | clinical__primary | |
| TCGA-BH-A18Q | (TODO) -- GDC | clinical__primary | |
| TCGA-BH-A18R | (TODO) -- GDC | clinical__primary | |
| TCGA-BH-A18S | (TODO) -- GDC | clinical__primary | |
| TCGA-BH-A18T | (TODO) -- GDC | clinical__primary | |
| TCGA-BH-A18U | (TODO) -- GDC | clinical__primary | |
| TCGA-BH-A18V | (TODO) -- GDC | clinical__primary | |
| TCGA-BH-A1EN | (TODO) -- GDC | clinical__primary | |
| TCGA-BH-A1EO | (TODO) -- GDC | clinical__primary | |
| TCGA-BH-A1ES | (TODO) -- GDC | clinical__primary | |
| TCGA-BH-A1ET | (TODO) -- GDC | clinical__primary | |
| TCGA-BH-A1EU | (TODO) -- GDC | clinical__primary | |
| TCGA-BH-A1EV | (TODO) -- GDC | clinical__primary | |
| TCGA-BH-A1EW | (TODO) -- GDC | clinical__primary | |
| TCGA-BH-A1EX | (TODO) -- GDC | clinical__primary | |
| TCGA-BH-A1EY | (TODO) -- GDC | clinical__primary | |
| TCGA-BH-A1F0 | (TODO) -- GDC | clinical__primary | |
| TCGA-BH-A1F2 | (TODO) -- GDC | clinical__primary | |
| TCGA-BH-A1F5 | (TODO) -- GDC | clinical__primary | |
| TCGA-BH-A1F6 | (TODO) -- GDC | clinical__primary | |
| TCGA-BH-A1F8 | (TODO) -- GDC | clinical__primary | |
| TCGA-BH-A1FB | (TODO) -- GDC | clinical__primary | |
| TCGA-BH-A1FC | (TODO) -- GDC | clinical__primary | |
| TCGA-BH-A1FD | (TODO) -- GDC | clinical__primary | |
| TCGA-BH-A1FE | (TODO) -- GDC | clinical__primary | |
| TCGA-BH-A1FG | (TODO) -- GDC | clinical__primary | |
| TCGA-BH-A1FH | (TODO) -- GDC | clinical__primary | |
| TCGA-BH-A1FJ | (TODO) -- GDC | clinical__primary | |
| TCGA-BH-A1FL | (TODO) -- GDC | clinical__primary | |
| TCGA-BH-A1FM | (TODO) -- GDC | clinical__primary | |
| TCGA-BH-A1FN | (TODO) -- GDC | clinical__primary | |
| TCGA-BH-A1FR | (TODO) -- GDC | clinical__primary | |
| TCGA-BH-A1FU | (TODO) -- GDC | clinical__primary | |
| TCGA-BH-A201 | (TODO) -- GDC | clinical__primary | |
| TCGA-BH-A202 | (TODO) -- GDC | clinical__primary | |
| TCGA-BH-A203 | (TODO) -- GDC | clinical__primary | |
| TCGA-BH-A204 | (TODO) -- GDC | clinical__primary | |
| TCGA-BH-A208 | (TODO) -- GDC | clinical__primary | |
| TCGA-BH-A209 | (TODO) -- GDC | clinical__primary | |
| TCGA-BH-A28O | (TODO) -- GDC | clinical__primary | |
| TCGA-BH-A28Q | (TODO) -- GDC | clinical__primary | |
| TCGA-BH-A2L8 | (TODO) -- GDC | clinical__primary | |
| TCGA-BH-A42T | (TODO) -- GDC | clinical__primary | |
| TCGA-BH-A42U | (TODO) -- GDC | clinical__primary | |
| TCGA-BH-A42V | (TODO) -- GDC | clinical__primary | |
| TCGA-BH-A5IZ | (TODO) -- GDC | clinical__primary | |
| TCGA-BH-A5J0 | (TODO) -- GDC | clinical__primary | |
| TCGA-BH-A6R8 | (TODO) -- GDC | clinical__primary | |
| TCGA-BH-A6R9 | (TODO) -- GDC | clinical__primary | |
| TCGA-BH-A8FY | (TODO) -- GDC | clinical__primary | |
| TCGA-BH-A8FZ | (TODO) -- GDC | clinical__primary | |
| TCGA-BH-A8G0 | (TODO) -- GDC | clinical__primary | |
| TCGA-BH-AB28 | (TODO) -- GDC | clinical__primary | |
| TCGA-C8-A12K | (TODO) -- GDC | clinical__primary | |
| TCGA-C8-A12L | (TODO) -- GDC | clinical__primary | |
| TCGA-C8-A12M | (TODO) -- GDC | clinical__primary | |
| TCGA-C8-A12N | (TODO) -- GDC | clinical__primary | |
| TCGA-C8-A12O | (TODO) -- GDC | clinical__primary | |
| TCGA-C8-A12P | (TODO) -- GDC | clinical__primary | |
| TCGA-C8-A12Q | (TODO) -- GDC | clinical__primary | |
| TCGA-C8-A12T | (TODO) -- GDC | clinical__primary | |
| TCGA-C8-A12U | (TODO) -- GDC | clinical__primary | |
| TCGA-C8-A12V | (TODO) -- GDC | clinical__primary | |
| TCGA-C8-A12W | (TODO) -- GDC | clinical__primary | |
| TCGA-C8-A12X | (TODO) -- GDC | clinical__primary | |
| TCGA-C8-A12Y | (TODO) -- GDC | clinical__primary | |
| TCGA-C8-A12Z | (TODO) -- GDC | clinical__primary | |
| TCGA-C8-A130 | (TODO) -- GDC | clinical__primary | |
| TCGA-C8-A131 | (TODO) -- GDC | clinical__primary | |
| TCGA-C8-A132 | (TODO) -- GDC | clinical__primary | |
| TCGA-C8-A133 | (TODO) -- GDC | clinical__primary | |
| TCGA-C8-A134 | (TODO) -- GDC | clinical__primary | |
| TCGA-C8-A135 | (TODO) -- GDC | clinical__primary | |
| TCGA-C8-A137 | (TODO) -- GDC | clinical__primary | |
| TCGA-C8-A138 | (TODO) -- GDC | clinical__primary | |
| TCGA-C8-A1HE | (TODO) -- GDC | clinical__primary | |
| TCGA-C8-A1HF | (TODO) -- GDC | clinical__primary | |
| TCGA-C8-A1HG | (TODO) -- GDC | clinical__primary | |
| TCGA-C8-A1HI | (TODO) -- GDC | clinical__primary | |
| TCGA-C8-A1HJ | (TODO) -- GDC | clinical__primary | |
| TCGA-C8-A1HK | (TODO) -- GDC | clinical__primary | |
| TCGA-C8-A1HL | (TODO) -- GDC | clinical__primary | |
| TCGA-C8-A1HM | (TODO) -- GDC | clinical__primary | |
| TCGA-C8-A1HN | (TODO) -- GDC | clinical__primary | |
| TCGA-C8-A1HO | (TODO) -- GDC | clinical__primary | |
| TCGA-C8-A26V | (TODO) -- GDC | clinical__primary | |
| TCGA-C8-A26W | (TODO) -- GDC | clinical__primary | |
| TCGA-C8-A26X | (TODO) -- GDC | clinical__primary | |
| TCGA-C8-A26Y | (TODO) -- GDC | clinical__primary | |
| TCGA-C8-A26Z | (TODO) -- GDC | clinical__primary | |
| TCGA-C8-A273 | (TODO) -- GDC | clinical__primary | |
| TCGA-C8-A274 | (TODO) -- GDC | clinical__primary | |
| TCGA-C8-A275 | (TODO) -- GDC | clinical__primary | |
| TCGA-C8-A278 | (TODO) -- GDC | clinical__primary | |
| TCGA-C8-A27A | (TODO) -- GDC | clinical__primary | |
| TCGA-C8-A27B | (TODO) -- GDC | clinical__primary | |
| TCGA-C8-A3M7 | (TODO) -- GDC | clinical__primary | |
| TCGA-C8-A3M8 | (TODO) -- GDC | clinical__primary | |
| TCGA-C8-A8HP | (TODO) -- GDC | clinical__primary | |
| TCGA-C8-A8HQ | (TODO) -- GDC | clinical__primary | |
| TCGA-C8-A8HR | (TODO) -- GDC | clinical__primary | |
| TCGA-C8-A9FZ | (TODO) -- GDC | clinical__primary | |
| TCGA-D8-A13Y | (TODO) -- GDC | clinical__primary | |
| TCGA-D8-A13Z | (TODO) -- GDC | clinical__primary | |
| TCGA-D8-A140 | (TODO) -- GDC | clinical__primary | |
| TCGA-D8-A141 | (TODO) -- GDC | clinical__primary | |
| TCGA-D8-A142 | (TODO) -- GDC | clinical__primary | |
| TCGA-D8-A143 | (TODO) -- GDC | clinical__primary | |
| TCGA-D8-A145 | (TODO) -- GDC | clinical__primary | |
| TCGA-D8-A146 | (TODO) -- GDC | clinical__primary | |
| TCGA-D8-A147 | (TODO) -- GDC | clinical__primary | |
| TCGA-D8-A1J8 | (TODO) -- GDC | clinical__primary | |
| TCGA-D8-A1J9 | (TODO) -- GDC | clinical__primary | |
| TCGA-D8-A1JA | (TODO) -- GDC | clinical__primary | |
| TCGA-D8-A1JB | (TODO) -- GDC | clinical__primary | |
| TCGA-D8-A1JC | (TODO) -- GDC | clinical__primary | |
| TCGA-D8-A1JD | (TODO) -- GDC | clinical__primary | |
| TCGA-D8-A1JE | (TODO) -- GDC | clinical__primary | |
| TCGA-D8-A1JF | (TODO) -- GDC | clinical__primary | |
| TCGA-D8-A1JG | (TODO) -- GDC | clinical__primary | |
| TCGA-D8-A1JH | (TODO) -- GDC | clinical__primary | |
| TCGA-D8-A1JI | (TODO) -- GDC | clinical__primary | |
| TCGA-D8-A1JJ | (TODO) -- GDC | clinical__primary | |
| TCGA-D8-A1JK | (TODO) -- GDC | clinical__primary | |
| TCGA-D8-A1JL | (TODO) -- GDC | clinical__primary | |
| TCGA-D8-A1JM | (TODO) -- GDC | clinical__primary | |
| TCGA-D8-A1JN | (TODO) -- GDC | clinical__primary | |
| TCGA-D8-A1JP | (TODO) -- GDC | clinical__primary | |
| TCGA-D8-A1JS | (TODO) -- GDC | clinical__primary | |
| TCGA-D8-A1JT | (TODO) -- GDC | clinical__primary | |
| TCGA-D8-A1JU | (TODO) -- GDC | clinical__primary | |
| TCGA-D8-A1X5 | (TODO) -- GDC | clinical__primary | |
| TCGA-D8-A1X6 | (TODO) -- GDC | clinical__primary | |
| TCGA-D8-A1X7 | (TODO) -- GDC | clinical__primary | |
| TCGA-D8-A1X8 | (TODO) -- GDC | clinical__primary | |
| TCGA-D8-A1X9 | (TODO) -- GDC | clinical__primary | |
| TCGA-D8-A1XA | (TODO) -- GDC | clinical__primary | |
| TCGA-D8-A1XB | (TODO) -- GDC | clinical__primary | |
| TCGA-D8-A1XC | (TODO) -- GDC | clinical__primary | |
| TCGA-D8-A1XD | (TODO) -- GDC | clinical__primary | |
| TCGA-D8-A1XF | (TODO) -- GDC | clinical__primary | |
| TCGA-D8-A1XG | (TODO) -- GDC | clinical__primary | |
| TCGA-D8-A1XJ | (TODO) -- GDC | clinical__primary | |
| TCGA-D8-A1XK | (TODO) -- GDC | clinical__primary | |
| TCGA-D8-A1XL | (TODO) -- GDC | clinical__primary | |
| TCGA-D8-A1XM | (TODO) -- GDC | clinical__primary | |
| TCGA-D8-A1XO | (TODO) -- GDC | clinical__primary | |
| TCGA-D8-A1XQ | (TODO) -- GDC | clinical__primary | |
| TCGA-D8-A1XR | (TODO) -- GDC | clinical__primary | |
| TCGA-D8-A1XS | (TODO) -- GDC | clinical__primary | |
| TCGA-D8-A1XT | (TODO) -- GDC | clinical__primary | |
| TCGA-D8-A1XU | (TODO) -- GDC | clinical__primary | |
| TCGA-D8-A1XV | (TODO) -- GDC | clinical__primary | |
| TCGA-D8-A1XW | (TODO) -- GDC | clinical__primary | |
| TCGA-D8-A1XY | (TODO) -- GDC | clinical__primary | |
| TCGA-D8-A1XZ | (TODO) -- GDC | clinical__primary | |
| TCGA-D8-A1Y0 | (TODO) -- GDC | clinical__primary | |
| TCGA-D8-A1Y1 | (TODO) -- GDC | clinical__primary | |
| TCGA-D8-A1Y2 | (TODO) -- GDC | clinical__primary | |
| TCGA-D8-A1Y3 | (TODO) -- GDC | clinical__primary | |
| TCGA-D8-A27E | (TODO) -- GDC | clinical__primary | |
| TCGA-D8-A27F | (TODO) -- GDC | clinical__primary | |
| TCGA-D8-A27G | (TODO) -- GDC | clinical__primary | |
| TCGA-D8-A27H | (TODO) -- GDC | clinical__primary | |
| TCGA-D8-A27I | (TODO) -- GDC | clinical__primary | |
| TCGA-D8-A27K | (TODO) -- GDC | clinical__primary | |
| TCGA-D8-A27L | (TODO) -- GDC | clinical__primary | |
| TCGA-D8-A27M | (TODO) -- GDC | clinical__primary | |
| TCGA-D8-A27N | (TODO) -- GDC | clinical__primary | |
| TCGA-D8-A27P | (TODO) -- GDC | clinical__primary | |
| TCGA-D8-A27R | (TODO) -- GDC | clinical__primary | |
| TCGA-D8-A27T | (TODO) -- GDC | clinical__primary | |
| TCGA-D8-A27V | (TODO) -- GDC | clinical__primary | |
| TCGA-D8-A27W | (TODO) -- GDC | clinical__primary | |
| TCGA-D8-A3Z5 | (TODO) -- GDC | clinical__primary | |
| TCGA-D8-A3Z6 | (TODO) -- GDC | clinical__primary | |
| TCGA-D8-A4Z1 | (TODO) -- GDC | clinical__primary | |
| TCGA-D8-A73U | (TODO) -- GDC | clinical__primary | |
| TCGA-D8-A73W | (TODO) -- GDC | clinical__primary | |
| TCGA-D8-A73X | (TODO) -- GDC | clinical__primary | |
| TCGA-E2-A105 | (TODO) -- GDC | clinical__primary | |
| TCGA-E2-A106 | (TODO) -- GDC | clinical__primary | |
| TCGA-E2-A107 | (TODO) -- GDC | clinical__primary | |
| TCGA-E2-A108 | (TODO) -- GDC | clinical__primary | |
| TCGA-E2-A109 | (TODO) -- GDC | clinical__primary | |
| TCGA-E2-A10A | (TODO) -- GDC | clinical__primary | |
| TCGA-E2-A10B | (TODO) -- GDC | clinical__primary | |
| TCGA-E2-A10C | (TODO) -- GDC | clinical__primary | |
| TCGA-E2-A10E | (TODO) -- GDC | clinical__primary | |
| TCGA-E2-A10F | (TODO) -- GDC | clinical__primary | |
| TCGA-E2-A14N | (TODO) -- GDC | clinical__primary | |
| TCGA-E2-A14O | (TODO) -- GDC | clinical__primary | |
| TCGA-E2-A14P | (TODO) -- GDC | clinical__primary | |
| TCGA-E2-A14Q | (TODO) -- GDC | clinical__primary | |
| TCGA-E2-A14R | (TODO) -- GDC | clinical__primary | |
| TCGA-E2-A14S | (TODO) -- GDC | clinical__primary | |
| TCGA-E2-A14T | (TODO) -- GDC | clinical__primary | |
| TCGA-E2-A14U | (TODO) -- GDC | clinical__primary | |
| TCGA-E2-A14V | (TODO) -- GDC | clinical__primary | |
| TCGA-E2-A14W | (TODO) -- GDC | clinical__primary | |
| TCGA-E2-A14X | (TODO) -- GDC | clinical__primary | |
| TCGA-E2-A14Y | (TODO) -- GDC | clinical__primary | |
| TCGA-E2-A14Z | (TODO) -- GDC | clinical__primary | |
| TCGA-E2-A150 | (TODO) -- GDC | clinical__primary | |
| TCGA-E2-A152 | (TODO) -- GDC | clinical__primary | |
| TCGA-E2-A153 | (TODO) -- GDC | clinical__primary | |
| TCGA-E2-A154 | (TODO) -- GDC | clinical__primary | |
| TCGA-E2-A155 | (TODO) -- GDC | clinical__primary | |
| TCGA-E2-A156 | (TODO) -- GDC | clinical__primary | |
| TCGA-E2-A158 | (TODO) -- GDC | clinical__primary | |
| TCGA-E2-A159 | (TODO) -- GDC | clinical__primary | |
| TCGA-E2-A15A | (TODO) -- GDC | clinical__primary | |
| TCGA-E2-A15C | (TODO) -- GDC | clinical__primary | |
| TCGA-E2-A15D | (TODO) -- GDC | clinical__primary | |
| TCGA-E2-A15E | (TODO) -- GDC | clinical__primary | |
| TCGA-E2-A15F | (TODO) -- GDC | clinical__primary | |
| TCGA-E2-A15G | (TODO) -- GDC | clinical__primary | |
| TCGA-E2-A15H | (TODO) -- GDC | clinical__primary | |
| TCGA-E2-A15I | (TODO) -- GDC | clinical__primary | |
| TCGA-E2-A15J | (TODO) -- GDC | clinical__primary | |
| TCGA-E2-A15K | (TODO) -- GDC | clinical__primary | |
| TCGA-E2-A15L | (TODO) -- GDC | clinical__primary | |
| TCGA-E2-A15M | (TODO) -- GDC | clinical__primary | |
| TCGA-E2-A15O | (TODO) -- GDC | clinical__primary | |
| TCGA-E2-A15P | (TODO) -- GDC | clinical__primary | |
| TCGA-E2-A15R | (TODO) -- GDC | clinical__primary | |
| TCGA-E2-A15S | (TODO) -- GDC | clinical__primary | |
| TCGA-E2-A15T | (TODO) -- GDC | clinical__primary | |
| TCGA-E2-A1AZ | (TODO) -- GDC | clinical__primary | |
| TCGA-E2-A1B0 | (TODO) -- GDC | clinical__primary | |
| TCGA-E2-A1B1 | (TODO) -- GDC | clinical__primary | |
| TCGA-E2-A1B4 | (TODO) -- GDC | clinical__primary | |
| TCGA-E2-A1B5 | (TODO) -- GDC | clinical__primary | |
| TCGA-E2-A1B6 | (TODO) -- GDC | clinical__primary | |
| TCGA-E2-A1BC | (TODO) -- GDC | clinical__primary | |
| TCGA-E2-A1BD | (TODO) -- GDC | clinical__primary | |
| TCGA-E2-A1IE | (TODO) -- GDC | clinical__primary | |
| TCGA-E2-A1IF | (TODO) -- GDC | clinical__primary | |
| TCGA-E2-A1IG | (TODO) -- GDC | clinical__primary | |
| TCGA-E2-A1IH | (TODO) -- GDC | clinical__primary | |
| TCGA-E2-A1II | (TODO) -- GDC | clinical__primary | |
| TCGA-E2-A1IJ | (TODO) -- GDC | clinical__primary | |
| TCGA-E2-A1IK | (TODO) -- GDC | clinical__primary | |
| TCGA-E2-A1IL | (TODO) -- GDC | clinical__primary | |
| TCGA-E2-A1IN | (TODO) -- GDC | clinical__primary | |
| TCGA-E2-A1IO | (TODO) -- GDC | clinical__primary | |
| TCGA-E2-A1IU | (TODO) -- GDC | clinical__primary | |
| TCGA-E2-A1L6 | (TODO) -- GDC | clinical__primary | |
| TCGA-E2-A1L7 | (TODO) -- GDC | clinical__primary | |
| TCGA-E2-A1L8 | (TODO) -- GDC | clinical__primary | |
| TCGA-E2-A1L9 | (TODO) -- GDC | clinical__primary | |
| TCGA-E2-A1LA | (TODO) -- GDC | clinical__primary | |
| TCGA-E2-A1LB | (TODO) -- GDC | clinical__primary | |
| TCGA-E2-A1LE | (TODO) -- GDC | clinical__primary | |
| TCGA-E2-A1LG | (TODO) -- GDC | clinical__primary | |
| TCGA-E2-A1LH | (TODO) -- GDC | clinical__primary | |
| TCGA-E2-A1LI | (TODO) -- GDC | clinical__primary | |
| TCGA-E2-A1LK | (TODO) -- GDC | clinical__primary | |
| TCGA-E2-A1LL | (TODO) -- GDC | clinical__primary | |
| TCGA-E2-A1LS | (TODO) -- GDC | clinical__primary | |
| TCGA-E2-A2P5 | (TODO) -- GDC | clinical__primary | |
| TCGA-E2-A2P6 | (TODO) -- GDC | clinical__primary | |
| TCGA-E2-A3DX | (TODO) -- GDC | clinical__primary | |
| TCGA-E2-A56Z | (TODO) -- GDC | clinical__primary | |
| TCGA-E2-A570 | (TODO) -- GDC | clinical__primary | |
| TCGA-E2-A572 | (TODO) -- GDC | clinical__primary | |
| TCGA-E2-A573 | (TODO) -- GDC | clinical__primary | |
| TCGA-E2-A574 | (TODO) -- GDC | clinical__primary | |
| TCGA-E2-A576 | (TODO) -- GDC | clinical__primary | |
| TCGA-E2-A9RU | (TODO) -- GDC | clinical__primary | |
| TCGA-E9-A1N3 | (TODO) -- GDC | clinical__primary | |
| TCGA-E9-A1N4 | (TODO) -- GDC | clinical__primary | |
| TCGA-E9-A1N5 | (TODO) -- GDC | clinical__primary | |
| TCGA-E9-A1N6 | (TODO) -- GDC | clinical__primary | |
| TCGA-E9-A1N8 | (TODO) -- GDC | clinical__primary | |
| TCGA-E9-A1N9 | (TODO) -- GDC | clinical__primary | |
| TCGA-E9-A1NA | (TODO) -- GDC | clinical__primary | |
| TCGA-E9-A1NC | (TODO) -- GDC | clinical__primary | |
| TCGA-E9-A1ND | (TODO) -- GDC | clinical__primary | |
| TCGA-E9-A1NE | (TODO) -- GDC | clinical__primary | |
| TCGA-E9-A1NF | (TODO) -- GDC | clinical__primary | |
| TCGA-E9-A1NG | (TODO) -- GDC | clinical__primary | |
| TCGA-E9-A1NH | (TODO) -- GDC | clinical__primary | |
| TCGA-E9-A1NI | (TODO) -- GDC | clinical__primary | |
| TCGA-E9-A1QZ | (TODO) -- GDC | clinical__primary | |
| TCGA-E9-A1R0 | (TODO) -- GDC | clinical__primary | |
| TCGA-E9-A1R2 | (TODO) -- GDC | clinical__primary | |
| TCGA-E9-A1R3 | (TODO) -- GDC | clinical__primary | |
| TCGA-E9-A1R4 | (TODO) -- GDC | clinical__primary | |
| TCGA-E9-A1R5 | (TODO) -- GDC | clinical__primary | |
| TCGA-E9-A1R6 | (TODO) -- GDC | clinical__primary | |
| TCGA-E9-A1R7 | (TODO) -- GDC | clinical__primary | |
| TCGA-E9-A1RA | (TODO) -- GDC | clinical__primary | |
| TCGA-E9-A1RB | (TODO) -- GDC | clinical__primary | |
| TCGA-E9-A1RC | (TODO) -- GDC | clinical__primary | |
| TCGA-E9-A1RD | (TODO) -- GDC | clinical__primary | |
| TCGA-E9-A1RE | (TODO) -- GDC | clinical__primary | |
| TCGA-E9-A1RF | (TODO) -- GDC | clinical__primary | |
| TCGA-E9-A1RG | (TODO) -- GDC | clinical__primary | |
| TCGA-E9-A1RH | (TODO) -- GDC | clinical__primary | |
| TCGA-E9-A1RI | (TODO) -- GDC | clinical__primary | |
| TCGA-E9-A226 | (TODO) -- GDC | clinical__primary | |
| TCGA-E9-A227 | (TODO) -- GDC | clinical__primary | |
| TCGA-E9-A228 | (TODO) -- GDC | clinical__primary | |
| TCGA-E9-A229 | (TODO) -- GDC | clinical__primary | |
| TCGA-E9-A22A | (TODO) -- GDC | clinical__primary | |
| TCGA-E9-A22B | (TODO) -- GDC | clinical__primary | |
| TCGA-E9-A22D | (TODO) -- GDC | clinical__primary | |
| TCGA-E9-A22E | (TODO) -- GDC | clinical__primary | |
| TCGA-E9-A22G | (TODO) -- GDC | clinical__primary | |
| TCGA-E9-A22H | (TODO) -- GDC | clinical__primary | |
| TCGA-E9-A243 | (TODO) -- GDC | clinical__primary | |
| TCGA-E9-A244 | (TODO) -- GDC | clinical__primary | |
| TCGA-E9-A245 | (TODO) -- GDC | clinical__primary | |
| TCGA-E9-A247 | (TODO) -- GDC | clinical__primary | |
| TCGA-E9-A248 | (TODO) -- GDC | clinical__primary | |
| TCGA-E9-A249 | (TODO) -- GDC | clinical__primary | |
| TCGA-E9-A24A | (TODO) -- GDC | clinical__primary | |
| TCGA-E9-A295 | (TODO) -- GDC | clinical__primary | |
| TCGA-E9-A2JS | (TODO) -- GDC | clinical__primary | |
| TCGA-E9-A2JT | (TODO) -- GDC | clinical__primary | |
| TCGA-E9-A3HO | (TODO) -- GDC | clinical__primary | |
| TCGA-E9-A3Q9 | (TODO) -- GDC | clinical__primary | |
| TCGA-E9-A3QA | (TODO) -- GDC | clinical__primary | |
| TCGA-E9-A3X8 | (TODO) -- GDC | clinical__primary | |
| TCGA-E9-A54X | (TODO) -- GDC | clinical__primary | |
| TCGA-E9-A54Y | (TODO) -- GDC | clinical__primary | |
| TCGA-E9-A5FK | (TODO) -- GDC | clinical__primary | |
| TCGA-E9-A5FL | (TODO) -- GDC | clinical__primary | |
| TCGA-E9-A5UO | (TODO) -- GDC | clinical__primary | |
| TCGA-E9-A5UP | (TODO) -- GDC | clinical__primary | |
| TCGA-E9-A6HE | (TODO) -- GDC | clinical__primary | |
| TCGA-EW-A1IW | (TODO) -- GDC | clinical__primary | |
| TCGA-EW-A1IX | (TODO) -- GDC | clinical__primary | |
| TCGA-EW-A1IY | (TODO) -- GDC | clinical__primary | |
| TCGA-EW-A1IZ | (TODO) -- GDC | clinical__primary | |
| TCGA-EW-A1J1 | (TODO) -- GDC | clinical__primary | |
| TCGA-EW-A1J2 | (TODO) -- GDC | clinical__primary | |
| TCGA-EW-A1J3 | (TODO) -- GDC | clinical__primary | |
| TCGA-EW-A1J5 | (TODO) -- GDC | clinical__primary | |
| TCGA-EW-A1J6 | (TODO) -- GDC | clinical__primary | |
| TCGA-EW-A1OV | (TODO) -- GDC | clinical__primary | |
| TCGA-EW-A1OW | (TODO) -- GDC | clinical__primary | |
| TCGA-EW-A1OX | (TODO) -- GDC | clinical__primary | |
| TCGA-EW-A1OY | (TODO) -- GDC | clinical__primary | |
| TCGA-EW-A1OZ | (TODO) -- GDC | clinical__primary | |
| TCGA-EW-A1P0 | (TODO) -- GDC | clinical__primary | |
| TCGA-EW-A1P1 | (TODO) -- GDC | clinical__primary | |
| TCGA-EW-A1P3 | (TODO) -- GDC | clinical__primary | |
| TCGA-EW-A1P4 | (TODO) -- GDC | clinical__primary | |
| TCGA-EW-A1P5 | (TODO) -- GDC | clinical__primary | |
| TCGA-EW-A1P6 | (TODO) -- GDC | clinical__primary | |
| TCGA-EW-A1P7 | (TODO) -- GDC | clinical__primary | |
| TCGA-EW-A1P8 | (TODO) -- GDC | clinical__primary | |
| TCGA-EW-A1PA | (TODO) -- GDC | clinical__primary | |
| TCGA-EW-A1PB | (TODO) -- GDC | clinical__primary | |
| TCGA-EW-A1PC | (TODO) -- GDC | clinical__primary | |
| TCGA-EW-A1PD | (TODO) -- GDC | clinical__primary | |
| TCGA-EW-A1PE | (TODO) -- GDC | clinical__primary | |
| TCGA-EW-A1PF | (TODO) -- GDC | clinical__primary | |
| TCGA-EW-A1PG | (TODO) -- GDC | clinical__primary | |
| TCGA-EW-A1PH | (TODO) -- GDC | clinical__primary | |
| TCGA-EW-A2FR | (TODO) -- GDC | clinical__primary | |
| TCGA-EW-A2FS | (TODO) -- GDC | clinical__primary | |
| TCGA-EW-A2FV | (TODO) -- GDC | clinical__primary | |
| TCGA-EW-A2FW | (TODO) -- GDC | clinical__primary | |
| TCGA-EW-A3E8 | (TODO) -- GDC | clinical__primary | |
| TCGA-EW-A3U0 | (TODO) -- GDC | clinical__primary | |
| TCGA-EW-A423 | (TODO) -- GDC | clinical__primary | |
| TCGA-EW-A424 | (TODO) -- GDC | clinical__primary | |
| TCGA-EW-A6S9 | (TODO) -- GDC | clinical__primary | |
| TCGA-EW-A6SA | (TODO) -- GDC | clinical__primary | |
| TCGA-EW-A6SB | (TODO) -- GDC | clinical__primary | |
| TCGA-EW-A6SC | (TODO) -- GDC | clinical__primary | |
| TCGA-EW-A6SD | (TODO) -- GDC | clinical__primary | |
| TCGA-GI-A2C8 | (TODO) -- GDC | clinical__primary | |
| TCGA-GI-A2C9 | (TODO) -- GDC | clinical__primary | |
| TCGA-GM-A2D9 | (TODO) -- GDC | clinical__primary | |
| TCGA-GM-A2DA | (TODO) -- GDC | clinical__primary | |
| TCGA-GM-A2DB | (TODO) -- GDC | clinical__primary | |
| TCGA-GM-A2DC | (TODO) -- GDC | clinical__primary | |
| TCGA-GM-A2DD | (TODO) -- GDC | clinical__primary | |
| TCGA-GM-A2DF | (TODO) -- GDC | clinical__primary | |
| TCGA-GM-A2DH | (TODO) -- GDC | clinical__primary | |
| TCGA-GM-A2DI | (TODO) -- GDC | clinical__primary | |
| TCGA-GM-A2DK | (TODO) -- GDC | clinical__primary | |
| TCGA-GM-A2DL | (TODO) -- GDC | clinical__primary | |
| TCGA-GM-A2DM | (TODO) -- GDC | clinical__primary | |
| TCGA-GM-A2DN | (TODO) -- GDC | clinical__primary | |
| TCGA-GM-A2DO | (TODO) -- GDC | clinical__primary | |
| TCGA-GM-A3NW | (TODO) -- GDC | clinical__primary | |
| TCGA-GM-A3NY | (TODO) -- GDC | clinical__primary | |
| TCGA-GM-A3XG | (TODO) -- GDC | clinical__primary | |
| TCGA-GM-A3XL | (TODO) -- GDC | clinical__primary | |
| TCGA-GM-A3XN | (TODO) -- GDC | clinical__primary | |
| TCGA-GM-A4E0 | (TODO) -- GDC | clinical__primary | |
| TCGA-GM-A5PV | (TODO) -- GDC | clinical__primary | |
| TCGA-GM-A5PX | (TODO) -- GDC | clinical__primary | |
| TCGA-HN-A2NL | (TODO) -- GDC | clinical__primary | |
| TCGA-HN-A2OB | (TODO) -- GDC | clinical__primary | |
| TCGA-JL-A3YW | (TODO) -- GDC | clinical__primary | |
| TCGA-JL-A3YX | (TODO) -- GDC | clinical__primary | |
| TCGA-LD-A66U | (TODO) -- GDC | clinical__primary | |
| TCGA-LD-A74U | (TODO) -- GDC | clinical__primary | |
| TCGA-LD-A7W5 | (TODO) -- GDC | clinical__primary | |
| TCGA-LD-A7W6 | (TODO) -- GDC | clinical__primary | |
| TCGA-LD-A9QF | (TODO) -- GDC | clinical__primary | |
| TCGA-LL-A440 | (TODO) -- GDC | clinical__primary | |
| TCGA-LL-A441 | (TODO) -- GDC | clinical__primary | |
| TCGA-LL-A442 | (TODO) -- GDC | clinical__primary | |
| TCGA-LL-A50Y | (TODO) -- GDC | clinical__primary | |
| TCGA-LL-A5YL | (TODO) -- GDC | clinical__primary | |
| TCGA-LL-A5YM | (TODO) -- GDC | clinical__primary | |
| TCGA-LL-A5YN | (TODO) -- GDC | clinical__primary | |
| TCGA-LL-A5YO | (TODO) -- GDC | clinical__primary | |
| TCGA-LL-A5YP | (TODO) -- GDC | clinical__primary | |
| TCGA-LL-A6FP | (TODO) -- GDC | clinical__primary | |
| TCGA-LL-A6FQ | (TODO) -- GDC | clinical__primary | |
| TCGA-LL-A6FR | (TODO) -- GDC | clinical__primary | |
| TCGA-LL-A73Y | (TODO) -- GDC | clinical__primary | |
| TCGA-LL-A73Z | (TODO) -- GDC | clinical__primary | |
| TCGA-LL-A740 | (TODO) -- GDC | clinical__primary | |
| TCGA-LL-A7SZ | (TODO) -- GDC | clinical__primary | |
| TCGA-LL-A7T0 | (TODO) -- GDC | clinical__primary | |
| TCGA-LL-A8F5 | (TODO) -- GDC | clinical__primary | |
| TCGA-LL-A9Q3 | (TODO) -- GDC | clinical__primary | |
| TCGA-LQ-A4E4 | (TODO) -- GDC | clinical__primary | |
| TCGA-MS-A51U | (TODO) -- GDC | clinical__primary | |
| TCGA-OK-A5Q2 | (TODO) -- GDC | clinical__primary | |
| TCGA-OL-A5D6 | (TODO) -- GDC | clinical__primary | |
| TCGA-OL-A5D7 | (TODO) -- GDC | clinical__primary | |
| TCGA-OL-A5D8 | (TODO) -- GDC | clinical__primary | |
| TCGA-OL-A5DA | (TODO) -- GDC | clinical__primary | |
| TCGA-OL-A5RU | (TODO) -- GDC | clinical__primary | |
| TCGA-OL-A5RV | (TODO) -- GDC | clinical__primary | |
| TCGA-OL-A5RW | (TODO) -- GDC | clinical__primary | |
| TCGA-OL-A5RX | (TODO) -- GDC | clinical__primary | |
| TCGA-OL-A5RY | (TODO) -- GDC | clinical__primary | |
| TCGA-OL-A5RZ | (TODO) -- GDC | clinical__primary | |
| TCGA-OL-A5S0 | (TODO) -- GDC | clinical__primary | |
| TCGA-OL-A66H | (TODO) -- GDC | clinical__primary | |
| TCGA-OL-A66I | (TODO) -- GDC | clinical__primary | |
| TCGA-OL-A66J | (TODO) -- GDC | clinical__primary | |
| TCGA-OL-A66K | (TODO) -- GDC | clinical__primary | |
| TCGA-OL-A66L | (TODO) -- GDC | clinical__primary | |
| TCGA-OL-A66N | (TODO) -- GDC | clinical__primary | |
| TCGA-OL-A66O | (TODO) -- GDC | clinical__primary | |
| TCGA-OL-A66P | (TODO) -- GDC | clinical__primary | |
| TCGA-OL-A6VO | (TODO) -- GDC | clinical__primary | |
| TCGA-OL-A6VQ | (TODO) -- GDC | clinical__primary | |
| TCGA-OL-A6VR | (TODO) -- GDC | clinical__primary | |
| TCGA-OL-A97C | (TODO) -- GDC | clinical__primary | |
| TCGA-PE-A5DC | (TODO) -- GDC | clinical__primary | |
| TCGA-PE-A5DD | (TODO) -- GDC | clinical__primary | |
| TCGA-PE-A5DE | (TODO) -- GDC | clinical__primary | |
| TCGA-PL-A8LV | (TODO) -- GDC | clinical__primary | |
| TCGA-PL-A8LX | (TODO) -- GDC | clinical__primary | |
| TCGA-PL-A8LY | (TODO) -- GDC | clinical__primary | |
| TCGA-PL-A8LZ | (TODO) -- GDC | clinical__primary | |
| TCGA-S3-A6ZF | (TODO) -- GDC | clinical__primary | |
| TCGA-S3-A6ZG | (TODO) -- GDC | clinical__primary | |
| TCGA-S3-A6ZH | (TODO) -- GDC | clinical__primary | |
| TCGA-S3-AA0Z | (TODO) -- GDC | clinical__primary | |
| TCGA-S3-AA10 | (TODO) -- GDC | clinical__primary | |
| TCGA-S3-AA11 | (TODO) -- GDC | clinical__primary | |
| TCGA-S3-AA12 | (TODO) -- GDC | clinical__primary | |
| TCGA-S3-AA14 | (TODO) -- GDC | clinical__primary | |
| TCGA-S3-AA15 | (TODO) -- GDC | clinical__primary | |
| TCGA-S3-AA17 | (TODO) -- GDC | clinical__primary | |
| TCGA-UL-AAZ6 | (TODO) -- GDC | clinical__primary | |
| TCGA-UU-A93S | (TODO) -- GDC | clinical__primary | |
| TCGA-V7-A7HQ | (TODO) -- GDC | clinical__primary | |
| TCGA-W8-A86G | (TODO) -- GDC | clinical__primary | |
| TCGA-WT-AB41 | (TODO) -- GDC | clinical__primary | |
| TCGA-WT-AB44 | (TODO) -- GDC | clinical__primary | |
| TCGA-XX-A899 | (TODO) -- GDC | clinical__primary | |
| TCGA-XX-A89A | (TODO) -- GDC | clinical__primary | |
| TCGA-Z7-A8R5 | (TODO) -- GDC | clinical__primary | |
| TCGA-Z7-A8R6 | (TODO) -- GDC | clinical__primary |
Table S26.
| TCGA Barcode | Platform | Center | Annotation |
|---|---|---|---|
| TCGA-3C-AAAU-01A-11D-A41E-01 | Affymetrix SNP 6.0 | (TODO) -- GDC | CNV__unfiltered__snp6 |
| TCGA-3C-AAAU-01A-11D-A41E-01 | Affymetrix SNP 6.0 | (TODO) -- GDC | CNV__snp6 |
| TCGA-3C-AALI-01A-11D-A41E-01 | Affymetrix SNP 6.0 | (TODO) -- GDC | CNV__unfiltered__snp6 |
| TCGA-3C-AALI-01A-11D-A41E-01 | Affymetrix SNP 6.0 | (TODO) -- GDC | CNV__snp6 |
| TCGA-3C-AALJ-01A-31D-A41E-01 | Affymetrix SNP 6.0 | (TODO) -- GDC | CNV__unfiltered__snp6 |
| TCGA-3C-AALJ-01A-31D-A41E-01 | Affymetrix SNP 6.0 | (TODO) -- GDC | CNV__snp6 |
| TCGA-3C-AALK-01A-11D-A41E-01 | Affymetrix SNP 6.0 | (TODO) -- GDC | CNV__unfiltered__snp6 |
| TCGA-3C-AALK-01A-11D-A41E-01 | Affymetrix SNP 6.0 | (TODO) -- GDC | CNV__snp6 |
| TCGA-4H-AAAK-01A-12D-A41E-01 | Affymetrix SNP 6.0 | (TODO) -- GDC | CNV__unfiltered__snp6 |
| TCGA-4H-AAAK-01A-12D-A41E-01 | Affymetrix SNP 6.0 | (TODO) -- GDC | CNV__snp6 |
| TCGA-5L-AAT0-01A-12D-A41E-01 | Affymetrix SNP 6.0 | (TODO) -- GDC | CNV__unfiltered__snp6 |
| TCGA-5L-AAT0-01A-12D-A41E-01 | Affymetrix SNP 6.0 | (TODO) -- GDC | CNV__snp6 |
| TCGA-5L-AAT1-01A-12D-A41E-01 | Affymetrix SNP 6.0 | (TODO) -- GDC | CNV__unfiltered__snp6 |
| TCGA-5L-AAT1-01A-12D-A41E-01 | Affymetrix SNP 6.0 | (TODO) -- GDC | CNV__snp6 |
| TCGA-5T-A9QA-01A-11D-A41E-01 | Affymetrix SNP 6.0 | (TODO) -- GDC | CNV__unfiltered__snp6 |
| TCGA-5T-A9QA-01A-11D-A41E-01 | Affymetrix SNP 6.0 | (TODO) -- GDC | CNV__snp6 |
| TCGA-A1-A0SB-01A-11D-A141-01 | Affymetrix SNP 6.0 | (TODO) -- GDC | CNV__unfiltered__snp6 |
| TCGA-A1-A0SB-01A-11D-A141-01 | Affymetrix SNP 6.0 | (TODO) -- GDC | CNV__snp6 |
| TCGA-A1-A0SD-01A-11D-A111-01 | Affymetrix SNP 6.0 | (TODO) -- GDC | CNV__unfiltered__snp6 |
| TCGA-A1-A0SD-01A-11D-A111-01 | Affymetrix SNP 6.0 | (TODO) -- GDC | CNV__snp6 |
| TCGA-A1-A0SE-01A-11D-A087-01 | Affymetrix SNP 6.0 | (TODO) -- GDC | CNV__unfiltered__snp6 |
| TCGA-A1-A0SE-01A-11D-A087-01 | Affymetrix SNP 6.0 | (TODO) -- GDC | CNV__snp6 |
| TCGA-A1-A0SF-01A-11D-A141-01 | Affymetrix SNP 6.0 | (TODO) -- GDC | CNV__unfiltered__snp6 |
| TCGA-A1-A0SF-01A-11D-A141-01 | Affymetrix SNP 6.0 | (TODO) -- GDC | CNV__snp6 |
| TCGA-A1-A0SG-01A-11D-A141-01 | Affymetrix SNP 6.0 | (TODO) -- GDC | CNV__unfiltered__snp6 |
| TCGA-A1-A0SG-01A-11D-A141-01 | Affymetrix SNP 6.0 | (TODO) -- GDC | CNV__snp6 |
| TCGA-A1-A0SH-01A-11D-A087-01 | Affymetrix SNP 6.0 | (TODO) -- GDC | CNV__unfiltered__snp6 |
| TCGA-A1-A0SH-01A-11D-A087-01 | Affymetrix SNP 6.0 | (TODO) -- GDC | CNV__snp6 |
| TCGA-A1-A0SI-01A-11D-A141-01 | Affymetrix SNP 6.0 | (TODO) -- GDC | CNV__unfiltered__snp6 |
| TCGA-A1-A0SI-01A-11D-A141-01 | Affymetrix SNP 6.0 | (TODO) -- GDC | CNV__snp6 |
| TCGA-A1-A0SJ-01A-11D-A087-01 | Affymetrix SNP 6.0 | (TODO) -- GDC | CNV__unfiltered__snp6 |
| TCGA-A1-A0SJ-01A-11D-A087-01 | Affymetrix SNP 6.0 | (TODO) -- GDC | CNV__snp6 |
| TCGA-A1-A0SK-01A-12D-A087-01 | Affymetrix SNP 6.0 | (TODO) -- GDC | CNV__unfiltered__snp6 |
| TCGA-A1-A0SK-01A-12D-A087-01 | Affymetrix SNP 6.0 | (TODO) -- GDC | CNV__snp6 |
| TCGA-A1-A0SM-01A-11D-A087-01 | Affymetrix SNP 6.0 | (TODO) -- GDC | CNV__unfiltered__snp6 |
| TCGA-A1-A0SM-01A-11D-A087-01 | Affymetrix SNP 6.0 | (TODO) -- GDC | CNV__snp6 |
| TCGA-A1-A0SN-01A-11D-A141-01 | Affymetrix SNP 6.0 | (TODO) -- GDC | CNV__unfiltered__snp6 |
| TCGA-A1-A0SN-01A-11D-A141-01 | Affymetrix SNP 6.0 | (TODO) -- GDC | CNV__snp6 |
| TCGA-A1-A0SO-01A-22D-A087-01 | Affymetrix SNP 6.0 | (TODO) -- GDC | CNV__unfiltered__snp6 |
| TCGA-A1-A0SO-01A-22D-A087-01 | Affymetrix SNP 6.0 | (TODO) -- GDC | CNV__snp6 |
| TCGA-A1-A0SP-01A-11D-A087-01 | Affymetrix SNP 6.0 | (TODO) -- GDC | CNV__unfiltered__snp6 |
| TCGA-A1-A0SP-01A-11D-A087-01 | Affymetrix SNP 6.0 | (TODO) -- GDC | CNV__snp6 |
| TCGA-A1-A0SQ-01A-21D-A141-01 | Affymetrix SNP 6.0 | (TODO) -- GDC | CNV__unfiltered__snp6 |
| TCGA-A1-A0SQ-01A-21D-A141-01 | Affymetrix SNP 6.0 | (TODO) -- GDC | CNV__snp6 |
| TCGA-A2-A04N-01A-11D-A111-01 | Affymetrix SNP 6.0 | (TODO) -- GDC | CNV__unfiltered__snp6 |
| TCGA-A2-A04N-01A-11D-A111-01 | Affymetrix SNP 6.0 | (TODO) -- GDC | CNV__snp6 |
| TCGA-A2-A04P-01A-31D-A036-01 | Affymetrix SNP 6.0 | (TODO) -- GDC | CNV__unfiltered__snp6 |
| TCGA-A2-A04P-01A-31D-A036-01 | Affymetrix SNP 6.0 | (TODO) -- GDC | CNV__snp6 |
| TCGA-A2-A04Q-01A-21D-A036-01 | Affymetrix SNP 6.0 | (TODO) -- GDC | CNV__unfiltered__snp6 |
| TCGA-A2-A04Q-01A-21D-A036-01 | Affymetrix SNP 6.0 | (TODO) -- GDC | CNV__snp6 |
| TCGA-A2-A04R-01A-41D-A107-01 | Affymetrix SNP 6.0 | (TODO) -- GDC | CNV__unfiltered__snp6 |
| TCGA-A2-A04R-01A-41D-A107-01 | Affymetrix SNP 6.0 | (TODO) -- GDC | CNV__snp6 |
| TCGA-A2-A04T-01A-21D-A036-01 | Affymetrix SNP 6.0 | (TODO) -- GDC | CNV__unfiltered__snp6 |
| TCGA-A2-A04T-01A-21D-A036-01 | Affymetrix SNP 6.0 | (TODO) -- GDC | CNV__snp6 |
| TCGA-A2-A04U-01A-11D-A111-01 | Affymetrix SNP 6.0 | (TODO) -- GDC | CNV__unfiltered__snp6 |
| TCGA-A2-A04U-01A-11D-A111-01 | Affymetrix SNP 6.0 | (TODO) -- GDC | CNV__snp6 |
| TCGA-A2-A04V-01A-21D-A036-01 | Affymetrix SNP 6.0 | (TODO) -- GDC | CNV__unfiltered__snp6 |
| TCGA-A2-A04V-01A-21D-A036-01 | Affymetrix SNP 6.0 | (TODO) -- GDC | CNV__snp6 |
| TCGA-A2-A04W-01A-31D-A111-01 | Affymetrix SNP 6.0 | (TODO) -- GDC | CNV__unfiltered__snp6 |
| TCGA-A2-A04W-01A-31D-A111-01 | Affymetrix SNP 6.0 | (TODO) -- GDC | CNV__snp6 |
| TCGA-A2-A04X-01A-21D-A036-01 | Affymetrix SNP 6.0 | (TODO) -- GDC | CNV__unfiltered__snp6 |
| TCGA-A2-A04X-01A-21D-A036-01 | Affymetrix SNP 6.0 | (TODO) -- GDC | CNV__snp6 |
| TCGA-A2-A04Y-01A-21D-A036-01 | Affymetrix SNP 6.0 | (TODO) -- GDC | CNV__unfiltered__snp6 |
| TCGA-A2-A04Y-01A-21D-A036-01 | Affymetrix SNP 6.0 | (TODO) -- GDC | CNV__snp6 |
| TCGA-A2-A0CK-01A-11D-A227-01 | Affymetrix SNP 6.0 | (TODO) -- GDC | CNV__unfiltered__snp6 |
| TCGA-A2-A0CK-01A-11D-A227-01 | Affymetrix SNP 6.0 | (TODO) -- GDC | CNV__snp6 |
| TCGA-A2-A0CL-01A-11D-A111-01 | Affymetrix SNP 6.0 | (TODO) -- GDC | CNV__unfiltered__snp6 |
| TCGA-A2-A0CL-01A-11D-A111-01 | Affymetrix SNP 6.0 | (TODO) -- GDC | CNV__snp6 |
| TCGA-A2-A0CM-01A-31D-A036-01 | Affymetrix SNP 6.0 | (TODO) -- GDC | CNV__unfiltered__snp6 |
| TCGA-A2-A0CM-01A-31D-A036-01 | Affymetrix SNP 6.0 | (TODO) -- GDC | CNV__snp6 |
| TCGA-A2-A0CO-01A-13D-A227-01 | Affymetrix SNP 6.0 | (TODO) -- GDC | CNV__unfiltered__snp6 |
| TCGA-A2-A0CO-01A-13D-A227-01 | Affymetrix SNP 6.0 | (TODO) -- GDC | CNV__snp6 |
| TCGA-A2-A0CP-01A-11D-A036-01 | Affymetrix SNP 6.0 | (TODO) -- GDC | CNV__unfiltered__snp6 |
| TCGA-A2-A0CP-01A-11D-A036-01 | Affymetrix SNP 6.0 | (TODO) -- GDC | CNV__snp6 |
| TCGA-A2-A0CQ-01A-21D-A036-01 | Affymetrix SNP 6.0 | (TODO) -- GDC | CNV__unfiltered__snp6 |
| TCGA-A2-A0CQ-01A-21D-A036-01 | Affymetrix SNP 6.0 | (TODO) -- GDC | CNV__snp6 |
| TCGA-A2-A0CR-01A-11D-A227-01 | Affymetrix SNP 6.0 | (TODO) -- GDC | CNV__unfiltered__snp6 |
| TCGA-A2-A0CR-01A-11D-A227-01 | Affymetrix SNP 6.0 | (TODO) -- GDC | CNV__snp6 |
| TCGA-A2-A0CS-01A-11D-A111-01 | Affymetrix SNP 6.0 | (TODO) -- GDC | CNV__unfiltered__snp6 |
| TCGA-A2-A0CS-01A-11D-A111-01 | Affymetrix SNP 6.0 | (TODO) -- GDC | CNV__snp6 |
| TCGA-A2-A0CT-01A-31D-A059-01 | Affymetrix SNP 6.0 | (TODO) -- GDC | CNV__unfiltered__snp6 |
| TCGA-A2-A0CT-01A-31D-A059-01 | Affymetrix SNP 6.0 | (TODO) -- GDC | CNV__snp6 |
| TCGA-A2-A0CU-01A-12D-A036-01 | Affymetrix SNP 6.0 | (TODO) -- GDC | CNV__unfiltered__snp6 |
| TCGA-A2-A0CU-01A-12D-A036-01 | Affymetrix SNP 6.0 | (TODO) -- GDC | CNV__snp6 |
| TCGA-A2-A0CV-01A-31D-A111-01 | Affymetrix SNP 6.0 | (TODO) -- GDC | CNV__unfiltered__snp6 |
| TCGA-A2-A0CV-01A-31D-A111-01 | Affymetrix SNP 6.0 | (TODO) -- GDC | CNV__snp6 |
| TCGA-A2-A0CW-01A-21D-A111-01 | Affymetrix SNP 6.0 | (TODO) -- GDC | CNV__unfiltered__snp6 |
| TCGA-A2-A0CW-01A-21D-A111-01 | Affymetrix SNP 6.0 | (TODO) -- GDC | CNV__snp6 |
| TCGA-A2-A0CX-01A-21D-A011-01 | Affymetrix SNP 6.0 | (TODO) -- GDC | CNV__unfiltered__snp6 |
| TCGA-A2-A0CX-01A-21D-A011-01 | Affymetrix SNP 6.0 | (TODO) -- GDC | CNV__snp6 |
| TCGA-A2-A0CY-01A-12D-A036-01 | Affymetrix SNP 6.0 | (TODO) -- GDC | CNV__unfiltered__snp6 |
| TCGA-A2-A0CY-01A-12D-A036-01 | Affymetrix SNP 6.0 | (TODO) -- GDC | CNV__snp6 |
| TCGA-A2-A0CZ-01A-11D-A036-01 | Affymetrix SNP 6.0 | (TODO) -- GDC | CNV__unfiltered__snp6 |
| TCGA-A2-A0CZ-01A-11D-A036-01 | Affymetrix SNP 6.0 | (TODO) -- GDC | CNV__snp6 |
| TCGA-A2-A0D0-01A-11D-A011-01 | Affymetrix SNP 6.0 | (TODO) -- GDC | CNV__unfiltered__snp6 |
| TCGA-A2-A0D0-01A-11D-A011-01 | Affymetrix SNP 6.0 | (TODO) -- GDC | CNV__snp6 |
| TCGA-A2-A0D1-01A-11D-A036-01 | Affymetrix SNP 6.0 | (TODO) -- GDC | CNV__unfiltered__snp6 |
| TCGA-A2-A0D1-01A-11D-A036-01 | Affymetrix SNP 6.0 | (TODO) -- GDC | CNV__snp6 |
| TCGA-A2-A0D2-01A-21D-A036-01 | Affymetrix SNP 6.0 | (TODO) -- GDC | CNV__unfiltered__snp6 |
| TCGA-A2-A0D2-01A-21D-A036-01 | Affymetrix SNP 6.0 | (TODO) -- GDC | CNV__snp6 |
| TCGA-A2-A0D3-01A-11D-A111-01 | Affymetrix SNP 6.0 | (TODO) -- GDC | CNV__unfiltered__snp6 |
| TCGA-A2-A0D3-01A-11D-A111-01 | Affymetrix SNP 6.0 | (TODO) -- GDC | CNV__snp6 |
| TCGA-A2-A0D4-01A-11D-A011-01 | Affymetrix SNP 6.0 | (TODO) -- GDC | CNV__unfiltered__snp6 |
| TCGA-A2-A0D4-01A-11D-A011-01 | Affymetrix SNP 6.0 | (TODO) -- GDC | CNV__snp6 |
| TCGA-A2-A0EM-01A-11D-A036-01 | Affymetrix SNP 6.0 | (TODO) -- GDC | CNV__unfiltered__snp6 |
| TCGA-A2-A0EM-01A-11D-A036-01 | Affymetrix SNP 6.0 | (TODO) -- GDC | CNV__snp6 |
| TCGA-A2-A0EN-01A-13D-A087-01 | Affymetrix SNP 6.0 | (TODO) -- GDC | CNV__unfiltered__snp6 |
| TCGA-A2-A0EN-01A-13D-A087-01 | Affymetrix SNP 6.0 | (TODO) -- GDC | CNV__snp6 |
| TCGA-A2-A0EO-01A-11D-A036-01 | Affymetrix SNP 6.0 | (TODO) -- GDC | CNV__unfiltered__snp6 |
| TCGA-A2-A0EO-01A-11D-A036-01 | Affymetrix SNP 6.0 | (TODO) -- GDC | CNV__snp6 |
| TCGA-A2-A0EP-01A-52D-A22W-01 | Affymetrix SNP 6.0 | (TODO) -- GDC | CNV__unfiltered__snp6 |
| TCGA-A2-A0EP-01A-52D-A22W-01 | Affymetrix SNP 6.0 | (TODO) -- GDC | CNV__snp6 |
| TCGA-A2-A0EQ-01A-11D-A036-01 | Affymetrix SNP 6.0 | (TODO) -- GDC | CNV__unfiltered__snp6 |
| TCGA-A2-A0EQ-01A-11D-A036-01 | Affymetrix SNP 6.0 | (TODO) -- GDC | CNV__snp6 |
| TCGA-A2-A0ER-01A-21D-A036-01 | Affymetrix SNP 6.0 | (TODO) -- GDC | CNV__unfiltered__snp6 |
| TCGA-A2-A0ER-01A-21D-A036-01 | Affymetrix SNP 6.0 | (TODO) -- GDC | CNV__snp6 |
| TCGA-A2-A0ES-01A-11D-A111-01 | Affymetrix SNP 6.0 | (TODO) -- GDC | CNV__unfiltered__snp6 |
| TCGA-A2-A0ES-01A-11D-A111-01 | Affymetrix SNP 6.0 | (TODO) -- GDC | CNV__snp6 |
| TCGA-A2-A0ET-01A-31D-A036-01 | Affymetrix SNP 6.0 | (TODO) -- GDC | CNV__unfiltered__snp6 |
| TCGA-A2-A0ET-01A-31D-A036-01 | Affymetrix SNP 6.0 | (TODO) -- GDC | CNV__snp6 |
| TCGA-A2-A0EU-01A-22D-A059-01 | Affymetrix SNP 6.0 | (TODO) -- GDC | CNV__unfiltered__snp6 |
| TCGA-A2-A0EU-01A-22D-A059-01 | Affymetrix SNP 6.0 | (TODO) -- GDC | CNV__snp6 |
| TCGA-A2-A0EV-01A-11D-A036-01 | Affymetrix SNP 6.0 | (TODO) -- GDC | CNV__unfiltered__snp6 |
| TCGA-A2-A0EV-01A-11D-A036-01 | Affymetrix SNP 6.0 | (TODO) -- GDC | CNV__snp6 |
| TCGA-A2-A0EW-01A-21D-A111-01 | Affymetrix SNP 6.0 | (TODO) -- GDC | CNV__unfiltered__snp6 |
| TCGA-A2-A0EW-01A-21D-A111-01 | Affymetrix SNP 6.0 | (TODO) -- GDC | CNV__snp6 |
| TCGA-A2-A0EX-01A-21D-A036-01 | Affymetrix SNP 6.0 | (TODO) -- GDC | CNV__unfiltered__snp6 |
| TCGA-A2-A0EX-01A-21D-A036-01 | Affymetrix SNP 6.0 | (TODO) -- GDC | CNV__snp6 |
| TCGA-A2-A0EY-01A-11D-A036-01 | Affymetrix SNP 6.0 | (TODO) -- GDC | CNV__unfiltered__snp6 |
| TCGA-A2-A0EY-01A-11D-A036-01 | Affymetrix SNP 6.0 | (TODO) -- GDC | CNV__snp6 |
| TCGA-A2-A0ST-01A-12D-A087-01 | Affymetrix SNP 6.0 | (TODO) -- GDC | CNV__unfiltered__snp6 |
| TCGA-A2-A0ST-01A-12D-A087-01 | Affymetrix SNP 6.0 | (TODO) -- GDC | CNV__snp6 |
| TCGA-A2-A0SU-01A-11D-A087-01 | Affymetrix SNP 6.0 | (TODO) -- GDC | CNV__unfiltered__snp6 |
| TCGA-A2-A0SU-01A-11D-A087-01 | Affymetrix SNP 6.0 | (TODO) -- GDC | CNV__snp6 |
| TCGA-A2-A0SV-01A-11D-A087-01 | Affymetrix SNP 6.0 | (TODO) -- GDC | CNV__unfiltered__snp6 |
| TCGA-A2-A0SV-01A-11D-A087-01 | Affymetrix SNP 6.0 | (TODO) -- GDC | CNV__snp6 |
| TCGA-A2-A0SW-01A-11D-A087-01 | Affymetrix SNP 6.0 | (TODO) -- GDC | CNV__unfiltered__snp6 |
| TCGA-A2-A0SW-01A-11D-A087-01 | Affymetrix SNP 6.0 | (TODO) -- GDC | CNV__snp6 |
| TCGA-A2-A0SX-01A-12D-A087-01 | Affymetrix SNP 6.0 | (TODO) -- GDC | CNV__unfiltered__snp6 |
| TCGA-A2-A0SX-01A-12D-A087-01 | Affymetrix SNP 6.0 | (TODO) -- GDC | CNV__snp6 |
| TCGA-A2-A0SY-01A-31D-A087-01 | Affymetrix SNP 6.0 | (TODO) -- GDC | CNV__unfiltered__snp6 |
| TCGA-A2-A0SY-01A-31D-A087-01 | Affymetrix SNP 6.0 | (TODO) -- GDC | CNV__snp6 |
| TCGA-A2-A0T0-01A-22D-A087-01 | Affymetrix SNP 6.0 | (TODO) -- GDC | CNV__unfiltered__snp6 |
| TCGA-A2-A0T0-01A-22D-A087-01 | Affymetrix SNP 6.0 | (TODO) -- GDC | CNV__snp6 |
| TCGA-A2-A0T1-01A-21D-A087-01 | Affymetrix SNP 6.0 | (TODO) -- GDC | CNV__unfiltered__snp6 |
| TCGA-A2-A0T1-01A-21D-A087-01 | Affymetrix SNP 6.0 | (TODO) -- GDC | CNV__snp6 |
| TCGA-A2-A0T2-01A-11D-A087-01 | Affymetrix SNP 6.0 | (TODO) -- GDC | CNV__unfiltered__snp6 |
| TCGA-A2-A0T2-01A-11D-A087-01 | Affymetrix SNP 6.0 | (TODO) -- GDC | CNV__snp6 |
| TCGA-A2-A0T3-01A-21D-A111-01 | Affymetrix SNP 6.0 | (TODO) -- GDC | CNV__unfiltered__snp6 |
| TCGA-A2-A0T3-01A-21D-A111-01 | Affymetrix SNP 6.0 | (TODO) -- GDC | CNV__snp6 |
| TCGA-A2-A0T4-01A-31D-A087-01 | Affymetrix SNP 6.0 | (TODO) -- GDC | CNV__unfiltered__snp6 |
| TCGA-A2-A0T4-01A-31D-A087-01 | Affymetrix SNP 6.0 | (TODO) -- GDC | CNV__snp6 |
| TCGA-A2-A0T5-01A-21D-A087-01 | Affymetrix SNP 6.0 | (TODO) -- GDC | CNV__unfiltered__snp6 |
| TCGA-A2-A0T5-01A-21D-A087-01 | Affymetrix SNP 6.0 | (TODO) -- GDC | CNV__snp6 |
| TCGA-A2-A0T6-01A-11D-A087-01 | Affymetrix SNP 6.0 | (TODO) -- GDC | CNV__unfiltered__snp6 |
| TCGA-A2-A0T6-01A-11D-A087-01 | Affymetrix SNP 6.0 | (TODO) -- GDC | CNV__snp6 |
| TCGA-A2-A0T7-01A-21D-A087-01 | Affymetrix SNP 6.0 | (TODO) -- GDC | CNV__unfiltered__snp6 |
| TCGA-A2-A0T7-01A-21D-A087-01 | Affymetrix SNP 6.0 | (TODO) -- GDC | CNV__snp6 |
| TCGA-A2-A0YC-01A-11D-A107-01 | Affymetrix SNP 6.0 | (TODO) -- GDC | CNV__unfiltered__snp6 |
| TCGA-A2-A0YC-01A-11D-A107-01 | Affymetrix SNP 6.0 | (TODO) -- GDC | CNV__snp6 |
| TCGA-A2-A0YD-01A-11D-A107-01 | Affymetrix SNP 6.0 | (TODO) -- GDC | CNV__unfiltered__snp6 |
| TCGA-A2-A0YD-01A-11D-A107-01 | Affymetrix SNP 6.0 | (TODO) -- GDC | CNV__snp6 |
| TCGA-A2-A0YE-01A-11D-A107-01 | Affymetrix SNP 6.0 | (TODO) -- GDC | CNV__unfiltered__snp6 |
| TCGA-A2-A0YE-01A-11D-A107-01 | Affymetrix SNP 6.0 | (TODO) -- GDC | CNV__snp6 |
| TCGA-A2-A0YF-01A-21D-A107-01 | Affymetrix SNP 6.0 | (TODO) -- GDC | CNV__unfiltered__snp6 |
| TCGA-A2-A0YF-01A-21D-A107-01 | Affymetrix SNP 6.0 | (TODO) -- GDC | CNV__snp6 |
| TCGA-A2-A0YG-01A-21D-A107-01 | Affymetrix SNP 6.0 | (TODO) -- GDC | CNV__unfiltered__snp6 |
| TCGA-A2-A0YG-01A-21D-A107-01 | Affymetrix SNP 6.0 | (TODO) -- GDC | CNV__snp6 |
| TCGA-A2-A0YH-01A-11D-A107-01 | Affymetrix SNP 6.0 | (TODO) -- GDC | CNV__unfiltered__snp6 |
| TCGA-A2-A0YH-01A-11D-A107-01 | Affymetrix SNP 6.0 | (TODO) -- GDC | CNV__snp6 |
| TCGA-A2-A0YI-01A-31D-A10L-01 | Affymetrix SNP 6.0 | (TODO) -- GDC | CNV__unfiltered__snp6 |
| TCGA-A2-A0YI-01A-31D-A10L-01 | Affymetrix SNP 6.0 | (TODO) -- GDC | CNV__snp6 |
| TCGA-A2-A0YJ-01A-11D-A107-01 | Affymetrix SNP 6.0 | (TODO) -- GDC | CNV__unfiltered__snp6 |
| TCGA-A2-A0YJ-01A-11D-A107-01 | Affymetrix SNP 6.0 | (TODO) -- GDC | CNV__snp6 |
| TCGA-A2-A0YK-01A-22D-A107-01 | Affymetrix SNP 6.0 | (TODO) -- GDC | CNV__unfiltered__snp6 |
| TCGA-A2-A0YK-01A-22D-A107-01 | Affymetrix SNP 6.0 | (TODO) -- GDC | CNV__snp6 |
| TCGA-A2-A0YL-01A-21D-A107-01 | Affymetrix SNP 6.0 | (TODO) -- GDC | CNV__unfiltered__snp6 |
| TCGA-A2-A0YL-01A-21D-A107-01 | Affymetrix SNP 6.0 | (TODO) -- GDC | CNV__snp6 |
| TCGA-A2-A0YM-01A-11D-A107-01 | Affymetrix SNP 6.0 | (TODO) -- GDC | CNV__unfiltered__snp6 |
| TCGA-A2-A0YM-01A-11D-A107-01 | Affymetrix SNP 6.0 | (TODO) -- GDC | CNV__snp6 |
| TCGA-A2-A0YT-01A-11D-A107-01 | Affymetrix SNP 6.0 | (TODO) -- GDC | CNV__unfiltered__snp6 |
| TCGA-A2-A0YT-01A-11D-A107-01 | Affymetrix SNP 6.0 | (TODO) -- GDC | CNV__snp6 |
| TCGA-A2-A1FV-01A-11D-A13J-01 | Affymetrix SNP 6.0 | (TODO) -- GDC | CNV__unfiltered__snp6 |
| TCGA-A2-A1FV-01A-11D-A13J-01 | Affymetrix SNP 6.0 | (TODO) -- GDC | CNV__snp6 |
| TCGA-A2-A1FW-01A-11D-A13J-01 | Affymetrix SNP 6.0 | (TODO) -- GDC | CNV__unfiltered__snp6 |
| TCGA-A2-A1FW-01A-11D-A13J-01 | Affymetrix SNP 6.0 | (TODO) -- GDC | CNV__snp6 |
| TCGA-A2-A1FX-01A-11D-A13J-01 | Affymetrix SNP 6.0 | (TODO) -- GDC | CNV__unfiltered__snp6 |
| TCGA-A2-A1FX-01A-11D-A13J-01 | Affymetrix SNP 6.0 | (TODO) -- GDC | CNV__snp6 |
| TCGA-A2-A1FZ-01A-51D-A14F-01 | Affymetrix SNP 6.0 | (TODO) -- GDC | CNV__unfiltered__snp6 |
| TCGA-A2-A1FZ-01A-51D-A14F-01 | Affymetrix SNP 6.0 | (TODO) -- GDC | CNV__snp6 |
| TCGA-A2-A1G0-01A-11D-A13J-01 | Affymetrix SNP 6.0 | (TODO) -- GDC | CNV__unfiltered__snp6 |
| TCGA-A2-A1G0-01A-11D-A13J-01 | Affymetrix SNP 6.0 | (TODO) -- GDC | CNV__snp6 |
| TCGA-A2-A1G1-01A-21D-A13J-01 | Affymetrix SNP 6.0 | (TODO) -- GDC | CNV__unfiltered__snp6 |
| TCGA-A2-A1G1-01A-21D-A13J-01 | Affymetrix SNP 6.0 | (TODO) -- GDC | CNV__snp6 |
| TCGA-A2-A1G4-01A-11D-A13J-01 | Affymetrix SNP 6.0 | (TODO) -- GDC | CNV__unfiltered__snp6 |
| TCGA-A2-A1G4-01A-11D-A13J-01 | Affymetrix SNP 6.0 | (TODO) -- GDC | CNV__snp6 |
| TCGA-A2-A1G6-01A-11D-A13J-01 | Affymetrix SNP 6.0 | (TODO) -- GDC | CNV__unfiltered__snp6 |
| TCGA-A2-A1G6-01A-11D-A13J-01 | Affymetrix SNP 6.0 | (TODO) -- GDC | CNV__snp6 |
| TCGA-A2-A259-01A-11D-A16C-01 | Affymetrix SNP 6.0 | (TODO) -- GDC | CNV__unfiltered__snp6 |
| TCGA-A2-A259-01A-11D-A16C-01 | Affymetrix SNP 6.0 | (TODO) -- GDC | CNV__snp6 |
| TCGA-A2-A25A-01A-12D-A16C-01 | Affymetrix SNP 6.0 | (TODO) -- GDC | CNV__unfiltered__snp6 |
| TCGA-A2-A25A-01A-12D-A16C-01 | Affymetrix SNP 6.0 | (TODO) -- GDC | CNV__snp6 |
| TCGA-A2-A25B-01A-11D-A166-01 | Affymetrix SNP 6.0 | (TODO) -- GDC | CNV__unfiltered__snp6 |
| TCGA-A2-A25B-01A-11D-A166-01 | Affymetrix SNP 6.0 | (TODO) -- GDC | CNV__snp6 |
| TCGA-A2-A25C-01A-11D-A166-01 | Affymetrix SNP 6.0 | (TODO) -- GDC | CNV__unfiltered__snp6 |
| TCGA-A2-A25C-01A-11D-A166-01 | Affymetrix SNP 6.0 | (TODO) -- GDC | CNV__snp6 |
| TCGA-A2-A25D-01A-12D-A16C-01 | Affymetrix SNP 6.0 | (TODO) -- GDC | CNV__unfiltered__snp6 |
| TCGA-A2-A25D-01A-12D-A16C-01 | Affymetrix SNP 6.0 | (TODO) -- GDC | CNV__snp6 |
| TCGA-A2-A25E-01A-11D-A166-01 | Affymetrix SNP 6.0 | (TODO) -- GDC | CNV__unfiltered__snp6 |
| TCGA-A2-A25E-01A-11D-A166-01 | Affymetrix SNP 6.0 | (TODO) -- GDC | CNV__snp6 |
| TCGA-A2-A25F-01A-11D-A166-01 | Affymetrix SNP 6.0 | (TODO) -- GDC | CNV__unfiltered__snp6 |
| TCGA-A2-A25F-01A-11D-A166-01 | Affymetrix SNP 6.0 | (TODO) -- GDC | CNV__snp6 |
| TCGA-A2-A3KC-01A-11D-A20R-01 | Affymetrix SNP 6.0 | (TODO) -- GDC | CNV__unfiltered__snp6 |
| TCGA-A2-A3KC-01A-11D-A20R-01 | Affymetrix SNP 6.0 | (TODO) -- GDC | CNV__snp6 |
| TCGA-A2-A3KD-01A-12D-A20R-01 | Affymetrix SNP 6.0 | (TODO) -- GDC | CNV__unfiltered__snp6 |
| TCGA-A2-A3KD-01A-12D-A20R-01 | Affymetrix SNP 6.0 | (TODO) -- GDC | CNV__snp6 |
| TCGA-A2-A3XS-01A-11D-A22W-01 | Affymetrix SNP 6.0 | (TODO) -- GDC | CNV__unfiltered__snp6 |
| TCGA-A2-A3XS-01A-11D-A22W-01 | Affymetrix SNP 6.0 | (TODO) -- GDC | CNV__snp6 |
| TCGA-A2-A3XT-01A-11D-A22W-01 | Affymetrix SNP 6.0 | (TODO) -- GDC | CNV__unfiltered__snp6 |
| TCGA-A2-A3XT-01A-11D-A22W-01 | Affymetrix SNP 6.0 | (TODO) -- GDC | CNV__snp6 |
| TCGA-A2-A3XU-01A-12D-A22W-01 | Affymetrix SNP 6.0 | (TODO) -- GDC | CNV__unfiltered__snp6 |
| TCGA-A2-A3XU-01A-12D-A22W-01 | Affymetrix SNP 6.0 | (TODO) -- GDC | CNV__snp6 |
| TCGA-A2-A3XV-01A-21D-A238-01 | Affymetrix SNP 6.0 | (TODO) -- GDC | CNV__unfiltered__snp6 |
| TCGA-A2-A3XV-01A-21D-A238-01 | Affymetrix SNP 6.0 | (TODO) -- GDC | CNV__snp6 |
| TCGA-A2-A3XW-01A-11D-A238-01 | Affymetrix SNP 6.0 | (TODO) -- GDC | CNV__unfiltered__snp6 |
| TCGA-A2-A3XW-01A-11D-A238-01 | Affymetrix SNP 6.0 | (TODO) -- GDC | CNV__snp6 |
| TCGA-A2-A3XX-01A-21D-A238-01 | Affymetrix SNP 6.0 | (TODO) -- GDC | CNV__unfiltered__snp6 |
| TCGA-A2-A3XX-01A-21D-A238-01 | Affymetrix SNP 6.0 | (TODO) -- GDC | CNV__snp6 |
| TCGA-A2-A3XY-01A-11D-A238-01 | Affymetrix SNP 6.0 | (TODO) -- GDC | CNV__unfiltered__snp6 |
| TCGA-A2-A3XY-01A-11D-A238-01 | Affymetrix SNP 6.0 | (TODO) -- GDC | CNV__snp6 |
| TCGA-A2-A3XZ-01A-42D-A238-01 | Affymetrix SNP 6.0 | (TODO) -- GDC | CNV__unfiltered__snp6 |
| TCGA-A2-A3XZ-01A-42D-A238-01 | Affymetrix SNP 6.0 | (TODO) -- GDC | CNV__snp6 |
| TCGA-A2-A3Y0-01A-11D-A238-01 | Affymetrix SNP 6.0 | (TODO) -- GDC | CNV__unfiltered__snp6 |
| TCGA-A2-A3Y0-01A-11D-A238-01 | Affymetrix SNP 6.0 | (TODO) -- GDC | CNV__snp6 |
| TCGA-A2-A4RW-01A-21D-A25N-01 | Affymetrix SNP 6.0 | (TODO) -- GDC | CNV__unfiltered__snp6 |
| TCGA-A2-A4RW-01A-21D-A25N-01 | Affymetrix SNP 6.0 | (TODO) -- GDC | CNV__snp6 |
| TCGA-A2-A4RX-01A-11D-A25N-01 | Affymetrix SNP 6.0 | (TODO) -- GDC | CNV__unfiltered__snp6 |
| TCGA-A2-A4RX-01A-11D-A25N-01 | Affymetrix SNP 6.0 | (TODO) -- GDC | CNV__snp6 |
| TCGA-A2-A4RY-01A-31D-A25N-01 | Affymetrix SNP 6.0 | (TODO) -- GDC | CNV__unfiltered__snp6 |
| TCGA-A2-A4RY-01A-31D-A25N-01 | Affymetrix SNP 6.0 | (TODO) -- GDC | CNV__snp6 |
| TCGA-A2-A4S0-01A-21D-A25N-01 | Affymetrix SNP 6.0 | (TODO) -- GDC | CNV__unfiltered__snp6 |
| TCGA-A2-A4S0-01A-21D-A25N-01 | Affymetrix SNP 6.0 | (TODO) -- GDC | CNV__snp6 |
| TCGA-A2-A4S1-01A-21D-A25N-01 | Affymetrix SNP 6.0 | (TODO) -- GDC | CNV__unfiltered__snp6 |
| TCGA-A2-A4S1-01A-21D-A25N-01 | Affymetrix SNP 6.0 | (TODO) -- GDC | CNV__snp6 |
| TCGA-A2-A4S2-01A-12D-A25N-01 | Affymetrix SNP 6.0 | (TODO) -- GDC | CNV__unfiltered__snp6 |
| TCGA-A2-A4S2-01A-12D-A25N-01 | Affymetrix SNP 6.0 | (TODO) -- GDC | CNV__snp6 |
| TCGA-A2-A4S3-01A-21D-A25N-01 | Affymetrix SNP 6.0 | (TODO) -- GDC | CNV__unfiltered__snp6 |
| TCGA-A2-A4S3-01A-21D-A25N-01 | Affymetrix SNP 6.0 | (TODO) -- GDC | CNV__snp6 |
| TCGA-A7-A0CD-01A-11D-A011-01 | Affymetrix SNP 6.0 | (TODO) -- GDC | CNV__unfiltered__snp6 |
| TCGA-A7-A0CD-01A-11D-A011-01 | Affymetrix SNP 6.0 | (TODO) -- GDC | CNV__snp6 |
| TCGA-A7-A0CE-01A-11D-A011-01 | Affymetrix SNP 6.0 | (TODO) -- GDC | CNV__unfiltered__snp6 |
| TCGA-A7-A0CE-01A-11D-A011-01 | Affymetrix SNP 6.0 | (TODO) -- GDC | CNV__snp6 |
| TCGA-A7-A0CG-01A-11D-A011-01 | Affymetrix SNP 6.0 | (TODO) -- GDC | CNV__unfiltered__snp6 |
| TCGA-A7-A0CG-01A-11D-A011-01 | Affymetrix SNP 6.0 | (TODO) -- GDC | CNV__snp6 |
| TCGA-A7-A0CH-01A-21D-A011-01 | Affymetrix SNP 6.0 | (TODO) -- GDC | CNV__unfiltered__snp6 |
| TCGA-A7-A0CH-01A-21D-A011-01 | Affymetrix SNP 6.0 | (TODO) -- GDC | CNV__snp6 |
| TCGA-A7-A0CJ-01A-21D-A011-01 | Affymetrix SNP 6.0 | (TODO) -- GDC | CNV__unfiltered__snp6 |
| TCGA-A7-A0CJ-01A-21D-A011-01 | Affymetrix SNP 6.0 | (TODO) -- GDC | CNV__snp6 |
| TCGA-A7-A0D9-01A-31D-A059-01 | Affymetrix SNP 6.0 | (TODO) -- GDC | CNV__unfiltered__snp6 |
| TCGA-A7-A0D9-01A-31D-A059-01 | Affymetrix SNP 6.0 | (TODO) -- GDC | CNV__snp6 |
| TCGA-A7-A0DA-01A-31D-A111-01 | Affymetrix SNP 6.0 | (TODO) -- GDC | CNV__unfiltered__snp6 |
| TCGA-A7-A0DA-01A-31D-A111-01 | Affymetrix SNP 6.0 | (TODO) -- GDC | CNV__snp6 |
| TCGA-A7-A0DB-01A-11D-A011-01 | Affymetrix SNP 6.0 | (TODO) -- GDC | CNV__unfiltered__snp6 |
| TCGA-A7-A0DB-01A-11D-A011-01 | Affymetrix SNP 6.0 | (TODO) -- GDC | CNV__snp6 |
| TCGA-A7-A0DC-01A-11D-A011-01 | Affymetrix SNP 6.0 | (TODO) -- GDC | CNV__unfiltered__snp6 |
| TCGA-A7-A0DC-01A-11D-A011-01 | Affymetrix SNP 6.0 | (TODO) -- GDC | CNV__snp6 |
| TCGA-A7-A13D-01A-13D-A12N-01 | Affymetrix SNP 6.0 | (TODO) -- GDC | CNV__unfiltered__snp6 |
| TCGA-A7-A13D-01A-13D-A12N-01 | Affymetrix SNP 6.0 | (TODO) -- GDC | CNV__snp6 |
| TCGA-A7-A13E-01A-11D-A12N-01 | Affymetrix SNP 6.0 | (TODO) -- GDC | CNV__unfiltered__snp6 |
| TCGA-A7-A13E-01A-11D-A12N-01 | Affymetrix SNP 6.0 | (TODO) -- GDC | CNV__snp6 |
| TCGA-A7-A13F-01A-11D-A12N-01 | Affymetrix SNP 6.0 | (TODO) -- GDC | CNV__unfiltered__snp6 |
| TCGA-A7-A13F-01A-11D-A12N-01 | Affymetrix SNP 6.0 | (TODO) -- GDC | CNV__snp6 |
| TCGA-A7-A13G-01A-11D-A13J-01 | Affymetrix SNP 6.0 | (TODO) -- GDC | CNV__unfiltered__snp6 |
| TCGA-A7-A13G-01A-11D-A13J-01 | Affymetrix SNP 6.0 | (TODO) -- GDC | CNV__snp6 |
| TCGA-A7-A13H-01A-11D-A227-01 | Affymetrix SNP 6.0 | (TODO) -- GDC | CNV__unfiltered__snp6 |
| TCGA-A7-A13H-01A-11D-A227-01 | Affymetrix SNP 6.0 | (TODO) -- GDC | CNV__snp6 |
| TCGA-A7-A26E-01A-11D-A166-01 | Affymetrix SNP 6.0 | (TODO) -- GDC | CNV__unfiltered__snp6 |
| TCGA-A7-A26E-01A-11D-A166-01 | Affymetrix SNP 6.0 | (TODO) -- GDC | CNV__snp6 |
| TCGA-A7-A26E-01A-11D-A275-01 | Affymetrix SNP 6.0 | (TODO) -- GDC | CNV__unfiltered__snp6 |
| TCGA-A7-A26E-01A-11D-A275-01 | Affymetrix SNP 6.0 | (TODO) -- GDC | CNV__snp6 |
| TCGA-A7-A26F-01A-21D-A166-01 | Affymetrix SNP 6.0 | (TODO) -- GDC | CNV__unfiltered__snp6 |
| TCGA-A7-A26F-01A-21D-A166-01 | Affymetrix SNP 6.0 | (TODO) -- GDC | CNV__snp6 |
| TCGA-A7-A26G-01A-21D-A166-01 | Affymetrix SNP 6.0 | (TODO) -- GDC | CNV__unfiltered__snp6 |
| TCGA-A7-A26G-01A-21D-A166-01 | Affymetrix SNP 6.0 | (TODO) -- GDC | CNV__snp6 |
| TCGA-A7-A26H-01A-11D-A166-01 | Affymetrix SNP 6.0 | (TODO) -- GDC | CNV__unfiltered__snp6 |
| TCGA-A7-A26H-01A-11D-A166-01 | Affymetrix SNP 6.0 | (TODO) -- GDC | CNV__snp6 |
| TCGA-A7-A26I-01A-11D-A166-01 | Affymetrix SNP 6.0 | (TODO) -- GDC | CNV__unfiltered__snp6 |
| TCGA-A7-A26I-01A-11D-A166-01 | Affymetrix SNP 6.0 | (TODO) -- GDC | CNV__snp6 |
| TCGA-A7-A26J-01A-11D-A166-01 | Affymetrix SNP 6.0 | (TODO) -- GDC | CNV__unfiltered__snp6 |
| TCGA-A7-A26J-01A-11D-A166-01 | Affymetrix SNP 6.0 | (TODO) -- GDC | CNV__snp6 |
| TCGA-A7-A26J-01A-11D-A275-01 | Affymetrix SNP 6.0 | (TODO) -- GDC | CNV__unfiltered__snp6 |
| TCGA-A7-A26J-01A-11D-A275-01 | Affymetrix SNP 6.0 | (TODO) -- GDC | CNV__snp6 |
| TCGA-A7-A2KD-01A-31D-A21P-01 | Affymetrix SNP 6.0 | (TODO) -- GDC | CNV__unfiltered__snp6 |
| TCGA-A7-A2KD-01A-31D-A21P-01 | Affymetrix SNP 6.0 | (TODO) -- GDC | CNV__snp6 |
| TCGA-A7-A3IY-01A-21D-A21P-01 | Affymetrix SNP 6.0 | (TODO) -- GDC | CNV__unfiltered__snp6 |
| TCGA-A7-A3IY-01A-21D-A21P-01 | Affymetrix SNP 6.0 | (TODO) -- GDC | CNV__snp6 |
| TCGA-A7-A3IZ-01A-11D-A20R-01 | Affymetrix SNP 6.0 | (TODO) -- GDC | CNV__unfiltered__snp6 |
| TCGA-A7-A3IZ-01A-11D-A20R-01 | Affymetrix SNP 6.0 | (TODO) -- GDC | CNV__snp6 |
| TCGA-A7-A3J0-01A-11D-A20R-01 | Affymetrix SNP 6.0 | (TODO) -- GDC | CNV__unfiltered__snp6 |
| TCGA-A7-A3J0-01A-11D-A20R-01 | Affymetrix SNP 6.0 | (TODO) -- GDC | CNV__snp6 |
| TCGA-A7-A3J1-01A-11D-A20R-01 | Affymetrix SNP 6.0 | (TODO) -- GDC | CNV__unfiltered__snp6 |
| TCGA-A7-A3J1-01A-11D-A20R-01 | Affymetrix SNP 6.0 | (TODO) -- GDC | CNV__snp6 |
| TCGA-A7-A3RF-01A-11D-A227-01 | Affymetrix SNP 6.0 | (TODO) -- GDC | CNV__unfiltered__snp6 |
| TCGA-A7-A3RF-01A-11D-A227-01 | Affymetrix SNP 6.0 | (TODO) -- GDC | CNV__snp6 |
| TCGA-A7-A425-01A-11D-A242-01 | Affymetrix SNP 6.0 | (TODO) -- GDC | CNV__unfiltered__snp6 |
| TCGA-A7-A425-01A-11D-A242-01 | Affymetrix SNP 6.0 | (TODO) -- GDC | CNV__snp6 |
| TCGA-A7-A426-01A-22D-A242-01 | Affymetrix SNP 6.0 | (TODO) -- GDC | CNV__unfiltered__snp6 |
| TCGA-A7-A426-01A-22D-A242-01 | Affymetrix SNP 6.0 | (TODO) -- GDC | CNV__snp6 |
| TCGA-A7-A4SA-01A-11D-A25N-01 | Affymetrix SNP 6.0 | (TODO) -- GDC | CNV__unfiltered__snp6 |
| TCGA-A7-A4SA-01A-11D-A25N-01 | Affymetrix SNP 6.0 | (TODO) -- GDC | CNV__snp6 |
| TCGA-A7-A4SB-01A-21D-A25N-01 | Affymetrix SNP 6.0 | (TODO) -- GDC | CNV__unfiltered__snp6 |
| TCGA-A7-A4SB-01A-21D-A25N-01 | Affymetrix SNP 6.0 | (TODO) -- GDC | CNV__snp6 |
| TCGA-A7-A4SC-01A-12D-A25N-01 | Affymetrix SNP 6.0 | (TODO) -- GDC | CNV__unfiltered__snp6 |
| TCGA-A7-A4SC-01A-12D-A25N-01 | Affymetrix SNP 6.0 | (TODO) -- GDC | CNV__snp6 |
| TCGA-A7-A4SD-01A-11D-A25N-01 | Affymetrix SNP 6.0 | (TODO) -- GDC | CNV__unfiltered__snp6 |
| TCGA-A7-A4SD-01A-11D-A25N-01 | Affymetrix SNP 6.0 | (TODO) -- GDC | CNV__snp6 |
| TCGA-A7-A4SE-01A-11D-A25N-01 | Affymetrix SNP 6.0 | (TODO) -- GDC | CNV__unfiltered__snp6 |
| TCGA-A7-A4SE-01A-11D-A25N-01 | Affymetrix SNP 6.0 | (TODO) -- GDC | CNV__snp6 |
| TCGA-A7-A4SF-01A-11D-A25N-01 | Affymetrix SNP 6.0 | (TODO) -- GDC | CNV__unfiltered__snp6 |
| TCGA-A7-A4SF-01A-11D-A25N-01 | Affymetrix SNP 6.0 | (TODO) -- GDC | CNV__snp6 |
| TCGA-A7-A56D-01A-11D-A27O-01 | Affymetrix SNP 6.0 | (TODO) -- GDC | CNV__unfiltered__snp6 |
| TCGA-A7-A56D-01A-11D-A27O-01 | Affymetrix SNP 6.0 | (TODO) -- GDC | CNV__snp6 |
| TCGA-A7-A5ZV-01A-11D-A28A-01 | Affymetrix SNP 6.0 | (TODO) -- GDC | CNV__unfiltered__snp6 |
| TCGA-A7-A5ZV-01A-11D-A28A-01 | Affymetrix SNP 6.0 | (TODO) -- GDC | CNV__snp6 |
| TCGA-A7-A5ZW-01A-12D-A29M-01 | Affymetrix SNP 6.0 | (TODO) -- GDC | CNV__unfiltered__snp6 |
| TCGA-A7-A5ZW-01A-12D-A29M-01 | Affymetrix SNP 6.0 | (TODO) -- GDC | CNV__snp6 |
| TCGA-A7-A5ZX-01A-12D-A29M-01 | Affymetrix SNP 6.0 | (TODO) -- GDC | CNV__unfiltered__snp6 |
| TCGA-A7-A5ZX-01A-12D-A29M-01 | Affymetrix SNP 6.0 | (TODO) -- GDC | CNV__snp6 |
| TCGA-A7-A6VV-01A-22D-A33D-01 | Affymetrix SNP 6.0 | (TODO) -- GDC | CNV__unfiltered__snp6 |
| TCGA-A7-A6VV-01A-22D-A33D-01 | Affymetrix SNP 6.0 | (TODO) -- GDC | CNV__snp6 |
| TCGA-A7-A6VW-01A-21D-A33D-01 | Affymetrix SNP 6.0 | (TODO) -- GDC | CNV__unfiltered__snp6 |
| TCGA-A7-A6VW-01A-21D-A33D-01 | Affymetrix SNP 6.0 | (TODO) -- GDC | CNV__snp6 |
| TCGA-A7-A6VX-01A-12D-A33D-01 | Affymetrix SNP 6.0 | (TODO) -- GDC | CNV__unfiltered__snp6 |
| TCGA-A7-A6VX-01A-12D-A33D-01 | Affymetrix SNP 6.0 | (TODO) -- GDC | CNV__snp6 |
| TCGA-A7-A6VY-01A-12D-A33D-01 | Affymetrix SNP 6.0 | (TODO) -- GDC | CNV__unfiltered__snp6 |
| TCGA-A7-A6VY-01A-12D-A33D-01 | Affymetrix SNP 6.0 | (TODO) -- GDC | CNV__snp6 |
| TCGA-A8-A06N-01A-11D-A011-01 | Affymetrix SNP 6.0 | (TODO) -- GDC | CNV__unfiltered__snp6 |
| TCGA-A8-A06N-01A-11D-A011-01 | Affymetrix SNP 6.0 | (TODO) -- GDC | CNV__snp6 |
| TCGA-A8-A06O-01A-11D-A011-01 | Affymetrix SNP 6.0 | (TODO) -- GDC | CNV__unfiltered__snp6 |
| TCGA-A8-A06O-01A-11D-A011-01 | Affymetrix SNP 6.0 | (TODO) -- GDC | CNV__snp6 |
| TCGA-A8-A06P-01A-11D-A011-01 | Affymetrix SNP 6.0 | (TODO) -- GDC | CNV__unfiltered__snp6 |
| TCGA-A8-A06P-01A-11D-A011-01 | Affymetrix SNP 6.0 | (TODO) -- GDC | CNV__snp6 |
| TCGA-A8-A06Q-01A-11D-A036-01 | Affymetrix SNP 6.0 | (TODO) -- GDC | CNV__unfiltered__snp6 |
| TCGA-A8-A06Q-01A-11D-A036-01 | Affymetrix SNP 6.0 | (TODO) -- GDC | CNV__snp6 |
| TCGA-A8-A06R-01A-11D-A011-01 | Affymetrix SNP 6.0 | (TODO) -- GDC | CNV__unfiltered__snp6 |
| TCGA-A8-A06R-01A-11D-A011-01 | Affymetrix SNP 6.0 | (TODO) -- GDC | CNV__snp6 |
| TCGA-A8-A06T-01A-11D-A011-01 | Affymetrix SNP 6.0 | (TODO) -- GDC | CNV__unfiltered__snp6 |
| TCGA-A8-A06T-01A-11D-A011-01 | Affymetrix SNP 6.0 | (TODO) -- GDC | CNV__snp6 |
| TCGA-A8-A06U-01A-11D-A011-01 | Affymetrix SNP 6.0 | (TODO) -- GDC | CNV__unfiltered__snp6 |
| TCGA-A8-A06U-01A-11D-A011-01 | Affymetrix SNP 6.0 | (TODO) -- GDC | CNV__snp6 |
| TCGA-A8-A06X-01A-21D-A011-01 | Affymetrix SNP 6.0 | (TODO) -- GDC | CNV__unfiltered__snp6 |
| TCGA-A8-A06X-01A-21D-A011-01 | Affymetrix SNP 6.0 | (TODO) -- GDC | CNV__snp6 |
| TCGA-A8-A06Y-01A-21D-A011-01 | Affymetrix SNP 6.0 | (TODO) -- GDC | CNV__unfiltered__snp6 |
| TCGA-A8-A06Y-01A-21D-A011-01 | Affymetrix SNP 6.0 | (TODO) -- GDC | CNV__snp6 |
| TCGA-A8-A06Z-01A-11D-A011-01 | Affymetrix SNP 6.0 | (TODO) -- GDC | CNV__unfiltered__snp6 |
| TCGA-A8-A06Z-01A-11D-A011-01 | Affymetrix SNP 6.0 | (TODO) -- GDC | CNV__snp6 |
| TCGA-A8-A075-01A-11D-A087-01 | Affymetrix SNP 6.0 | (TODO) -- GDC | CNV__unfiltered__snp6 |
| TCGA-A8-A075-01A-11D-A087-01 | Affymetrix SNP 6.0 | (TODO) -- GDC | CNV__snp6 |
| TCGA-A8-A076-01A-21D-A011-01 | Affymetrix SNP 6.0 | (TODO) -- GDC | CNV__unfiltered__snp6 |
| TCGA-A8-A076-01A-21D-A011-01 | Affymetrix SNP 6.0 | (TODO) -- GDC | CNV__snp6 |
| TCGA-A8-A079-01A-21D-A011-01 | Affymetrix SNP 6.0 | (TODO) -- GDC | CNV__unfiltered__snp6 |
| TCGA-A8-A079-01A-21D-A011-01 | Affymetrix SNP 6.0 | (TODO) -- GDC | CNV__snp6 |
| TCGA-A8-A07B-01A-11D-A011-01 | Affymetrix SNP 6.0 | (TODO) -- GDC | CNV__unfiltered__snp6 |
| TCGA-A8-A07B-01A-11D-A011-01 | Affymetrix SNP 6.0 | (TODO) -- GDC | CNV__snp6 |
| TCGA-A8-A07C-01A-11D-A036-01 | Affymetrix SNP 6.0 | (TODO) -- GDC | CNV__unfiltered__snp6 |
| TCGA-A8-A07C-01A-11D-A036-01 | Affymetrix SNP 6.0 | (TODO) -- GDC | CNV__snp6 |
| TCGA-A8-A07E-01A-11D-A036-01 | Affymetrix SNP 6.0 | (TODO) -- GDC | CNV__unfiltered__snp6 |
| TCGA-A8-A07E-01A-11D-A036-01 | Affymetrix SNP 6.0 | (TODO) -- GDC | CNV__snp6 |
| TCGA-A8-A07F-01A-11D-A011-01 | Affymetrix SNP 6.0 | (TODO) -- GDC | CNV__unfiltered__snp6 |
| TCGA-A8-A07F-01A-11D-A011-01 | Affymetrix SNP 6.0 | (TODO) -- GDC | CNV__snp6 |
| TCGA-A8-A07G-01A-11D-A036-01 | Affymetrix SNP 6.0 | (TODO) -- GDC | CNV__unfiltered__snp6 |
| TCGA-A8-A07G-01A-11D-A036-01 | Affymetrix SNP 6.0 | (TODO) -- GDC | CNV__snp6 |
| TCGA-A8-A07I-01A-11D-A011-01 | Affymetrix SNP 6.0 | (TODO) -- GDC | CNV__unfiltered__snp6 |
| TCGA-A8-A07I-01A-11D-A011-01 | Affymetrix SNP 6.0 | (TODO) -- GDC | CNV__snp6 |
| TCGA-A8-A07J-01A-11D-A011-01 | Affymetrix SNP 6.0 | (TODO) -- GDC | CNV__unfiltered__snp6 |
| TCGA-A8-A07J-01A-11D-A011-01 | Affymetrix SNP 6.0 | (TODO) -- GDC | CNV__snp6 |
| TCGA-A8-A07L-01A-11D-A011-01 | Affymetrix SNP 6.0 | (TODO) -- GDC | CNV__unfiltered__snp6 |
| TCGA-A8-A07L-01A-11D-A011-01 | Affymetrix SNP 6.0 | (TODO) -- GDC | CNV__snp6 |
| TCGA-A8-A07O-01A-11D-A011-01 | Affymetrix SNP 6.0 | (TODO) -- GDC | CNV__unfiltered__snp6 |
| TCGA-A8-A07O-01A-11D-A011-01 | Affymetrix SNP 6.0 | (TODO) -- GDC | CNV__snp6 |
| TCGA-A8-A07P-01A-11D-A011-01 | Affymetrix SNP 6.0 | (TODO) -- GDC | CNV__unfiltered__snp6 |
| TCGA-A8-A07P-01A-11D-A011-01 | Affymetrix SNP 6.0 | (TODO) -- GDC | CNV__snp6 |
| TCGA-A8-A07R-01A-21D-A036-01 | Affymetrix SNP 6.0 | (TODO) -- GDC | CNV__unfiltered__snp6 |
| TCGA-A8-A07R-01A-21D-A036-01 | Affymetrix SNP 6.0 | (TODO) -- GDC | CNV__snp6 |
| TCGA-A8-A07S-01A-11D-A036-01 | Affymetrix SNP 6.0 | (TODO) -- GDC | CNV__unfiltered__snp6 |
| TCGA-A8-A07S-01A-11D-A036-01 | Affymetrix SNP 6.0 | (TODO) -- GDC | CNV__snp6 |
| TCGA-A8-A07U-01A-11D-A036-01 | Affymetrix SNP 6.0 | (TODO) -- GDC | CNV__unfiltered__snp6 |
| TCGA-A8-A07U-01A-11D-A036-01 | Affymetrix SNP 6.0 | (TODO) -- GDC | CNV__snp6 |
| TCGA-A8-A07W-01A-11D-A011-01 | Affymetrix SNP 6.0 | (TODO) -- GDC | CNV__unfiltered__snp6 |
| TCGA-A8-A07W-01A-11D-A011-01 | Affymetrix SNP 6.0 | (TODO) -- GDC | CNV__snp6 |
| TCGA-A8-A07Z-01A-11D-A011-01 | Affymetrix SNP 6.0 | (TODO) -- GDC | CNV__unfiltered__snp6 |
| TCGA-A8-A07Z-01A-11D-A011-01 | Affymetrix SNP 6.0 | (TODO) -- GDC | CNV__snp6 |
| TCGA-A8-A081-01A-11D-A011-01 | Affymetrix SNP 6.0 | (TODO) -- GDC | CNV__unfiltered__snp6 |
| TCGA-A8-A081-01A-11D-A011-01 | Affymetrix SNP 6.0 | (TODO) -- GDC | CNV__snp6 |
| TCGA-A8-A082-01A-11D-A011-01 | Affymetrix SNP 6.0 | (TODO) -- GDC | CNV__unfiltered__snp6 |
| TCGA-A8-A082-01A-11D-A011-01 | Affymetrix SNP 6.0 | (TODO) -- GDC | CNV__snp6 |
| TCGA-A8-A083-01A-21D-A011-01 | Affymetrix SNP 6.0 | (TODO) -- GDC | CNV__unfiltered__snp6 |
| TCGA-A8-A083-01A-21D-A011-01 | Affymetrix SNP 6.0 | (TODO) -- GDC | CNV__snp6 |
| TCGA-A8-A084-01A-21D-A011-01 | Affymetrix SNP 6.0 | (TODO) -- GDC | CNV__unfiltered__snp6 |
| TCGA-A8-A084-01A-21D-A011-01 | Affymetrix SNP 6.0 | (TODO) -- GDC | CNV__snp6 |
| TCGA-A8-A085-01A-11D-A011-01 | Affymetrix SNP 6.0 | (TODO) -- GDC | CNV__unfiltered__snp6 |
| TCGA-A8-A085-01A-11D-A011-01 | Affymetrix SNP 6.0 | (TODO) -- GDC | CNV__snp6 |
| TCGA-A8-A086-01A-11D-A011-01 | Affymetrix SNP 6.0 | (TODO) -- GDC | CNV__unfiltered__snp6 |
| TCGA-A8-A086-01A-11D-A011-01 | Affymetrix SNP 6.0 | (TODO) -- GDC | CNV__snp6 |
| TCGA-A8-A08A-01A-11D-A011-01 | Affymetrix SNP 6.0 | (TODO) -- GDC | CNV__unfiltered__snp6 |
| TCGA-A8-A08A-01A-11D-A011-01 | Affymetrix SNP 6.0 | (TODO) -- GDC | CNV__snp6 |
| TCGA-A8-A08B-01A-11D-A011-01 | Affymetrix SNP 6.0 | (TODO) -- GDC | CNV__unfiltered__snp6 |
| TCGA-A8-A08B-01A-11D-A011-01 | Affymetrix SNP 6.0 | (TODO) -- GDC | CNV__snp6 |
| TCGA-A8-A08C-01A-11D-A011-01 | Affymetrix SNP 6.0 | (TODO) -- GDC | CNV__unfiltered__snp6 |
| TCGA-A8-A08C-01A-11D-A011-01 | Affymetrix SNP 6.0 | (TODO) -- GDC | CNV__snp6 |
| TCGA-A8-A08F-01A-11D-A011-01 | Affymetrix SNP 6.0 | (TODO) -- GDC | CNV__unfiltered__snp6 |
| TCGA-A8-A08F-01A-11D-A011-01 | Affymetrix SNP 6.0 | (TODO) -- GDC | CNV__snp6 |
| TCGA-A8-A08G-01A-11D-A011-01 | Affymetrix SNP 6.0 | (TODO) -- GDC | CNV__unfiltered__snp6 |
| TCGA-A8-A08G-01A-11D-A011-01 | Affymetrix SNP 6.0 | (TODO) -- GDC | CNV__snp6 |
| TCGA-A8-A08H-01A-21D-A011-01 | Affymetrix SNP 6.0 | (TODO) -- GDC | CNV__unfiltered__snp6 |
| TCGA-A8-A08H-01A-21D-A011-01 | Affymetrix SNP 6.0 | (TODO) -- GDC | CNV__snp6 |
| TCGA-A8-A08I-01A-11D-A011-01 | Affymetrix SNP 6.0 | (TODO) -- GDC | CNV__unfiltered__snp6 |
| TCGA-A8-A08I-01A-11D-A011-01 | Affymetrix SNP 6.0 | (TODO) -- GDC | CNV__snp6 |
| TCGA-A8-A08J-01A-11D-A011-01 | Affymetrix SNP 6.0 | (TODO) -- GDC | CNV__unfiltered__snp6 |
| TCGA-A8-A08J-01A-11D-A011-01 | Affymetrix SNP 6.0 | (TODO) -- GDC | CNV__snp6 |
| TCGA-A8-A08L-01A-11D-A011-01 | Affymetrix SNP 6.0 | (TODO) -- GDC | CNV__unfiltered__snp6 |
| TCGA-A8-A08L-01A-11D-A011-01 | Affymetrix SNP 6.0 | (TODO) -- GDC | CNV__snp6 |
| TCGA-A8-A08O-01A-21D-A059-01 | Affymetrix SNP 6.0 | (TODO) -- GDC | CNV__unfiltered__snp6 |
| TCGA-A8-A08O-01A-21D-A059-01 | Affymetrix SNP 6.0 | (TODO) -- GDC | CNV__snp6 |
| TCGA-A8-A08P-01A-11D-A011-01 | Affymetrix SNP 6.0 | (TODO) -- GDC | CNV__unfiltered__snp6 |
| TCGA-A8-A08P-01A-11D-A011-01 | Affymetrix SNP 6.0 | (TODO) -- GDC | CNV__snp6 |
| TCGA-A8-A08R-01A-11D-A036-01 | Affymetrix SNP 6.0 | (TODO) -- GDC | CNV__unfiltered__snp6 |
| TCGA-A8-A08R-01A-11D-A036-01 | Affymetrix SNP 6.0 | (TODO) -- GDC | CNV__snp6 |
| TCGA-A8-A08S-01A-11D-A036-01 | Affymetrix SNP 6.0 | (TODO) -- GDC | CNV__unfiltered__snp6 |
| TCGA-A8-A08S-01A-11D-A036-01 | Affymetrix SNP 6.0 | (TODO) -- GDC | CNV__snp6 |
| TCGA-A8-A08T-01A-21D-A011-01 | Affymetrix SNP 6.0 | (TODO) -- GDC | CNV__unfiltered__snp6 |
| TCGA-A8-A08T-01A-21D-A011-01 | Affymetrix SNP 6.0 | (TODO) -- GDC | CNV__snp6 |
| TCGA-A8-A08X-01A-21D-A011-01 | Affymetrix SNP 6.0 | (TODO) -- GDC | CNV__unfiltered__snp6 |
| TCGA-A8-A08X-01A-21D-A011-01 | Affymetrix SNP 6.0 | (TODO) -- GDC | CNV__snp6 |
| TCGA-A8-A08Z-01A-21D-A011-01 | Affymetrix SNP 6.0 | (TODO) -- GDC | CNV__unfiltered__snp6 |
| TCGA-A8-A08Z-01A-21D-A011-01 | Affymetrix SNP 6.0 | (TODO) -- GDC | CNV__snp6 |
| TCGA-A8-A090-01A-11D-A011-01 | Affymetrix SNP 6.0 | (TODO) -- GDC | CNV__unfiltered__snp6 |
| TCGA-A8-A090-01A-11D-A011-01 | Affymetrix SNP 6.0 | (TODO) -- GDC | CNV__snp6 |
| TCGA-A8-A091-01A-11D-A011-01 | Affymetrix SNP 6.0 | (TODO) -- GDC | CNV__unfiltered__snp6 |
| TCGA-A8-A091-01A-11D-A011-01 | Affymetrix SNP 6.0 | (TODO) -- GDC | CNV__snp6 |
| TCGA-A8-A092-01A-11D-A011-01 | Affymetrix SNP 6.0 | (TODO) -- GDC | CNV__unfiltered__snp6 |
| TCGA-A8-A092-01A-11D-A011-01 | Affymetrix SNP 6.0 | (TODO) -- GDC | CNV__snp6 |
| TCGA-A8-A093-01A-11D-A011-01 | Affymetrix SNP 6.0 | (TODO) -- GDC | CNV__unfiltered__snp6 |
| TCGA-A8-A093-01A-11D-A011-01 | Affymetrix SNP 6.0 | (TODO) -- GDC | CNV__snp6 |
| TCGA-A8-A094-01A-11D-A011-01 | Affymetrix SNP 6.0 | (TODO) -- GDC | CNV__unfiltered__snp6 |
| TCGA-A8-A094-01A-11D-A011-01 | Affymetrix SNP 6.0 | (TODO) -- GDC | CNV__snp6 |
| TCGA-A8-A095-01A-11D-A011-01 | Affymetrix SNP 6.0 | (TODO) -- GDC | CNV__unfiltered__snp6 |
| TCGA-A8-A095-01A-11D-A011-01 | Affymetrix SNP 6.0 | (TODO) -- GDC | CNV__snp6 |
| TCGA-A8-A096-01A-11D-A011-01 | Affymetrix SNP 6.0 | (TODO) -- GDC | CNV__unfiltered__snp6 |
| TCGA-A8-A096-01A-11D-A011-01 | Affymetrix SNP 6.0 | (TODO) -- GDC | CNV__snp6 |
| TCGA-A8-A097-01A-11D-A036-01 | Affymetrix SNP 6.0 | (TODO) -- GDC | CNV__unfiltered__snp6 |
| TCGA-A8-A097-01A-11D-A036-01 | Affymetrix SNP 6.0 | (TODO) -- GDC | CNV__snp6 |
| TCGA-A8-A099-01A-11D-A011-01 | Affymetrix SNP 6.0 | (TODO) -- GDC | CNV__unfiltered__snp6 |
| TCGA-A8-A099-01A-11D-A011-01 | Affymetrix SNP 6.0 | (TODO) -- GDC | CNV__snp6 |
| TCGA-A8-A09A-01A-11D-A011-01 | Affymetrix SNP 6.0 | (TODO) -- GDC | CNV__unfiltered__snp6 |
| TCGA-A8-A09A-01A-11D-A011-01 | Affymetrix SNP 6.0 | (TODO) -- GDC | CNV__snp6 |
| TCGA-A8-A09B-01A-11D-A011-01 | Affymetrix SNP 6.0 | (TODO) -- GDC | CNV__unfiltered__snp6 |
| TCGA-A8-A09B-01A-11D-A011-01 | Affymetrix SNP 6.0 | (TODO) -- GDC | CNV__snp6 |
| TCGA-A8-A09C-01A-11D-A011-01 | Affymetrix SNP 6.0 | (TODO) -- GDC | CNV__unfiltered__snp6 |
| TCGA-A8-A09C-01A-11D-A011-01 | Affymetrix SNP 6.0 | (TODO) -- GDC | CNV__snp6 |
| TCGA-A8-A09D-01A-11D-A011-01 | Affymetrix SNP 6.0 | (TODO) -- GDC | CNV__unfiltered__snp6 |
| TCGA-A8-A09D-01A-11D-A011-01 | Affymetrix SNP 6.0 | (TODO) -- GDC | CNV__snp6 |
| TCGA-A8-A09E-01A-11D-A011-01 | Affymetrix SNP 6.0 | (TODO) -- GDC | CNV__unfiltered__snp6 |
| TCGA-A8-A09E-01A-11D-A011-01 | Affymetrix SNP 6.0 | (TODO) -- GDC | CNV__snp6 |
| TCGA-A8-A09G-01A-21D-A011-01 | Affymetrix SNP 6.0 | (TODO) -- GDC | CNV__unfiltered__snp6 |
| TCGA-A8-A09G-01A-21D-A011-01 | Affymetrix SNP 6.0 | (TODO) -- GDC | CNV__snp6 |
| TCGA-A8-A09I-01A-22D-A036-01 | Affymetrix SNP 6.0 | (TODO) -- GDC | CNV__unfiltered__snp6 |
| TCGA-A8-A09I-01A-22D-A036-01 | Affymetrix SNP 6.0 | (TODO) -- GDC | CNV__snp6 |
| TCGA-A8-A09K-01A-11D-A011-01 | Affymetrix SNP 6.0 | (TODO) -- GDC | CNV__unfiltered__snp6 |
| TCGA-A8-A09K-01A-11D-A011-01 | Affymetrix SNP 6.0 | (TODO) -- GDC | CNV__snp6 |
| TCGA-A8-A09M-01A-11D-A011-01 | Affymetrix SNP 6.0 | (TODO) -- GDC | CNV__unfiltered__snp6 |
| TCGA-A8-A09M-01A-11D-A011-01 | Affymetrix SNP 6.0 | (TODO) -- GDC | CNV__snp6 |
| TCGA-A8-A09N-01A-11D-A011-01 | Affymetrix SNP 6.0 | (TODO) -- GDC | CNV__unfiltered__snp6 |
| TCGA-A8-A09N-01A-11D-A011-01 | Affymetrix SNP 6.0 | (TODO) -- GDC | CNV__snp6 |
| TCGA-A8-A09Q-01A-11D-A011-01 | Affymetrix SNP 6.0 | (TODO) -- GDC | CNV__unfiltered__snp6 |
| TCGA-A8-A09Q-01A-11D-A011-01 | Affymetrix SNP 6.0 | (TODO) -- GDC | CNV__snp6 |
| TCGA-A8-A09R-01A-11D-A011-01 | Affymetrix SNP 6.0 | (TODO) -- GDC | CNV__unfiltered__snp6 |
| TCGA-A8-A09R-01A-11D-A011-01 | Affymetrix SNP 6.0 | (TODO) -- GDC | CNV__snp6 |
| TCGA-A8-A09T-01A-11D-A011-01 | Affymetrix SNP 6.0 | (TODO) -- GDC | CNV__unfiltered__snp6 |
| TCGA-A8-A09T-01A-11D-A011-01 | Affymetrix SNP 6.0 | (TODO) -- GDC | CNV__snp6 |
| TCGA-A8-A09V-01A-11D-A036-01 | Affymetrix SNP 6.0 | (TODO) -- GDC | CNV__unfiltered__snp6 |
| TCGA-A8-A09V-01A-11D-A036-01 | Affymetrix SNP 6.0 | (TODO) -- GDC | CNV__snp6 |
| TCGA-A8-A09W-01A-11D-A011-01 | Affymetrix SNP 6.0 | (TODO) -- GDC | CNV__unfiltered__snp6 |
| TCGA-A8-A09W-01A-11D-A011-01 | Affymetrix SNP 6.0 | (TODO) -- GDC | CNV__snp6 |
| TCGA-A8-A09X-01A-11D-A011-01 | Affymetrix SNP 6.0 | (TODO) -- GDC | CNV__unfiltered__snp6 |
| TCGA-A8-A09X-01A-11D-A011-01 | Affymetrix SNP 6.0 | (TODO) -- GDC | CNV__snp6 |
| TCGA-A8-A09Z-01A-11D-A011-01 | Affymetrix SNP 6.0 | (TODO) -- GDC | CNV__unfiltered__snp6 |
| TCGA-A8-A09Z-01A-11D-A011-01 | Affymetrix SNP 6.0 | (TODO) -- GDC | CNV__snp6 |
| TCGA-A8-A0A1-01A-11D-A011-01 | Affymetrix SNP 6.0 | (TODO) -- GDC | CNV__unfiltered__snp6 |
| TCGA-A8-A0A1-01A-11D-A011-01 | Affymetrix SNP 6.0 | (TODO) -- GDC | CNV__snp6 |
| TCGA-A8-A0A2-01A-11D-A036-01 | Affymetrix SNP 6.0 | (TODO) -- GDC | CNV__unfiltered__snp6 |
| TCGA-A8-A0A2-01A-11D-A036-01 | Affymetrix SNP 6.0 | (TODO) -- GDC | CNV__snp6 |
| TCGA-A8-A0A4-01A-11D-A011-01 | Affymetrix SNP 6.0 | (TODO) -- GDC | CNV__unfiltered__snp6 |
| TCGA-A8-A0A4-01A-11D-A011-01 | Affymetrix SNP 6.0 | (TODO) -- GDC | CNV__snp6 |
| TCGA-A8-A0A6-01A-12D-A059-01 | Affymetrix SNP 6.0 | (TODO) -- GDC | CNV__unfiltered__snp6 |
| TCGA-A8-A0A6-01A-12D-A059-01 | Affymetrix SNP 6.0 | (TODO) -- GDC | CNV__snp6 |
| TCGA-A8-A0A7-01A-11D-A011-01 | Affymetrix SNP 6.0 | (TODO) -- GDC | CNV__unfiltered__snp6 |
| TCGA-A8-A0A7-01A-11D-A011-01 | Affymetrix SNP 6.0 | (TODO) -- GDC | CNV__snp6 |
| TCGA-A8-A0A9-01A-11D-A011-01 | Affymetrix SNP 6.0 | (TODO) -- GDC | CNV__unfiltered__snp6 |
| TCGA-A8-A0A9-01A-11D-A011-01 | Affymetrix SNP 6.0 | (TODO) -- GDC | CNV__snp6 |
| TCGA-A8-A0AB-01A-11D-A036-01 | Affymetrix SNP 6.0 | (TODO) -- GDC | CNV__unfiltered__snp6 |
| TCGA-A8-A0AB-01A-11D-A036-01 | Affymetrix SNP 6.0 | (TODO) -- GDC | CNV__snp6 |
| TCGA-A8-A0AD-01A-11D-A059-01 | Affymetrix SNP 6.0 | (TODO) -- GDC | CNV__unfiltered__snp6 |
| TCGA-A8-A0AD-01A-11D-A059-01 | Affymetrix SNP 6.0 | (TODO) -- GDC | CNV__snp6 |
| TCGA-AC-A23C-01A-12D-A166-01 | Affymetrix SNP 6.0 | (TODO) -- GDC | CNV__unfiltered__snp6 |
| TCGA-AC-A23C-01A-12D-A166-01 | Affymetrix SNP 6.0 | (TODO) -- GDC | CNV__snp6 |
| TCGA-AC-A23E-01A-11D-A160-01 | Affymetrix SNP 6.0 | (TODO) -- GDC | CNV__unfiltered__snp6 |
| TCGA-AC-A23E-01A-11D-A160-01 | Affymetrix SNP 6.0 | (TODO) -- GDC | CNV__snp6 |
| TCGA-AC-A23G-01A-11D-A20R-01 | Affymetrix SNP 6.0 | (TODO) -- GDC | CNV__unfiltered__snp6 |
| TCGA-AC-A23G-01A-11D-A20R-01 | Affymetrix SNP 6.0 | (TODO) -- GDC | CNV__snp6 |
| TCGA-AC-A23H-01A-11D-A160-01 | Affymetrix SNP 6.0 | (TODO) -- GDC | CNV__unfiltered__snp6 |
| TCGA-AC-A23H-01A-11D-A160-01 | Affymetrix SNP 6.0 | (TODO) -- GDC | CNV__snp6 |
| TCGA-AC-A2B8-01A-11D-A17C-01 | Affymetrix SNP 6.0 | (TODO) -- GDC | CNV__unfiltered__snp6 |
| TCGA-AC-A2B8-01A-11D-A17C-01 | Affymetrix SNP 6.0 | (TODO) -- GDC | CNV__snp6 |
| TCGA-AC-A2BK-01A-11D-A21P-01 | Affymetrix SNP 6.0 | (TODO) -- GDC | CNV__unfiltered__snp6 |
| TCGA-AC-A2BK-01A-11D-A21P-01 | Affymetrix SNP 6.0 | (TODO) -- GDC | CNV__snp6 |
| TCGA-AC-A2BM-01A-11D-A21P-01 | Affymetrix SNP 6.0 | (TODO) -- GDC | CNV__unfiltered__snp6 |
| TCGA-AC-A2BM-01A-11D-A21P-01 | Affymetrix SNP 6.0 | (TODO) -- GDC | CNV__snp6 |
| TCGA-AC-A2FB-01A-11D-A17C-01 | Affymetrix SNP 6.0 | (TODO) -- GDC | CNV__unfiltered__snp6 |
| TCGA-AC-A2FB-01A-11D-A17C-01 | Affymetrix SNP 6.0 | (TODO) -- GDC | CNV__snp6 |
| TCGA-AC-A2FE-01A-11D-A19X-01 | Affymetrix SNP 6.0 | (TODO) -- GDC | CNV__unfiltered__snp6 |
| TCGA-AC-A2FE-01A-11D-A19X-01 | Affymetrix SNP 6.0 | (TODO) -- GDC | CNV__snp6 |
| TCGA-AC-A2FF-01A-11D-A17C-01 | Affymetrix SNP 6.0 | (TODO) -- GDC | CNV__unfiltered__snp6 |
| TCGA-AC-A2FF-01A-11D-A17C-01 | Affymetrix SNP 6.0 | (TODO) -- GDC | CNV__snp6 |
| TCGA-AC-A2FG-01A-11D-A17C-01 | Affymetrix SNP 6.0 | (TODO) -- GDC | CNV__unfiltered__snp6 |
| TCGA-AC-A2FG-01A-11D-A17C-01 | Affymetrix SNP 6.0 | (TODO) -- GDC | CNV__snp6 |
| TCGA-AC-A2FK-01A-12D-A17U-01 | Affymetrix SNP 6.0 | (TODO) -- GDC | CNV__unfiltered__snp6 |
| TCGA-AC-A2FK-01A-12D-A17U-01 | Affymetrix SNP 6.0 | (TODO) -- GDC | CNV__snp6 |
| TCGA-AC-A2FM-01A-11D-A19X-01 | Affymetrix SNP 6.0 | (TODO) -- GDC | CNV__unfiltered__snp6 |
| TCGA-AC-A2FM-01A-11D-A19X-01 | Affymetrix SNP 6.0 | (TODO) -- GDC | CNV__snp6 |
| TCGA-AC-A2FO-01A-11D-A17U-01 | Affymetrix SNP 6.0 | (TODO) -- GDC | CNV__unfiltered__snp6 |
| TCGA-AC-A2FO-01A-11D-A17U-01 | Affymetrix SNP 6.0 | (TODO) -- GDC | CNV__snp6 |
| TCGA-AC-A2QH-01A-11D-A18N-01 | Affymetrix SNP 6.0 | (TODO) -- GDC | CNV__unfiltered__snp6 |
| TCGA-AC-A2QH-01A-11D-A18N-01 | Affymetrix SNP 6.0 | (TODO) -- GDC | CNV__snp6 |
| TCGA-AC-A2QI-01A-12D-A19X-01 | Affymetrix SNP 6.0 | (TODO) -- GDC | CNV__unfiltered__snp6 |
| TCGA-AC-A2QI-01A-12D-A19X-01 | Affymetrix SNP 6.0 | (TODO) -- GDC | CNV__snp6 |
| TCGA-AC-A2QJ-01A-12D-A19X-01 | Affymetrix SNP 6.0 | (TODO) -- GDC | CNV__unfiltered__snp6 |
| TCGA-AC-A2QJ-01A-12D-A19X-01 | Affymetrix SNP 6.0 | (TODO) -- GDC | CNV__snp6 |
| TCGA-AC-A3BB-01A-21D-A19X-01 | Affymetrix SNP 6.0 | (TODO) -- GDC | CNV__unfiltered__snp6 |
| TCGA-AC-A3BB-01A-21D-A19X-01 | Affymetrix SNP 6.0 | (TODO) -- GDC | CNV__snp6 |
| TCGA-AC-A3EH-01A-22D-A227-01 | Affymetrix SNP 6.0 | (TODO) -- GDC | CNV__unfiltered__snp6 |
| TCGA-AC-A3EH-01A-22D-A227-01 | Affymetrix SNP 6.0 | (TODO) -- GDC | CNV__snp6 |
| TCGA-AC-A3HN-01A-11D-A20R-01 | Affymetrix SNP 6.0 | (TODO) -- GDC | CNV__unfiltered__snp6 |
| TCGA-AC-A3HN-01A-11D-A20R-01 | Affymetrix SNP 6.0 | (TODO) -- GDC | CNV__snp6 |
| TCGA-AC-A3OD-01A-11D-A21P-01 | Affymetrix SNP 6.0 | (TODO) -- GDC | CNV__unfiltered__snp6 |
| TCGA-AC-A3OD-01A-11D-A21P-01 | Affymetrix SNP 6.0 | (TODO) -- GDC | CNV__snp6 |
| TCGA-AC-A3QP-01A-11D-A22W-01 | Affymetrix SNP 6.0 | (TODO) -- GDC | CNV__unfiltered__snp6 |
| TCGA-AC-A3QP-01A-11D-A22W-01 | Affymetrix SNP 6.0 | (TODO) -- GDC | CNV__snp6 |
| TCGA-AC-A3QQ-01A-11D-A227-01 | Affymetrix SNP 6.0 | (TODO) -- GDC | CNV__unfiltered__snp6 |
| TCGA-AC-A3QQ-01A-11D-A227-01 | Affymetrix SNP 6.0 | (TODO) -- GDC | CNV__snp6 |
| TCGA-AC-A3TM-01A-11D-A227-01 | Affymetrix SNP 6.0 | (TODO) -- GDC | CNV__unfiltered__snp6 |
| TCGA-AC-A3TM-01A-11D-A227-01 | Affymetrix SNP 6.0 | (TODO) -- GDC | CNV__snp6 |
| TCGA-AC-A3TN-01A-11D-A227-01 | Affymetrix SNP 6.0 | (TODO) -- GDC | CNV__unfiltered__snp6 |
| TCGA-AC-A3TN-01A-11D-A227-01 | Affymetrix SNP 6.0 | (TODO) -- GDC | CNV__snp6 |
| TCGA-AC-A3W5-01A-11D-A227-01 | Affymetrix SNP 6.0 | (TODO) -- GDC | CNV__unfiltered__snp6 |
| TCGA-AC-A3W5-01A-11D-A227-01 | Affymetrix SNP 6.0 | (TODO) -- GDC | CNV__snp6 |
| TCGA-AC-A3W6-01A-12D-A227-01 | Affymetrix SNP 6.0 | (TODO) -- GDC | CNV__unfiltered__snp6 |
| TCGA-AC-A3W6-01A-12D-A227-01 | Affymetrix SNP 6.0 | (TODO) -- GDC | CNV__snp6 |
| TCGA-AC-A3W7-01A-11D-A227-01 | Affymetrix SNP 6.0 | (TODO) -- GDC | CNV__unfiltered__snp6 |
| TCGA-AC-A3W7-01A-11D-A227-01 | Affymetrix SNP 6.0 | (TODO) -- GDC | CNV__snp6 |
| TCGA-AC-A3YI-01A-21D-A238-01 | Affymetrix SNP 6.0 | (TODO) -- GDC | CNV__unfiltered__snp6 |
| TCGA-AC-A3YI-01A-21D-A238-01 | Affymetrix SNP 6.0 | (TODO) -- GDC | CNV__snp6 |
| TCGA-AC-A3YJ-01A-11D-A22W-01 | Affymetrix SNP 6.0 | (TODO) -- GDC | CNV__unfiltered__snp6 |
| TCGA-AC-A3YJ-01A-11D-A22W-01 | Affymetrix SNP 6.0 | (TODO) -- GDC | CNV__snp6 |
| TCGA-AC-A4ZE-01A-11D-A41E-01 | Affymetrix SNP 6.0 | (TODO) -- GDC | CNV__unfiltered__snp6 |
| TCGA-AC-A4ZE-01A-11D-A41E-01 | Affymetrix SNP 6.0 | (TODO) -- GDC | CNV__snp6 |
| TCGA-AC-A5EH-01A-11D-A28A-01 | Affymetrix SNP 6.0 | (TODO) -- GDC | CNV__unfiltered__snp6 |
| TCGA-AC-A5EH-01A-11D-A28A-01 | Affymetrix SNP 6.0 | (TODO) -- GDC | CNV__snp6 |
| TCGA-AC-A5EI-01A-11D-A27O-01 | Affymetrix SNP 6.0 | (TODO) -- GDC | CNV__unfiltered__snp6 |
| TCGA-AC-A5EI-01A-11D-A27O-01 | Affymetrix SNP 6.0 | (TODO) -- GDC | CNV__snp6 |
| TCGA-AC-A5XS-01A-11D-A29M-01 | Affymetrix SNP 6.0 | (TODO) -- GDC | CNV__unfiltered__snp6 |
| TCGA-AC-A5XS-01A-11D-A29M-01 | Affymetrix SNP 6.0 | (TODO) -- GDC | CNV__snp6 |
| TCGA-AC-A5XU-01A-11D-A28A-01 | Affymetrix SNP 6.0 | (TODO) -- GDC | CNV__unfiltered__snp6 |
| TCGA-AC-A5XU-01A-11D-A28A-01 | Affymetrix SNP 6.0 | (TODO) -- GDC | CNV__snp6 |
| TCGA-AC-A62V-01A-11D-A31T-01 | Affymetrix SNP 6.0 | (TODO) -- GDC | CNV__unfiltered__snp6 |
| TCGA-AC-A62V-01A-11D-A31T-01 | Affymetrix SNP 6.0 | (TODO) -- GDC | CNV__snp6 |
| TCGA-AC-A62X-01A-11D-A29M-01 | Affymetrix SNP 6.0 | (TODO) -- GDC | CNV__unfiltered__snp6 |
| TCGA-AC-A62X-01A-11D-A29M-01 | Affymetrix SNP 6.0 | (TODO) -- GDC | CNV__snp6 |
| TCGA-AC-A62Y-01A-11D-A29M-01 | Affymetrix SNP 6.0 | (TODO) -- GDC | CNV__unfiltered__snp6 |
| TCGA-AC-A62Y-01A-11D-A29M-01 | Affymetrix SNP 6.0 | (TODO) -- GDC | CNV__snp6 |
| TCGA-AC-A6IV-01A-12D-A33D-01 | Affymetrix SNP 6.0 | (TODO) -- GDC | CNV__unfiltered__snp6 |
| TCGA-AC-A6IV-01A-12D-A33D-01 | Affymetrix SNP 6.0 | (TODO) -- GDC | CNV__snp6 |
| TCGA-AC-A6IW-01A-12D-A33D-01 | Affymetrix SNP 6.0 | (TODO) -- GDC | CNV__unfiltered__snp6 |
| TCGA-AC-A6IW-01A-12D-A33D-01 | Affymetrix SNP 6.0 | (TODO) -- GDC | CNV__snp6 |
| TCGA-AC-A6IX-01A-12D-A32H-01 | Affymetrix SNP 6.0 | (TODO) -- GDC | CNV__unfiltered__snp6 |
| TCGA-AC-A6IX-01A-12D-A32H-01 | Affymetrix SNP 6.0 | (TODO) -- GDC | CNV__snp6 |
| TCGA-AC-A6NO-01A-12D-A33D-01 | Affymetrix SNP 6.0 | (TODO) -- GDC | CNV__unfiltered__snp6 |
| TCGA-AC-A6NO-01A-12D-A33D-01 | Affymetrix SNP 6.0 | (TODO) -- GDC | CNV__snp6 |
| TCGA-AC-A7VB-01A-11D-A350-01 | Affymetrix SNP 6.0 | (TODO) -- GDC | CNV__unfiltered__snp6 |
| TCGA-AC-A7VB-01A-11D-A350-01 | Affymetrix SNP 6.0 | (TODO) -- GDC | CNV__snp6 |
| TCGA-AC-A7VC-01A-11D-A350-01 | Affymetrix SNP 6.0 | (TODO) -- GDC | CNV__unfiltered__snp6 |
| TCGA-AC-A7VC-01A-11D-A350-01 | Affymetrix SNP 6.0 | (TODO) -- GDC | CNV__snp6 |
| TCGA-AC-A8OP-01A-11D-A36I-01 | Affymetrix SNP 6.0 | (TODO) -- GDC | CNV__unfiltered__snp6 |
| TCGA-AC-A8OP-01A-11D-A36I-01 | Affymetrix SNP 6.0 | (TODO) -- GDC | CNV__snp6 |
| TCGA-AC-A8OQ-01A-11D-A41E-01 | Affymetrix SNP 6.0 | (TODO) -- GDC | CNV__unfiltered__snp6 |
| TCGA-AC-A8OQ-01A-11D-A41E-01 | Affymetrix SNP 6.0 | (TODO) -- GDC | CNV__snp6 |
| TCGA-AC-A8OR-01A-21D-A41E-01 | Affymetrix SNP 6.0 | (TODO) -- GDC | CNV__unfiltered__snp6 |
| TCGA-AC-A8OR-01A-21D-A41E-01 | Affymetrix SNP 6.0 | (TODO) -- GDC | CNV__snp6 |
| TCGA-AC-A8OS-01A-12D-A41E-01 | Affymetrix SNP 6.0 | (TODO) -- GDC | CNV__unfiltered__snp6 |
| TCGA-AC-A8OS-01A-12D-A41E-01 | Affymetrix SNP 6.0 | (TODO) -- GDC | CNV__snp6 |
| TCGA-AN-A03X-01A-21D-A011-01 | Affymetrix SNP 6.0 | (TODO) -- GDC | CNV__unfiltered__snp6 |
| TCGA-AN-A03X-01A-21D-A011-01 | Affymetrix SNP 6.0 | (TODO) -- GDC | CNV__snp6 |
| TCGA-AN-A03Y-01A-21D-A011-01 | Affymetrix SNP 6.0 | (TODO) -- GDC | CNV__unfiltered__snp6 |
| TCGA-AN-A03Y-01A-21D-A011-01 | Affymetrix SNP 6.0 | (TODO) -- GDC | CNV__snp6 |
| TCGA-AN-A041-01A-11D-A036-01 | Affymetrix SNP 6.0 | (TODO) -- GDC | CNV__unfiltered__snp6 |
| TCGA-AN-A041-01A-11D-A036-01 | Affymetrix SNP 6.0 | (TODO) -- GDC | CNV__snp6 |
| TCGA-AN-A046-01A-21D-A036-01 | Affymetrix SNP 6.0 | (TODO) -- GDC | CNV__unfiltered__snp6 |
| TCGA-AN-A046-01A-21D-A036-01 | Affymetrix SNP 6.0 | (TODO) -- GDC | CNV__snp6 |
| TCGA-AN-A049-01A-21D-A011-01 | Affymetrix SNP 6.0 | (TODO) -- GDC | CNV__unfiltered__snp6 |
| TCGA-AN-A049-01A-21D-A011-01 | Affymetrix SNP 6.0 | (TODO) -- GDC | CNV__snp6 |
| TCGA-AN-A04A-01A-21D-A036-01 | Affymetrix SNP 6.0 | (TODO) -- GDC | CNV__unfiltered__snp6 |
| TCGA-AN-A04A-01A-21D-A036-01 | Affymetrix SNP 6.0 | (TODO) -- GDC | CNV__snp6 |
| TCGA-AN-A04C-01A-21D-A036-01 | Affymetrix SNP 6.0 | (TODO) -- GDC | CNV__unfiltered__snp6 |
| TCGA-AN-A04C-01A-21D-A036-01 | Affymetrix SNP 6.0 | (TODO) -- GDC | CNV__snp6 |
| TCGA-AN-A04D-01A-21D-A036-01 | Affymetrix SNP 6.0 | (TODO) -- GDC | CNV__unfiltered__snp6 |
| TCGA-AN-A04D-01A-21D-A036-01 | Affymetrix SNP 6.0 | (TODO) -- GDC | CNV__snp6 |
| TCGA-AN-A0AJ-01A-11D-A011-01 | Affymetrix SNP 6.0 | (TODO) -- GDC | CNV__unfiltered__snp6 |
| TCGA-AN-A0AJ-01A-11D-A011-01 | Affymetrix SNP 6.0 | (TODO) -- GDC | CNV__snp6 |
| TCGA-AN-A0AK-01A-21D-A011-01 | Affymetrix SNP 6.0 | (TODO) -- GDC | CNV__unfiltered__snp6 |
| TCGA-AN-A0AK-01A-21D-A011-01 | Affymetrix SNP 6.0 | (TODO) -- GDC | CNV__snp6 |
| TCGA-AN-A0AL-01A-11D-A011-01 | Affymetrix SNP 6.0 | (TODO) -- GDC | CNV__unfiltered__snp6 |
| TCGA-AN-A0AL-01A-11D-A011-01 | Affymetrix SNP 6.0 | (TODO) -- GDC | CNV__snp6 |
| TCGA-AN-A0AM-01A-11D-A036-01 | Affymetrix SNP 6.0 | (TODO) -- GDC | CNV__unfiltered__snp6 |
| TCGA-AN-A0AM-01A-11D-A036-01 | Affymetrix SNP 6.0 | (TODO) -- GDC | CNV__snp6 |
| TCGA-AN-A0AR-01A-11D-A011-01 | Affymetrix SNP 6.0 | (TODO) -- GDC | CNV__unfiltered__snp6 |
| TCGA-AN-A0AR-01A-11D-A011-01 | Affymetrix SNP 6.0 | (TODO) -- GDC | CNV__snp6 |
| TCGA-AN-A0AS-01A-11D-A011-01 | Affymetrix SNP 6.0 | (TODO) -- GDC | CNV__unfiltered__snp6 |
| TCGA-AN-A0AS-01A-11D-A011-01 | Affymetrix SNP 6.0 | (TODO) -- GDC | CNV__snp6 |
| TCGA-AN-A0AT-01A-11D-A036-01 | Affymetrix SNP 6.0 | (TODO) -- GDC | CNV__unfiltered__snp6 |
| TCGA-AN-A0AT-01A-11D-A036-01 | Affymetrix SNP 6.0 | (TODO) -- GDC | CNV__snp6 |
| TCGA-AN-A0FD-01A-11D-A036-01 | Affymetrix SNP 6.0 | (TODO) -- GDC | CNV__unfiltered__snp6 |
| TCGA-AN-A0FD-01A-11D-A036-01 | Affymetrix SNP 6.0 | (TODO) -- GDC | CNV__snp6 |
| TCGA-AN-A0FF-01A-11D-A036-01 | Affymetrix SNP 6.0 | (TODO) -- GDC | CNV__unfiltered__snp6 |
| TCGA-AN-A0FF-01A-11D-A036-01 | Affymetrix SNP 6.0 | (TODO) -- GDC | CNV__snp6 |
| TCGA-AN-A0FJ-01A-11D-A011-01 | Affymetrix SNP 6.0 | (TODO) -- GDC | CNV__unfiltered__snp6 |
| TCGA-AN-A0FJ-01A-11D-A011-01 | Affymetrix SNP 6.0 | (TODO) -- GDC | CNV__snp6 |
| TCGA-AN-A0FK-01A-11D-A036-01 | Affymetrix SNP 6.0 | (TODO) -- GDC | CNV__unfiltered__snp6 |
| TCGA-AN-A0FK-01A-11D-A036-01 | Affymetrix SNP 6.0 | (TODO) -- GDC | CNV__snp6 |
| TCGA-AN-A0FL-01A-11D-A036-01 | Affymetrix SNP 6.0 | (TODO) -- GDC | CNV__unfiltered__snp6 |
| TCGA-AN-A0FL-01A-11D-A036-01 | Affymetrix SNP 6.0 | (TODO) -- GDC | CNV__snp6 |
| TCGA-AN-A0FN-01A-11D-A036-01 | Affymetrix SNP 6.0 | (TODO) -- GDC | CNV__unfiltered__snp6 |
| TCGA-AN-A0FN-01A-11D-A036-01 | Affymetrix SNP 6.0 | (TODO) -- GDC | CNV__snp6 |
| TCGA-AN-A0FS-01A-11D-A036-01 | Affymetrix SNP 6.0 | (TODO) -- GDC | CNV__unfiltered__snp6 |
| TCGA-AN-A0FS-01A-11D-A036-01 | Affymetrix SNP 6.0 | (TODO) -- GDC | CNV__snp6 |
| TCGA-AN-A0FT-01A-11D-A036-01 | Affymetrix SNP 6.0 | (TODO) -- GDC | CNV__unfiltered__snp6 |
| TCGA-AN-A0FT-01A-11D-A036-01 | Affymetrix SNP 6.0 | (TODO) -- GDC | CNV__snp6 |
| TCGA-AN-A0FV-01A-11D-A011-01 | Affymetrix SNP 6.0 | (TODO) -- GDC | CNV__unfiltered__snp6 |
| TCGA-AN-A0FV-01A-11D-A011-01 | Affymetrix SNP 6.0 | (TODO) -- GDC | CNV__snp6 |
| TCGA-AN-A0FW-01A-11D-A036-01 | Affymetrix SNP 6.0 | (TODO) -- GDC | CNV__unfiltered__snp6 |
| TCGA-AN-A0FW-01A-11D-A036-01 | Affymetrix SNP 6.0 | (TODO) -- GDC | CNV__snp6 |
| TCGA-AN-A0FX-01A-11D-A036-01 | Affymetrix SNP 6.0 | (TODO) -- GDC | CNV__unfiltered__snp6 |
| TCGA-AN-A0FX-01A-11D-A036-01 | Affymetrix SNP 6.0 | (TODO) -- GDC | CNV__snp6 |
| TCGA-AN-A0FY-01A-11D-A036-01 | Affymetrix SNP 6.0 | (TODO) -- GDC | CNV__unfiltered__snp6 |
| TCGA-AN-A0FY-01A-11D-A036-01 | Affymetrix SNP 6.0 | (TODO) -- GDC | CNV__snp6 |
| TCGA-AN-A0FZ-01A-11D-A036-01 | Affymetrix SNP 6.0 | (TODO) -- GDC | CNV__unfiltered__snp6 |
| TCGA-AN-A0FZ-01A-11D-A036-01 | Affymetrix SNP 6.0 | (TODO) -- GDC | CNV__snp6 |
| TCGA-AN-A0G0-01A-11D-A036-01 | Affymetrix SNP 6.0 | (TODO) -- GDC | CNV__unfiltered__snp6 |
| TCGA-AN-A0G0-01A-11D-A036-01 | Affymetrix SNP 6.0 | (TODO) -- GDC | CNV__snp6 |
| TCGA-AN-A0XL-01A-11D-A10L-01 | Affymetrix SNP 6.0 | (TODO) -- GDC | CNV__unfiltered__snp6 |
| TCGA-AN-A0XL-01A-11D-A10L-01 | Affymetrix SNP 6.0 | (TODO) -- GDC | CNV__snp6 |
| TCGA-AN-A0XN-01A-21D-A107-01 | Affymetrix SNP 6.0 | (TODO) -- GDC | CNV__unfiltered__snp6 |
| TCGA-AN-A0XN-01A-21D-A107-01 | Affymetrix SNP 6.0 | (TODO) -- GDC | CNV__snp6 |
| TCGA-AN-A0XO-01A-11D-A107-01 | Affymetrix SNP 6.0 | (TODO) -- GDC | CNV__unfiltered__snp6 |
| TCGA-AN-A0XO-01A-11D-A107-01 | Affymetrix SNP 6.0 | (TODO) -- GDC | CNV__snp6 |
| TCGA-AN-A0XP-01A-11D-A107-01 | Affymetrix SNP 6.0 | (TODO) -- GDC | CNV__unfiltered__snp6 |
| TCGA-AN-A0XP-01A-11D-A107-01 | Affymetrix SNP 6.0 | (TODO) -- GDC | CNV__snp6 |
| TCGA-AN-A0XR-01A-11D-A107-01 | Affymetrix SNP 6.0 | (TODO) -- GDC | CNV__unfiltered__snp6 |
| TCGA-AN-A0XR-01A-11D-A107-01 | Affymetrix SNP 6.0 | (TODO) -- GDC | CNV__snp6 |
| TCGA-AN-A0XS-01A-22D-A107-01 | Affymetrix SNP 6.0 | (TODO) -- GDC | CNV__unfiltered__snp6 |
| TCGA-AN-A0XS-01A-22D-A107-01 | Affymetrix SNP 6.0 | (TODO) -- GDC | CNV__snp6 |
| TCGA-AN-A0XT-01A-11D-A107-01 | Affymetrix SNP 6.0 | (TODO) -- GDC | CNV__unfiltered__snp6 |
| TCGA-AN-A0XT-01A-11D-A107-01 | Affymetrix SNP 6.0 | (TODO) -- GDC | CNV__snp6 |
| TCGA-AN-A0XU-01A-11D-A107-01 | Affymetrix SNP 6.0 | (TODO) -- GDC | CNV__unfiltered__snp6 |
| TCGA-AN-A0XU-01A-11D-A107-01 | Affymetrix SNP 6.0 | (TODO) -- GDC | CNV__snp6 |
| TCGA-AN-A0XV-01A-11D-A107-01 | Affymetrix SNP 6.0 | (TODO) -- GDC | CNV__unfiltered__snp6 |
| TCGA-AN-A0XV-01A-11D-A107-01 | Affymetrix SNP 6.0 | (TODO) -- GDC | CNV__snp6 |
| TCGA-AN-A0XW-01A-11D-A107-01 | Affymetrix SNP 6.0 | (TODO) -- GDC | CNV__unfiltered__snp6 |
| TCGA-AN-A0XW-01A-11D-A107-01 | Affymetrix SNP 6.0 | (TODO) -- GDC | CNV__snp6 |
| TCGA-AO-A03L-01A-41D-A059-01 | Affymetrix SNP 6.0 | (TODO) -- GDC | CNV__unfiltered__snp6 |
| TCGA-AO-A03L-01A-41D-A059-01 | Affymetrix SNP 6.0 | (TODO) -- GDC | CNV__snp6 |
| TCGA-AO-A03M-01B-11D-A10L-01 | Affymetrix SNP 6.0 | (TODO) -- GDC | CNV__unfiltered__snp6 |
| TCGA-AO-A03M-01B-11D-A10L-01 | Affymetrix SNP 6.0 | (TODO) -- GDC | CNV__snp6 |
| TCGA-AO-A03N-01B-11D-A10L-01 | Affymetrix SNP 6.0 | (TODO) -- GDC | CNV__unfiltered__snp6 |
| TCGA-AO-A03N-01B-11D-A10L-01 | Affymetrix SNP 6.0 | (TODO) -- GDC | CNV__snp6 |
| TCGA-AO-A03O-01A-11D-A011-01 | Affymetrix SNP 6.0 | (TODO) -- GDC | CNV__unfiltered__snp6 |
| TCGA-AO-A03O-01A-11D-A011-01 | Affymetrix SNP 6.0 | (TODO) -- GDC | CNV__snp6 |
| TCGA-AO-A03P-01A-11D-A011-01 | Affymetrix SNP 6.0 | (TODO) -- GDC | CNV__unfiltered__snp6 |
| TCGA-AO-A03P-01A-11D-A011-01 | Affymetrix SNP 6.0 | (TODO) -- GDC | CNV__snp6 |
| TCGA-AO-A03R-01A-21D-A036-01 | Affymetrix SNP 6.0 | (TODO) -- GDC | CNV__unfiltered__snp6 |
| TCGA-AO-A03R-01A-21D-A036-01 | Affymetrix SNP 6.0 | (TODO) -- GDC | CNV__snp6 |
| TCGA-AO-A03T-01A-21D-A036-01 | Affymetrix SNP 6.0 | (TODO) -- GDC | CNV__unfiltered__snp6 |
| TCGA-AO-A03T-01A-21D-A036-01 | Affymetrix SNP 6.0 | (TODO) -- GDC | CNV__snp6 |
| TCGA-AO-A03U-01B-21D-A10L-01 | Affymetrix SNP 6.0 | (TODO) -- GDC | CNV__unfiltered__snp6 |
| TCGA-AO-A03U-01B-21D-A10L-01 | Affymetrix SNP 6.0 | (TODO) -- GDC | CNV__snp6 |
| TCGA-AO-A03V-01A-11D-A111-01 | Affymetrix SNP 6.0 | (TODO) -- GDC | CNV__unfiltered__snp6 |
| TCGA-AO-A03V-01A-11D-A111-01 | Affymetrix SNP 6.0 | (TODO) -- GDC | CNV__snp6 |
| TCGA-AO-A0J2-01A-11D-A036-01 | Affymetrix SNP 6.0 | (TODO) -- GDC | CNV__unfiltered__snp6 |
| TCGA-AO-A0J2-01A-11D-A036-01 | Affymetrix SNP 6.0 | (TODO) -- GDC | CNV__snp6 |
| TCGA-AO-A0J3-01A-11D-A036-01 | Affymetrix SNP 6.0 | (TODO) -- GDC | CNV__unfiltered__snp6 |
| TCGA-AO-A0J3-01A-11D-A036-01 | Affymetrix SNP 6.0 | (TODO) -- GDC | CNV__snp6 |
| TCGA-AO-A0J4-01A-11D-A036-01 | Affymetrix SNP 6.0 | (TODO) -- GDC | CNV__unfiltered__snp6 |
| TCGA-AO-A0J4-01A-11D-A036-01 | Affymetrix SNP 6.0 | (TODO) -- GDC | CNV__snp6 |
| TCGA-AO-A0J5-01A-11D-A036-01 | Affymetrix SNP 6.0 | (TODO) -- GDC | CNV__unfiltered__snp6 |
| TCGA-AO-A0J5-01A-11D-A036-01 | Affymetrix SNP 6.0 | (TODO) -- GDC | CNV__snp6 |
| TCGA-AO-A0J6-01A-11D-A036-01 | Affymetrix SNP 6.0 | (TODO) -- GDC | CNV__unfiltered__snp6 |
| TCGA-AO-A0J6-01A-11D-A036-01 | Affymetrix SNP 6.0 | (TODO) -- GDC | CNV__snp6 |
| TCGA-AO-A0J7-01A-11D-A036-01 | Affymetrix SNP 6.0 | (TODO) -- GDC | CNV__unfiltered__snp6 |
| TCGA-AO-A0J7-01A-11D-A036-01 | Affymetrix SNP 6.0 | (TODO) -- GDC | CNV__snp6 |
| TCGA-AO-A0J8-01A-21D-A036-01 | Affymetrix SNP 6.0 | (TODO) -- GDC | CNV__unfiltered__snp6 |
| TCGA-AO-A0J8-01A-21D-A036-01 | Affymetrix SNP 6.0 | (TODO) -- GDC | CNV__snp6 |
| TCGA-AO-A0J9-01A-11D-A036-01 | Affymetrix SNP 6.0 | (TODO) -- GDC | CNV__unfiltered__snp6 |
| TCGA-AO-A0J9-01A-11D-A036-01 | Affymetrix SNP 6.0 | (TODO) -- GDC | CNV__snp6 |
| TCGA-AO-A0JA-01A-11D-A059-01 | Affymetrix SNP 6.0 | (TODO) -- GDC | CNV__unfiltered__snp6 |
| TCGA-AO-A0JA-01A-11D-A059-01 | Affymetrix SNP 6.0 | (TODO) -- GDC | CNV__snp6 |
| TCGA-AO-A0JB-01A-11D-A059-01 | Affymetrix SNP 6.0 | (TODO) -- GDC | CNV__unfiltered__snp6 |
| TCGA-AO-A0JB-01A-11D-A059-01 | Affymetrix SNP 6.0 | (TODO) -- GDC | CNV__snp6 |
| TCGA-AO-A0JC-01A-11D-A059-01 | Affymetrix SNP 6.0 | (TODO) -- GDC | CNV__unfiltered__snp6 |
| TCGA-AO-A0JC-01A-11D-A059-01 | Affymetrix SNP 6.0 | (TODO) -- GDC | CNV__snp6 |
| TCGA-AO-A0JD-01A-11D-A059-01 | Affymetrix SNP 6.0 | (TODO) -- GDC | CNV__unfiltered__snp6 |
| TCGA-AO-A0JD-01A-11D-A059-01 | Affymetrix SNP 6.0 | (TODO) -- GDC | CNV__snp6 |
| TCGA-AO-A0JE-01A-11D-A059-01 | Affymetrix SNP 6.0 | (TODO) -- GDC | CNV__unfiltered__snp6 |
| TCGA-AO-A0JE-01A-11D-A059-01 | Affymetrix SNP 6.0 | (TODO) -- GDC | CNV__snp6 |
| TCGA-AO-A0JF-01A-11D-A059-01 | Affymetrix SNP 6.0 | (TODO) -- GDC | CNV__unfiltered__snp6 |
| TCGA-AO-A0JF-01A-11D-A059-01 | Affymetrix SNP 6.0 | (TODO) -- GDC | CNV__snp6 |
| TCGA-AO-A0JG-01A-31D-A087-01 | Affymetrix SNP 6.0 | (TODO) -- GDC | CNV__unfiltered__snp6 |
| TCGA-AO-A0JG-01A-31D-A087-01 | Affymetrix SNP 6.0 | (TODO) -- GDC | CNV__snp6 |
| TCGA-AO-A0JI-01A-21D-A059-01 | Affymetrix SNP 6.0 | (TODO) -- GDC | CNV__unfiltered__snp6 |
| TCGA-AO-A0JI-01A-21D-A059-01 | Affymetrix SNP 6.0 | (TODO) -- GDC | CNV__snp6 |
| TCGA-AO-A0JJ-01A-11D-A059-01 | Affymetrix SNP 6.0 | (TODO) -- GDC | CNV__unfiltered__snp6 |
| TCGA-AO-A0JJ-01A-11D-A059-01 | Affymetrix SNP 6.0 | (TODO) -- GDC | CNV__snp6 |
| TCGA-AO-A0JL-01A-11D-A059-01 | Affymetrix SNP 6.0 | (TODO) -- GDC | CNV__unfiltered__snp6 |
| TCGA-AO-A0JL-01A-11D-A059-01 | Affymetrix SNP 6.0 | (TODO) -- GDC | CNV__snp6 |
| TCGA-AO-A0JM-01A-21D-A059-01 | Affymetrix SNP 6.0 | (TODO) -- GDC | CNV__unfiltered__snp6 |
| TCGA-AO-A0JM-01A-21D-A059-01 | Affymetrix SNP 6.0 | (TODO) -- GDC | CNV__snp6 |
| TCGA-AO-A124-01A-11D-A10L-01 | Affymetrix SNP 6.0 | (TODO) -- GDC | CNV__unfiltered__snp6 |
| TCGA-AO-A124-01A-11D-A10L-01 | Affymetrix SNP 6.0 | (TODO) -- GDC | CNV__snp6 |
| TCGA-AO-A125-01A-11D-A10L-01 | Affymetrix SNP 6.0 | (TODO) -- GDC | CNV__unfiltered__snp6 |
| TCGA-AO-A125-01A-11D-A10L-01 | Affymetrix SNP 6.0 | (TODO) -- GDC | CNV__snp6 |
| TCGA-AO-A126-01A-11D-A10L-01 | Affymetrix SNP 6.0 | (TODO) -- GDC | CNV__unfiltered__snp6 |
| TCGA-AO-A126-01A-11D-A10L-01 | Affymetrix SNP 6.0 | (TODO) -- GDC | CNV__snp6 |
| TCGA-AO-A128-01A-11D-A10L-01 | Affymetrix SNP 6.0 | (TODO) -- GDC | CNV__unfiltered__snp6 |
| TCGA-AO-A128-01A-11D-A10L-01 | Affymetrix SNP 6.0 | (TODO) -- GDC | CNV__snp6 |
| TCGA-AO-A129-01A-21D-A10L-01 | Affymetrix SNP 6.0 | (TODO) -- GDC | CNV__unfiltered__snp6 |
| TCGA-AO-A129-01A-21D-A10L-01 | Affymetrix SNP 6.0 | (TODO) -- GDC | CNV__snp6 |
| TCGA-AO-A12A-01A-21D-A111-01 | Affymetrix SNP 6.0 | (TODO) -- GDC | CNV__unfiltered__snp6 |
| TCGA-AO-A12A-01A-21D-A111-01 | Affymetrix SNP 6.0 | (TODO) -- GDC | CNV__snp6 |
| TCGA-AO-A12B-01A-11D-A10L-01 | Affymetrix SNP 6.0 | (TODO) -- GDC | CNV__unfiltered__snp6 |
| TCGA-AO-A12B-01A-11D-A10L-01 | Affymetrix SNP 6.0 | (TODO) -- GDC | CNV__snp6 |
| TCGA-AO-A12C-01A-11D-A10L-01 | Affymetrix SNP 6.0 | (TODO) -- GDC | CNV__unfiltered__snp6 |
| TCGA-AO-A12C-01A-11D-A10L-01 | Affymetrix SNP 6.0 | (TODO) -- GDC | CNV__snp6 |
| TCGA-AO-A12D-01A-11D-A111-01 | Affymetrix SNP 6.0 | (TODO) -- GDC | CNV__unfiltered__snp6 |
| TCGA-AO-A12D-01A-11D-A111-01 | Affymetrix SNP 6.0 | (TODO) -- GDC | CNV__snp6 |
| TCGA-AO-A12E-01A-11D-A10L-01 | Affymetrix SNP 6.0 | (TODO) -- GDC | CNV__unfiltered__snp6 |
| TCGA-AO-A12E-01A-11D-A10L-01 | Affymetrix SNP 6.0 | (TODO) -- GDC | CNV__snp6 |
| TCGA-AO-A12F-01A-11D-A111-01 | Affymetrix SNP 6.0 | (TODO) -- GDC | CNV__unfiltered__snp6 |
| TCGA-AO-A12F-01A-11D-A111-01 | Affymetrix SNP 6.0 | (TODO) -- GDC | CNV__snp6 |
| TCGA-AO-A12G-01A-11D-A10L-01 | Affymetrix SNP 6.0 | (TODO) -- GDC | CNV__unfiltered__snp6 |
| TCGA-AO-A12G-01A-11D-A10L-01 | Affymetrix SNP 6.0 | (TODO) -- GDC | CNV__snp6 |
| TCGA-AO-A12H-01A-11D-A111-01 | Affymetrix SNP 6.0 | (TODO) -- GDC | CNV__unfiltered__snp6 |
| TCGA-AO-A12H-01A-11D-A111-01 | Affymetrix SNP 6.0 | (TODO) -- GDC | CNV__snp6 |
| TCGA-AO-A1KO-01A-31D-A13J-01 | Affymetrix SNP 6.0 | (TODO) -- GDC | CNV__unfiltered__snp6 |
| TCGA-AO-A1KO-01A-31D-A13J-01 | Affymetrix SNP 6.0 | (TODO) -- GDC | CNV__snp6 |
| TCGA-AO-A1KP-01A-11D-A13J-01 | Affymetrix SNP 6.0 | (TODO) -- GDC | CNV__unfiltered__snp6 |
| TCGA-AO-A1KP-01A-11D-A13J-01 | Affymetrix SNP 6.0 | (TODO) -- GDC | CNV__snp6 |
| TCGA-AO-A1KQ-01A-11D-A13J-01 | Affymetrix SNP 6.0 | (TODO) -- GDC | CNV__unfiltered__snp6 |
| TCGA-AO-A1KQ-01A-11D-A13J-01 | Affymetrix SNP 6.0 | (TODO) -- GDC | CNV__snp6 |
| TCGA-AO-A1KR-01A-12D-A141-01 | Affymetrix SNP 6.0 | (TODO) -- GDC | CNV__unfiltered__snp6 |
| TCGA-AO-A1KR-01A-12D-A141-01 | Affymetrix SNP 6.0 | (TODO) -- GDC | CNV__snp6 |
| TCGA-AO-A1KS-01A-11D-A13J-01 | Affymetrix SNP 6.0 | (TODO) -- GDC | CNV__unfiltered__snp6 |
| TCGA-AO-A1KS-01A-11D-A13J-01 | Affymetrix SNP 6.0 | (TODO) -- GDC | CNV__snp6 |
| TCGA-AO-A1KT-01A-11D-A13J-01 | Affymetrix SNP 6.0 | (TODO) -- GDC | CNV__unfiltered__snp6 |
| TCGA-AO-A1KT-01A-11D-A13J-01 | Affymetrix SNP 6.0 | (TODO) -- GDC | CNV__snp6 |
| TCGA-AQ-A04H-01B-11D-A10L-01 | Affymetrix SNP 6.0 | (TODO) -- GDC | CNV__unfiltered__snp6 |
| TCGA-AQ-A04H-01B-11D-A10L-01 | Affymetrix SNP 6.0 | (TODO) -- GDC | CNV__snp6 |
| TCGA-AQ-A04J-01A-02D-A036-01 | Affymetrix SNP 6.0 | (TODO) -- GDC | CNV__unfiltered__snp6 |
| TCGA-AQ-A04J-01A-02D-A036-01 | Affymetrix SNP 6.0 | (TODO) -- GDC | CNV__snp6 |
| TCGA-AQ-A04L-01B-21D-A10L-01 | Affymetrix SNP 6.0 | (TODO) -- GDC | CNV__unfiltered__snp6 |
| TCGA-AQ-A04L-01B-21D-A10L-01 | Affymetrix SNP 6.0 | (TODO) -- GDC | CNV__snp6 |
| TCGA-AQ-A0Y5-01A-11D-A14J-01 | Affymetrix SNP 6.0 | (TODO) -- GDC | CNV__unfiltered__snp6 |
| TCGA-AQ-A0Y5-01A-11D-A14J-01 | Affymetrix SNP 6.0 | (TODO) -- GDC | CNV__snp6 |
| TCGA-AQ-A1H2-01A-11D-A13J-01 | Affymetrix SNP 6.0 | (TODO) -- GDC | CNV__unfiltered__snp6 |
| TCGA-AQ-A1H2-01A-11D-A13J-01 | Affymetrix SNP 6.0 | (TODO) -- GDC | CNV__snp6 |
| TCGA-AQ-A1H3-01A-31D-A13J-01 | Affymetrix SNP 6.0 | (TODO) -- GDC | CNV__unfiltered__snp6 |
| TCGA-AQ-A1H3-01A-31D-A13J-01 | Affymetrix SNP 6.0 | (TODO) -- GDC | CNV__snp6 |
| TCGA-AQ-A54N-01A-11D-A25N-01 | Affymetrix SNP 6.0 | (TODO) -- GDC | CNV__unfiltered__snp6 |
| TCGA-AQ-A54N-01A-11D-A25N-01 | Affymetrix SNP 6.0 | (TODO) -- GDC | CNV__snp6 |
| TCGA-AQ-A54O-01A-11D-A25N-01 | Affymetrix SNP 6.0 | (TODO) -- GDC | CNV__unfiltered__snp6 |
| TCGA-AQ-A54O-01A-11D-A25N-01 | Affymetrix SNP 6.0 | (TODO) -- GDC | CNV__snp6 |
| TCGA-AQ-A7U7-01A-22D-A350-01 | Affymetrix SNP 6.0 | (TODO) -- GDC | CNV__unfiltered__snp6 |
| TCGA-AQ-A7U7-01A-22D-A350-01 | Affymetrix SNP 6.0 | (TODO) -- GDC | CNV__snp6 |
| TCGA-AR-A0TP-01A-11D-A087-01 | Affymetrix SNP 6.0 | (TODO) -- GDC | CNV__unfiltered__snp6 |
| TCGA-AR-A0TP-01A-11D-A087-01 | Affymetrix SNP 6.0 | (TODO) -- GDC | CNV__snp6 |
| TCGA-AR-A0TQ-01A-11D-A087-01 | Affymetrix SNP 6.0 | (TODO) -- GDC | CNV__unfiltered__snp6 |
| TCGA-AR-A0TQ-01A-11D-A087-01 | Affymetrix SNP 6.0 | (TODO) -- GDC | CNV__snp6 |
| TCGA-AR-A0TR-01A-11D-A087-01 | Affymetrix SNP 6.0 | (TODO) -- GDC | CNV__unfiltered__snp6 |
| TCGA-AR-A0TR-01A-11D-A087-01 | Affymetrix SNP 6.0 | (TODO) -- GDC | CNV__snp6 |
| TCGA-AR-A0TS-01A-11D-A111-01 | Affymetrix SNP 6.0 | (TODO) -- GDC | CNV__unfiltered__snp6 |
| TCGA-AR-A0TS-01A-11D-A111-01 | Affymetrix SNP 6.0 | (TODO) -- GDC | CNV__snp6 |
| TCGA-AR-A0TT-01A-31D-A087-01 | Affymetrix SNP 6.0 | (TODO) -- GDC | CNV__unfiltered__snp6 |
| TCGA-AR-A0TT-01A-31D-A087-01 | Affymetrix SNP 6.0 | (TODO) -- GDC | CNV__snp6 |
| TCGA-AR-A0TU-01A-31D-A107-01 | Affymetrix SNP 6.0 | (TODO) -- GDC | CNV__unfiltered__snp6 |
| TCGA-AR-A0TU-01A-31D-A107-01 | Affymetrix SNP 6.0 | (TODO) -- GDC | CNV__snp6 |
| TCGA-AR-A0TV-01A-21D-A087-01 | Affymetrix SNP 6.0 | (TODO) -- GDC | CNV__unfiltered__snp6 |
| TCGA-AR-A0TV-01A-21D-A087-01 | Affymetrix SNP 6.0 | (TODO) -- GDC | CNV__snp6 |
| TCGA-AR-A0TW-01A-11D-A087-01 | Affymetrix SNP 6.0 | (TODO) -- GDC | CNV__unfiltered__snp6 |
| TCGA-AR-A0TW-01A-11D-A087-01 | Affymetrix SNP 6.0 | (TODO) -- GDC | CNV__snp6 |
| TCGA-AR-A0TX-01A-11D-A087-01 | Affymetrix SNP 6.0 | (TODO) -- GDC | CNV__unfiltered__snp6 |
| TCGA-AR-A0TX-01A-11D-A087-01 | Affymetrix SNP 6.0 | (TODO) -- GDC | CNV__snp6 |
| TCGA-AR-A0TY-01A-12D-A111-01 | Affymetrix SNP 6.0 | (TODO) -- GDC | CNV__unfiltered__snp6 |
| TCGA-AR-A0TY-01A-12D-A111-01 | Affymetrix SNP 6.0 | (TODO) -- GDC | CNV__snp6 |
| TCGA-AR-A0TZ-01A-12D-A087-01 | Affymetrix SNP 6.0 | (TODO) -- GDC | CNV__unfiltered__snp6 |
| TCGA-AR-A0TZ-01A-12D-A087-01 | Affymetrix SNP 6.0 | (TODO) -- GDC | CNV__snp6 |
| TCGA-AR-A0U0-01A-11D-A107-01 | Affymetrix SNP 6.0 | (TODO) -- GDC | CNV__unfiltered__snp6 |
| TCGA-AR-A0U0-01A-11D-A107-01 | Affymetrix SNP 6.0 | (TODO) -- GDC | CNV__snp6 |
| TCGA-AR-A0U1-01A-11D-A111-01 | Affymetrix SNP 6.0 | (TODO) -- GDC | CNV__unfiltered__snp6 |
| TCGA-AR-A0U1-01A-11D-A111-01 | Affymetrix SNP 6.0 | (TODO) -- GDC | CNV__snp6 |
| TCGA-AR-A0U2-01A-11D-A107-01 | Affymetrix SNP 6.0 | (TODO) -- GDC | CNV__unfiltered__snp6 |
| TCGA-AR-A0U2-01A-11D-A107-01 | Affymetrix SNP 6.0 | (TODO) -- GDC | CNV__snp6 |
| TCGA-AR-A0U3-01A-11D-A107-01 | Affymetrix SNP 6.0 | (TODO) -- GDC | CNV__unfiltered__snp6 |
| TCGA-AR-A0U3-01A-11D-A107-01 | Affymetrix SNP 6.0 | (TODO) -- GDC | CNV__snp6 |
| TCGA-AR-A0U4-01A-11D-A107-01 | Affymetrix SNP 6.0 | (TODO) -- GDC | CNV__unfiltered__snp6 |
| TCGA-AR-A0U4-01A-11D-A107-01 | Affymetrix SNP 6.0 | (TODO) -- GDC | CNV__snp6 |
| TCGA-AR-A1AH-01A-11D-A12A-01 | Affymetrix SNP 6.0 | (TODO) -- GDC | CNV__unfiltered__snp6 |
| TCGA-AR-A1AH-01A-11D-A12A-01 | Affymetrix SNP 6.0 | (TODO) -- GDC | CNV__snp6 |
| TCGA-AR-A1AI-01A-11D-A12N-01 | Affymetrix SNP 6.0 | (TODO) -- GDC | CNV__unfiltered__snp6 |
| TCGA-AR-A1AI-01A-11D-A12N-01 | Affymetrix SNP 6.0 | (TODO) -- GDC | CNV__snp6 |
| TCGA-AR-A1AJ-01A-21D-A12N-01 | Affymetrix SNP 6.0 | (TODO) -- GDC | CNV__unfiltered__snp6 |
| TCGA-AR-A1AJ-01A-21D-A12N-01 | Affymetrix SNP 6.0 | (TODO) -- GDC | CNV__snp6 |
| TCGA-AR-A1AK-01A-21D-A12N-01 | Affymetrix SNP 6.0 | (TODO) -- GDC | CNV__unfiltered__snp6 |
| TCGA-AR-A1AK-01A-21D-A12N-01 | Affymetrix SNP 6.0 | (TODO) -- GDC | CNV__snp6 |
| TCGA-AR-A1AL-01A-21D-A12N-01 | Affymetrix SNP 6.0 | (TODO) -- GDC | CNV__unfiltered__snp6 |
| TCGA-AR-A1AL-01A-21D-A12N-01 | Affymetrix SNP 6.0 | (TODO) -- GDC | CNV__snp6 |
| TCGA-AR-A1AM-01A-41D-A227-01 | Affymetrix SNP 6.0 | (TODO) -- GDC | CNV__unfiltered__snp6 |
| TCGA-AR-A1AM-01A-41D-A227-01 | Affymetrix SNP 6.0 | (TODO) -- GDC | CNV__snp6 |
| TCGA-AR-A1AN-01A-11D-A12N-01 | Affymetrix SNP 6.0 | (TODO) -- GDC | CNV__unfiltered__snp6 |
| TCGA-AR-A1AN-01A-11D-A12N-01 | Affymetrix SNP 6.0 | (TODO) -- GDC | CNV__snp6 |
| TCGA-AR-A1AO-01A-11D-A12N-01 | Affymetrix SNP 6.0 | (TODO) -- GDC | CNV__unfiltered__snp6 |
| TCGA-AR-A1AO-01A-11D-A12N-01 | Affymetrix SNP 6.0 | (TODO) -- GDC | CNV__snp6 |
| TCGA-AR-A1AP-01A-11D-A12N-01 | Affymetrix SNP 6.0 | (TODO) -- GDC | CNV__unfiltered__snp6 |
| TCGA-AR-A1AP-01A-11D-A12N-01 | Affymetrix SNP 6.0 | (TODO) -- GDC | CNV__snp6 |
| TCGA-AR-A1AQ-01A-11D-A12N-01 | Affymetrix SNP 6.0 | (TODO) -- GDC | CNV__unfiltered__snp6 |
| TCGA-AR-A1AQ-01A-11D-A12N-01 | Affymetrix SNP 6.0 | (TODO) -- GDC | CNV__snp6 |
| TCGA-AR-A1AR-01A-31D-A134-01 | Affymetrix SNP 6.0 | (TODO) -- GDC | CNV__unfiltered__snp6 |
| TCGA-AR-A1AR-01A-31D-A134-01 | Affymetrix SNP 6.0 | (TODO) -- GDC | CNV__snp6 |
| TCGA-AR-A1AS-01A-11D-A12N-01 | Affymetrix SNP 6.0 | (TODO) -- GDC | CNV__unfiltered__snp6 |
| TCGA-AR-A1AS-01A-11D-A12N-01 | Affymetrix SNP 6.0 | (TODO) -- GDC | CNV__snp6 |
| TCGA-AR-A1AU-01A-11D-A12N-01 | Affymetrix SNP 6.0 | (TODO) -- GDC | CNV__unfiltered__snp6 |
| TCGA-AR-A1AU-01A-11D-A12N-01 | Affymetrix SNP 6.0 | (TODO) -- GDC | CNV__snp6 |
| TCGA-AR-A1AV-01A-21D-A12N-01 | Affymetrix SNP 6.0 | (TODO) -- GDC | CNV__unfiltered__snp6 |
| TCGA-AR-A1AV-01A-21D-A12N-01 | Affymetrix SNP 6.0 | (TODO) -- GDC | CNV__snp6 |
| TCGA-AR-A1AW-01A-21D-A12N-01 | Affymetrix SNP 6.0 | (TODO) -- GDC | CNV__unfiltered__snp6 |
| TCGA-AR-A1AW-01A-21D-A12N-01 | Affymetrix SNP 6.0 | (TODO) -- GDC | CNV__snp6 |
| TCGA-AR-A1AX-01A-11D-A12N-01 | Affymetrix SNP 6.0 | (TODO) -- GDC | CNV__unfiltered__snp6 |
| TCGA-AR-A1AX-01A-11D-A12N-01 | Affymetrix SNP 6.0 | (TODO) -- GDC | CNV__snp6 |
| TCGA-AR-A1AY-01A-21D-A12N-01 | Affymetrix SNP 6.0 | (TODO) -- GDC | CNV__unfiltered__snp6 |
| TCGA-AR-A1AY-01A-21D-A12N-01 | Affymetrix SNP 6.0 | (TODO) -- GDC | CNV__snp6 |
| TCGA-AR-A24H-01A-11D-A166-01 | Affymetrix SNP 6.0 | (TODO) -- GDC | CNV__unfiltered__snp6 |
| TCGA-AR-A24H-01A-11D-A166-01 | Affymetrix SNP 6.0 | (TODO) -- GDC | CNV__snp6 |
| TCGA-AR-A24K-01A-11D-A166-01 | Affymetrix SNP 6.0 | (TODO) -- GDC | CNV__unfiltered__snp6 |
| TCGA-AR-A24K-01A-11D-A166-01 | Affymetrix SNP 6.0 | (TODO) -- GDC | CNV__snp6 |
| TCGA-AR-A24L-01A-11D-A166-01 | Affymetrix SNP 6.0 | (TODO) -- GDC | CNV__unfiltered__snp6 |
| TCGA-AR-A24L-01A-11D-A166-01 | Affymetrix SNP 6.0 | (TODO) -- GDC | CNV__snp6 |
| TCGA-AR-A24M-01A-11D-A166-01 | Affymetrix SNP 6.0 | (TODO) -- GDC | CNV__unfiltered__snp6 |
| TCGA-AR-A24M-01A-11D-A166-01 | Affymetrix SNP 6.0 | (TODO) -- GDC | CNV__snp6 |
| TCGA-AR-A24N-01A-11D-A166-01 | Affymetrix SNP 6.0 | (TODO) -- GDC | CNV__unfiltered__snp6 |
| TCGA-AR-A24N-01A-11D-A166-01 | Affymetrix SNP 6.0 | (TODO) -- GDC | CNV__snp6 |
| TCGA-AR-A24O-01A-11D-A166-01 | Affymetrix SNP 6.0 | (TODO) -- GDC | CNV__unfiltered__snp6 |
| TCGA-AR-A24O-01A-11D-A166-01 | Affymetrix SNP 6.0 | (TODO) -- GDC | CNV__snp6 |
| TCGA-AR-A24P-01A-11D-A166-01 | Affymetrix SNP 6.0 | (TODO) -- GDC | CNV__unfiltered__snp6 |
| TCGA-AR-A24P-01A-11D-A166-01 | Affymetrix SNP 6.0 | (TODO) -- GDC | CNV__snp6 |
| TCGA-AR-A24Q-01A-12D-A166-01 | Affymetrix SNP 6.0 | (TODO) -- GDC | CNV__unfiltered__snp6 |
| TCGA-AR-A24Q-01A-12D-A166-01 | Affymetrix SNP 6.0 | (TODO) -- GDC | CNV__snp6 |
| TCGA-AR-A24R-01A-11D-A166-01 | Affymetrix SNP 6.0 | (TODO) -- GDC | CNV__unfiltered__snp6 |
| TCGA-AR-A24R-01A-11D-A166-01 | Affymetrix SNP 6.0 | (TODO) -- GDC | CNV__snp6 |
| TCGA-AR-A24S-01A-11D-A166-01 | Affymetrix SNP 6.0 | (TODO) -- GDC | CNV__unfiltered__snp6 |
| TCGA-AR-A24S-01A-11D-A166-01 | Affymetrix SNP 6.0 | (TODO) -- GDC | CNV__snp6 |
| TCGA-AR-A24T-01A-11D-A166-01 | Affymetrix SNP 6.0 | (TODO) -- GDC | CNV__unfiltered__snp6 |
| TCGA-AR-A24T-01A-11D-A166-01 | Affymetrix SNP 6.0 | (TODO) -- GDC | CNV__snp6 |
| TCGA-AR-A24U-01A-11D-A166-01 | Affymetrix SNP 6.0 | (TODO) -- GDC | CNV__unfiltered__snp6 |
| TCGA-AR-A24U-01A-11D-A166-01 | Affymetrix SNP 6.0 | (TODO) -- GDC | CNV__snp6 |
| TCGA-AR-A24V-01A-21D-A166-01 | Affymetrix SNP 6.0 | (TODO) -- GDC | CNV__unfiltered__snp6 |
| TCGA-AR-A24V-01A-21D-A166-01 | Affymetrix SNP 6.0 | (TODO) -- GDC | CNV__snp6 |
| TCGA-AR-A24W-01A-11D-A166-01 | Affymetrix SNP 6.0 | (TODO) -- GDC | CNV__unfiltered__snp6 |
| TCGA-AR-A24W-01A-11D-A166-01 | Affymetrix SNP 6.0 | (TODO) -- GDC | CNV__snp6 |
| TCGA-AR-A24X-01A-11D-A166-01 | Affymetrix SNP 6.0 | (TODO) -- GDC | CNV__unfiltered__snp6 |
| TCGA-AR-A24X-01A-11D-A166-01 | Affymetrix SNP 6.0 | (TODO) -- GDC | CNV__snp6 |
| TCGA-AR-A24Z-01A-11D-A166-01 | Affymetrix SNP 6.0 | (TODO) -- GDC | CNV__unfiltered__snp6 |
| TCGA-AR-A24Z-01A-11D-A166-01 | Affymetrix SNP 6.0 | (TODO) -- GDC | CNV__snp6 |
| TCGA-AR-A250-01A-31D-A166-01 | Affymetrix SNP 6.0 | (TODO) -- GDC | CNV__unfiltered__snp6 |
| TCGA-AR-A250-01A-31D-A166-01 | Affymetrix SNP 6.0 | (TODO) -- GDC | CNV__snp6 |
| TCGA-AR-A251-01A-12D-A166-01 | Affymetrix SNP 6.0 | (TODO) -- GDC | CNV__unfiltered__snp6 |
| TCGA-AR-A251-01A-12D-A166-01 | Affymetrix SNP 6.0 | (TODO) -- GDC | CNV__snp6 |
| TCGA-AR-A252-01A-11D-A166-01 | Affymetrix SNP 6.0 | (TODO) -- GDC | CNV__unfiltered__snp6 |
| TCGA-AR-A252-01A-11D-A166-01 | Affymetrix SNP 6.0 | (TODO) -- GDC | CNV__snp6 |
| TCGA-AR-A254-01A-21D-A166-01 | Affymetrix SNP 6.0 | (TODO) -- GDC | CNV__unfiltered__snp6 |
| TCGA-AR-A254-01A-21D-A166-01 | Affymetrix SNP 6.0 | (TODO) -- GDC | CNV__snp6 |
| TCGA-AR-A255-01A-11D-A166-01 | Affymetrix SNP 6.0 | (TODO) -- GDC | CNV__unfiltered__snp6 |
| TCGA-AR-A255-01A-11D-A166-01 | Affymetrix SNP 6.0 | (TODO) -- GDC | CNV__snp6 |
| TCGA-AR-A256-01A-11D-A166-01 | Affymetrix SNP 6.0 | (TODO) -- GDC | CNV__unfiltered__snp6 |
| TCGA-AR-A256-01A-11D-A166-01 | Affymetrix SNP 6.0 | (TODO) -- GDC | CNV__snp6 |
| TCGA-AR-A2LE-01A-11D-A17U-01 | Affymetrix SNP 6.0 | (TODO) -- GDC | CNV__unfiltered__snp6 |
| TCGA-AR-A2LE-01A-11D-A17U-01 | Affymetrix SNP 6.0 | (TODO) -- GDC | CNV__snp6 |
| TCGA-AR-A2LH-01A-31D-A18N-01 | Affymetrix SNP 6.0 | (TODO) -- GDC | CNV__unfiltered__snp6 |
| TCGA-AR-A2LH-01A-31D-A18N-01 | Affymetrix SNP 6.0 | (TODO) -- GDC | CNV__snp6 |
| TCGA-AR-A2LJ-01A-12D-A19X-01 | Affymetrix SNP 6.0 | (TODO) -- GDC | CNV__unfiltered__snp6 |
| TCGA-AR-A2LJ-01A-12D-A19X-01 | Affymetrix SNP 6.0 | (TODO) -- GDC | CNV__snp6 |
| TCGA-AR-A2LK-01A-11D-A17U-01 | Affymetrix SNP 6.0 | (TODO) -- GDC | CNV__unfiltered__snp6 |
| TCGA-AR-A2LK-01A-11D-A17U-01 | Affymetrix SNP 6.0 | (TODO) -- GDC | CNV__snp6 |
| TCGA-AR-A2LL-01A-11D-A17U-01 | Affymetrix SNP 6.0 | (TODO) -- GDC | CNV__unfiltered__snp6 |
| TCGA-AR-A2LL-01A-11D-A17U-01 | Affymetrix SNP 6.0 | (TODO) -- GDC | CNV__snp6 |
| TCGA-AR-A2LM-01A-11D-A17U-01 | Affymetrix SNP 6.0 | (TODO) -- GDC | CNV__unfiltered__snp6 |
| TCGA-AR-A2LM-01A-11D-A17U-01 | Affymetrix SNP 6.0 | (TODO) -- GDC | CNV__snp6 |
| TCGA-AR-A2LN-01A-21D-A18N-01 | Affymetrix SNP 6.0 | (TODO) -- GDC | CNV__unfiltered__snp6 |
| TCGA-AR-A2LN-01A-21D-A18N-01 | Affymetrix SNP 6.0 | (TODO) -- GDC | CNV__snp6 |
| TCGA-AR-A2LO-01A-31D-A19G-01 | Affymetrix SNP 6.0 | (TODO) -- GDC | CNV__unfiltered__snp6 |
| TCGA-AR-A2LO-01A-31D-A19G-01 | Affymetrix SNP 6.0 | (TODO) -- GDC | CNV__snp6 |
| TCGA-AR-A2LQ-01A-22D-A18N-01 | Affymetrix SNP 6.0 | (TODO) -- GDC | CNV__unfiltered__snp6 |
| TCGA-AR-A2LQ-01A-22D-A18N-01 | Affymetrix SNP 6.0 | (TODO) -- GDC | CNV__snp6 |
| TCGA-AR-A2LR-01A-12D-A18N-01 | Affymetrix SNP 6.0 | (TODO) -- GDC | CNV__unfiltered__snp6 |
| TCGA-AR-A2LR-01A-12D-A18N-01 | Affymetrix SNP 6.0 | (TODO) -- GDC | CNV__snp6 |
| TCGA-AR-A5QM-01A-11D-A27O-01 | Affymetrix SNP 6.0 | (TODO) -- GDC | CNV__unfiltered__snp6 |
| TCGA-AR-A5QM-01A-11D-A27O-01 | Affymetrix SNP 6.0 | (TODO) -- GDC | CNV__snp6 |
| TCGA-AR-A5QN-01A-12D-A28A-01 | Affymetrix SNP 6.0 | (TODO) -- GDC | CNV__unfiltered__snp6 |
| TCGA-AR-A5QN-01A-12D-A28A-01 | Affymetrix SNP 6.0 | (TODO) -- GDC | CNV__snp6 |
| TCGA-AR-A5QP-01A-11D-A28A-01 | Affymetrix SNP 6.0 | (TODO) -- GDC | CNV__unfiltered__snp6 |
| TCGA-AR-A5QP-01A-11D-A28A-01 | Affymetrix SNP 6.0 | (TODO) -- GDC | CNV__snp6 |
| TCGA-AR-A5QQ-01A-11D-A28A-01 | Affymetrix SNP 6.0 | (TODO) -- GDC | CNV__unfiltered__snp6 |
| TCGA-AR-A5QQ-01A-11D-A28A-01 | Affymetrix SNP 6.0 | (TODO) -- GDC | CNV__snp6 |
| TCGA-B6-A0I1-01A-11D-A21P-01 | Affymetrix SNP 6.0 | (TODO) -- GDC | CNV__unfiltered__snp6 |
| TCGA-B6-A0I1-01A-11D-A21P-01 | Affymetrix SNP 6.0 | (TODO) -- GDC | CNV__snp6 |
| TCGA-B6-A0I2-01A-11D-A036-01 | Affymetrix SNP 6.0 | (TODO) -- GDC | CNV__unfiltered__snp6 |
| TCGA-B6-A0I2-01A-11D-A036-01 | Affymetrix SNP 6.0 | (TODO) -- GDC | CNV__snp6 |
| TCGA-B6-A0I5-01A-11D-A036-01 | Affymetrix SNP 6.0 | (TODO) -- GDC | CNV__unfiltered__snp6 |
| TCGA-B6-A0I5-01A-11D-A036-01 | Affymetrix SNP 6.0 | (TODO) -- GDC | CNV__snp6 |
| TCGA-B6-A0I6-01A-11D-A036-01 | Affymetrix SNP 6.0 | (TODO) -- GDC | CNV__unfiltered__snp6 |
| TCGA-B6-A0I6-01A-11D-A036-01 | Affymetrix SNP 6.0 | (TODO) -- GDC | CNV__snp6 |
| TCGA-B6-A0I8-01A-11D-A036-01 | Affymetrix SNP 6.0 | (TODO) -- GDC | CNV__unfiltered__snp6 |
| TCGA-B6-A0I8-01A-11D-A036-01 | Affymetrix SNP 6.0 | (TODO) -- GDC | CNV__snp6 |
| TCGA-B6-A0I9-01A-11D-A036-01 | Affymetrix SNP 6.0 | (TODO) -- GDC | CNV__unfiltered__snp6 |
| TCGA-B6-A0I9-01A-11D-A036-01 | Affymetrix SNP 6.0 | (TODO) -- GDC | CNV__snp6 |
| TCGA-B6-A0IA-01A-11D-A036-01 | Affymetrix SNP 6.0 | (TODO) -- GDC | CNV__unfiltered__snp6 |
| TCGA-B6-A0IA-01A-11D-A036-01 | Affymetrix SNP 6.0 | (TODO) -- GDC | CNV__snp6 |
| TCGA-B6-A0IB-01A-11D-A036-01 | Affymetrix SNP 6.0 | (TODO) -- GDC | CNV__unfiltered__snp6 |
| TCGA-B6-A0IB-01A-11D-A036-01 | Affymetrix SNP 6.0 | (TODO) -- GDC | CNV__snp6 |
| TCGA-B6-A0IC-01A-11D-A036-01 | Affymetrix SNP 6.0 | (TODO) -- GDC | CNV__unfiltered__snp6 |
| TCGA-B6-A0IC-01A-11D-A036-01 | Affymetrix SNP 6.0 | (TODO) -- GDC | CNV__snp6 |
| TCGA-B6-A0IE-01A-11D-A036-01 | Affymetrix SNP 6.0 | (TODO) -- GDC | CNV__unfiltered__snp6 |
| TCGA-B6-A0IE-01A-11D-A036-01 | Affymetrix SNP 6.0 | (TODO) -- GDC | CNV__snp6 |
| TCGA-B6-A0IG-01A-11D-A036-01 | Affymetrix SNP 6.0 | (TODO) -- GDC | CNV__unfiltered__snp6 |
| TCGA-B6-A0IG-01A-11D-A036-01 | Affymetrix SNP 6.0 | (TODO) -- GDC | CNV__snp6 |
| TCGA-B6-A0IH-01A-11D-A111-01 | Affymetrix SNP 6.0 | (TODO) -- GDC | CNV__unfiltered__snp6 |
| TCGA-B6-A0IH-01A-11D-A111-01 | Affymetrix SNP 6.0 | (TODO) -- GDC | CNV__snp6 |
| TCGA-B6-A0IJ-01A-11D-A036-01 | Affymetrix SNP 6.0 | (TODO) -- GDC | CNV__unfiltered__snp6 |
| TCGA-B6-A0IJ-01A-11D-A036-01 | Affymetrix SNP 6.0 | (TODO) -- GDC | CNV__snp6 |
| TCGA-B6-A0IK-01A-12D-A059-01 | Affymetrix SNP 6.0 | (TODO) -- GDC | CNV__unfiltered__snp6 |
| TCGA-B6-A0IK-01A-12D-A059-01 | Affymetrix SNP 6.0 | (TODO) -- GDC | CNV__snp6 |
| TCGA-B6-A0IM-01A-11D-A036-01 | Affymetrix SNP 6.0 | (TODO) -- GDC | CNV__unfiltered__snp6 |
| TCGA-B6-A0IM-01A-11D-A036-01 | Affymetrix SNP 6.0 | (TODO) -- GDC | CNV__snp6 |
| TCGA-B6-A0IN-01A-11D-A036-01 | Affymetrix SNP 6.0 | (TODO) -- GDC | CNV__unfiltered__snp6 |
| TCGA-B6-A0IN-01A-11D-A036-01 | Affymetrix SNP 6.0 | (TODO) -- GDC | CNV__snp6 |
| TCGA-B6-A0IO-01A-11D-A036-01 | Affymetrix SNP 6.0 | (TODO) -- GDC | CNV__unfiltered__snp6 |
| TCGA-B6-A0IO-01A-11D-A036-01 | Affymetrix SNP 6.0 | (TODO) -- GDC | CNV__snp6 |
| TCGA-B6-A0IP-01A-11D-A036-01 | Affymetrix SNP 6.0 | (TODO) -- GDC | CNV__unfiltered__snp6 |
| TCGA-B6-A0IP-01A-11D-A036-01 | Affymetrix SNP 6.0 | (TODO) -- GDC | CNV__snp6 |
| TCGA-B6-A0IQ-01A-11D-A036-01 | Affymetrix SNP 6.0 | (TODO) -- GDC | CNV__unfiltered__snp6 |
| TCGA-B6-A0IQ-01A-11D-A036-01 | Affymetrix SNP 6.0 | (TODO) -- GDC | CNV__snp6 |
| TCGA-B6-A0RE-01A-11D-A059-01 | Affymetrix SNP 6.0 | (TODO) -- GDC | CNV__unfiltered__snp6 |
| TCGA-B6-A0RE-01A-11D-A059-01 | Affymetrix SNP 6.0 | (TODO) -- GDC | CNV__snp6 |
| TCGA-B6-A0RG-01A-11D-A059-01 | Affymetrix SNP 6.0 | (TODO) -- GDC | CNV__unfiltered__snp6 |
| TCGA-B6-A0RG-01A-11D-A059-01 | Affymetrix SNP 6.0 | (TODO) -- GDC | CNV__snp6 |
| TCGA-B6-A0RH-01A-21D-A111-01 | Affymetrix SNP 6.0 | (TODO) -- GDC | CNV__unfiltered__snp6 |
| TCGA-B6-A0RH-01A-21D-A111-01 | Affymetrix SNP 6.0 | (TODO) -- GDC | CNV__snp6 |
| TCGA-B6-A0RI-01A-11D-A059-01 | Affymetrix SNP 6.0 | (TODO) -- GDC | CNV__unfiltered__snp6 |
| TCGA-B6-A0RI-01A-11D-A059-01 | Affymetrix SNP 6.0 | (TODO) -- GDC | CNV__snp6 |
| TCGA-B6-A0RL-01A-11D-A087-01 | Affymetrix SNP 6.0 | (TODO) -- GDC | CNV__snp6 |
| TCGA-B6-A0RM-01A-11D-A087-01 | Affymetrix SNP 6.0 | (TODO) -- GDC | CNV__unfiltered__snp6 |
| TCGA-B6-A0RM-01A-11D-A087-01 | Affymetrix SNP 6.0 | (TODO) -- GDC | CNV__snp6 |
| TCGA-B6-A0RN-01A-12D-A087-01 | Affymetrix SNP 6.0 | (TODO) -- GDC | CNV__unfiltered__snp6 |
| TCGA-B6-A0RN-01A-12D-A087-01 | Affymetrix SNP 6.0 | (TODO) -- GDC | CNV__snp6 |
| TCGA-B6-A0RO-01A-22D-A087-01 | Affymetrix SNP 6.0 | (TODO) -- GDC | CNV__unfiltered__snp6 |
| TCGA-B6-A0RO-01A-22D-A087-01 | Affymetrix SNP 6.0 | (TODO) -- GDC | CNV__snp6 |
| TCGA-B6-A0RP-01A-21D-A087-01 | Affymetrix SNP 6.0 | (TODO) -- GDC | CNV__unfiltered__snp6 |
| TCGA-B6-A0RP-01A-21D-A087-01 | Affymetrix SNP 6.0 | (TODO) -- GDC | CNV__snp6 |
| TCGA-B6-A0RQ-01A-11D-A111-01 | Affymetrix SNP 6.0 | (TODO) -- GDC | CNV__unfiltered__snp6 |
| TCGA-B6-A0RQ-01A-11D-A111-01 | Affymetrix SNP 6.0 | (TODO) -- GDC | CNV__snp6 |
| TCGA-B6-A0RS-01A-11D-A087-01 | Affymetrix SNP 6.0 | (TODO) -- GDC | CNV__unfiltered__snp6 |
| TCGA-B6-A0RS-01A-11D-A087-01 | Affymetrix SNP 6.0 | (TODO) -- GDC | CNV__snp6 |
| TCGA-B6-A0RT-01A-21D-A087-01 | Affymetrix SNP 6.0 | (TODO) -- GDC | CNV__unfiltered__snp6 |
| TCGA-B6-A0RT-01A-21D-A087-01 | Affymetrix SNP 6.0 | (TODO) -- GDC | CNV__snp6 |
| TCGA-B6-A0RU-01A-11D-A087-01 | Affymetrix SNP 6.0 | (TODO) -- GDC | CNV__unfiltered__snp6 |
| TCGA-B6-A0RU-01A-11D-A087-01 | Affymetrix SNP 6.0 | (TODO) -- GDC | CNV__snp6 |
| TCGA-B6-A0RV-01A-11D-A087-01 | Affymetrix SNP 6.0 | (TODO) -- GDC | CNV__unfiltered__snp6 |
| TCGA-B6-A0RV-01A-11D-A087-01 | Affymetrix SNP 6.0 | (TODO) -- GDC | CNV__snp6 |
| TCGA-B6-A0WS-01A-11D-A111-01 | Affymetrix SNP 6.0 | (TODO) -- GDC | CNV__unfiltered__snp6 |
| TCGA-B6-A0WS-01A-11D-A111-01 | Affymetrix SNP 6.0 | (TODO) -- GDC | CNV__snp6 |
| TCGA-B6-A0WT-01A-11D-A107-01 | Affymetrix SNP 6.0 | (TODO) -- GDC | CNV__unfiltered__snp6 |
| TCGA-B6-A0WT-01A-11D-A107-01 | Affymetrix SNP 6.0 | (TODO) -- GDC | CNV__snp6 |
| TCGA-B6-A0WV-01A-11D-A107-01 | Affymetrix SNP 6.0 | (TODO) -- GDC | CNV__unfiltered__snp6 |
| TCGA-B6-A0WV-01A-11D-A107-01 | Affymetrix SNP 6.0 | (TODO) -- GDC | CNV__snp6 |
| TCGA-B6-A0WW-01A-11D-A107-01 | Affymetrix SNP 6.0 | (TODO) -- GDC | CNV__unfiltered__snp6 |
| TCGA-B6-A0WW-01A-11D-A107-01 | Affymetrix SNP 6.0 | (TODO) -- GDC | CNV__snp6 |
| TCGA-B6-A0WX-01A-11D-A107-01 | Affymetrix SNP 6.0 | (TODO) -- GDC | CNV__unfiltered__snp6 |
| TCGA-B6-A0WX-01A-11D-A107-01 | Affymetrix SNP 6.0 | (TODO) -- GDC | CNV__snp6 |
| TCGA-B6-A0WY-01A-11D-A107-01 | Affymetrix SNP 6.0 | (TODO) -- GDC | CNV__unfiltered__snp6 |
| TCGA-B6-A0WY-01A-11D-A107-01 | Affymetrix SNP 6.0 | (TODO) -- GDC | CNV__snp6 |
| TCGA-B6-A0WZ-01A-11D-A107-01 | Affymetrix SNP 6.0 | (TODO) -- GDC | CNV__unfiltered__snp6 |
| TCGA-B6-A0WZ-01A-11D-A107-01 | Affymetrix SNP 6.0 | (TODO) -- GDC | CNV__snp6 |
| TCGA-B6-A0X0-01A-21D-A111-01 | Affymetrix SNP 6.0 | (TODO) -- GDC | CNV__unfiltered__snp6 |
| TCGA-B6-A0X0-01A-21D-A111-01 | Affymetrix SNP 6.0 | (TODO) -- GDC | CNV__snp6 |
| TCGA-B6-A0X1-01A-11D-A107-01 | Affymetrix SNP 6.0 | (TODO) -- GDC | CNV__unfiltered__snp6 |
| TCGA-B6-A0X1-01A-11D-A107-01 | Affymetrix SNP 6.0 | (TODO) -- GDC | CNV__snp6 |
| TCGA-B6-A0X4-01A-11D-A107-01 | Affymetrix SNP 6.0 | (TODO) -- GDC | CNV__unfiltered__snp6 |
| TCGA-B6-A0X4-01A-11D-A107-01 | Affymetrix SNP 6.0 | (TODO) -- GDC | CNV__snp6 |
| TCGA-B6-A0X5-01A-21D-A107-01 | Affymetrix SNP 6.0 | (TODO) -- GDC | CNV__unfiltered__snp6 |
| TCGA-B6-A0X5-01A-21D-A107-01 | Affymetrix SNP 6.0 | (TODO) -- GDC | CNV__snp6 |
| TCGA-B6-A0X7-01A-11D-A10L-01 | Affymetrix SNP 6.0 | (TODO) -- GDC | CNV__unfiltered__snp6 |
| TCGA-B6-A0X7-01A-11D-A10L-01 | Affymetrix SNP 6.0 | (TODO) -- GDC | CNV__snp6 |
| TCGA-B6-A1KC-01A-11D-A13J-01 | Affymetrix SNP 6.0 | (TODO) -- GDC | CNV__unfiltered__snp6 |
| TCGA-B6-A1KC-01A-11D-A13J-01 | Affymetrix SNP 6.0 | (TODO) -- GDC | CNV__snp6 |
| TCGA-B6-A1KC-01B-11D-A160-01 | Affymetrix SNP 6.0 | (TODO) -- GDC | CNV__unfiltered__snp6 |
| TCGA-B6-A1KC-01B-11D-A160-01 | Affymetrix SNP 6.0 | (TODO) -- GDC | CNV__snp6 |
| TCGA-B6-A1KF-01A-11D-A13J-01 | Affymetrix SNP 6.0 | (TODO) -- GDC | CNV__unfiltered__snp6 |
| TCGA-B6-A1KF-01A-11D-A13J-01 | Affymetrix SNP 6.0 | (TODO) -- GDC | CNV__snp6 |
| TCGA-B6-A1KI-01A-11D-A14J-01 | Affymetrix SNP 6.0 | (TODO) -- GDC | CNV__unfiltered__snp6 |
| TCGA-B6-A1KI-01A-11D-A14J-01 | Affymetrix SNP 6.0 | (TODO) -- GDC | CNV__snp6 |
| TCGA-B6-A1KN-01A-11D-A13J-01 | Affymetrix SNP 6.0 | (TODO) -- GDC | CNV__unfiltered__snp6 |
| TCGA-B6-A1KN-01A-11D-A13J-01 | Affymetrix SNP 6.0 | (TODO) -- GDC | CNV__snp6 |
| TCGA-B6-A2IU-01A-32D-A18N-01 | Affymetrix SNP 6.0 | (TODO) -- GDC | CNV__unfiltered__snp6 |
| TCGA-B6-A2IU-01A-32D-A18N-01 | Affymetrix SNP 6.0 | (TODO) -- GDC | CNV__snp6 |
| TCGA-B6-A3ZX-01A-11D-A238-01 | Affymetrix SNP 6.0 | (TODO) -- GDC | CNV__unfiltered__snp6 |
| TCGA-B6-A3ZX-01A-11D-A238-01 | Affymetrix SNP 6.0 | (TODO) -- GDC | CNV__snp6 |
| TCGA-B6-A400-01A-11D-A238-01 | Affymetrix SNP 6.0 | (TODO) -- GDC | CNV__unfiltered__snp6 |
| TCGA-B6-A400-01A-11D-A238-01 | Affymetrix SNP 6.0 | (TODO) -- GDC | CNV__snp6 |
| TCGA-B6-A401-01A-11D-A238-01 | Affymetrix SNP 6.0 | (TODO) -- GDC | CNV__unfiltered__snp6 |
| TCGA-B6-A401-01A-11D-A238-01 | Affymetrix SNP 6.0 | (TODO) -- GDC | CNV__snp6 |
| TCGA-B6-A402-01A-11D-A238-01 | Affymetrix SNP 6.0 | (TODO) -- GDC | CNV__unfiltered__snp6 |
| TCGA-B6-A402-01A-11D-A238-01 | Affymetrix SNP 6.0 | (TODO) -- GDC | CNV__snp6 |
| TCGA-B6-A408-01A-12D-A242-01 | Affymetrix SNP 6.0 | (TODO) -- GDC | CNV__unfiltered__snp6 |
| TCGA-B6-A408-01A-12D-A242-01 | Affymetrix SNP 6.0 | (TODO) -- GDC | CNV__snp6 |
| TCGA-B6-A409-01A-11D-A242-01 | Affymetrix SNP 6.0 | (TODO) -- GDC | CNV__unfiltered__snp6 |
| TCGA-B6-A409-01A-11D-A242-01 | Affymetrix SNP 6.0 | (TODO) -- GDC | CNV__snp6 |
| TCGA-B6-A40B-01A-11D-A238-01 | Affymetrix SNP 6.0 | (TODO) -- GDC | CNV__unfiltered__snp6 |
| TCGA-B6-A40B-01A-11D-A238-01 | Affymetrix SNP 6.0 | (TODO) -- GDC | CNV__snp6 |
| TCGA-B6-A40C-01A-11D-A238-01 | Affymetrix SNP 6.0 | (TODO) -- GDC | CNV__unfiltered__snp6 |
| TCGA-B6-A40C-01A-11D-A238-01 | Affymetrix SNP 6.0 | (TODO) -- GDC | CNV__snp6 |
| TCGA-BH-A0AU-01A-11D-A12N-01 | Affymetrix SNP 6.0 | (TODO) -- GDC | CNV__unfiltered__snp6 |
| TCGA-BH-A0AU-01A-11D-A12N-01 | Affymetrix SNP 6.0 | (TODO) -- GDC | CNV__snp6 |
| TCGA-BH-A0AV-01A-31D-A111-01 | Affymetrix SNP 6.0 | (TODO) -- GDC | CNV__unfiltered__snp6 |
| TCGA-BH-A0AV-01A-31D-A111-01 | Affymetrix SNP 6.0 | (TODO) -- GDC | CNV__snp6 |
| TCGA-BH-A0AW-01A-11D-A059-01 | Affymetrix SNP 6.0 | (TODO) -- GDC | CNV__unfiltered__snp6 |
| TCGA-BH-A0AW-01A-11D-A059-01 | Affymetrix SNP 6.0 | (TODO) -- GDC | CNV__snp6 |
| TCGA-BH-A0AY-01A-21D-A011-01 | Affymetrix SNP 6.0 | (TODO) -- GDC | CNV__unfiltered__snp6 |
| TCGA-BH-A0AY-01A-21D-A011-01 | Affymetrix SNP 6.0 | (TODO) -- GDC | CNV__snp6 |
| TCGA-BH-A0AZ-01A-21D-A12N-01 | Affymetrix SNP 6.0 | (TODO) -- GDC | CNV__unfiltered__snp6 |
| TCGA-BH-A0AZ-01A-21D-A12N-01 | Affymetrix SNP 6.0 | (TODO) -- GDC | CNV__snp6 |
| TCGA-BH-A0B0-01A-21D-A111-01 | Affymetrix SNP 6.0 | (TODO) -- GDC | CNV__unfiltered__snp6 |
| TCGA-BH-A0B0-01A-21D-A111-01 | Affymetrix SNP 6.0 | (TODO) -- GDC | CNV__snp6 |
| TCGA-BH-A0B1-01A-12D-A059-01 | Affymetrix SNP 6.0 | (TODO) -- GDC | CNV__unfiltered__snp6 |
| TCGA-BH-A0B1-01A-12D-A059-01 | Affymetrix SNP 6.0 | (TODO) -- GDC | CNV__snp6 |
| TCGA-BH-A0B2-01A-11D-A10L-01 | Affymetrix SNP 6.0 | (TODO) -- GDC | CNV__unfiltered__snp6 |
| TCGA-BH-A0B2-01A-11D-A10L-01 | Affymetrix SNP 6.0 | (TODO) -- GDC | CNV__snp6 |
| TCGA-BH-A0B3-01A-11D-A059-01 | Affymetrix SNP 6.0 | (TODO) -- GDC | CNV__unfiltered__snp6 |
| TCGA-BH-A0B3-01A-11D-A059-01 | Affymetrix SNP 6.0 | (TODO) -- GDC | CNV__snp6 |
| TCGA-BH-A0B4-01A-11D-A011-01 | Affymetrix SNP 6.0 | (TODO) -- GDC | CNV__unfiltered__snp6 |
| TCGA-BH-A0B4-01A-11D-A011-01 | Affymetrix SNP 6.0 | (TODO) -- GDC | CNV__snp6 |
| TCGA-BH-A0B5-01A-11D-A12N-01 | Affymetrix SNP 6.0 | (TODO) -- GDC | CNV__unfiltered__snp6 |
| TCGA-BH-A0B5-01A-11D-A12N-01 | Affymetrix SNP 6.0 | (TODO) -- GDC | CNV__snp6 |
| TCGA-BH-A0B6-01A-11D-A19X-01 | Affymetrix SNP 6.0 | (TODO) -- GDC | CNV__unfiltered__snp6 |
| TCGA-BH-A0B6-01A-11D-A19X-01 | Affymetrix SNP 6.0 | (TODO) -- GDC | CNV__snp6 |
| TCGA-BH-A0B7-01A-12D-A111-01 | Affymetrix SNP 6.0 | (TODO) -- GDC | CNV__unfiltered__snp6 |
| TCGA-BH-A0B7-01A-12D-A111-01 | Affymetrix SNP 6.0 | (TODO) -- GDC | CNV__snp6 |
| TCGA-BH-A0B8-01A-21D-A059-01 | Affymetrix SNP 6.0 | (TODO) -- GDC | CNV__unfiltered__snp6 |
| TCGA-BH-A0B8-01A-21D-A059-01 | Affymetrix SNP 6.0 | (TODO) -- GDC | CNV__snp6 |
| TCGA-BH-A0B9-01A-11D-A059-01 | Affymetrix SNP 6.0 | (TODO) -- GDC | CNV__unfiltered__snp6 |
| TCGA-BH-A0B9-01A-11D-A059-01 | Affymetrix SNP 6.0 | (TODO) -- GDC | CNV__snp6 |
| TCGA-BH-A0BA-01A-11D-A059-01 | Affymetrix SNP 6.0 | (TODO) -- GDC | CNV__unfiltered__snp6 |
| TCGA-BH-A0BA-01A-11D-A059-01 | Affymetrix SNP 6.0 | (TODO) -- GDC | CNV__snp6 |
| TCGA-BH-A0BC-01A-22D-A087-01 | Affymetrix SNP 6.0 | (TODO) -- GDC | CNV__unfiltered__snp6 |
| TCGA-BH-A0BC-01A-22D-A087-01 | Affymetrix SNP 6.0 | (TODO) -- GDC | CNV__snp6 |
| TCGA-BH-A0BD-01A-11D-A036-01 | Affymetrix SNP 6.0 | (TODO) -- GDC | CNV__unfiltered__snp6 |
| TCGA-BH-A0BD-01A-11D-A036-01 | Affymetrix SNP 6.0 | (TODO) -- GDC | CNV__snp6 |
| TCGA-BH-A0BF-01A-21D-A12N-01 | Affymetrix SNP 6.0 | (TODO) -- GDC | CNV__unfiltered__snp6 |
| TCGA-BH-A0BF-01A-21D-A12N-01 | Affymetrix SNP 6.0 | (TODO) -- GDC | CNV__snp6 |
| TCGA-BH-A0BG-01A-11D-A111-01 | Affymetrix SNP 6.0 | (TODO) -- GDC | CNV__unfiltered__snp6 |
| TCGA-BH-A0BG-01A-11D-A111-01 | Affymetrix SNP 6.0 | (TODO) -- GDC | CNV__snp6 |
| TCGA-BH-A0BJ-01A-11D-A059-01 | Affymetrix SNP 6.0 | (TODO) -- GDC | CNV__unfiltered__snp6 |
| TCGA-BH-A0BJ-01A-11D-A059-01 | Affymetrix SNP 6.0 | (TODO) -- GDC | CNV__snp6 |
| TCGA-BH-A0BL-01A-11D-A111-01 | Affymetrix SNP 6.0 | (TODO) -- GDC | CNV__unfiltered__snp6 |
| TCGA-BH-A0BL-01A-11D-A111-01 | Affymetrix SNP 6.0 | (TODO) -- GDC | CNV__snp6 |
| TCGA-BH-A0BM-01A-11D-A059-01 | Affymetrix SNP 6.0 | (TODO) -- GDC | CNV__unfiltered__snp6 |
| TCGA-BH-A0BM-01A-11D-A059-01 | Affymetrix SNP 6.0 | (TODO) -- GDC | CNV__snp6 |
| TCGA-BH-A0BO-01A-23D-A12A-01 | Affymetrix SNP 6.0 | (TODO) -- GDC | CNV__unfiltered__snp6 |
| TCGA-BH-A0BO-01A-23D-A12A-01 | Affymetrix SNP 6.0 | (TODO) -- GDC | CNV__snp6 |
| TCGA-BH-A0BP-01A-11D-A111-01 | Affymetrix SNP 6.0 | (TODO) -- GDC | CNV__unfiltered__snp6 |
| TCGA-BH-A0BP-01A-11D-A111-01 | Affymetrix SNP 6.0 | (TODO) -- GDC | CNV__snp6 |
| TCGA-BH-A0BQ-01A-21D-A111-01 | Affymetrix SNP 6.0 | (TODO) -- GDC | CNV__unfiltered__snp6 |
| TCGA-BH-A0BQ-01A-21D-A111-01 | Affymetrix SNP 6.0 | (TODO) -- GDC | CNV__snp6 |
| TCGA-BH-A0BR-01A-21D-A111-01 | Affymetrix SNP 6.0 | (TODO) -- GDC | CNV__unfiltered__snp6 |
| TCGA-BH-A0BR-01A-21D-A111-01 | Affymetrix SNP 6.0 | (TODO) -- GDC | CNV__snp6 |
| TCGA-BH-A0BS-01A-11D-A12N-01 | Affymetrix SNP 6.0 | (TODO) -- GDC | CNV__unfiltered__snp6 |
| TCGA-BH-A0BS-01A-11D-A12N-01 | Affymetrix SNP 6.0 | (TODO) -- GDC | CNV__snp6 |
| TCGA-BH-A0BT-01A-11D-A12N-01 | Affymetrix SNP 6.0 | (TODO) -- GDC | CNV__unfiltered__snp6 |
| TCGA-BH-A0BT-01A-11D-A12N-01 | Affymetrix SNP 6.0 | (TODO) -- GDC | CNV__snp6 |
| TCGA-BH-A0BV-01A-11D-A011-01 | Affymetrix SNP 6.0 | (TODO) -- GDC | CNV__unfiltered__snp6 |
| TCGA-BH-A0BV-01A-11D-A011-01 | Affymetrix SNP 6.0 | (TODO) -- GDC | CNV__snp6 |
| TCGA-BH-A0BW-01A-11D-A111-01 | Affymetrix SNP 6.0 | (TODO) -- GDC | CNV__unfiltered__snp6 |
| TCGA-BH-A0BW-01A-11D-A111-01 | Affymetrix SNP 6.0 | (TODO) -- GDC | CNV__snp6 |
| TCGA-BH-A0BZ-01A-31D-A12N-01 | Affymetrix SNP 6.0 | (TODO) -- GDC | CNV__unfiltered__snp6 |
| TCGA-BH-A0BZ-01A-31D-A12N-01 | Affymetrix SNP 6.0 | (TODO) -- GDC | CNV__snp6 |
| TCGA-BH-A0C0-01A-21D-A059-01 | Affymetrix SNP 6.0 | (TODO) -- GDC | CNV__unfiltered__snp6 |
| TCGA-BH-A0C0-01A-21D-A059-01 | Affymetrix SNP 6.0 | (TODO) -- GDC | CNV__snp6 |
| TCGA-BH-A0C1-01B-11D-A12A-01 | Affymetrix SNP 6.0 | (TODO) -- GDC | CNV__unfiltered__snp6 |
| TCGA-BH-A0C1-01B-11D-A12A-01 | Affymetrix SNP 6.0 | (TODO) -- GDC | CNV__snp6 |
| TCGA-BH-A0C3-01A-21D-A12N-01 | Affymetrix SNP 6.0 | (TODO) -- GDC | CNV__unfiltered__snp6 |
| TCGA-BH-A0C3-01A-21D-A12N-01 | Affymetrix SNP 6.0 | (TODO) -- GDC | CNV__snp6 |
| TCGA-BH-A0C7-01B-11D-A111-01 | Affymetrix SNP 6.0 | (TODO) -- GDC | CNV__unfiltered__snp6 |
| TCGA-BH-A0C7-01B-11D-A111-01 | Affymetrix SNP 6.0 | (TODO) -- GDC | CNV__snp6 |
| TCGA-BH-A0DD-01A-31D-A12N-01 | Affymetrix SNP 6.0 | (TODO) -- GDC | CNV__unfiltered__snp6 |
| TCGA-BH-A0DD-01A-31D-A12N-01 | Affymetrix SNP 6.0 | (TODO) -- GDC | CNV__snp6 |
| TCGA-BH-A0DE-01A-11D-A111-01 | Affymetrix SNP 6.0 | (TODO) -- GDC | CNV__unfiltered__snp6 |
| TCGA-BH-A0DE-01A-11D-A111-01 | Affymetrix SNP 6.0 | (TODO) -- GDC | CNV__snp6 |
| TCGA-BH-A0DG-01A-21D-A12N-01 | Affymetrix SNP 6.0 | (TODO) -- GDC | CNV__unfiltered__snp6 |
| TCGA-BH-A0DG-01A-21D-A12N-01 | Affymetrix SNP 6.0 | (TODO) -- GDC | CNV__snp6 |
| TCGA-BH-A0DH-01A-11D-A087-01 | Affymetrix SNP 6.0 | (TODO) -- GDC | CNV__unfiltered__snp6 |
| TCGA-BH-A0DH-01A-11D-A087-01 | Affymetrix SNP 6.0 | (TODO) -- GDC | CNV__snp6 |
| TCGA-BH-A0DI-01A-21D-A12N-01 | Affymetrix SNP 6.0 | (TODO) -- GDC | CNV__unfiltered__snp6 |
| TCGA-BH-A0DI-01A-21D-A12N-01 | Affymetrix SNP 6.0 | (TODO) -- GDC | CNV__snp6 |
| TCGA-BH-A0DK-01A-21D-A059-01 | Affymetrix SNP 6.0 | (TODO) -- GDC | CNV__unfiltered__snp6 |
| TCGA-BH-A0DK-01A-21D-A059-01 | Affymetrix SNP 6.0 | (TODO) -- GDC | CNV__snp6 |
| TCGA-BH-A0DL-01A-11D-A111-01 | Affymetrix SNP 6.0 | (TODO) -- GDC | CNV__unfiltered__snp6 |
| TCGA-BH-A0DL-01A-11D-A111-01 | Affymetrix SNP 6.0 | (TODO) -- GDC | CNV__snp6 |
| TCGA-BH-A0DO-01B-11D-A12A-01 | Affymetrix SNP 6.0 | (TODO) -- GDC | CNV__unfiltered__snp6 |
| TCGA-BH-A0DO-01B-11D-A12A-01 | Affymetrix SNP 6.0 | (TODO) -- GDC | CNV__snp6 |
| TCGA-BH-A0DP-01A-21D-A059-01 | Affymetrix SNP 6.0 | (TODO) -- GDC | CNV__unfiltered__snp6 |
| TCGA-BH-A0DP-01A-21D-A059-01 | Affymetrix SNP 6.0 | (TODO) -- GDC | CNV__snp6 |
| TCGA-BH-A0DQ-01A-11D-A087-01 | Affymetrix SNP 6.0 | (TODO) -- GDC | CNV__unfiltered__snp6 |
| TCGA-BH-A0DQ-01A-11D-A087-01 | Affymetrix SNP 6.0 | (TODO) -- GDC | CNV__snp6 |
| TCGA-BH-A0DS-01A-11D-A059-01 | Affymetrix SNP 6.0 | (TODO) -- GDC | CNV__unfiltered__snp6 |
| TCGA-BH-A0DS-01A-11D-A059-01 | Affymetrix SNP 6.0 | (TODO) -- GDC | CNV__snp6 |
| TCGA-BH-A0DT-01A-21D-A12A-01 | Affymetrix SNP 6.0 | (TODO) -- GDC | CNV__unfiltered__snp6 |
| TCGA-BH-A0DT-01A-21D-A12A-01 | Affymetrix SNP 6.0 | (TODO) -- GDC | CNV__snp6 |
| TCGA-BH-A0DV-01A-21D-A12N-01 | Affymetrix SNP 6.0 | (TODO) -- GDC | CNV__unfiltered__snp6 |
| TCGA-BH-A0DV-01A-21D-A12N-01 | Affymetrix SNP 6.0 | (TODO) -- GDC | CNV__snp6 |
| TCGA-BH-A0DX-01A-11D-A111-01 | Affymetrix SNP 6.0 | (TODO) -- GDC | CNV__unfiltered__snp6 |
| TCGA-BH-A0DX-01A-11D-A111-01 | Affymetrix SNP 6.0 | (TODO) -- GDC | CNV__snp6 |
| TCGA-BH-A0DZ-01A-11D-A011-01 | Affymetrix SNP 6.0 | (TODO) -- GDC | CNV__unfiltered__snp6 |
| TCGA-BH-A0DZ-01A-11D-A011-01 | Affymetrix SNP 6.0 | (TODO) -- GDC | CNV__snp6 |
| TCGA-BH-A0E0-01A-11D-A059-01 | Affymetrix SNP 6.0 | (TODO) -- GDC | CNV__unfiltered__snp6 |
| TCGA-BH-A0E0-01A-11D-A059-01 | Affymetrix SNP 6.0 | (TODO) -- GDC | CNV__snp6 |
| TCGA-BH-A0E1-01A-11D-A059-01 | Affymetrix SNP 6.0 | (TODO) -- GDC | CNV__unfiltered__snp6 |
| TCGA-BH-A0E1-01A-11D-A059-01 | Affymetrix SNP 6.0 | (TODO) -- GDC | CNV__snp6 |
| TCGA-BH-A0E2-01A-11D-A059-01 | Affymetrix SNP 6.0 | (TODO) -- GDC | CNV__unfiltered__snp6 |
| TCGA-BH-A0E2-01A-11D-A059-01 | Affymetrix SNP 6.0 | (TODO) -- GDC | CNV__snp6 |
| TCGA-BH-A0E6-01A-11D-A036-01 | Affymetrix SNP 6.0 | (TODO) -- GDC | CNV__unfiltered__snp6 |
| TCGA-BH-A0E6-01A-11D-A036-01 | Affymetrix SNP 6.0 | (TODO) -- GDC | CNV__snp6 |
| TCGA-BH-A0E7-01A-11D-A036-01 | Affymetrix SNP 6.0 | (TODO) -- GDC | CNV__unfiltered__snp6 |
| TCGA-BH-A0E7-01A-11D-A036-01 | Affymetrix SNP 6.0 | (TODO) -- GDC | CNV__snp6 |
| TCGA-BH-A0E9-01B-11D-A111-01 | Affymetrix SNP 6.0 | (TODO) -- GDC | CNV__unfiltered__snp6 |
| TCGA-BH-A0E9-01B-11D-A111-01 | Affymetrix SNP 6.0 | (TODO) -- GDC | CNV__snp6 |
| TCGA-BH-A0EA-01A-11D-A111-01 | Affymetrix SNP 6.0 | (TODO) -- GDC | CNV__unfiltered__snp6 |
| TCGA-BH-A0EA-01A-11D-A111-01 | Affymetrix SNP 6.0 | (TODO) -- GDC | CNV__snp6 |
| TCGA-BH-A0EB-01A-11D-A036-01 | Affymetrix SNP 6.0 | (TODO) -- GDC | CNV__unfiltered__snp6 |
| TCGA-BH-A0EB-01A-11D-A036-01 | Affymetrix SNP 6.0 | (TODO) -- GDC | CNV__snp6 |
| TCGA-BH-A0EE-01A-11D-A036-01 | Affymetrix SNP 6.0 | (TODO) -- GDC | CNV__unfiltered__snp6 |
| TCGA-BH-A0EE-01A-11D-A036-01 | Affymetrix SNP 6.0 | (TODO) -- GDC | CNV__snp6 |
| TCGA-BH-A0EI-01A-11D-A111-01 | Affymetrix SNP 6.0 | (TODO) -- GDC | CNV__unfiltered__snp6 |
| TCGA-BH-A0EI-01A-11D-A111-01 | Affymetrix SNP 6.0 | (TODO) -- GDC | CNV__snp6 |
| TCGA-BH-A0GY-01A-11D-A059-01 | Affymetrix SNP 6.0 | (TODO) -- GDC | CNV__unfiltered__snp6 |
| TCGA-BH-A0GY-01A-11D-A059-01 | Affymetrix SNP 6.0 | (TODO) -- GDC | CNV__snp6 |
| TCGA-BH-A0GZ-01A-11D-A059-01 | Affymetrix SNP 6.0 | (TODO) -- GDC | CNV__unfiltered__snp6 |
| TCGA-BH-A0GZ-01A-11D-A059-01 | Affymetrix SNP 6.0 | (TODO) -- GDC | CNV__snp6 |
| TCGA-BH-A0H0-01A-11D-A059-01 | Affymetrix SNP 6.0 | (TODO) -- GDC | CNV__unfiltered__snp6 |
| TCGA-BH-A0H0-01A-11D-A059-01 | Affymetrix SNP 6.0 | (TODO) -- GDC | CNV__snp6 |
| TCGA-BH-A0H3-01A-11D-A12N-01 | Affymetrix SNP 6.0 | (TODO) -- GDC | CNV__unfiltered__snp6 |
| TCGA-BH-A0H3-01A-11D-A12N-01 | Affymetrix SNP 6.0 | (TODO) -- GDC | CNV__snp6 |
| TCGA-BH-A0H5-01A-21D-A111-01 | Affymetrix SNP 6.0 | (TODO) -- GDC | CNV__unfiltered__snp6 |
| TCGA-BH-A0H5-01A-21D-A111-01 | Affymetrix SNP 6.0 | (TODO) -- GDC | CNV__snp6 |
| TCGA-BH-A0H6-01A-21D-A059-01 | Affymetrix SNP 6.0 | (TODO) -- GDC | CNV__unfiltered__snp6 |
| TCGA-BH-A0H6-01A-21D-A059-01 | Affymetrix SNP 6.0 | (TODO) -- GDC | CNV__snp6 |
| TCGA-BH-A0H7-01A-13D-A059-01 | Affymetrix SNP 6.0 | (TODO) -- GDC | CNV__unfiltered__snp6 |
| TCGA-BH-A0H7-01A-13D-A059-01 | Affymetrix SNP 6.0 | (TODO) -- GDC | CNV__snp6 |
| TCGA-BH-A0H9-01A-11D-A059-01 | Affymetrix SNP 6.0 | (TODO) -- GDC | CNV__unfiltered__snp6 |
| TCGA-BH-A0H9-01A-11D-A059-01 | Affymetrix SNP 6.0 | (TODO) -- GDC | CNV__snp6 |
| TCGA-BH-A0HA-01A-11D-A12N-01 | Affymetrix SNP 6.0 | (TODO) -- GDC | CNV__unfiltered__snp6 |
| TCGA-BH-A0HA-01A-11D-A12N-01 | Affymetrix SNP 6.0 | (TODO) -- GDC | CNV__snp6 |
| TCGA-BH-A0HB-01A-11D-A059-01 | Affymetrix SNP 6.0 | (TODO) -- GDC | CNV__unfiltered__snp6 |
| TCGA-BH-A0HB-01A-11D-A059-01 | Affymetrix SNP 6.0 | (TODO) -- GDC | CNV__snp6 |
| TCGA-BH-A0HF-01A-11D-A059-01 | Affymetrix SNP 6.0 | (TODO) -- GDC | CNV__unfiltered__snp6 |
| TCGA-BH-A0HF-01A-11D-A059-01 | Affymetrix SNP 6.0 | (TODO) -- GDC | CNV__snp6 |
| TCGA-BH-A0HI-01A-11D-A087-01 | Affymetrix SNP 6.0 | (TODO) -- GDC | CNV__unfiltered__snp6 |
| TCGA-BH-A0HI-01A-11D-A087-01 | Affymetrix SNP 6.0 | (TODO) -- GDC | CNV__snp6 |
| TCGA-BH-A0HK-01A-11D-A059-01 | Affymetrix SNP 6.0 | (TODO) -- GDC | CNV__unfiltered__snp6 |
| TCGA-BH-A0HK-01A-11D-A059-01 | Affymetrix SNP 6.0 | (TODO) -- GDC | CNV__snp6 |
| TCGA-BH-A0HL-01A-11D-A036-01 | Affymetrix SNP 6.0 | (TODO) -- GDC | CNV__unfiltered__snp6 |
| TCGA-BH-A0HL-01A-11D-A036-01 | Affymetrix SNP 6.0 | (TODO) -- GDC | CNV__snp6 |
| TCGA-BH-A0HN-01A-11D-A087-01 | Affymetrix SNP 6.0 | (TODO) -- GDC | CNV__unfiltered__snp6 |
| TCGA-BH-A0HN-01A-11D-A087-01 | Affymetrix SNP 6.0 | (TODO) -- GDC | CNV__snp6 |
| TCGA-BH-A0HO-01A-11D-A036-01 | Affymetrix SNP 6.0 | (TODO) -- GDC | CNV__unfiltered__snp6 |
| TCGA-BH-A0HO-01A-11D-A036-01 | Affymetrix SNP 6.0 | (TODO) -- GDC | CNV__snp6 |
| TCGA-BH-A0HP-01A-12D-A087-01 | Affymetrix SNP 6.0 | (TODO) -- GDC | CNV__unfiltered__snp6 |
| TCGA-BH-A0HP-01A-12D-A087-01 | Affymetrix SNP 6.0 | (TODO) -- GDC | CNV__snp6 |
| TCGA-BH-A0HQ-01A-11D-A036-01 | Affymetrix SNP 6.0 | (TODO) -- GDC | CNV__unfiltered__snp6 |
| TCGA-BH-A0HQ-01A-11D-A036-01 | Affymetrix SNP 6.0 | (TODO) -- GDC | CNV__snp6 |
| TCGA-BH-A0HU-01A-11D-A036-01 | Affymetrix SNP 6.0 | (TODO) -- GDC | CNV__unfiltered__snp6 |
| TCGA-BH-A0HU-01A-11D-A036-01 | Affymetrix SNP 6.0 | (TODO) -- GDC | CNV__snp6 |
| TCGA-BH-A0HW-01A-11D-A036-01 | Affymetrix SNP 6.0 | (TODO) -- GDC | CNV__unfiltered__snp6 |
| TCGA-BH-A0HW-01A-11D-A036-01 | Affymetrix SNP 6.0 | (TODO) -- GDC | CNV__snp6 |
| TCGA-BH-A0HX-01A-21D-A059-01 | Affymetrix SNP 6.0 | (TODO) -- GDC | CNV__unfiltered__snp6 |
| TCGA-BH-A0HX-01A-21D-A059-01 | Affymetrix SNP 6.0 | (TODO) -- GDC | CNV__snp6 |
| TCGA-BH-A0HY-01A-11D-A059-01 | Affymetrix SNP 6.0 | (TODO) -- GDC | CNV__unfiltered__snp6 |
| TCGA-BH-A0HY-01A-11D-A059-01 | Affymetrix SNP 6.0 | (TODO) -- GDC | CNV__snp6 |
| TCGA-BH-A0RX-01A-21D-A087-01 | Affymetrix SNP 6.0 | (TODO) -- GDC | CNV__unfiltered__snp6 |
| TCGA-BH-A0RX-01A-21D-A087-01 | Affymetrix SNP 6.0 | (TODO) -- GDC | CNV__snp6 |
| TCGA-BH-A0W3-01A-11D-A107-01 | Affymetrix SNP 6.0 | (TODO) -- GDC | CNV__unfiltered__snp6 |
| TCGA-BH-A0W3-01A-11D-A107-01 | Affymetrix SNP 6.0 | (TODO) -- GDC | CNV__snp6 |
| TCGA-BH-A0W4-01A-11D-A107-01 | Affymetrix SNP 6.0 | (TODO) -- GDC | CNV__unfiltered__snp6 |
| TCGA-BH-A0W4-01A-11D-A107-01 | Affymetrix SNP 6.0 | (TODO) -- GDC | CNV__snp6 |
| TCGA-BH-A0W5-01A-11D-A107-01 | Affymetrix SNP 6.0 | (TODO) -- GDC | CNV__unfiltered__snp6 |
| TCGA-BH-A0W5-01A-11D-A107-01 | Affymetrix SNP 6.0 | (TODO) -- GDC | CNV__snp6 |
| TCGA-BH-A0W7-01A-11D-A111-01 | Affymetrix SNP 6.0 | (TODO) -- GDC | CNV__unfiltered__snp6 |
| TCGA-BH-A0W7-01A-11D-A111-01 | Affymetrix SNP 6.0 | (TODO) -- GDC | CNV__snp6 |
| TCGA-BH-A0WA-01A-11D-A107-01 | Affymetrix SNP 6.0 | (TODO) -- GDC | CNV__unfiltered__snp6 |
| TCGA-BH-A0WA-01A-11D-A107-01 | Affymetrix SNP 6.0 | (TODO) -- GDC | CNV__snp6 |
| TCGA-BH-A18F-01A-11D-A12A-01 | Affymetrix SNP 6.0 | (TODO) -- GDC | CNV__unfiltered__snp6 |
| TCGA-BH-A18F-01A-11D-A12A-01 | Affymetrix SNP 6.0 | (TODO) -- GDC | CNV__snp6 |
| TCGA-BH-A18G-01A-11D-A12A-01 | Affymetrix SNP 6.0 | (TODO) -- GDC | CNV__unfiltered__snp6 |
| TCGA-BH-A18G-01A-11D-A12A-01 | Affymetrix SNP 6.0 | (TODO) -- GDC | CNV__snp6 |
| TCGA-BH-A18H-01A-11D-A12A-01 | Affymetrix SNP 6.0 | (TODO) -- GDC | CNV__unfiltered__snp6 |
| TCGA-BH-A18H-01A-11D-A12A-01 | Affymetrix SNP 6.0 | (TODO) -- GDC | CNV__snp6 |
| TCGA-BH-A18I-01A-11D-A12A-01 | Affymetrix SNP 6.0 | (TODO) -- GDC | CNV__unfiltered__snp6 |
| TCGA-BH-A18I-01A-11D-A12A-01 | Affymetrix SNP 6.0 | (TODO) -- GDC | CNV__snp6 |
| TCGA-BH-A18J-01A-11D-A12A-01 | Affymetrix SNP 6.0 | (TODO) -- GDC | CNV__unfiltered__snp6 |
| TCGA-BH-A18J-01A-11D-A12A-01 | Affymetrix SNP 6.0 | (TODO) -- GDC | CNV__snp6 |
| TCGA-BH-A18K-01A-11D-A12A-01 | Affymetrix SNP 6.0 | (TODO) -- GDC | CNV__unfiltered__snp6 |
| TCGA-BH-A18K-01A-11D-A12A-01 | Affymetrix SNP 6.0 | (TODO) -- GDC | CNV__snp6 |
| TCGA-BH-A18L-01A-32D-A12A-01 | Affymetrix SNP 6.0 | (TODO) -- GDC | CNV__unfiltered__snp6 |
| TCGA-BH-A18L-01A-32D-A12A-01 | Affymetrix SNP 6.0 | (TODO) -- GDC | CNV__snp6 |
| TCGA-BH-A18M-01A-11D-A12A-01 | Affymetrix SNP 6.0 | (TODO) -- GDC | CNV__unfiltered__snp6 |
| TCGA-BH-A18M-01A-11D-A12A-01 | Affymetrix SNP 6.0 | (TODO) -- GDC | CNV__snp6 |
| TCGA-BH-A18N-01A-11D-A12A-01 | Affymetrix SNP 6.0 | (TODO) -- GDC | CNV__unfiltered__snp6 |
| TCGA-BH-A18N-01A-11D-A12A-01 | Affymetrix SNP 6.0 | (TODO) -- GDC | CNV__snp6 |
| TCGA-BH-A18P-01A-11D-A12A-01 | Affymetrix SNP 6.0 | (TODO) -- GDC | CNV__unfiltered__snp6 |
| TCGA-BH-A18P-01A-11D-A12A-01 | Affymetrix SNP 6.0 | (TODO) -- GDC | CNV__snp6 |
| TCGA-BH-A18Q-01A-12D-A12A-01 | Affymetrix SNP 6.0 | (TODO) -- GDC | CNV__unfiltered__snp6 |
| TCGA-BH-A18Q-01A-12D-A12A-01 | Affymetrix SNP 6.0 | (TODO) -- GDC | CNV__snp6 |
| TCGA-BH-A18R-01A-11D-A12A-01 | Affymetrix SNP 6.0 | (TODO) -- GDC | CNV__unfiltered__snp6 |
| TCGA-BH-A18R-01A-11D-A12A-01 | Affymetrix SNP 6.0 | (TODO) -- GDC | CNV__snp6 |
| TCGA-BH-A18S-01A-11D-A12A-01 | Affymetrix SNP 6.0 | (TODO) -- GDC | CNV__unfiltered__snp6 |
| TCGA-BH-A18S-01A-11D-A12A-01 | Affymetrix SNP 6.0 | (TODO) -- GDC | CNV__snp6 |
| TCGA-BH-A18T-01A-11D-A12A-01 | Affymetrix SNP 6.0 | (TODO) -- GDC | CNV__unfiltered__snp6 |
| TCGA-BH-A18T-01A-11D-A12A-01 | Affymetrix SNP 6.0 | (TODO) -- GDC | CNV__snp6 |
| TCGA-BH-A18U-01A-21D-A12A-01 | Affymetrix SNP 6.0 | (TODO) -- GDC | CNV__unfiltered__snp6 |
| TCGA-BH-A18U-01A-21D-A12A-01 | Affymetrix SNP 6.0 | (TODO) -- GDC | CNV__snp6 |
| TCGA-BH-A18V-01A-11D-A12A-01 | Affymetrix SNP 6.0 | (TODO) -- GDC | CNV__unfiltered__snp6 |
| TCGA-BH-A18V-01A-11D-A12A-01 | Affymetrix SNP 6.0 | (TODO) -- GDC | CNV__snp6 |
| TCGA-BH-A1EN-01A-11D-A13J-01 | Affymetrix SNP 6.0 | (TODO) -- GDC | CNV__unfiltered__snp6 |
| TCGA-BH-A1EN-01A-11D-A13J-01 | Affymetrix SNP 6.0 | (TODO) -- GDC | CNV__snp6 |
| TCGA-BH-A1EO-01A-11D-A134-01 | Affymetrix SNP 6.0 | (TODO) -- GDC | CNV__unfiltered__snp6 |
| TCGA-BH-A1EO-01A-11D-A134-01 | Affymetrix SNP 6.0 | (TODO) -- GDC | CNV__snp6 |
| TCGA-BH-A1ES-01A-11D-A134-01 | Affymetrix SNP 6.0 | (TODO) -- GDC | CNV__unfiltered__snp6 |
| TCGA-BH-A1ES-01A-11D-A134-01 | Affymetrix SNP 6.0 | (TODO) -- GDC | CNV__snp6 |
| TCGA-BH-A1ET-01A-11D-A134-01 | Affymetrix SNP 6.0 | (TODO) -- GDC | CNV__unfiltered__snp6 |
| TCGA-BH-A1ET-01A-11D-A134-01 | Affymetrix SNP 6.0 | (TODO) -- GDC | CNV__snp6 |
| TCGA-BH-A1EU-01A-11D-A134-01 | Affymetrix SNP 6.0 | (TODO) -- GDC | CNV__unfiltered__snp6 |
| TCGA-BH-A1EU-01A-11D-A134-01 | Affymetrix SNP 6.0 | (TODO) -- GDC | CNV__snp6 |
| TCGA-BH-A1EV-01A-11D-A134-01 | Affymetrix SNP 6.0 | (TODO) -- GDC | CNV__unfiltered__snp6 |
| TCGA-BH-A1EV-01A-11D-A134-01 | Affymetrix SNP 6.0 | (TODO) -- GDC | CNV__snp6 |
| TCGA-BH-A1EW-01A-11D-A134-01 | Affymetrix SNP 6.0 | (TODO) -- GDC | CNV__unfiltered__snp6 |
| TCGA-BH-A1EW-01A-11D-A134-01 | Affymetrix SNP 6.0 | (TODO) -- GDC | CNV__snp6 |
| TCGA-BH-A1EX-01A-11D-A13J-01 | Affymetrix SNP 6.0 | (TODO) -- GDC | CNV__unfiltered__snp6 |
| TCGA-BH-A1EX-01A-11D-A13J-01 | Affymetrix SNP 6.0 | (TODO) -- GDC | CNV__snp6 |
| TCGA-BH-A1EY-01A-11D-A13J-01 | Affymetrix SNP 6.0 | (TODO) -- GDC | CNV__unfiltered__snp6 |
| TCGA-BH-A1EY-01A-11D-A13J-01 | Affymetrix SNP 6.0 | (TODO) -- GDC | CNV__snp6 |
| TCGA-BH-A1F0-01A-11D-A134-01 | Affymetrix SNP 6.0 | (TODO) -- GDC | CNV__unfiltered__snp6 |
| TCGA-BH-A1F0-01A-11D-A134-01 | Affymetrix SNP 6.0 | (TODO) -- GDC | CNV__snp6 |
| TCGA-BH-A1F2-01A-31D-A13J-01 | Affymetrix SNP 6.0 | (TODO) -- GDC | CNV__unfiltered__snp6 |
| TCGA-BH-A1F2-01A-31D-A13J-01 | Affymetrix SNP 6.0 | (TODO) -- GDC | CNV__snp6 |
| TCGA-BH-A1F5-01A-12D-A13J-01 | Affymetrix SNP 6.0 | (TODO) -- GDC | CNV__unfiltered__snp6 |
| TCGA-BH-A1F5-01A-12D-A13J-01 | Affymetrix SNP 6.0 | (TODO) -- GDC | CNV__snp6 |
| TCGA-BH-A1F6-01A-11D-A13J-01 | Affymetrix SNP 6.0 | (TODO) -- GDC | CNV__unfiltered__snp6 |
| TCGA-BH-A1F6-01A-11D-A13J-01 | Affymetrix SNP 6.0 | (TODO) -- GDC | CNV__snp6 |
| TCGA-BH-A1F8-01A-11D-A13J-01 | Affymetrix SNP 6.0 | (TODO) -- GDC | CNV__unfiltered__snp6 |
| TCGA-BH-A1F8-01A-11D-A13J-01 | Affymetrix SNP 6.0 | (TODO) -- GDC | CNV__snp6 |
| TCGA-BH-A1FB-01A-11D-A13J-01 | Affymetrix SNP 6.0 | (TODO) -- GDC | CNV__unfiltered__snp6 |
| TCGA-BH-A1FB-01A-11D-A13J-01 | Affymetrix SNP 6.0 | (TODO) -- GDC | CNV__snp6 |
| TCGA-BH-A1FC-01A-11D-A13J-01 | Affymetrix SNP 6.0 | (TODO) -- GDC | CNV__unfiltered__snp6 |
| TCGA-BH-A1FC-01A-11D-A13J-01 | Affymetrix SNP 6.0 | (TODO) -- GDC | CNV__snp6 |
| TCGA-BH-A1FD-01A-11D-A13J-01 | Affymetrix SNP 6.0 | (TODO) -- GDC | CNV__unfiltered__snp6 |
| TCGA-BH-A1FD-01A-11D-A13J-01 | Affymetrix SNP 6.0 | (TODO) -- GDC | CNV__snp6 |
| TCGA-BH-A1FE-01A-11D-A13J-01 | Affymetrix SNP 6.0 | (TODO) -- GDC | CNV__unfiltered__snp6 |
| TCGA-BH-A1FE-01A-11D-A13J-01 | Affymetrix SNP 6.0 | (TODO) -- GDC | CNV__snp6 |
| TCGA-BH-A1FG-01A-11D-A13J-01 | Affymetrix SNP 6.0 | (TODO) -- GDC | CNV__unfiltered__snp6 |
| TCGA-BH-A1FG-01A-11D-A13J-01 | Affymetrix SNP 6.0 | (TODO) -- GDC | CNV__snp6 |
| TCGA-BH-A1FH-01A-12D-A13J-01 | Affymetrix SNP 6.0 | (TODO) -- GDC | CNV__unfiltered__snp6 |
| TCGA-BH-A1FH-01A-12D-A13J-01 | Affymetrix SNP 6.0 | (TODO) -- GDC | CNV__snp6 |
| TCGA-BH-A1FJ-01A-11D-A13J-01 | Affymetrix SNP 6.0 | (TODO) -- GDC | CNV__unfiltered__snp6 |
| TCGA-BH-A1FJ-01A-11D-A13J-01 | Affymetrix SNP 6.0 | (TODO) -- GDC | CNV__snp6 |
| TCGA-BH-A1FL-01A-11D-A13J-01 | Affymetrix SNP 6.0 | (TODO) -- GDC | CNV__unfiltered__snp6 |
| TCGA-BH-A1FL-01A-11D-A13J-01 | Affymetrix SNP 6.0 | (TODO) -- GDC | CNV__snp6 |
| TCGA-BH-A1FM-01A-11D-A13J-01 | Affymetrix SNP 6.0 | (TODO) -- GDC | CNV__unfiltered__snp6 |
| TCGA-BH-A1FM-01A-11D-A13J-01 | Affymetrix SNP 6.0 | (TODO) -- GDC | CNV__snp6 |
| TCGA-BH-A1FN-01A-11D-A13J-01 | Affymetrix SNP 6.0 | (TODO) -- GDC | CNV__unfiltered__snp6 |
| TCGA-BH-A1FN-01A-11D-A13J-01 | Affymetrix SNP 6.0 | (TODO) -- GDC | CNV__snp6 |
| TCGA-BH-A1FR-01A-11D-A13J-01 | Affymetrix SNP 6.0 | (TODO) -- GDC | CNV__unfiltered__snp6 |
| TCGA-BH-A1FR-01A-11D-A13J-01 | Affymetrix SNP 6.0 | (TODO) -- GDC | CNV__snp6 |
| TCGA-BH-A1FU-01A-11D-A14F-01 | Affymetrix SNP 6.0 | (TODO) -- GDC | CNV__unfiltered__snp6 |
| TCGA-BH-A1FU-01A-11D-A14F-01 | Affymetrix SNP 6.0 | (TODO) -- GDC | CNV__snp6 |
| TCGA-BH-A201-01A-11D-A14J-01 | Affymetrix SNP 6.0 | (TODO) -- GDC | CNV__unfiltered__snp6 |
| TCGA-BH-A201-01A-11D-A14J-01 | Affymetrix SNP 6.0 | (TODO) -- GDC | CNV__snp6 |
| TCGA-BH-A202-01A-11D-A14J-01 | Affymetrix SNP 6.0 | (TODO) -- GDC | CNV__unfiltered__snp6 |
| TCGA-BH-A202-01A-11D-A14J-01 | Affymetrix SNP 6.0 | (TODO) -- GDC | CNV__snp6 |
| TCGA-BH-A203-01A-12D-A166-01 | Affymetrix SNP 6.0 | (TODO) -- GDC | CNV__unfiltered__snp6 |
| TCGA-BH-A203-01A-12D-A166-01 | Affymetrix SNP 6.0 | (TODO) -- GDC | CNV__snp6 |
| TCGA-BH-A204-01A-11D-A160-01 | Affymetrix SNP 6.0 | (TODO) -- GDC | CNV__unfiltered__snp6 |
| TCGA-BH-A204-01A-11D-A160-01 | Affymetrix SNP 6.0 | (TODO) -- GDC | CNV__snp6 |
| TCGA-BH-A208-01A-11D-A160-01 | Affymetrix SNP 6.0 | (TODO) -- GDC | CNV__unfiltered__snp6 |
| TCGA-BH-A208-01A-11D-A160-01 | Affymetrix SNP 6.0 | (TODO) -- GDC | CNV__snp6 |
| TCGA-BH-A209-01A-11D-A160-01 | Affymetrix SNP 6.0 | (TODO) -- GDC | CNV__unfiltered__snp6 |
| TCGA-BH-A209-01A-11D-A160-01 | Affymetrix SNP 6.0 | (TODO) -- GDC | CNV__snp6 |
| TCGA-BH-A28O-01A-11D-A227-01 | Affymetrix SNP 6.0 | (TODO) -- GDC | CNV__unfiltered__snp6 |
| TCGA-BH-A28O-01A-11D-A227-01 | Affymetrix SNP 6.0 | (TODO) -- GDC | CNV__snp6 |
| TCGA-BH-A28Q-01A-11D-A16C-01 | Affymetrix SNP 6.0 | (TODO) -- GDC | CNV__unfiltered__snp6 |
| TCGA-BH-A28Q-01A-11D-A16C-01 | Affymetrix SNP 6.0 | (TODO) -- GDC | CNV__snp6 |
| TCGA-BH-A2L8-01A-11D-A18N-01 | Affymetrix SNP 6.0 | (TODO) -- GDC | CNV__unfiltered__snp6 |
| TCGA-BH-A2L8-01A-11D-A18N-01 | Affymetrix SNP 6.0 | (TODO) -- GDC | CNV__snp6 |
| TCGA-BH-A42T-01A-11D-A242-01 | Affymetrix SNP 6.0 | (TODO) -- GDC | CNV__unfiltered__snp6 |
| TCGA-BH-A42T-01A-11D-A242-01 | Affymetrix SNP 6.0 | (TODO) -- GDC | CNV__snp6 |
| TCGA-BH-A42U-01A-12D-A242-01 | Affymetrix SNP 6.0 | (TODO) -- GDC | CNV__unfiltered__snp6 |
| TCGA-BH-A42U-01A-12D-A242-01 | Affymetrix SNP 6.0 | (TODO) -- GDC | CNV__snp6 |
| TCGA-BH-A42V-01A-11D-A242-01 | Affymetrix SNP 6.0 | (TODO) -- GDC | CNV__unfiltered__snp6 |
| TCGA-BH-A42V-01A-11D-A242-01 | Affymetrix SNP 6.0 | (TODO) -- GDC | CNV__snp6 |
| TCGA-BH-A5IZ-01A-11D-A27O-01 | Affymetrix SNP 6.0 | (TODO) -- GDC | CNV__unfiltered__snp6 |
| TCGA-BH-A5IZ-01A-11D-A27O-01 | Affymetrix SNP 6.0 | (TODO) -- GDC | CNV__snp6 |
| TCGA-BH-A5J0-01A-11D-A27O-01 | Affymetrix SNP 6.0 | (TODO) -- GDC | CNV__unfiltered__snp6 |
| TCGA-BH-A5J0-01A-11D-A27O-01 | Affymetrix SNP 6.0 | (TODO) -- GDC | CNV__snp6 |
| TCGA-BH-A6R8-01A-21D-A33D-01 | Affymetrix SNP 6.0 | (TODO) -- GDC | CNV__unfiltered__snp6 |
| TCGA-BH-A6R8-01A-21D-A33D-01 | Affymetrix SNP 6.0 | (TODO) -- GDC | CNV__snp6 |
| TCGA-BH-A6R9-01A-21D-A32H-01 | Affymetrix SNP 6.0 | (TODO) -- GDC | CNV__unfiltered__snp6 |
| TCGA-BH-A6R9-01A-21D-A32H-01 | Affymetrix SNP 6.0 | (TODO) -- GDC | CNV__snp6 |
| TCGA-BH-A8FY-01A-11D-A36I-01 | Affymetrix SNP 6.0 | (TODO) -- GDC | CNV__unfiltered__snp6 |
| TCGA-BH-A8FY-01A-11D-A36I-01 | Affymetrix SNP 6.0 | (TODO) -- GDC | CNV__snp6 |
| TCGA-BH-A8FZ-01A-11D-A350-01 | Affymetrix SNP 6.0 | (TODO) -- GDC | CNV__unfiltered__snp6 |
| TCGA-BH-A8FZ-01A-11D-A350-01 | Affymetrix SNP 6.0 | (TODO) -- GDC | CNV__snp6 |
| TCGA-BH-A8G0-01A-11D-A350-01 | Affymetrix SNP 6.0 | (TODO) -- GDC | CNV__unfiltered__snp6 |
| TCGA-BH-A8G0-01A-11D-A350-01 | Affymetrix SNP 6.0 | (TODO) -- GDC | CNV__snp6 |
| TCGA-BH-AB28-01A-31D-A41E-01 | Affymetrix SNP 6.0 | (TODO) -- GDC | CNV__unfiltered__snp6 |
| TCGA-BH-AB28-01A-31D-A41E-01 | Affymetrix SNP 6.0 | (TODO) -- GDC | CNV__snp6 |
| TCGA-C8-A12K-01A-21D-A111-01 | Affymetrix SNP 6.0 | (TODO) -- GDC | CNV__unfiltered__snp6 |
| TCGA-C8-A12K-01A-21D-A111-01 | Affymetrix SNP 6.0 | (TODO) -- GDC | CNV__snp6 |
| TCGA-C8-A12L-01A-11D-A111-01 | Affymetrix SNP 6.0 | (TODO) -- GDC | CNV__unfiltered__snp6 |
| TCGA-C8-A12L-01A-11D-A111-01 | Affymetrix SNP 6.0 | (TODO) -- GDC | CNV__snp6 |
| TCGA-C8-A12M-01A-11D-A111-01 | Affymetrix SNP 6.0 | (TODO) -- GDC | CNV__unfiltered__snp6 |
| TCGA-C8-A12M-01A-11D-A111-01 | Affymetrix SNP 6.0 | (TODO) -- GDC | CNV__snp6 |
| TCGA-C8-A12N-01A-11D-A111-01 | Affymetrix SNP 6.0 | (TODO) -- GDC | CNV__unfiltered__snp6 |
| TCGA-C8-A12N-01A-11D-A111-01 | Affymetrix SNP 6.0 | (TODO) -- GDC | CNV__snp6 |
| TCGA-C8-A12O-01A-11D-A111-01 | Affymetrix SNP 6.0 | (TODO) -- GDC | CNV__unfiltered__snp6 |
| TCGA-C8-A12O-01A-11D-A111-01 | Affymetrix SNP 6.0 | (TODO) -- GDC | CNV__snp6 |
| TCGA-C8-A12P-01A-11D-A111-01 | Affymetrix SNP 6.0 | (TODO) -- GDC | CNV__unfiltered__snp6 |
| TCGA-C8-A12P-01A-11D-A111-01 | Affymetrix SNP 6.0 | (TODO) -- GDC | CNV__snp6 |
| TCGA-C8-A12Q-01A-11D-A111-01 | Affymetrix SNP 6.0 | (TODO) -- GDC | CNV__unfiltered__snp6 |
| TCGA-C8-A12Q-01A-11D-A111-01 | Affymetrix SNP 6.0 | (TODO) -- GDC | CNV__snp6 |
| TCGA-C8-A12T-01A-11D-A111-01 | Affymetrix SNP 6.0 | (TODO) -- GDC | CNV__unfiltered__snp6 |
| TCGA-C8-A12T-01A-11D-A111-01 | Affymetrix SNP 6.0 | (TODO) -- GDC | CNV__snp6 |
| TCGA-C8-A12U-01A-11D-A111-01 | Affymetrix SNP 6.0 | (TODO) -- GDC | CNV__unfiltered__snp6 |
| TCGA-C8-A12U-01A-11D-A111-01 | Affymetrix SNP 6.0 | (TODO) -- GDC | CNV__snp6 |
| TCGA-C8-A12V-01A-11D-A111-01 | Affymetrix SNP 6.0 | (TODO) -- GDC | CNV__unfiltered__snp6 |
| TCGA-C8-A12V-01A-11D-A111-01 | Affymetrix SNP 6.0 | (TODO) -- GDC | CNV__snp6 |
| TCGA-C8-A12W-01A-11D-A111-01 | Affymetrix SNP 6.0 | (TODO) -- GDC | CNV__unfiltered__snp6 |
| TCGA-C8-A12W-01A-11D-A111-01 | Affymetrix SNP 6.0 | (TODO) -- GDC | CNV__snp6 |
| TCGA-C8-A12X-01A-11D-A111-01 | Affymetrix SNP 6.0 | (TODO) -- GDC | CNV__unfiltered__snp6 |
| TCGA-C8-A12X-01A-11D-A111-01 | Affymetrix SNP 6.0 | (TODO) -- GDC | CNV__snp6 |
| TCGA-C8-A12Y-01A-11D-A12A-01 | Affymetrix SNP 6.0 | (TODO) -- GDC | CNV__unfiltered__snp6 |
| TCGA-C8-A12Y-01A-11D-A12A-01 | Affymetrix SNP 6.0 | (TODO) -- GDC | CNV__snp6 |
| TCGA-C8-A12Z-01A-11D-A111-01 | Affymetrix SNP 6.0 | (TODO) -- GDC | CNV__unfiltered__snp6 |
| TCGA-C8-A12Z-01A-11D-A111-01 | Affymetrix SNP 6.0 | (TODO) -- GDC | CNV__snp6 |
| TCGA-C8-A130-01A-31D-A111-01 | Affymetrix SNP 6.0 | (TODO) -- GDC | CNV__unfiltered__snp6 |
| TCGA-C8-A130-01A-31D-A111-01 | Affymetrix SNP 6.0 | (TODO) -- GDC | CNV__snp6 |
| TCGA-C8-A131-01A-11D-A111-01 | Affymetrix SNP 6.0 | (TODO) -- GDC | CNV__unfiltered__snp6 |
| TCGA-C8-A131-01A-11D-A111-01 | Affymetrix SNP 6.0 | (TODO) -- GDC | CNV__snp6 |
| TCGA-C8-A132-01A-31D-A111-01 | Affymetrix SNP 6.0 | (TODO) -- GDC | CNV__unfiltered__snp6 |
| TCGA-C8-A132-01A-31D-A111-01 | Affymetrix SNP 6.0 | (TODO) -- GDC | CNV__snp6 |
| TCGA-C8-A133-01A-32D-A12A-01 | Affymetrix SNP 6.0 | (TODO) -- GDC | CNV__unfiltered__snp6 |
| TCGA-C8-A133-01A-32D-A12A-01 | Affymetrix SNP 6.0 | (TODO) -- GDC | CNV__snp6 |
| TCGA-C8-A134-01A-11D-A111-01 | Affymetrix SNP 6.0 | (TODO) -- GDC | CNV__unfiltered__snp6 |
| TCGA-C8-A134-01A-11D-A111-01 | Affymetrix SNP 6.0 | (TODO) -- GDC | CNV__snp6 |
| TCGA-C8-A135-01A-11D-A111-01 | Affymetrix SNP 6.0 | (TODO) -- GDC | CNV__unfiltered__snp6 |
| TCGA-C8-A135-01A-11D-A111-01 | Affymetrix SNP 6.0 | (TODO) -- GDC | CNV__snp6 |
| TCGA-C8-A137-01A-11D-A111-01 | Affymetrix SNP 6.0 | (TODO) -- GDC | CNV__unfiltered__snp6 |
| TCGA-C8-A137-01A-11D-A111-01 | Affymetrix SNP 6.0 | (TODO) -- GDC | CNV__snp6 |
| TCGA-C8-A138-01A-11D-A111-01 | Affymetrix SNP 6.0 | (TODO) -- GDC | CNV__unfiltered__snp6 |
| TCGA-C8-A138-01A-11D-A111-01 | Affymetrix SNP 6.0 | (TODO) -- GDC | CNV__snp6 |
| TCGA-C8-A1HE-01A-11D-A13J-01 | Affymetrix SNP 6.0 | (TODO) -- GDC | CNV__unfiltered__snp6 |
| TCGA-C8-A1HE-01A-11D-A13J-01 | Affymetrix SNP 6.0 | (TODO) -- GDC | CNV__snp6 |
| TCGA-C8-A1HF-01A-11D-A134-01 | Affymetrix SNP 6.0 | (TODO) -- GDC | CNV__unfiltered__snp6 |
| TCGA-C8-A1HF-01A-11D-A134-01 | Affymetrix SNP 6.0 | (TODO) -- GDC | CNV__snp6 |
| TCGA-C8-A1HG-01A-11D-A134-01 | Affymetrix SNP 6.0 | (TODO) -- GDC | CNV__unfiltered__snp6 |
| TCGA-C8-A1HG-01A-11D-A134-01 | Affymetrix SNP 6.0 | (TODO) -- GDC | CNV__snp6 |
| TCGA-C8-A1HI-01A-11D-A134-01 | Affymetrix SNP 6.0 | (TODO) -- GDC | CNV__unfiltered__snp6 |
| TCGA-C8-A1HI-01A-11D-A134-01 | Affymetrix SNP 6.0 | (TODO) -- GDC | CNV__snp6 |
| TCGA-C8-A1HJ-01A-11D-A13J-01 | Affymetrix SNP 6.0 | (TODO) -- GDC | CNV__unfiltered__snp6 |
| TCGA-C8-A1HJ-01A-11D-A13J-01 | Affymetrix SNP 6.0 | (TODO) -- GDC | CNV__snp6 |
| TCGA-C8-A1HK-01A-21D-A13J-01 | Affymetrix SNP 6.0 | (TODO) -- GDC | CNV__unfiltered__snp6 |
| TCGA-C8-A1HK-01A-21D-A13J-01 | Affymetrix SNP 6.0 | (TODO) -- GDC | CNV__snp6 |
| TCGA-C8-A1HL-01A-11D-A134-01 | Affymetrix SNP 6.0 | (TODO) -- GDC | CNV__unfiltered__snp6 |
| TCGA-C8-A1HL-01A-11D-A134-01 | Affymetrix SNP 6.0 | (TODO) -- GDC | CNV__snp6 |
| TCGA-C8-A1HM-01A-12D-A134-01 | Affymetrix SNP 6.0 | (TODO) -- GDC | CNV__unfiltered__snp6 |
| TCGA-C8-A1HM-01A-12D-A134-01 | Affymetrix SNP 6.0 | (TODO) -- GDC | CNV__snp6 |
| TCGA-C8-A1HN-01A-11D-A134-01 | Affymetrix SNP 6.0 | (TODO) -- GDC | CNV__unfiltered__snp6 |
| TCGA-C8-A1HN-01A-11D-A134-01 | Affymetrix SNP 6.0 | (TODO) -- GDC | CNV__snp6 |
| TCGA-C8-A1HO-01A-11D-A13J-01 | Affymetrix SNP 6.0 | (TODO) -- GDC | CNV__unfiltered__snp6 |
| TCGA-C8-A1HO-01A-11D-A13J-01 | Affymetrix SNP 6.0 | (TODO) -- GDC | CNV__snp6 |
| TCGA-C8-A26V-01A-11D-A16C-01 | Affymetrix SNP 6.0 | (TODO) -- GDC | CNV__unfiltered__snp6 |
| TCGA-C8-A26V-01A-11D-A16C-01 | Affymetrix SNP 6.0 | (TODO) -- GDC | CNV__snp6 |
| TCGA-C8-A26W-01A-11D-A16C-01 | Affymetrix SNP 6.0 | (TODO) -- GDC | CNV__unfiltered__snp6 |
| TCGA-C8-A26W-01A-11D-A16C-01 | Affymetrix SNP 6.0 | (TODO) -- GDC | CNV__snp6 |
| TCGA-C8-A26X-01A-31D-A16C-01 | Affymetrix SNP 6.0 | (TODO) -- GDC | CNV__unfiltered__snp6 |
| TCGA-C8-A26X-01A-31D-A16C-01 | Affymetrix SNP 6.0 | (TODO) -- GDC | CNV__snp6 |
| TCGA-C8-A26Y-01A-11D-A16C-01 | Affymetrix SNP 6.0 | (TODO) -- GDC | CNV__unfiltered__snp6 |
| TCGA-C8-A26Y-01A-11D-A16C-01 | Affymetrix SNP 6.0 | (TODO) -- GDC | CNV__snp6 |
| TCGA-C8-A26Z-01A-11D-A16C-01 | Affymetrix SNP 6.0 | (TODO) -- GDC | CNV__unfiltered__snp6 |
| TCGA-C8-A26Z-01A-11D-A16C-01 | Affymetrix SNP 6.0 | (TODO) -- GDC | CNV__snp6 |
| TCGA-C8-A273-01A-11D-A16C-01 | Affymetrix SNP 6.0 | (TODO) -- GDC | CNV__unfiltered__snp6 |
| TCGA-C8-A273-01A-11D-A16C-01 | Affymetrix SNP 6.0 | (TODO) -- GDC | CNV__snp6 |
| TCGA-C8-A274-01A-11D-A16C-01 | Affymetrix SNP 6.0 | (TODO) -- GDC | CNV__unfiltered__snp6 |
| TCGA-C8-A274-01A-11D-A16C-01 | Affymetrix SNP 6.0 | (TODO) -- GDC | CNV__snp6 |
| TCGA-C8-A275-01A-21D-A16C-01 | Affymetrix SNP 6.0 | (TODO) -- GDC | CNV__unfiltered__snp6 |
| TCGA-C8-A275-01A-21D-A16C-01 | Affymetrix SNP 6.0 | (TODO) -- GDC | CNV__snp6 |
| TCGA-C8-A278-01A-11D-A166-01 | Affymetrix SNP 6.0 | (TODO) -- GDC | CNV__unfiltered__snp6 |
| TCGA-C8-A278-01A-11D-A166-01 | Affymetrix SNP 6.0 | (TODO) -- GDC | CNV__snp6 |
| TCGA-C8-A27A-01A-11D-A166-01 | Affymetrix SNP 6.0 | (TODO) -- GDC | CNV__unfiltered__snp6 |
| TCGA-C8-A27A-01A-11D-A166-01 | Affymetrix SNP 6.0 | (TODO) -- GDC | CNV__snp6 |
| TCGA-C8-A27B-01A-11D-A166-01 | Affymetrix SNP 6.0 | (TODO) -- GDC | CNV__unfiltered__snp6 |
| TCGA-C8-A27B-01A-11D-A166-01 | Affymetrix SNP 6.0 | (TODO) -- GDC | CNV__snp6 |
| TCGA-C8-A3M7-01A-12D-A21P-01 | Affymetrix SNP 6.0 | (TODO) -- GDC | CNV__unfiltered__snp6 |
| TCGA-C8-A3M7-01A-12D-A21P-01 | Affymetrix SNP 6.0 | (TODO) -- GDC | CNV__snp6 |
| TCGA-C8-A3M8-01A-11D-A20R-01 | Affymetrix SNP 6.0 | (TODO) -- GDC | CNV__unfiltered__snp6 |
| TCGA-C8-A3M8-01A-11D-A20R-01 | Affymetrix SNP 6.0 | (TODO) -- GDC | CNV__snp6 |
| TCGA-C8-A8HP-01A-11D-A36I-01 | Affymetrix SNP 6.0 | (TODO) -- GDC | CNV__unfiltered__snp6 |
| TCGA-C8-A8HP-01A-11D-A36I-01 | Affymetrix SNP 6.0 | (TODO) -- GDC | CNV__snp6 |
| TCGA-C8-A8HQ-01A-11D-A36I-01 | Affymetrix SNP 6.0 | (TODO) -- GDC | CNV__unfiltered__snp6 |
| TCGA-C8-A8HQ-01A-11D-A36I-01 | Affymetrix SNP 6.0 | (TODO) -- GDC | CNV__snp6 |
| TCGA-C8-A8HR-01A-11D-A36I-01 | Affymetrix SNP 6.0 | (TODO) -- GDC | CNV__unfiltered__snp6 |
| TCGA-C8-A8HR-01A-11D-A36I-01 | Affymetrix SNP 6.0 | (TODO) -- GDC | CNV__snp6 |
| TCGA-C8-A9FZ-01A-11D-A41E-01 | Affymetrix SNP 6.0 | (TODO) -- GDC | CNV__unfiltered__snp6 |
| TCGA-C8-A9FZ-01A-11D-A41E-01 | Affymetrix SNP 6.0 | (TODO) -- GDC | CNV__snp6 |
| TCGA-D8-A13Y-01A-11D-A111-01 | Affymetrix SNP 6.0 | (TODO) -- GDC | CNV__unfiltered__snp6 |
| TCGA-D8-A13Y-01A-11D-A111-01 | Affymetrix SNP 6.0 | (TODO) -- GDC | CNV__snp6 |
| TCGA-D8-A13Z-01A-11D-A111-01 | Affymetrix SNP 6.0 | (TODO) -- GDC | CNV__unfiltered__snp6 |
| TCGA-D8-A13Z-01A-11D-A111-01 | Affymetrix SNP 6.0 | (TODO) -- GDC | CNV__snp6 |
| TCGA-D8-A140-01A-11D-A111-01 | Affymetrix SNP 6.0 | (TODO) -- GDC | CNV__unfiltered__snp6 |
| TCGA-D8-A140-01A-11D-A111-01 | Affymetrix SNP 6.0 | (TODO) -- GDC | CNV__snp6 |
| TCGA-D8-A141-01A-11D-A111-01 | Affymetrix SNP 6.0 | (TODO) -- GDC | CNV__unfiltered__snp6 |
| TCGA-D8-A141-01A-11D-A111-01 | Affymetrix SNP 6.0 | (TODO) -- GDC | CNV__snp6 |
| TCGA-D8-A142-01A-11D-A111-01 | Affymetrix SNP 6.0 | (TODO) -- GDC | CNV__unfiltered__snp6 |
| TCGA-D8-A142-01A-11D-A111-01 | Affymetrix SNP 6.0 | (TODO) -- GDC | CNV__snp6 |
| TCGA-D8-A143-01A-11D-A111-01 | Affymetrix SNP 6.0 | (TODO) -- GDC | CNV__unfiltered__snp6 |
| TCGA-D8-A143-01A-11D-A111-01 | Affymetrix SNP 6.0 | (TODO) -- GDC | CNV__snp6 |
| TCGA-D8-A145-01A-11D-A111-01 | Affymetrix SNP 6.0 | (TODO) -- GDC | CNV__unfiltered__snp6 |
| TCGA-D8-A145-01A-11D-A111-01 | Affymetrix SNP 6.0 | (TODO) -- GDC | CNV__snp6 |
| TCGA-D8-A146-01A-31D-A111-01 | Affymetrix SNP 6.0 | (TODO) -- GDC | CNV__unfiltered__snp6 |
| TCGA-D8-A146-01A-31D-A111-01 | Affymetrix SNP 6.0 | (TODO) -- GDC | CNV__snp6 |
| TCGA-D8-A147-01A-11D-A111-01 | Affymetrix SNP 6.0 | (TODO) -- GDC | CNV__unfiltered__snp6 |
| TCGA-D8-A147-01A-11D-A111-01 | Affymetrix SNP 6.0 | (TODO) -- GDC | CNV__snp6 |
| TCGA-D8-A1J8-01A-11D-A13J-01 | Affymetrix SNP 6.0 | (TODO) -- GDC | CNV__unfiltered__snp6 |
| TCGA-D8-A1J8-01A-11D-A13J-01 | Affymetrix SNP 6.0 | (TODO) -- GDC | CNV__snp6 |
| TCGA-D8-A1J9-01A-11D-A13J-01 | Affymetrix SNP 6.0 | (TODO) -- GDC | CNV__unfiltered__snp6 |
| TCGA-D8-A1J9-01A-11D-A13J-01 | Affymetrix SNP 6.0 | (TODO) -- GDC | CNV__snp6 |
| TCGA-D8-A1JA-01A-11D-A13J-01 | Affymetrix SNP 6.0 | (TODO) -- GDC | CNV__unfiltered__snp6 |
| TCGA-D8-A1JA-01A-11D-A13J-01 | Affymetrix SNP 6.0 | (TODO) -- GDC | CNV__snp6 |
| TCGA-D8-A1JB-01A-11D-A13J-01 | Affymetrix SNP 6.0 | (TODO) -- GDC | CNV__unfiltered__snp6 |
| TCGA-D8-A1JB-01A-11D-A13J-01 | Affymetrix SNP 6.0 | (TODO) -- GDC | CNV__snp6 |
| TCGA-D8-A1JC-01A-11D-A13J-01 | Affymetrix SNP 6.0 | (TODO) -- GDC | CNV__unfiltered__snp6 |
| TCGA-D8-A1JC-01A-11D-A13J-01 | Affymetrix SNP 6.0 | (TODO) -- GDC | CNV__snp6 |
| TCGA-D8-A1JD-01A-11D-A13J-01 | Affymetrix SNP 6.0 | (TODO) -- GDC | CNV__unfiltered__snp6 |
| TCGA-D8-A1JD-01A-11D-A13J-01 | Affymetrix SNP 6.0 | (TODO) -- GDC | CNV__snp6 |
| TCGA-D8-A1JE-01A-11D-A13J-01 | Affymetrix SNP 6.0 | (TODO) -- GDC | CNV__unfiltered__snp6 |
| TCGA-D8-A1JE-01A-11D-A13J-01 | Affymetrix SNP 6.0 | (TODO) -- GDC | CNV__snp6 |
| TCGA-D8-A1JF-01A-11D-A13J-01 | Affymetrix SNP 6.0 | (TODO) -- GDC | CNV__unfiltered__snp6 |
| TCGA-D8-A1JF-01A-11D-A13J-01 | Affymetrix SNP 6.0 | (TODO) -- GDC | CNV__snp6 |
| TCGA-D8-A1JG-01B-11D-A13J-01 | Affymetrix SNP 6.0 | (TODO) -- GDC | CNV__unfiltered__snp6 |
| TCGA-D8-A1JG-01B-11D-A13J-01 | Affymetrix SNP 6.0 | (TODO) -- GDC | CNV__snp6 |
| TCGA-D8-A1JH-01A-11D-A13J-01 | Affymetrix SNP 6.0 | (TODO) -- GDC | CNV__unfiltered__snp6 |
| TCGA-D8-A1JH-01A-11D-A13J-01 | Affymetrix SNP 6.0 | (TODO) -- GDC | CNV__snp6 |
| TCGA-D8-A1JI-01A-11D-A13J-01 | Affymetrix SNP 6.0 | (TODO) -- GDC | CNV__unfiltered__snp6 |
| TCGA-D8-A1JI-01A-11D-A13J-01 | Affymetrix SNP 6.0 | (TODO) -- GDC | CNV__snp6 |
| TCGA-D8-A1JJ-01A-31D-A14J-01 | Affymetrix SNP 6.0 | (TODO) -- GDC | CNV__unfiltered__snp6 |
| TCGA-D8-A1JJ-01A-31D-A14J-01 | Affymetrix SNP 6.0 | (TODO) -- GDC | CNV__snp6 |
| TCGA-D8-A1JK-01A-11D-A13J-01 | Affymetrix SNP 6.0 | (TODO) -- GDC | CNV__unfiltered__snp6 |
| TCGA-D8-A1JK-01A-11D-A13J-01 | Affymetrix SNP 6.0 | (TODO) -- GDC | CNV__snp6 |
| TCGA-D8-A1JL-01A-11D-A13J-01 | Affymetrix SNP 6.0 | (TODO) -- GDC | CNV__unfiltered__snp6 |
| TCGA-D8-A1JL-01A-11D-A13J-01 | Affymetrix SNP 6.0 | (TODO) -- GDC | CNV__snp6 |
| TCGA-D8-A1JM-01A-11D-A13J-01 | Affymetrix SNP 6.0 | (TODO) -- GDC | CNV__unfiltered__snp6 |
| TCGA-D8-A1JM-01A-11D-A13J-01 | Affymetrix SNP 6.0 | (TODO) -- GDC | CNV__snp6 |
| TCGA-D8-A1JN-01A-11D-A13J-01 | Affymetrix SNP 6.0 | (TODO) -- GDC | CNV__unfiltered__snp6 |
| TCGA-D8-A1JN-01A-11D-A13J-01 | Affymetrix SNP 6.0 | (TODO) -- GDC | CNV__snp6 |
| TCGA-D8-A1JP-01A-11D-A13J-01 | Affymetrix SNP 6.0 | (TODO) -- GDC | CNV__unfiltered__snp6 |
| TCGA-D8-A1JP-01A-11D-A13J-01 | Affymetrix SNP 6.0 | (TODO) -- GDC | CNV__snp6 |
| TCGA-D8-A1JS-01A-11D-A13J-01 | Affymetrix SNP 6.0 | (TODO) -- GDC | CNV__unfiltered__snp6 |
| TCGA-D8-A1JS-01A-11D-A13J-01 | Affymetrix SNP 6.0 | (TODO) -- GDC | CNV__snp6 |
| TCGA-D8-A1JT-01A-31D-A13J-01 | Affymetrix SNP 6.0 | (TODO) -- GDC | CNV__unfiltered__snp6 |
| TCGA-D8-A1JT-01A-31D-A13J-01 | Affymetrix SNP 6.0 | (TODO) -- GDC | CNV__snp6 |
| TCGA-D8-A1JU-01A-11D-A13J-01 | Affymetrix SNP 6.0 | (TODO) -- GDC | CNV__unfiltered__snp6 |
| TCGA-D8-A1JU-01A-11D-A13J-01 | Affymetrix SNP 6.0 | (TODO) -- GDC | CNV__snp6 |
| TCGA-D8-A1X5-01A-11D-A14F-01 | Affymetrix SNP 6.0 | (TODO) -- GDC | CNV__unfiltered__snp6 |
| TCGA-D8-A1X5-01A-11D-A14F-01 | Affymetrix SNP 6.0 | (TODO) -- GDC | CNV__snp6 |
| TCGA-D8-A1X6-01A-11D-A14J-01 | Affymetrix SNP 6.0 | (TODO) -- GDC | CNV__unfiltered__snp6 |
| TCGA-D8-A1X6-01A-11D-A14J-01 | Affymetrix SNP 6.0 | (TODO) -- GDC | CNV__snp6 |
| TCGA-D8-A1X7-01A-11D-A14J-01 | Affymetrix SNP 6.0 | (TODO) -- GDC | CNV__unfiltered__snp6 |
| TCGA-D8-A1X7-01A-11D-A14J-01 | Affymetrix SNP 6.0 | (TODO) -- GDC | CNV__snp6 |
| TCGA-D8-A1X8-01A-11D-A14J-01 | Affymetrix SNP 6.0 | (TODO) -- GDC | CNV__unfiltered__snp6 |
| TCGA-D8-A1X8-01A-11D-A14J-01 | Affymetrix SNP 6.0 | (TODO) -- GDC | CNV__snp6 |
| TCGA-D8-A1X9-01A-12D-A160-01 | Affymetrix SNP 6.0 | (TODO) -- GDC | CNV__unfiltered__snp6 |
| TCGA-D8-A1X9-01A-12D-A160-01 | Affymetrix SNP 6.0 | (TODO) -- GDC | CNV__snp6 |
| TCGA-D8-A1XA-01A-11D-A14F-01 | Affymetrix SNP 6.0 | (TODO) -- GDC | CNV__unfiltered__snp6 |
| TCGA-D8-A1XA-01A-11D-A14F-01 | Affymetrix SNP 6.0 | (TODO) -- GDC | CNV__snp6 |
| TCGA-D8-A1XB-01A-11D-A14F-01 | Affymetrix SNP 6.0 | (TODO) -- GDC | CNV__unfiltered__snp6 |
| TCGA-D8-A1XB-01A-11D-A14F-01 | Affymetrix SNP 6.0 | (TODO) -- GDC | CNV__snp6 |
| TCGA-D8-A1XC-01A-11D-A14F-01 | Affymetrix SNP 6.0 | (TODO) -- GDC | CNV__unfiltered__snp6 |
| TCGA-D8-A1XC-01A-11D-A14F-01 | Affymetrix SNP 6.0 | (TODO) -- GDC | CNV__snp6 |
| TCGA-D8-A1XD-01A-11D-A14F-01 | Affymetrix SNP 6.0 | (TODO) -- GDC | CNV__unfiltered__snp6 |
| TCGA-D8-A1XD-01A-11D-A14F-01 | Affymetrix SNP 6.0 | (TODO) -- GDC | CNV__snp6 |
| TCGA-D8-A1XF-01A-11D-A14F-01 | Affymetrix SNP 6.0 | (TODO) -- GDC | CNV__unfiltered__snp6 |
| TCGA-D8-A1XF-01A-11D-A14F-01 | Affymetrix SNP 6.0 | (TODO) -- GDC | CNV__snp6 |
| TCGA-D8-A1XG-01A-11D-A14F-01 | Affymetrix SNP 6.0 | (TODO) -- GDC | CNV__unfiltered__snp6 |
| TCGA-D8-A1XG-01A-11D-A14F-01 | Affymetrix SNP 6.0 | (TODO) -- GDC | CNV__snp6 |
| TCGA-D8-A1XJ-01A-11D-A14J-01 | Affymetrix SNP 6.0 | (TODO) -- GDC | CNV__unfiltered__snp6 |
| TCGA-D8-A1XJ-01A-11D-A14J-01 | Affymetrix SNP 6.0 | (TODO) -- GDC | CNV__snp6 |
| TCGA-D8-A1XK-01A-21D-A14J-01 | Affymetrix SNP 6.0 | (TODO) -- GDC | CNV__unfiltered__snp6 |
| TCGA-D8-A1XK-01A-21D-A14J-01 | Affymetrix SNP 6.0 | (TODO) -- GDC | CNV__snp6 |
| TCGA-D8-A1XL-01A-11D-A14J-01 | Affymetrix SNP 6.0 | (TODO) -- GDC | CNV__unfiltered__snp6 |
| TCGA-D8-A1XL-01A-11D-A14J-01 | Affymetrix SNP 6.0 | (TODO) -- GDC | CNV__snp6 |
| TCGA-D8-A1XM-01A-21D-A14J-01 | Affymetrix SNP 6.0 | (TODO) -- GDC | CNV__unfiltered__snp6 |
| TCGA-D8-A1XM-01A-21D-A14J-01 | Affymetrix SNP 6.0 | (TODO) -- GDC | CNV__snp6 |
| TCGA-D8-A1XO-01A-11D-A14J-01 | Affymetrix SNP 6.0 | (TODO) -- GDC | CNV__unfiltered__snp6 |
| TCGA-D8-A1XO-01A-11D-A14J-01 | Affymetrix SNP 6.0 | (TODO) -- GDC | CNV__snp6 |
| TCGA-D8-A1XQ-01A-11D-A14J-01 | Affymetrix SNP 6.0 | (TODO) -- GDC | CNV__unfiltered__snp6 |
| TCGA-D8-A1XQ-01A-11D-A14J-01 | Affymetrix SNP 6.0 | (TODO) -- GDC | CNV__snp6 |
| TCGA-D8-A1XR-01A-11D-A14J-01 | Affymetrix SNP 6.0 | (TODO) -- GDC | CNV__unfiltered__snp6 |
| TCGA-D8-A1XR-01A-11D-A14J-01 | Affymetrix SNP 6.0 | (TODO) -- GDC | CNV__snp6 |
| TCGA-D8-A1XS-01A-11D-A14J-01 | Affymetrix SNP 6.0 | (TODO) -- GDC | CNV__unfiltered__snp6 |
| TCGA-D8-A1XS-01A-11D-A14J-01 | Affymetrix SNP 6.0 | (TODO) -- GDC | CNV__snp6 |
| TCGA-D8-A1XT-01A-11D-A14J-01 | Affymetrix SNP 6.0 | (TODO) -- GDC | CNV__unfiltered__snp6 |
| TCGA-D8-A1XT-01A-11D-A14J-01 | Affymetrix SNP 6.0 | (TODO) -- GDC | CNV__snp6 |
| TCGA-D8-A1XU-01A-11D-A14J-01 | Affymetrix SNP 6.0 | (TODO) -- GDC | CNV__unfiltered__snp6 |
| TCGA-D8-A1XU-01A-11D-A14J-01 | Affymetrix SNP 6.0 | (TODO) -- GDC | CNV__snp6 |
| TCGA-D8-A1XV-01A-11D-A14J-01 | Affymetrix SNP 6.0 | (TODO) -- GDC | CNV__unfiltered__snp6 |
| TCGA-D8-A1XV-01A-11D-A14J-01 | Affymetrix SNP 6.0 | (TODO) -- GDC | CNV__snp6 |
| TCGA-D8-A1XW-01A-11D-A14J-01 | Affymetrix SNP 6.0 | (TODO) -- GDC | CNV__unfiltered__snp6 |
| TCGA-D8-A1XW-01A-11D-A14J-01 | Affymetrix SNP 6.0 | (TODO) -- GDC | CNV__snp6 |
| TCGA-D8-A1XY-01A-11D-A14J-01 | Affymetrix SNP 6.0 | (TODO) -- GDC | CNV__unfiltered__snp6 |
| TCGA-D8-A1XY-01A-11D-A14J-01 | Affymetrix SNP 6.0 | (TODO) -- GDC | CNV__snp6 |
| TCGA-D8-A1XZ-01A-11D-A14J-01 | Affymetrix SNP 6.0 | (TODO) -- GDC | CNV__unfiltered__snp6 |
| TCGA-D8-A1XZ-01A-11D-A14J-01 | Affymetrix SNP 6.0 | (TODO) -- GDC | CNV__snp6 |
| TCGA-D8-A1Y0-01A-11D-A14J-01 | Affymetrix SNP 6.0 | (TODO) -- GDC | CNV__unfiltered__snp6 |
| TCGA-D8-A1Y0-01A-11D-A14J-01 | Affymetrix SNP 6.0 | (TODO) -- GDC | CNV__snp6 |
| TCGA-D8-A1Y1-01A-21D-A14J-01 | Affymetrix SNP 6.0 | (TODO) -- GDC | CNV__unfiltered__snp6 |
| TCGA-D8-A1Y1-01A-21D-A14J-01 | Affymetrix SNP 6.0 | (TODO) -- GDC | CNV__snp6 |
| TCGA-D8-A1Y2-01A-11D-A160-01 | Affymetrix SNP 6.0 | (TODO) -- GDC | CNV__unfiltered__snp6 |
| TCGA-D8-A1Y2-01A-11D-A160-01 | Affymetrix SNP 6.0 | (TODO) -- GDC | CNV__snp6 |
| TCGA-D8-A1Y3-01A-11D-A160-01 | Affymetrix SNP 6.0 | (TODO) -- GDC | CNV__unfiltered__snp6 |
| TCGA-D8-A1Y3-01A-11D-A160-01 | Affymetrix SNP 6.0 | (TODO) -- GDC | CNV__snp6 |
| TCGA-D8-A27E-01A-11D-A16C-01 | Affymetrix SNP 6.0 | (TODO) -- GDC | CNV__unfiltered__snp6 |
| TCGA-D8-A27E-01A-11D-A16C-01 | Affymetrix SNP 6.0 | (TODO) -- GDC | CNV__snp6 |
| TCGA-D8-A27F-01A-11D-A16C-01 | Affymetrix SNP 6.0 | (TODO) -- GDC | CNV__unfiltered__snp6 |
| TCGA-D8-A27F-01A-11D-A16C-01 | Affymetrix SNP 6.0 | (TODO) -- GDC | CNV__snp6 |
| TCGA-D8-A27G-01A-11D-A16C-01 | Affymetrix SNP 6.0 | (TODO) -- GDC | CNV__unfiltered__snp6 |
| TCGA-D8-A27G-01A-11D-A16C-01 | Affymetrix SNP 6.0 | (TODO) -- GDC | CNV__snp6 |
| TCGA-D8-A27H-01A-11D-A16C-01 | Affymetrix SNP 6.0 | (TODO) -- GDC | CNV__unfiltered__snp6 |
| TCGA-D8-A27H-01A-11D-A16C-01 | Affymetrix SNP 6.0 | (TODO) -- GDC | CNV__snp6 |
| TCGA-D8-A27I-01A-11D-A16C-01 | Affymetrix SNP 6.0 | (TODO) -- GDC | CNV__unfiltered__snp6 |
| TCGA-D8-A27I-01A-11D-A16C-01 | Affymetrix SNP 6.0 | (TODO) -- GDC | CNV__snp6 |
| TCGA-D8-A27K-01A-11D-A16C-01 | Affymetrix SNP 6.0 | (TODO) -- GDC | CNV__unfiltered__snp6 |
| TCGA-D8-A27K-01A-11D-A16C-01 | Affymetrix SNP 6.0 | (TODO) -- GDC | CNV__snp6 |
| TCGA-D8-A27L-01A-11D-A16C-01 | Affymetrix SNP 6.0 | (TODO) -- GDC | CNV__unfiltered__snp6 |
| TCGA-D8-A27L-01A-11D-A16C-01 | Affymetrix SNP 6.0 | (TODO) -- GDC | CNV__snp6 |
| TCGA-D8-A27M-01A-11D-A16C-01 | Affymetrix SNP 6.0 | (TODO) -- GDC | CNV__unfiltered__snp6 |
| TCGA-D8-A27M-01A-11D-A16C-01 | Affymetrix SNP 6.0 | (TODO) -- GDC | CNV__snp6 |
| TCGA-D8-A27N-01A-11D-A16C-01 | Affymetrix SNP 6.0 | (TODO) -- GDC | CNV__unfiltered__snp6 |
| TCGA-D8-A27N-01A-11D-A16C-01 | Affymetrix SNP 6.0 | (TODO) -- GDC | CNV__snp6 |
| TCGA-D8-A27P-01A-11D-A16C-01 | Affymetrix SNP 6.0 | (TODO) -- GDC | CNV__unfiltered__snp6 |
| TCGA-D8-A27P-01A-11D-A16C-01 | Affymetrix SNP 6.0 | (TODO) -- GDC | CNV__snp6 |
| TCGA-D8-A27R-01A-11D-A16C-01 | Affymetrix SNP 6.0 | (TODO) -- GDC | CNV__unfiltered__snp6 |
| TCGA-D8-A27R-01A-11D-A16C-01 | Affymetrix SNP 6.0 | (TODO) -- GDC | CNV__snp6 |
| TCGA-D8-A27T-01A-11D-A16C-01 | Affymetrix SNP 6.0 | (TODO) -- GDC | CNV__unfiltered__snp6 |
| TCGA-D8-A27T-01A-11D-A16C-01 | Affymetrix SNP 6.0 | (TODO) -- GDC | CNV__snp6 |
| TCGA-D8-A27V-01A-12D-A17C-01 | Affymetrix SNP 6.0 | (TODO) -- GDC | CNV__unfiltered__snp6 |
| TCGA-D8-A27V-01A-12D-A17C-01 | Affymetrix SNP 6.0 | (TODO) -- GDC | CNV__snp6 |
| TCGA-D8-A27W-01A-11D-A16C-01 | Affymetrix SNP 6.0 | (TODO) -- GDC | CNV__unfiltered__snp6 |
| TCGA-D8-A27W-01A-11D-A16C-01 | Affymetrix SNP 6.0 | (TODO) -- GDC | CNV__snp6 |
| TCGA-D8-A3Z5-01A-41D-A242-01 | Affymetrix SNP 6.0 | (TODO) -- GDC | CNV__unfiltered__snp6 |
| TCGA-D8-A3Z5-01A-41D-A242-01 | Affymetrix SNP 6.0 | (TODO) -- GDC | CNV__snp6 |
| TCGA-D8-A3Z6-01A-11D-A238-01 | Affymetrix SNP 6.0 | (TODO) -- GDC | CNV__unfiltered__snp6 |
| TCGA-D8-A3Z6-01A-11D-A238-01 | Affymetrix SNP 6.0 | (TODO) -- GDC | CNV__snp6 |
| TCGA-D8-A4Z1-01A-21D-A25N-01 | Affymetrix SNP 6.0 | (TODO) -- GDC | CNV__unfiltered__snp6 |
| TCGA-D8-A4Z1-01A-21D-A25N-01 | Affymetrix SNP 6.0 | (TODO) -- GDC | CNV__snp6 |
| TCGA-D8-A73U-01A-11D-A33D-01 | Affymetrix SNP 6.0 | (TODO) -- GDC | CNV__unfiltered__snp6 |
| TCGA-D8-A73U-01A-11D-A33D-01 | Affymetrix SNP 6.0 | (TODO) -- GDC | CNV__snp6 |
| TCGA-D8-A73W-01A-22D-A350-01 | Affymetrix SNP 6.0 | (TODO) -- GDC | CNV__unfiltered__snp6 |
| TCGA-D8-A73W-01A-22D-A350-01 | Affymetrix SNP 6.0 | (TODO) -- GDC | CNV__snp6 |
| TCGA-D8-A73X-01A-11D-A32H-01 | Affymetrix SNP 6.0 | (TODO) -- GDC | CNV__unfiltered__snp6 |
| TCGA-D8-A73X-01A-11D-A32H-01 | Affymetrix SNP 6.0 | (TODO) -- GDC | CNV__snp6 |
| TCGA-E2-A105-01A-11D-A10L-01 | Affymetrix SNP 6.0 | (TODO) -- GDC | CNV__unfiltered__snp6 |
| TCGA-E2-A105-01A-11D-A10L-01 | Affymetrix SNP 6.0 | (TODO) -- GDC | CNV__snp6 |
| TCGA-E2-A106-01A-11D-A10L-01 | Affymetrix SNP 6.0 | (TODO) -- GDC | CNV__unfiltered__snp6 |
| TCGA-E2-A106-01A-11D-A10L-01 | Affymetrix SNP 6.0 | (TODO) -- GDC | CNV__snp6 |
| TCGA-E2-A107-01A-11D-A10L-01 | Affymetrix SNP 6.0 | (TODO) -- GDC | CNV__unfiltered__snp6 |
| TCGA-E2-A107-01A-11D-A10L-01 | Affymetrix SNP 6.0 | (TODO) -- GDC | CNV__snp6 |
| TCGA-E2-A108-01A-13D-A10L-01 | Affymetrix SNP 6.0 | (TODO) -- GDC | CNV__unfiltered__snp6 |
| TCGA-E2-A108-01A-13D-A10L-01 | Affymetrix SNP 6.0 | (TODO) -- GDC | CNV__snp6 |
| TCGA-E2-A109-01A-11D-A10L-01 | Affymetrix SNP 6.0 | (TODO) -- GDC | CNV__unfiltered__snp6 |
| TCGA-E2-A109-01A-11D-A10L-01 | Affymetrix SNP 6.0 | (TODO) -- GDC | CNV__snp6 |
| TCGA-E2-A10A-01A-21D-A111-01 | Affymetrix SNP 6.0 | (TODO) -- GDC | CNV__unfiltered__snp6 |
| TCGA-E2-A10A-01A-21D-A111-01 | Affymetrix SNP 6.0 | (TODO) -- GDC | CNV__snp6 |
| TCGA-E2-A10B-01A-11D-A10L-01 | Affymetrix SNP 6.0 | (TODO) -- GDC | CNV__unfiltered__snp6 |
| TCGA-E2-A10B-01A-11D-A10L-01 | Affymetrix SNP 6.0 | (TODO) -- GDC | CNV__snp6 |
| TCGA-E2-A10C-01A-21D-A10L-01 | Affymetrix SNP 6.0 | (TODO) -- GDC | CNV__unfiltered__snp6 |
| TCGA-E2-A10C-01A-21D-A10L-01 | Affymetrix SNP 6.0 | (TODO) -- GDC | CNV__snp6 |
| TCGA-E2-A10E-01A-21D-A10L-01 | Affymetrix SNP 6.0 | (TODO) -- GDC | CNV__unfiltered__snp6 |
| TCGA-E2-A10E-01A-21D-A10L-01 | Affymetrix SNP 6.0 | (TODO) -- GDC | CNV__snp6 |
| TCGA-E2-A10F-01A-11D-A10L-01 | Affymetrix SNP 6.0 | (TODO) -- GDC | CNV__unfiltered__snp6 |
| TCGA-E2-A10F-01A-11D-A10L-01 | Affymetrix SNP 6.0 | (TODO) -- GDC | CNV__snp6 |
| TCGA-E2-A14N-01A-31D-A134-01 | Affymetrix SNP 6.0 | (TODO) -- GDC | CNV__unfiltered__snp6 |
| TCGA-E2-A14N-01A-31D-A134-01 | Affymetrix SNP 6.0 | (TODO) -- GDC | CNV__snp6 |
| TCGA-E2-A14O-01A-31D-A111-01 | Affymetrix SNP 6.0 | (TODO) -- GDC | CNV__unfiltered__snp6 |
| TCGA-E2-A14O-01A-31D-A111-01 | Affymetrix SNP 6.0 | (TODO) -- GDC | CNV__snp6 |
| TCGA-E2-A14P-01A-31D-A12A-01 | Affymetrix SNP 6.0 | (TODO) -- GDC | CNV__unfiltered__snp6 |
| TCGA-E2-A14P-01A-31D-A12A-01 | Affymetrix SNP 6.0 | (TODO) -- GDC | CNV__snp6 |
| TCGA-E2-A14Q-01A-11D-A12A-01 | Affymetrix SNP 6.0 | (TODO) -- GDC | CNV__unfiltered__snp6 |
| TCGA-E2-A14Q-01A-11D-A12A-01 | Affymetrix SNP 6.0 | (TODO) -- GDC | CNV__snp6 |
| TCGA-E2-A14R-01A-11D-A111-01 | Affymetrix SNP 6.0 | (TODO) -- GDC | CNV__unfiltered__snp6 |
| TCGA-E2-A14R-01A-11D-A111-01 | Affymetrix SNP 6.0 | (TODO) -- GDC | CNV__snp6 |
| TCGA-E2-A14S-01A-11D-A12A-01 | Affymetrix SNP 6.0 | (TODO) -- GDC | CNV__unfiltered__snp6 |
| TCGA-E2-A14S-01A-11D-A12A-01 | Affymetrix SNP 6.0 | (TODO) -- GDC | CNV__snp6 |
| TCGA-E2-A14T-01A-11D-A111-01 | Affymetrix SNP 6.0 | (TODO) -- GDC | CNV__unfiltered__snp6 |
| TCGA-E2-A14T-01A-11D-A111-01 | Affymetrix SNP 6.0 | (TODO) -- GDC | CNV__snp6 |
| TCGA-E2-A14U-01A-11D-A227-01 | Affymetrix SNP 6.0 | (TODO) -- GDC | CNV__unfiltered__snp6 |
| TCGA-E2-A14U-01A-11D-A227-01 | Affymetrix SNP 6.0 | (TODO) -- GDC | CNV__snp6 |
| TCGA-E2-A14V-01A-11D-A12A-01 | Affymetrix SNP 6.0 | (TODO) -- GDC | CNV__unfiltered__snp6 |
| TCGA-E2-A14V-01A-11D-A12A-01 | Affymetrix SNP 6.0 | (TODO) -- GDC | CNV__snp6 |
| TCGA-E2-A14W-01A-11D-A12A-01 | Affymetrix SNP 6.0 | (TODO) -- GDC | CNV__unfiltered__snp6 |
| TCGA-E2-A14W-01A-11D-A12A-01 | Affymetrix SNP 6.0 | (TODO) -- GDC | CNV__snp6 |
| TCGA-E2-A14X-01A-11D-A111-01 | Affymetrix SNP 6.0 | (TODO) -- GDC | CNV__unfiltered__snp6 |
| TCGA-E2-A14X-01A-11D-A111-01 | Affymetrix SNP 6.0 | (TODO) -- GDC | CNV__snp6 |
| TCGA-E2-A14Y-01A-21D-A12A-01 | Affymetrix SNP 6.0 | (TODO) -- GDC | CNV__unfiltered__snp6 |
| TCGA-E2-A14Y-01A-21D-A12A-01 | Affymetrix SNP 6.0 | (TODO) -- GDC | CNV__snp6 |
| TCGA-E2-A14Z-01A-11D-A111-01 | Affymetrix SNP 6.0 | (TODO) -- GDC | CNV__unfiltered__snp6 |
| TCGA-E2-A14Z-01A-11D-A111-01 | Affymetrix SNP 6.0 | (TODO) -- GDC | CNV__snp6 |
| TCGA-E2-A150-01A-11D-A12A-01 | Affymetrix SNP 6.0 | (TODO) -- GDC | CNV__unfiltered__snp6 |
| TCGA-E2-A150-01A-11D-A12A-01 | Affymetrix SNP 6.0 | (TODO) -- GDC | CNV__snp6 |
| TCGA-E2-A152-01A-11D-A12A-01 | Affymetrix SNP 6.0 | (TODO) -- GDC | CNV__unfiltered__snp6 |
| TCGA-E2-A152-01A-11D-A12A-01 | Affymetrix SNP 6.0 | (TODO) -- GDC | CNV__snp6 |
| TCGA-E2-A153-01A-12D-A12A-01 | Affymetrix SNP 6.0 | (TODO) -- GDC | CNV__unfiltered__snp6 |
| TCGA-E2-A153-01A-12D-A12A-01 | Affymetrix SNP 6.0 | (TODO) -- GDC | CNV__snp6 |
| TCGA-E2-A154-01A-11D-A111-01 | Affymetrix SNP 6.0 | (TODO) -- GDC | CNV__unfiltered__snp6 |
| TCGA-E2-A154-01A-11D-A111-01 | Affymetrix SNP 6.0 | (TODO) -- GDC | CNV__snp6 |
| TCGA-E2-A155-01A-11D-A12A-01 | Affymetrix SNP 6.0 | (TODO) -- GDC | CNV__unfiltered__snp6 |
| TCGA-E2-A155-01A-11D-A12A-01 | Affymetrix SNP 6.0 | (TODO) -- GDC | CNV__snp6 |
| TCGA-E2-A156-01A-11D-A12A-01 | Affymetrix SNP 6.0 | (TODO) -- GDC | CNV__unfiltered__snp6 |
| TCGA-E2-A156-01A-11D-A12A-01 | Affymetrix SNP 6.0 | (TODO) -- GDC | CNV__snp6 |
| TCGA-E2-A158-01A-11D-A12A-01 | Affymetrix SNP 6.0 | (TODO) -- GDC | CNV__unfiltered__snp6 |
| TCGA-E2-A158-01A-11D-A12A-01 | Affymetrix SNP 6.0 | (TODO) -- GDC | CNV__snp6 |
| TCGA-E2-A159-01A-11D-A111-01 | Affymetrix SNP 6.0 | (TODO) -- GDC | CNV__unfiltered__snp6 |
| TCGA-E2-A159-01A-11D-A111-01 | Affymetrix SNP 6.0 | (TODO) -- GDC | CNV__snp6 |
| TCGA-E2-A15A-01A-11D-A12A-01 | Affymetrix SNP 6.0 | (TODO) -- GDC | CNV__unfiltered__snp6 |
| TCGA-E2-A15A-01A-11D-A12A-01 | Affymetrix SNP 6.0 | (TODO) -- GDC | CNV__snp6 |
| TCGA-E2-A15C-01A-31D-A12A-01 | Affymetrix SNP 6.0 | (TODO) -- GDC | CNV__unfiltered__snp6 |
| TCGA-E2-A15C-01A-31D-A12A-01 | Affymetrix SNP 6.0 | (TODO) -- GDC | CNV__snp6 |
| TCGA-E2-A15D-01A-11D-A111-01 | Affymetrix SNP 6.0 | (TODO) -- GDC | CNV__unfiltered__snp6 |
| TCGA-E2-A15D-01A-11D-A111-01 | Affymetrix SNP 6.0 | (TODO) -- GDC | CNV__snp6 |
| TCGA-E2-A15E-01A-11D-A12A-01 | Affymetrix SNP 6.0 | (TODO) -- GDC | CNV__unfiltered__snp6 |
| TCGA-E2-A15E-01A-11D-A12A-01 | Affymetrix SNP 6.0 | (TODO) -- GDC | CNV__snp6 |
| TCGA-E2-A15F-01A-11D-A111-01 | Affymetrix SNP 6.0 | (TODO) -- GDC | CNV__unfiltered__snp6 |
| TCGA-E2-A15F-01A-11D-A111-01 | Affymetrix SNP 6.0 | (TODO) -- GDC | CNV__snp6 |
| TCGA-E2-A15G-01A-11D-A12A-01 | Affymetrix SNP 6.0 | (TODO) -- GDC | CNV__unfiltered__snp6 |
| TCGA-E2-A15G-01A-11D-A12A-01 | Affymetrix SNP 6.0 | (TODO) -- GDC | CNV__snp6 |
| TCGA-E2-A15H-01A-11D-A12A-01 | Affymetrix SNP 6.0 | (TODO) -- GDC | CNV__unfiltered__snp6 |
| TCGA-E2-A15H-01A-11D-A12A-01 | Affymetrix SNP 6.0 | (TODO) -- GDC | CNV__snp6 |
| TCGA-E2-A15I-01A-21D-A134-01 | Affymetrix SNP 6.0 | (TODO) -- GDC | CNV__unfiltered__snp6 |
| TCGA-E2-A15I-01A-21D-A134-01 | Affymetrix SNP 6.0 | (TODO) -- GDC | CNV__snp6 |
| TCGA-E2-A15J-01A-11D-A12N-01 | Affymetrix SNP 6.0 | (TODO) -- GDC | CNV__unfiltered__snp6 |
| TCGA-E2-A15J-01A-11D-A12N-01 | Affymetrix SNP 6.0 | (TODO) -- GDC | CNV__snp6 |
| TCGA-E2-A15K-01A-11D-A12N-01 | Affymetrix SNP 6.0 | (TODO) -- GDC | CNV__unfiltered__snp6 |
| TCGA-E2-A15K-01A-11D-A12N-01 | Affymetrix SNP 6.0 | (TODO) -- GDC | CNV__snp6 |
| TCGA-E2-A15L-01A-11D-A12A-01 | Affymetrix SNP 6.0 | (TODO) -- GDC | CNV__unfiltered__snp6 |
| TCGA-E2-A15L-01A-11D-A12A-01 | Affymetrix SNP 6.0 | (TODO) -- GDC | CNV__snp6 |
| TCGA-E2-A15M-01A-11D-A12A-01 | Affymetrix SNP 6.0 | (TODO) -- GDC | CNV__unfiltered__snp6 |
| TCGA-E2-A15M-01A-11D-A12A-01 | Affymetrix SNP 6.0 | (TODO) -- GDC | CNV__snp6 |
| TCGA-E2-A15O-01A-11D-A111-01 | Affymetrix SNP 6.0 | (TODO) -- GDC | CNV__unfiltered__snp6 |
| TCGA-E2-A15O-01A-11D-A111-01 | Affymetrix SNP 6.0 | (TODO) -- GDC | CNV__snp6 |
| TCGA-E2-A15P-01A-11D-A111-01 | Affymetrix SNP 6.0 | (TODO) -- GDC | CNV__unfiltered__snp6 |
| TCGA-E2-A15P-01A-11D-A111-01 | Affymetrix SNP 6.0 | (TODO) -- GDC | CNV__snp6 |
| TCGA-E2-A15R-01A-11D-A111-01 | Affymetrix SNP 6.0 | (TODO) -- GDC | CNV__unfiltered__snp6 |
| TCGA-E2-A15R-01A-11D-A111-01 | Affymetrix SNP 6.0 | (TODO) -- GDC | CNV__snp6 |
| TCGA-E2-A15S-01A-11D-A111-01 | Affymetrix SNP 6.0 | (TODO) -- GDC | CNV__unfiltered__snp6 |
| TCGA-E2-A15S-01A-11D-A111-01 | Affymetrix SNP 6.0 | (TODO) -- GDC | CNV__snp6 |
| TCGA-E2-A15T-01A-11D-A111-01 | Affymetrix SNP 6.0 | (TODO) -- GDC | CNV__unfiltered__snp6 |
| TCGA-E2-A15T-01A-11D-A111-01 | Affymetrix SNP 6.0 | (TODO) -- GDC | CNV__snp6 |
| TCGA-E2-A1AZ-01A-11D-A12N-01 | Affymetrix SNP 6.0 | (TODO) -- GDC | CNV__unfiltered__snp6 |
| TCGA-E2-A1AZ-01A-11D-A12N-01 | Affymetrix SNP 6.0 | (TODO) -- GDC | CNV__snp6 |
| TCGA-E2-A1B0-01A-11D-A12N-01 | Affymetrix SNP 6.0 | (TODO) -- GDC | CNV__unfiltered__snp6 |
| TCGA-E2-A1B0-01A-11D-A12N-01 | Affymetrix SNP 6.0 | (TODO) -- GDC | CNV__snp6 |
| TCGA-E2-A1B1-01A-21D-A12N-01 | Affymetrix SNP 6.0 | (TODO) -- GDC | CNV__unfiltered__snp6 |
| TCGA-E2-A1B1-01A-21D-A12N-01 | Affymetrix SNP 6.0 | (TODO) -- GDC | CNV__snp6 |
| TCGA-E2-A1B4-01A-11D-A12N-01 | Affymetrix SNP 6.0 | (TODO) -- GDC | CNV__unfiltered__snp6 |
| TCGA-E2-A1B4-01A-11D-A12N-01 | Affymetrix SNP 6.0 | (TODO) -- GDC | CNV__snp6 |
| TCGA-E2-A1B5-01A-21D-A12N-01 | Affymetrix SNP 6.0 | (TODO) -- GDC | CNV__unfiltered__snp6 |
| TCGA-E2-A1B5-01A-21D-A12N-01 | Affymetrix SNP 6.0 | (TODO) -- GDC | CNV__snp6 |
| TCGA-E2-A1B6-01A-31D-A12N-01 | Affymetrix SNP 6.0 | (TODO) -- GDC | CNV__unfiltered__snp6 |
| TCGA-E2-A1B6-01A-31D-A12N-01 | Affymetrix SNP 6.0 | (TODO) -- GDC | CNV__snp6 |
| TCGA-E2-A1BC-01A-11D-A12N-01 | Affymetrix SNP 6.0 | (TODO) -- GDC | CNV__unfiltered__snp6 |
| TCGA-E2-A1BC-01A-11D-A12N-01 | Affymetrix SNP 6.0 | (TODO) -- GDC | CNV__snp6 |
| TCGA-E2-A1BD-01A-11D-A12N-01 | Affymetrix SNP 6.0 | (TODO) -- GDC | CNV__unfiltered__snp6 |
| TCGA-E2-A1BD-01A-11D-A12N-01 | Affymetrix SNP 6.0 | (TODO) -- GDC | CNV__snp6 |
| TCGA-E2-A1IE-01A-11D-A13J-01 | Affymetrix SNP 6.0 | (TODO) -- GDC | CNV__unfiltered__snp6 |
| TCGA-E2-A1IE-01A-11D-A13J-01 | Affymetrix SNP 6.0 | (TODO) -- GDC | CNV__snp6 |
| TCGA-E2-A1IF-01A-11D-A141-01 | Affymetrix SNP 6.0 | (TODO) -- GDC | CNV__unfiltered__snp6 |
| TCGA-E2-A1IF-01A-11D-A141-01 | Affymetrix SNP 6.0 | (TODO) -- GDC | CNV__snp6 |
| TCGA-E2-A1IG-01A-11D-A141-01 | Affymetrix SNP 6.0 | (TODO) -- GDC | CNV__unfiltered__snp6 |
| TCGA-E2-A1IG-01A-11D-A141-01 | Affymetrix SNP 6.0 | (TODO) -- GDC | CNV__snp6 |
| TCGA-E2-A1IH-01A-11D-A13J-01 | Affymetrix SNP 6.0 | (TODO) -- GDC | CNV__unfiltered__snp6 |
| TCGA-E2-A1IH-01A-11D-A13J-01 | Affymetrix SNP 6.0 | (TODO) -- GDC | CNV__snp6 |
| TCGA-E2-A1II-01A-11D-A141-01 | Affymetrix SNP 6.0 | (TODO) -- GDC | CNV__unfiltered__snp6 |
| TCGA-E2-A1II-01A-11D-A141-01 | Affymetrix SNP 6.0 | (TODO) -- GDC | CNV__snp6 |
| TCGA-E2-A1IJ-01A-11D-A141-01 | Affymetrix SNP 6.0 | (TODO) -- GDC | CNV__unfiltered__snp6 |
| TCGA-E2-A1IJ-01A-11D-A141-01 | Affymetrix SNP 6.0 | (TODO) -- GDC | CNV__snp6 |
| TCGA-E2-A1IK-01A-11D-A141-01 | Affymetrix SNP 6.0 | (TODO) -- GDC | CNV__unfiltered__snp6 |
| TCGA-E2-A1IK-01A-11D-A141-01 | Affymetrix SNP 6.0 | (TODO) -- GDC | CNV__snp6 |
| TCGA-E2-A1IL-01A-11D-A14F-01 | Affymetrix SNP 6.0 | (TODO) -- GDC | CNV__unfiltered__snp6 |
| TCGA-E2-A1IL-01A-11D-A14F-01 | Affymetrix SNP 6.0 | (TODO) -- GDC | CNV__snp6 |
| TCGA-E2-A1IN-01A-11D-A13J-01 | Affymetrix SNP 6.0 | (TODO) -- GDC | CNV__unfiltered__snp6 |
| TCGA-E2-A1IN-01A-11D-A13J-01 | Affymetrix SNP 6.0 | (TODO) -- GDC | CNV__snp6 |
| TCGA-E2-A1IO-01A-11D-A141-01 | Affymetrix SNP 6.0 | (TODO) -- GDC | CNV__unfiltered__snp6 |
| TCGA-E2-A1IO-01A-11D-A141-01 | Affymetrix SNP 6.0 | (TODO) -- GDC | CNV__snp6 |
| TCGA-E2-A1IU-01A-11D-A14F-01 | Affymetrix SNP 6.0 | (TODO) -- GDC | CNV__unfiltered__snp6 |
| TCGA-E2-A1IU-01A-11D-A14F-01 | Affymetrix SNP 6.0 | (TODO) -- GDC | CNV__snp6 |
| TCGA-E2-A1L6-01A-11D-A13J-01 | Affymetrix SNP 6.0 | (TODO) -- GDC | CNV__unfiltered__snp6 |
| TCGA-E2-A1L6-01A-11D-A13J-01 | Affymetrix SNP 6.0 | (TODO) -- GDC | CNV__snp6 |
| TCGA-E2-A1L7-01A-11D-A141-01 | Affymetrix SNP 6.0 | (TODO) -- GDC | CNV__unfiltered__snp6 |
| TCGA-E2-A1L7-01A-11D-A141-01 | Affymetrix SNP 6.0 | (TODO) -- GDC | CNV__snp6 |
| TCGA-E2-A1L8-01A-11D-A13J-01 | Affymetrix SNP 6.0 | (TODO) -- GDC | CNV__unfiltered__snp6 |
| TCGA-E2-A1L8-01A-11D-A13J-01 | Affymetrix SNP 6.0 | (TODO) -- GDC | CNV__snp6 |
| TCGA-E2-A1L9-01A-11D-A13J-01 | Affymetrix SNP 6.0 | (TODO) -- GDC | CNV__unfiltered__snp6 |
| TCGA-E2-A1L9-01A-11D-A13J-01 | Affymetrix SNP 6.0 | (TODO) -- GDC | CNV__snp6 |
| TCGA-E2-A1LA-01A-11D-A141-01 | Affymetrix SNP 6.0 | (TODO) -- GDC | CNV__unfiltered__snp6 |
| TCGA-E2-A1LA-01A-11D-A141-01 | Affymetrix SNP 6.0 | (TODO) -- GDC | CNV__snp6 |
| TCGA-E2-A1LB-01A-11D-A141-01 | Affymetrix SNP 6.0 | (TODO) -- GDC | CNV__unfiltered__snp6 |
| TCGA-E2-A1LB-01A-11D-A141-01 | Affymetrix SNP 6.0 | (TODO) -- GDC | CNV__snp6 |
| TCGA-E2-A1LE-01A-12D-A19X-01 | Affymetrix SNP 6.0 | (TODO) -- GDC | CNV__unfiltered__snp6 |
| TCGA-E2-A1LE-01A-12D-A19X-01 | Affymetrix SNP 6.0 | (TODO) -- GDC | CNV__snp6 |
| TCGA-E2-A1LG-01A-21D-A14J-01 | Affymetrix SNP 6.0 | (TODO) -- GDC | CNV__unfiltered__snp6 |
| TCGA-E2-A1LG-01A-21D-A14J-01 | Affymetrix SNP 6.0 | (TODO) -- GDC | CNV__snp6 |
| TCGA-E2-A1LH-01A-11D-A14F-01 | Affymetrix SNP 6.0 | (TODO) -- GDC | CNV__unfiltered__snp6 |
| TCGA-E2-A1LH-01A-11D-A14F-01 | Affymetrix SNP 6.0 | (TODO) -- GDC | CNV__snp6 |
| TCGA-E2-A1LI-01A-12D-A160-01 | Affymetrix SNP 6.0 | (TODO) -- GDC | CNV__unfiltered__snp6 |
| TCGA-E2-A1LI-01A-12D-A160-01 | Affymetrix SNP 6.0 | (TODO) -- GDC | CNV__snp6 |
| TCGA-E2-A1LK-01A-21D-A14F-01 | Affymetrix SNP 6.0 | (TODO) -- GDC | CNV__unfiltered__snp6 |
| TCGA-E2-A1LK-01A-21D-A14F-01 | Affymetrix SNP 6.0 | (TODO) -- GDC | CNV__snp6 |
| TCGA-E2-A1LL-01A-11D-A141-01 | Affymetrix SNP 6.0 | (TODO) -- GDC | CNV__unfiltered__snp6 |
| TCGA-E2-A1LL-01A-11D-A141-01 | Affymetrix SNP 6.0 | (TODO) -- GDC | CNV__snp6 |
| TCGA-E2-A2P5-01A-11D-A19X-01 | Affymetrix SNP 6.0 | (TODO) -- GDC | CNV__unfiltered__snp6 |
| TCGA-E2-A2P5-01A-11D-A19X-01 | Affymetrix SNP 6.0 | (TODO) -- GDC | CNV__snp6 |
| TCGA-E2-A2P6-01A-11D-A19X-01 | Affymetrix SNP 6.0 | (TODO) -- GDC | CNV__unfiltered__snp6 |
| TCGA-E2-A2P6-01A-11D-A19X-01 | Affymetrix SNP 6.0 | (TODO) -- GDC | CNV__snp6 |
| TCGA-E2-A3DX-01A-21D-A20R-01 | Affymetrix SNP 6.0 | (TODO) -- GDC | CNV__unfiltered__snp6 |
| TCGA-E2-A3DX-01A-21D-A20R-01 | Affymetrix SNP 6.0 | (TODO) -- GDC | CNV__snp6 |
| TCGA-E2-A56Z-01A-12D-A29M-01 | Affymetrix SNP 6.0 | (TODO) -- GDC | CNV__unfiltered__snp6 |
| TCGA-E2-A56Z-01A-12D-A29M-01 | Affymetrix SNP 6.0 | (TODO) -- GDC | CNV__snp6 |
| TCGA-E2-A570-01A-11D-A29M-01 | Affymetrix SNP 6.0 | (TODO) -- GDC | CNV__unfiltered__snp6 |
| TCGA-E2-A570-01A-11D-A29M-01 | Affymetrix SNP 6.0 | (TODO) -- GDC | CNV__snp6 |
| TCGA-E2-A572-01A-13D-A31T-01 | Affymetrix SNP 6.0 | (TODO) -- GDC | CNV__unfiltered__snp6 |
| TCGA-E2-A572-01A-13D-A31T-01 | Affymetrix SNP 6.0 | (TODO) -- GDC | CNV__snp6 |
| TCGA-E2-A573-01A-11D-A29M-01 | Affymetrix SNP 6.0 | (TODO) -- GDC | CNV__unfiltered__snp6 |
| TCGA-E2-A573-01A-11D-A29M-01 | Affymetrix SNP 6.0 | (TODO) -- GDC | CNV__snp6 |
| TCGA-E2-A574-01A-11D-A29M-01 | Affymetrix SNP 6.0 | (TODO) -- GDC | CNV__unfiltered__snp6 |
| TCGA-E2-A574-01A-11D-A29M-01 | Affymetrix SNP 6.0 | (TODO) -- GDC | CNV__snp6 |
| TCGA-E2-A576-01A-11D-A31T-01 | Affymetrix SNP 6.0 | (TODO) -- GDC | CNV__unfiltered__snp6 |
| TCGA-E2-A576-01A-11D-A31T-01 | Affymetrix SNP 6.0 | (TODO) -- GDC | CNV__snp6 |
| TCGA-E2-A9RU-01A-11D-A41E-01 | Affymetrix SNP 6.0 | (TODO) -- GDC | CNV__unfiltered__snp6 |
| TCGA-E2-A9RU-01A-11D-A41E-01 | Affymetrix SNP 6.0 | (TODO) -- GDC | CNV__snp6 |
| TCGA-E9-A1N3-01A-12D-A160-01 | Affymetrix SNP 6.0 | (TODO) -- GDC | CNV__unfiltered__snp6 |
| TCGA-E9-A1N3-01A-12D-A160-01 | Affymetrix SNP 6.0 | (TODO) -- GDC | CNV__snp6 |
| TCGA-E9-A1N4-01A-11D-A14J-01 | Affymetrix SNP 6.0 | (TODO) -- GDC | CNV__unfiltered__snp6 |
| TCGA-E9-A1N4-01A-11D-A14J-01 | Affymetrix SNP 6.0 | (TODO) -- GDC | CNV__snp6 |
| TCGA-E9-A1N5-01A-11D-A14F-01 | Affymetrix SNP 6.0 | (TODO) -- GDC | CNV__unfiltered__snp6 |
| TCGA-E9-A1N5-01A-11D-A14F-01 | Affymetrix SNP 6.0 | (TODO) -- GDC | CNV__snp6 |
| TCGA-E9-A1N6-01A-11D-A141-01 | Affymetrix SNP 6.0 | (TODO) -- GDC | CNV__unfiltered__snp6 |
| TCGA-E9-A1N6-01A-11D-A141-01 | Affymetrix SNP 6.0 | (TODO) -- GDC | CNV__snp6 |
| TCGA-E9-A1N8-01A-11D-A141-01 | Affymetrix SNP 6.0 | (TODO) -- GDC | CNV__unfiltered__snp6 |
| TCGA-E9-A1N8-01A-11D-A141-01 | Affymetrix SNP 6.0 | (TODO) -- GDC | CNV__snp6 |
| TCGA-E9-A1N9-01A-11D-A14F-01 | Affymetrix SNP 6.0 | (TODO) -- GDC | CNV__unfiltered__snp6 |
| TCGA-E9-A1N9-01A-11D-A14F-01 | Affymetrix SNP 6.0 | (TODO) -- GDC | CNV__snp6 |
| TCGA-E9-A1NA-01A-11D-A141-01 | Affymetrix SNP 6.0 | (TODO) -- GDC | CNV__unfiltered__snp6 |
| TCGA-E9-A1NA-01A-11D-A141-01 | Affymetrix SNP 6.0 | (TODO) -- GDC | CNV__snp6 |
| TCGA-E9-A1NC-01A-12D-A160-01 | Affymetrix SNP 6.0 | (TODO) -- GDC | CNV__unfiltered__snp6 |
| TCGA-E9-A1NC-01A-12D-A160-01 | Affymetrix SNP 6.0 | (TODO) -- GDC | CNV__snp6 |
| TCGA-E9-A1ND-01A-11D-A141-01 | Affymetrix SNP 6.0 | (TODO) -- GDC | CNV__unfiltered__snp6 |
| TCGA-E9-A1ND-01A-11D-A141-01 | Affymetrix SNP 6.0 | (TODO) -- GDC | CNV__snp6 |
| TCGA-E9-A1NE-01A-21D-A14J-01 | Affymetrix SNP 6.0 | (TODO) -- GDC | CNV__unfiltered__snp6 |
| TCGA-E9-A1NE-01A-21D-A14J-01 | Affymetrix SNP 6.0 | (TODO) -- GDC | CNV__snp6 |
| TCGA-E9-A1NF-01A-11D-A14F-01 | Affymetrix SNP 6.0 | (TODO) -- GDC | CNV__unfiltered__snp6 |
| TCGA-E9-A1NF-01A-11D-A14F-01 | Affymetrix SNP 6.0 | (TODO) -- GDC | CNV__snp6 |
| TCGA-E9-A1NG-01A-21D-A14J-01 | Affymetrix SNP 6.0 | (TODO) -- GDC | CNV__unfiltered__snp6 |
| TCGA-E9-A1NG-01A-21D-A14J-01 | Affymetrix SNP 6.0 | (TODO) -- GDC | CNV__snp6 |
| TCGA-E9-A1NH-01A-11D-A14F-01 | Affymetrix SNP 6.0 | (TODO) -- GDC | CNV__unfiltered__snp6 |
| TCGA-E9-A1NH-01A-11D-A14F-01 | Affymetrix SNP 6.0 | (TODO) -- GDC | CNV__snp6 |
| TCGA-E9-A1NI-01A-11D-A14F-01 | Affymetrix SNP 6.0 | (TODO) -- GDC | CNV__unfiltered__snp6 |
| TCGA-E9-A1NI-01A-11D-A14F-01 | Affymetrix SNP 6.0 | (TODO) -- GDC | CNV__snp6 |
| TCGA-E9-A1QZ-01A-21D-A166-01 | Affymetrix SNP 6.0 | (TODO) -- GDC | CNV__unfiltered__snp6 |
| TCGA-E9-A1QZ-01A-21D-A166-01 | Affymetrix SNP 6.0 | (TODO) -- GDC | CNV__snp6 |
| TCGA-E9-A1R0-01A-22D-A16C-01 | Affymetrix SNP 6.0 | (TODO) -- GDC | CNV__unfiltered__snp6 |
| TCGA-E9-A1R0-01A-22D-A16C-01 | Affymetrix SNP 6.0 | (TODO) -- GDC | CNV__snp6 |
| TCGA-E9-A1R2-01A-11D-A14F-01 | Affymetrix SNP 6.0 | (TODO) -- GDC | CNV__unfiltered__snp6 |
| TCGA-E9-A1R2-01A-11D-A14F-01 | Affymetrix SNP 6.0 | (TODO) -- GDC | CNV__snp6 |
| TCGA-E9-A1R3-01A-31D-A14J-01 | Affymetrix SNP 6.0 | (TODO) -- GDC | CNV__unfiltered__snp6 |
| TCGA-E9-A1R3-01A-31D-A14J-01 | Affymetrix SNP 6.0 | (TODO) -- GDC | CNV__snp6 |
| TCGA-E9-A1R4-01A-21D-A14F-01 | Affymetrix SNP 6.0 | (TODO) -- GDC | CNV__unfiltered__snp6 |
| TCGA-E9-A1R4-01A-21D-A14F-01 | Affymetrix SNP 6.0 | (TODO) -- GDC | CNV__snp6 |
| TCGA-E9-A1R5-01A-11D-A14J-01 | Affymetrix SNP 6.0 | (TODO) -- GDC | CNV__unfiltered__snp6 |
| TCGA-E9-A1R5-01A-11D-A14J-01 | Affymetrix SNP 6.0 | (TODO) -- GDC | CNV__snp6 |
| TCGA-E9-A1R6-01A-11D-A14F-01 | Affymetrix SNP 6.0 | (TODO) -- GDC | CNV__unfiltered__snp6 |
| TCGA-E9-A1R6-01A-11D-A14F-01 | Affymetrix SNP 6.0 | (TODO) -- GDC | CNV__snp6 |
| TCGA-E9-A1R7-01A-11D-A14J-01 | Affymetrix SNP 6.0 | (TODO) -- GDC | CNV__unfiltered__snp6 |
| TCGA-E9-A1R7-01A-11D-A14J-01 | Affymetrix SNP 6.0 | (TODO) -- GDC | CNV__snp6 |
| TCGA-E9-A1RA-01A-11D-A14F-01 | Affymetrix SNP 6.0 | (TODO) -- GDC | CNV__unfiltered__snp6 |
| TCGA-E9-A1RA-01A-11D-A14F-01 | Affymetrix SNP 6.0 | (TODO) -- GDC | CNV__snp6 |
| TCGA-E9-A1RB-01A-11D-A160-01 | Affymetrix SNP 6.0 | (TODO) -- GDC | CNV__unfiltered__snp6 |
| TCGA-E9-A1RB-01A-11D-A160-01 | Affymetrix SNP 6.0 | (TODO) -- GDC | CNV__snp6 |
| TCGA-E9-A1RC-01A-11D-A160-01 | Affymetrix SNP 6.0 | (TODO) -- GDC | CNV__unfiltered__snp6 |
| TCGA-E9-A1RC-01A-11D-A160-01 | Affymetrix SNP 6.0 | (TODO) -- GDC | CNV__snp6 |
| TCGA-E9-A1RD-01A-11D-A160-01 | Affymetrix SNP 6.0 | (TODO) -- GDC | CNV__unfiltered__snp6 |
| TCGA-E9-A1RD-01A-11D-A160-01 | Affymetrix SNP 6.0 | (TODO) -- GDC | CNV__snp6 |
| TCGA-E9-A1RE-01A-11D-A160-01 | Affymetrix SNP 6.0 | (TODO) -- GDC | CNV__unfiltered__snp6 |
| TCGA-E9-A1RE-01A-11D-A160-01 | Affymetrix SNP 6.0 | (TODO) -- GDC | CNV__snp6 |
| TCGA-E9-A1RF-01A-11D-A160-01 | Affymetrix SNP 6.0 | (TODO) -- GDC | CNV__unfiltered__snp6 |
| TCGA-E9-A1RF-01A-11D-A160-01 | Affymetrix SNP 6.0 | (TODO) -- GDC | CNV__snp6 |
| TCGA-E9-A1RG-01A-11D-A14F-01 | Affymetrix SNP 6.0 | (TODO) -- GDC | CNV__unfiltered__snp6 |
| TCGA-E9-A1RG-01A-11D-A14F-01 | Affymetrix SNP 6.0 | (TODO) -- GDC | CNV__snp6 |
| TCGA-E9-A1RH-01A-21D-A166-01 | Affymetrix SNP 6.0 | (TODO) -- GDC | CNV__unfiltered__snp6 |
| TCGA-E9-A1RH-01A-21D-A166-01 | Affymetrix SNP 6.0 | (TODO) -- GDC | CNV__snp6 |
| TCGA-E9-A1RI-01A-11D-A166-01 | Affymetrix SNP 6.0 | (TODO) -- GDC | CNV__unfiltered__snp6 |
| TCGA-E9-A1RI-01A-11D-A166-01 | Affymetrix SNP 6.0 | (TODO) -- GDC | CNV__snp6 |
| TCGA-E9-A226-01A-21D-A160-01 | Affymetrix SNP 6.0 | (TODO) -- GDC | CNV__unfiltered__snp6 |
| TCGA-E9-A226-01A-21D-A160-01 | Affymetrix SNP 6.0 | (TODO) -- GDC | CNV__snp6 |
| TCGA-E9-A227-01A-11D-A160-01 | Affymetrix SNP 6.0 | (TODO) -- GDC | CNV__unfiltered__snp6 |
| TCGA-E9-A227-01A-11D-A160-01 | Affymetrix SNP 6.0 | (TODO) -- GDC | CNV__snp6 |
| TCGA-E9-A228-01A-31D-A160-01 | Affymetrix SNP 6.0 | (TODO) -- GDC | CNV__unfiltered__snp6 |
| TCGA-E9-A228-01A-31D-A160-01 | Affymetrix SNP 6.0 | (TODO) -- GDC | CNV__snp6 |
| TCGA-E9-A229-01A-31D-A160-01 | Affymetrix SNP 6.0 | (TODO) -- GDC | CNV__unfiltered__snp6 |
| TCGA-E9-A229-01A-31D-A160-01 | Affymetrix SNP 6.0 | (TODO) -- GDC | CNV__snp6 |
| TCGA-E9-A22A-01A-11D-A160-01 | Affymetrix SNP 6.0 | (TODO) -- GDC | CNV__unfiltered__snp6 |
| TCGA-E9-A22A-01A-11D-A160-01 | Affymetrix SNP 6.0 | (TODO) -- GDC | CNV__snp6 |
| TCGA-E9-A22B-01A-11D-A160-01 | Affymetrix SNP 6.0 | (TODO) -- GDC | CNV__unfiltered__snp6 |
| TCGA-E9-A22B-01A-11D-A160-01 | Affymetrix SNP 6.0 | (TODO) -- GDC | CNV__snp6 |
| TCGA-E9-A22D-01A-11D-A160-01 | Affymetrix SNP 6.0 | (TODO) -- GDC | CNV__unfiltered__snp6 |
| TCGA-E9-A22D-01A-11D-A160-01 | Affymetrix SNP 6.0 | (TODO) -- GDC | CNV__snp6 |
| TCGA-E9-A22E-01A-11D-A160-01 | Affymetrix SNP 6.0 | (TODO) -- GDC | CNV__unfiltered__snp6 |
| TCGA-E9-A22E-01A-11D-A160-01 | Affymetrix SNP 6.0 | (TODO) -- GDC | CNV__snp6 |
| TCGA-E9-A22G-01A-11D-A160-01 | Affymetrix SNP 6.0 | (TODO) -- GDC | CNV__unfiltered__snp6 |
| TCGA-E9-A22G-01A-11D-A160-01 | Affymetrix SNP 6.0 | (TODO) -- GDC | CNV__snp6 |
| TCGA-E9-A22H-01A-11D-A160-01 | Affymetrix SNP 6.0 | (TODO) -- GDC | CNV__unfiltered__snp6 |
| TCGA-E9-A22H-01A-11D-A160-01 | Affymetrix SNP 6.0 | (TODO) -- GDC | CNV__snp6 |
| TCGA-E9-A243-01A-21D-A166-01 | Affymetrix SNP 6.0 | (TODO) -- GDC | CNV__unfiltered__snp6 |
| TCGA-E9-A243-01A-21D-A166-01 | Affymetrix SNP 6.0 | (TODO) -- GDC | CNV__snp6 |
| TCGA-E9-A244-01A-11D-A166-01 | Affymetrix SNP 6.0 | (TODO) -- GDC | CNV__unfiltered__snp6 |
| TCGA-E9-A244-01A-11D-A166-01 | Affymetrix SNP 6.0 | (TODO) -- GDC | CNV__snp6 |
| TCGA-E9-A245-01A-22D-A16C-01 | Affymetrix SNP 6.0 | (TODO) -- GDC | CNV__unfiltered__snp6 |
| TCGA-E9-A245-01A-22D-A16C-01 | Affymetrix SNP 6.0 | (TODO) -- GDC | CNV__snp6 |
| TCGA-E9-A247-01A-11D-A166-01 | Affymetrix SNP 6.0 | (TODO) -- GDC | CNV__unfiltered__snp6 |
| TCGA-E9-A247-01A-11D-A166-01 | Affymetrix SNP 6.0 | (TODO) -- GDC | CNV__snp6 |
| TCGA-E9-A248-01A-11D-A166-01 | Affymetrix SNP 6.0 | (TODO) -- GDC | CNV__unfiltered__snp6 |
| TCGA-E9-A248-01A-11D-A166-01 | Affymetrix SNP 6.0 | (TODO) -- GDC | CNV__snp6 |
| TCGA-E9-A249-01A-11D-A166-01 | Affymetrix SNP 6.0 | (TODO) -- GDC | CNV__unfiltered__snp6 |
| TCGA-E9-A249-01A-11D-A166-01 | Affymetrix SNP 6.0 | (TODO) -- GDC | CNV__snp6 |
| TCGA-E9-A24A-01A-11D-A166-01 | Affymetrix SNP 6.0 | (TODO) -- GDC | CNV__unfiltered__snp6 |
| TCGA-E9-A24A-01A-11D-A166-01 | Affymetrix SNP 6.0 | (TODO) -- GDC | CNV__snp6 |
| TCGA-E9-A295-01A-11D-A16C-01 | Affymetrix SNP 6.0 | (TODO) -- GDC | CNV__unfiltered__snp6 |
| TCGA-E9-A295-01A-11D-A16C-01 | Affymetrix SNP 6.0 | (TODO) -- GDC | CNV__snp6 |
| TCGA-E9-A2JS-01A-11D-A17U-01 | Affymetrix SNP 6.0 | (TODO) -- GDC | CNV__unfiltered__snp6 |
| TCGA-E9-A2JS-01A-11D-A17U-01 | Affymetrix SNP 6.0 | (TODO) -- GDC | CNV__snp6 |
| TCGA-E9-A2JT-01A-22D-A18N-01 | Affymetrix SNP 6.0 | (TODO) -- GDC | CNV__unfiltered__snp6 |
| TCGA-E9-A2JT-01A-22D-A18N-01 | Affymetrix SNP 6.0 | (TODO) -- GDC | CNV__snp6 |
| TCGA-E9-A3HO-01A-11D-A20R-01 | Affymetrix SNP 6.0 | (TODO) -- GDC | CNV__unfiltered__snp6 |
| TCGA-E9-A3HO-01A-11D-A20R-01 | Affymetrix SNP 6.0 | (TODO) -- GDC | CNV__snp6 |
| TCGA-E9-A3Q9-01A-11D-A21P-01 | Affymetrix SNP 6.0 | (TODO) -- GDC | CNV__unfiltered__snp6 |
| TCGA-E9-A3Q9-01A-11D-A21P-01 | Affymetrix SNP 6.0 | (TODO) -- GDC | CNV__snp6 |
| TCGA-E9-A3QA-01A-61D-A227-01 | Affymetrix SNP 6.0 | (TODO) -- GDC | CNV__unfiltered__snp6 |
| TCGA-E9-A3QA-01A-61D-A227-01 | Affymetrix SNP 6.0 | (TODO) -- GDC | CNV__snp6 |
| TCGA-E9-A3X8-01A-31D-A22W-01 | Affymetrix SNP 6.0 | (TODO) -- GDC | CNV__unfiltered__snp6 |
| TCGA-E9-A3X8-01A-31D-A22W-01 | Affymetrix SNP 6.0 | (TODO) -- GDC | CNV__snp6 |
| TCGA-E9-A54X-01A-11D-A25N-01 | Affymetrix SNP 6.0 | (TODO) -- GDC | CNV__unfiltered__snp6 |
| TCGA-E9-A54X-01A-11D-A25N-01 | Affymetrix SNP 6.0 | (TODO) -- GDC | CNV__snp6 |
| TCGA-E9-A54Y-01A-11D-A25N-01 | Affymetrix SNP 6.0 | (TODO) -- GDC | CNV__unfiltered__snp6 |
| TCGA-E9-A54Y-01A-11D-A25N-01 | Affymetrix SNP 6.0 | (TODO) -- GDC | CNV__snp6 |
| TCGA-E9-A5FK-01A-11D-A27O-01 | Affymetrix SNP 6.0 | (TODO) -- GDC | CNV__unfiltered__snp6 |
| TCGA-E9-A5FK-01A-11D-A27O-01 | Affymetrix SNP 6.0 | (TODO) -- GDC | CNV__snp6 |
| TCGA-E9-A5FL-01A-11D-A27O-01 | Affymetrix SNP 6.0 | (TODO) -- GDC | CNV__unfiltered__snp6 |
| TCGA-E9-A5FL-01A-11D-A27O-01 | Affymetrix SNP 6.0 | (TODO) -- GDC | CNV__snp6 |
| TCGA-E9-A5UO-01A-11D-A28A-01 | Affymetrix SNP 6.0 | (TODO) -- GDC | CNV__unfiltered__snp6 |
| TCGA-E9-A5UO-01A-11D-A28A-01 | Affymetrix SNP 6.0 | (TODO) -- GDC | CNV__snp6 |
| TCGA-E9-A5UP-01A-11D-A28A-01 | Affymetrix SNP 6.0 | (TODO) -- GDC | CNV__unfiltered__snp6 |
| TCGA-E9-A5UP-01A-11D-A28A-01 | Affymetrix SNP 6.0 | (TODO) -- GDC | CNV__snp6 |
| TCGA-E9-A6HE-01A-11D-A31T-01 | Affymetrix SNP 6.0 | (TODO) -- GDC | CNV__unfiltered__snp6 |
| TCGA-E9-A6HE-01A-11D-A31T-01 | Affymetrix SNP 6.0 | (TODO) -- GDC | CNV__snp6 |
| TCGA-EW-A1IW-01A-11D-A13J-01 | Affymetrix SNP 6.0 | (TODO) -- GDC | CNV__unfiltered__snp6 |
| TCGA-EW-A1IW-01A-11D-A13J-01 | Affymetrix SNP 6.0 | (TODO) -- GDC | CNV__snp6 |
| TCGA-EW-A1IX-01A-12D-A141-01 | Affymetrix SNP 6.0 | (TODO) -- GDC | CNV__unfiltered__snp6 |
| TCGA-EW-A1IX-01A-12D-A141-01 | Affymetrix SNP 6.0 | (TODO) -- GDC | CNV__snp6 |
| TCGA-EW-A1IY-01A-11D-A13J-01 | Affymetrix SNP 6.0 | (TODO) -- GDC | CNV__unfiltered__snp6 |
| TCGA-EW-A1IY-01A-11D-A13J-01 | Affymetrix SNP 6.0 | (TODO) -- GDC | CNV__snp6 |
| TCGA-EW-A1IZ-01A-11D-A13J-01 | Affymetrix SNP 6.0 | (TODO) -- GDC | CNV__unfiltered__snp6 |
| TCGA-EW-A1IZ-01A-11D-A13J-01 | Affymetrix SNP 6.0 | (TODO) -- GDC | CNV__snp6 |
| TCGA-EW-A1J1-01A-11D-A13J-01 | Affymetrix SNP 6.0 | (TODO) -- GDC | CNV__unfiltered__snp6 |
| TCGA-EW-A1J1-01A-11D-A13J-01 | Affymetrix SNP 6.0 | (TODO) -- GDC | CNV__snp6 |
| TCGA-EW-A1J2-01A-21D-A13J-01 | Affymetrix SNP 6.0 | (TODO) -- GDC | CNV__unfiltered__snp6 |
| TCGA-EW-A1J2-01A-21D-A13J-01 | Affymetrix SNP 6.0 | (TODO) -- GDC | CNV__snp6 |
| TCGA-EW-A1J3-01A-11D-A13J-01 | Affymetrix SNP 6.0 | (TODO) -- GDC | CNV__unfiltered__snp6 |
| TCGA-EW-A1J3-01A-11D-A13J-01 | Affymetrix SNP 6.0 | (TODO) -- GDC | CNV__snp6 |
| TCGA-EW-A1J5-01A-11D-A13J-01 | Affymetrix SNP 6.0 | (TODO) -- GDC | CNV__unfiltered__snp6 |
| TCGA-EW-A1J5-01A-11D-A13J-01 | Affymetrix SNP 6.0 | (TODO) -- GDC | CNV__snp6 |
| TCGA-EW-A1J6-01A-11D-A13J-01 | Affymetrix SNP 6.0 | (TODO) -- GDC | CNV__unfiltered__snp6 |
| TCGA-EW-A1J6-01A-11D-A13J-01 | Affymetrix SNP 6.0 | (TODO) -- GDC | CNV__snp6 |
| TCGA-EW-A1OV-01A-11D-A141-01 | Affymetrix SNP 6.0 | (TODO) -- GDC | CNV__unfiltered__snp6 |
| TCGA-EW-A1OV-01A-11D-A141-01 | Affymetrix SNP 6.0 | (TODO) -- GDC | CNV__snp6 |
| TCGA-EW-A1OW-01A-21D-A141-01 | Affymetrix SNP 6.0 | (TODO) -- GDC | CNV__unfiltered__snp6 |
| TCGA-EW-A1OW-01A-21D-A141-01 | Affymetrix SNP 6.0 | (TODO) -- GDC | CNV__snp6 |
| TCGA-EW-A1OX-01A-11D-A141-01 | Affymetrix SNP 6.0 | (TODO) -- GDC | CNV__unfiltered__snp6 |
| TCGA-EW-A1OX-01A-11D-A141-01 | Affymetrix SNP 6.0 | (TODO) -- GDC | CNV__snp6 |
| TCGA-EW-A1OY-01A-11D-A141-01 | Affymetrix SNP 6.0 | (TODO) -- GDC | CNV__unfiltered__snp6 |
| TCGA-EW-A1OY-01A-11D-A141-01 | Affymetrix SNP 6.0 | (TODO) -- GDC | CNV__snp6 |
| TCGA-EW-A1OZ-01A-11D-A141-01 | Affymetrix SNP 6.0 | (TODO) -- GDC | CNV__unfiltered__snp6 |
| TCGA-EW-A1OZ-01A-11D-A141-01 | Affymetrix SNP 6.0 | (TODO) -- GDC | CNV__snp6 |
| TCGA-EW-A1P0-01A-11D-A141-01 | Affymetrix SNP 6.0 | (TODO) -- GDC | CNV__unfiltered__snp6 |
| TCGA-EW-A1P0-01A-11D-A141-01 | Affymetrix SNP 6.0 | (TODO) -- GDC | CNV__snp6 |
| TCGA-EW-A1P1-01A-31D-A14F-01 | Affymetrix SNP 6.0 | (TODO) -- GDC | CNV__unfiltered__snp6 |
| TCGA-EW-A1P1-01A-31D-A14F-01 | Affymetrix SNP 6.0 | (TODO) -- GDC | CNV__snp6 |
| TCGA-EW-A1P3-01A-11D-A141-01 | Affymetrix SNP 6.0 | (TODO) -- GDC | CNV__unfiltered__snp6 |
| TCGA-EW-A1P3-01A-11D-A141-01 | Affymetrix SNP 6.0 | (TODO) -- GDC | CNV__snp6 |
| TCGA-EW-A1P4-01A-21D-A141-01 | Affymetrix SNP 6.0 | (TODO) -- GDC | CNV__unfiltered__snp6 |
| TCGA-EW-A1P4-01A-21D-A141-01 | Affymetrix SNP 6.0 | (TODO) -- GDC | CNV__snp6 |
| TCGA-EW-A1P5-01A-11D-A141-01 | Affymetrix SNP 6.0 | (TODO) -- GDC | CNV__unfiltered__snp6 |
| TCGA-EW-A1P5-01A-11D-A141-01 | Affymetrix SNP 6.0 | (TODO) -- GDC | CNV__snp6 |
| TCGA-EW-A1P6-01A-11D-A141-01 | Affymetrix SNP 6.0 | (TODO) -- GDC | CNV__unfiltered__snp6 |
| TCGA-EW-A1P6-01A-11D-A141-01 | Affymetrix SNP 6.0 | (TODO) -- GDC | CNV__snp6 |
| TCGA-EW-A1P7-01A-21D-A141-01 | Affymetrix SNP 6.0 | (TODO) -- GDC | CNV__unfiltered__snp6 |
| TCGA-EW-A1P7-01A-21D-A141-01 | Affymetrix SNP 6.0 | (TODO) -- GDC | CNV__snp6 |
| TCGA-EW-A1P8-01A-11D-A141-01 | Affymetrix SNP 6.0 | (TODO) -- GDC | CNV__unfiltered__snp6 |
| TCGA-EW-A1P8-01A-11D-A141-01 | Affymetrix SNP 6.0 | (TODO) -- GDC | CNV__snp6 |
| TCGA-EW-A1PA-01A-11D-A141-01 | Affymetrix SNP 6.0 | (TODO) -- GDC | CNV__unfiltered__snp6 |
| TCGA-EW-A1PA-01A-11D-A141-01 | Affymetrix SNP 6.0 | (TODO) -- GDC | CNV__snp6 |
| TCGA-EW-A1PB-01A-11D-A141-01 | Affymetrix SNP 6.0 | (TODO) -- GDC | CNV__unfiltered__snp6 |
| TCGA-EW-A1PB-01A-11D-A141-01 | Affymetrix SNP 6.0 | (TODO) -- GDC | CNV__snp6 |
| TCGA-EW-A1PC-01B-11D-A21P-01 | Affymetrix SNP 6.0 | (TODO) -- GDC | CNV__unfiltered__snp6 |
| TCGA-EW-A1PC-01B-11D-A21P-01 | Affymetrix SNP 6.0 | (TODO) -- GDC | CNV__snp6 |
| TCGA-EW-A1PD-01A-11D-A141-01 | Affymetrix SNP 6.0 | (TODO) -- GDC | CNV__unfiltered__snp6 |
| TCGA-EW-A1PD-01A-11D-A141-01 | Affymetrix SNP 6.0 | (TODO) -- GDC | CNV__snp6 |
| TCGA-EW-A1PE-01A-11D-A141-01 | Affymetrix SNP 6.0 | (TODO) -- GDC | CNV__unfiltered__snp6 |
| TCGA-EW-A1PE-01A-11D-A141-01 | Affymetrix SNP 6.0 | (TODO) -- GDC | CNV__snp6 |
| TCGA-EW-A1PF-01A-11D-A141-01 | Affymetrix SNP 6.0 | (TODO) -- GDC | CNV__unfiltered__snp6 |
| TCGA-EW-A1PF-01A-11D-A141-01 | Affymetrix SNP 6.0 | (TODO) -- GDC | CNV__snp6 |
| TCGA-EW-A1PG-01A-11D-A141-01 | Affymetrix SNP 6.0 | (TODO) -- GDC | CNV__unfiltered__snp6 |
| TCGA-EW-A1PG-01A-11D-A141-01 | Affymetrix SNP 6.0 | (TODO) -- GDC | CNV__snp6 |
| TCGA-EW-A1PH-01A-11D-A14J-01 | Affymetrix SNP 6.0 | (TODO) -- GDC | CNV__unfiltered__snp6 |
| TCGA-EW-A1PH-01A-11D-A14J-01 | Affymetrix SNP 6.0 | (TODO) -- GDC | CNV__snp6 |
| TCGA-EW-A2FR-01A-11D-A21P-01 | Affymetrix SNP 6.0 | (TODO) -- GDC | CNV__unfiltered__snp6 |
| TCGA-EW-A2FR-01A-11D-A21P-01 | Affymetrix SNP 6.0 | (TODO) -- GDC | CNV__snp6 |
| TCGA-EW-A2FS-01A-11D-A17C-01 | Affymetrix SNP 6.0 | (TODO) -- GDC | CNV__unfiltered__snp6 |
| TCGA-EW-A2FS-01A-11D-A17C-01 | Affymetrix SNP 6.0 | (TODO) -- GDC | CNV__snp6 |
| TCGA-EW-A2FV-01A-11D-A17C-01 | Affymetrix SNP 6.0 | (TODO) -- GDC | CNV__unfiltered__snp6 |
| TCGA-EW-A2FV-01A-11D-A17C-01 | Affymetrix SNP 6.0 | (TODO) -- GDC | CNV__snp6 |
| TCGA-EW-A2FW-01A-11D-A17C-01 | Affymetrix SNP 6.0 | (TODO) -- GDC | CNV__unfiltered__snp6 |
| TCGA-EW-A2FW-01A-11D-A17C-01 | Affymetrix SNP 6.0 | (TODO) -- GDC | CNV__snp6 |
| TCGA-EW-A3E8-01B-11D-A242-01 | Affymetrix SNP 6.0 | (TODO) -- GDC | CNV__unfiltered__snp6 |
| TCGA-EW-A3E8-01B-11D-A242-01 | Affymetrix SNP 6.0 | (TODO) -- GDC | CNV__snp6 |
| TCGA-EW-A3U0-01A-11D-A227-01 | Affymetrix SNP 6.0 | (TODO) -- GDC | CNV__unfiltered__snp6 |
| TCGA-EW-A3U0-01A-11D-A227-01 | Affymetrix SNP 6.0 | (TODO) -- GDC | CNV__snp6 |
| TCGA-EW-A423-01A-11D-A242-01 | Affymetrix SNP 6.0 | (TODO) -- GDC | CNV__unfiltered__snp6 |
| TCGA-EW-A423-01A-11D-A242-01 | Affymetrix SNP 6.0 | (TODO) -- GDC | CNV__snp6 |
| TCGA-EW-A424-01A-11D-A242-01 | Affymetrix SNP 6.0 | (TODO) -- GDC | CNV__unfiltered__snp6 |
| TCGA-EW-A424-01A-11D-A242-01 | Affymetrix SNP 6.0 | (TODO) -- GDC | CNV__snp6 |
| TCGA-EW-A6S9-01A-22D-A33D-01 | Affymetrix SNP 6.0 | (TODO) -- GDC | CNV__unfiltered__snp6 |
| TCGA-EW-A6S9-01A-22D-A33D-01 | Affymetrix SNP 6.0 | (TODO) -- GDC | CNV__snp6 |
| TCGA-EW-A6SA-01A-21D-A32H-01 | Affymetrix SNP 6.0 | (TODO) -- GDC | CNV__unfiltered__snp6 |
| TCGA-EW-A6SA-01A-21D-A32H-01 | Affymetrix SNP 6.0 | (TODO) -- GDC | CNV__snp6 |
| TCGA-EW-A6SB-01A-12D-A32H-01 | Affymetrix SNP 6.0 | (TODO) -- GDC | CNV__unfiltered__snp6 |
| TCGA-EW-A6SB-01A-12D-A32H-01 | Affymetrix SNP 6.0 | (TODO) -- GDC | CNV__snp6 |
| TCGA-EW-A6SC-01A-12D-A32H-01 | Affymetrix SNP 6.0 | (TODO) -- GDC | CNV__unfiltered__snp6 |
| TCGA-EW-A6SC-01A-12D-A32H-01 | Affymetrix SNP 6.0 | (TODO) -- GDC | CNV__snp6 |
| TCGA-EW-A6SD-01A-12D-A33D-01 | Affymetrix SNP 6.0 | (TODO) -- GDC | CNV__unfiltered__snp6 |
| TCGA-EW-A6SD-01A-12D-A33D-01 | Affymetrix SNP 6.0 | (TODO) -- GDC | CNV__snp6 |
| TCGA-GI-A2C8-01A-11D-A16C-01 | Affymetrix SNP 6.0 | (TODO) -- GDC | CNV__unfiltered__snp6 |
| TCGA-GI-A2C8-01A-11D-A16C-01 | Affymetrix SNP 6.0 | (TODO) -- GDC | CNV__snp6 |
| TCGA-GI-A2C9-01A-11D-A21P-01 | Affymetrix SNP 6.0 | (TODO) -- GDC | CNV__unfiltered__snp6 |
| TCGA-GI-A2C9-01A-11D-A21P-01 | Affymetrix SNP 6.0 | (TODO) -- GDC | CNV__snp6 |
| TCGA-GM-A2D9-01A-11D-A18N-01 | Affymetrix SNP 6.0 | (TODO) -- GDC | CNV__unfiltered__snp6 |
| TCGA-GM-A2D9-01A-11D-A18N-01 | Affymetrix SNP 6.0 | (TODO) -- GDC | CNV__snp6 |
| TCGA-GM-A2DA-01A-11D-A18N-01 | Affymetrix SNP 6.0 | (TODO) -- GDC | CNV__unfiltered__snp6 |
| TCGA-GM-A2DA-01A-11D-A18N-01 | Affymetrix SNP 6.0 | (TODO) -- GDC | CNV__snp6 |
| TCGA-GM-A2DB-01A-31D-A18N-01 | Affymetrix SNP 6.0 | (TODO) -- GDC | CNV__unfiltered__snp6 |
| TCGA-GM-A2DB-01A-31D-A18N-01 | Affymetrix SNP 6.0 | (TODO) -- GDC | CNV__snp6 |
| TCGA-GM-A2DC-01A-11D-A18N-01 | Affymetrix SNP 6.0 | (TODO) -- GDC | CNV__unfiltered__snp6 |
| TCGA-GM-A2DC-01A-11D-A18N-01 | Affymetrix SNP 6.0 | (TODO) -- GDC | CNV__snp6 |
| TCGA-GM-A2DD-01A-11D-A17U-01 | Affymetrix SNP 6.0 | (TODO) -- GDC | CNV__unfiltered__snp6 |
| TCGA-GM-A2DD-01A-11D-A17U-01 | Affymetrix SNP 6.0 | (TODO) -- GDC | CNV__snp6 |
| TCGA-GM-A2DF-01A-11D-A17U-01 | Affymetrix SNP 6.0 | (TODO) -- GDC | CNV__unfiltered__snp6 |
| TCGA-GM-A2DF-01A-11D-A17U-01 | Affymetrix SNP 6.0 | (TODO) -- GDC | CNV__snp6 |
| TCGA-GM-A2DH-01A-11D-A17U-01 | Affymetrix SNP 6.0 | (TODO) -- GDC | CNV__unfiltered__snp6 |
| TCGA-GM-A2DH-01A-11D-A17U-01 | Affymetrix SNP 6.0 | (TODO) -- GDC | CNV__snp6 |
| TCGA-GM-A2DI-01A-31D-A18N-01 | Affymetrix SNP 6.0 | (TODO) -- GDC | CNV__unfiltered__snp6 |
| TCGA-GM-A2DI-01A-31D-A18N-01 | Affymetrix SNP 6.0 | (TODO) -- GDC | CNV__snp6 |
| TCGA-GM-A2DK-01A-21D-A17U-01 | Affymetrix SNP 6.0 | (TODO) -- GDC | CNV__unfiltered__snp6 |
| TCGA-GM-A2DK-01A-21D-A17U-01 | Affymetrix SNP 6.0 | (TODO) -- GDC | CNV__snp6 |
| TCGA-GM-A2DL-01A-11D-A18N-01 | Affymetrix SNP 6.0 | (TODO) -- GDC | CNV__unfiltered__snp6 |
| TCGA-GM-A2DL-01A-11D-A18N-01 | Affymetrix SNP 6.0 | (TODO) -- GDC | CNV__snp6 |
| TCGA-GM-A2DM-01A-11D-A17U-01 | Affymetrix SNP 6.0 | (TODO) -- GDC | CNV__unfiltered__snp6 |
| TCGA-GM-A2DM-01A-11D-A17U-01 | Affymetrix SNP 6.0 | (TODO) -- GDC | CNV__snp6 |
| TCGA-GM-A2DN-01A-11D-A17U-01 | Affymetrix SNP 6.0 | (TODO) -- GDC | CNV__unfiltered__snp6 |
| TCGA-GM-A2DN-01A-11D-A17U-01 | Affymetrix SNP 6.0 | (TODO) -- GDC | CNV__snp6 |
| TCGA-GM-A2DO-01A-11D-A18N-01 | Affymetrix SNP 6.0 | (TODO) -- GDC | CNV__unfiltered__snp6 |
| TCGA-GM-A2DO-01A-11D-A18N-01 | Affymetrix SNP 6.0 | (TODO) -- GDC | CNV__snp6 |
| TCGA-GM-A3NW-01A-21D-A227-01 | Affymetrix SNP 6.0 | (TODO) -- GDC | CNV__unfiltered__snp6 |
| TCGA-GM-A3NW-01A-21D-A227-01 | Affymetrix SNP 6.0 | (TODO) -- GDC | CNV__snp6 |
| TCGA-GM-A3NY-01A-11D-A21P-01 | Affymetrix SNP 6.0 | (TODO) -- GDC | CNV__unfiltered__snp6 |
| TCGA-GM-A3NY-01A-11D-A21P-01 | Affymetrix SNP 6.0 | (TODO) -- GDC | CNV__snp6 |
| TCGA-GM-A3XG-01A-31D-A242-01 | Affymetrix SNP 6.0 | (TODO) -- GDC | CNV__unfiltered__snp6 |
| TCGA-GM-A3XG-01A-31D-A242-01 | Affymetrix SNP 6.0 | (TODO) -- GDC | CNV__snp6 |
| TCGA-GM-A3XL-01A-11D-A22W-01 | Affymetrix SNP 6.0 | (TODO) -- GDC | CNV__unfiltered__snp6 |
| TCGA-GM-A3XL-01A-11D-A22W-01 | Affymetrix SNP 6.0 | (TODO) -- GDC | CNV__snp6 |
| TCGA-GM-A3XN-01A-12D-A22W-01 | Affymetrix SNP 6.0 | (TODO) -- GDC | CNV__unfiltered__snp6 |
| TCGA-GM-A3XN-01A-12D-A22W-01 | Affymetrix SNP 6.0 | (TODO) -- GDC | CNV__snp6 |
| TCGA-GM-A4E0-01A-12D-A25N-01 | Affymetrix SNP 6.0 | (TODO) -- GDC | CNV__unfiltered__snp6 |
| TCGA-GM-A4E0-01A-12D-A25N-01 | Affymetrix SNP 6.0 | (TODO) -- GDC | CNV__snp6 |
| TCGA-GM-A5PV-01A-11D-A28A-01 | Affymetrix SNP 6.0 | (TODO) -- GDC | CNV__unfiltered__snp6 |
| TCGA-GM-A5PV-01A-11D-A28A-01 | Affymetrix SNP 6.0 | (TODO) -- GDC | CNV__snp6 |
| TCGA-GM-A5PX-01A-12D-A28A-01 | Affymetrix SNP 6.0 | (TODO) -- GDC | CNV__unfiltered__snp6 |
| TCGA-GM-A5PX-01A-12D-A28A-01 | Affymetrix SNP 6.0 | (TODO) -- GDC | CNV__snp6 |
| TCGA-HN-A2NL-01A-11D-A18N-01 | Affymetrix SNP 6.0 | (TODO) -- GDC | CNV__unfiltered__snp6 |
| TCGA-HN-A2NL-01A-11D-A18N-01 | Affymetrix SNP 6.0 | (TODO) -- GDC | CNV__snp6 |
| TCGA-HN-A2OB-01A-21D-A27O-01 | Affymetrix SNP 6.0 | (TODO) -- GDC | CNV__unfiltered__snp6 |
| TCGA-HN-A2OB-01A-21D-A27O-01 | Affymetrix SNP 6.0 | (TODO) -- GDC | CNV__snp6 |
| TCGA-JL-A3YW-01A-12D-A238-01 | Affymetrix SNP 6.0 | (TODO) -- GDC | CNV__unfiltered__snp6 |
| TCGA-JL-A3YW-01A-12D-A238-01 | Affymetrix SNP 6.0 | (TODO) -- GDC | CNV__snp6 |
| TCGA-JL-A3YX-01A-11D-A22W-01 | Affymetrix SNP 6.0 | (TODO) -- GDC | CNV__unfiltered__snp6 |
| TCGA-JL-A3YX-01A-11D-A22W-01 | Affymetrix SNP 6.0 | (TODO) -- GDC | CNV__snp6 |
| TCGA-LD-A66U-01A-11D-A31T-01 | Affymetrix SNP 6.0 | (TODO) -- GDC | CNV__unfiltered__snp6 |
| TCGA-LD-A66U-01A-11D-A31T-01 | Affymetrix SNP 6.0 | (TODO) -- GDC | CNV__snp6 |
| TCGA-LD-A74U-01A-13D-A33D-01 | Affymetrix SNP 6.0 | (TODO) -- GDC | CNV__unfiltered__snp6 |
| TCGA-LD-A74U-01A-13D-A33D-01 | Affymetrix SNP 6.0 | (TODO) -- GDC | CNV__snp6 |
| TCGA-LD-A7W5-01A-22D-A350-01 | Affymetrix SNP 6.0 | (TODO) -- GDC | CNV__unfiltered__snp6 |
| TCGA-LD-A7W5-01A-22D-A350-01 | Affymetrix SNP 6.0 | (TODO) -- GDC | CNV__snp6 |
| TCGA-LD-A7W6-01A-81D-A350-01 | Affymetrix SNP 6.0 | (TODO) -- GDC | CNV__unfiltered__snp6 |
| TCGA-LD-A7W6-01A-81D-A350-01 | Affymetrix SNP 6.0 | (TODO) -- GDC | CNV__snp6 |
| TCGA-LD-A9QF-01A-32D-A41E-01 | Affymetrix SNP 6.0 | (TODO) -- GDC | CNV__unfiltered__snp6 |
| TCGA-LD-A9QF-01A-32D-A41E-01 | Affymetrix SNP 6.0 | (TODO) -- GDC | CNV__snp6 |
| TCGA-LL-A440-01A-11D-A242-01 | Affymetrix SNP 6.0 | (TODO) -- GDC | CNV__unfiltered__snp6 |
| TCGA-LL-A440-01A-11D-A242-01 | Affymetrix SNP 6.0 | (TODO) -- GDC | CNV__snp6 |
| TCGA-LL-A441-01A-11D-A242-01 | Affymetrix SNP 6.0 | (TODO) -- GDC | CNV__unfiltered__snp6 |
| TCGA-LL-A441-01A-11D-A242-01 | Affymetrix SNP 6.0 | (TODO) -- GDC | CNV__snp6 |
| TCGA-LL-A442-01A-11D-A242-01 | Affymetrix SNP 6.0 | (TODO) -- GDC | CNV__unfiltered__snp6 |
| TCGA-LL-A442-01A-11D-A242-01 | Affymetrix SNP 6.0 | (TODO) -- GDC | CNV__snp6 |
| TCGA-LL-A50Y-01A-11D-A25N-01 | Affymetrix SNP 6.0 | (TODO) -- GDC | CNV__unfiltered__snp6 |
| TCGA-LL-A50Y-01A-11D-A25N-01 | Affymetrix SNP 6.0 | (TODO) -- GDC | CNV__snp6 |
| TCGA-LL-A5YL-01A-12D-A29M-01 | Affymetrix SNP 6.0 | (TODO) -- GDC | CNV__unfiltered__snp6 |
| TCGA-LL-A5YL-01A-12D-A29M-01 | Affymetrix SNP 6.0 | (TODO) -- GDC | CNV__snp6 |
| TCGA-LL-A5YM-01A-11D-A28A-01 | Affymetrix SNP 6.0 | (TODO) -- GDC | CNV__unfiltered__snp6 |
| TCGA-LL-A5YM-01A-11D-A28A-01 | Affymetrix SNP 6.0 | (TODO) -- GDC | CNV__snp6 |
| TCGA-LL-A5YN-01A-11D-A28A-01 | Affymetrix SNP 6.0 | (TODO) -- GDC | CNV__unfiltered__snp6 |
| TCGA-LL-A5YN-01A-11D-A28A-01 | Affymetrix SNP 6.0 | (TODO) -- GDC | CNV__snp6 |
| TCGA-LL-A5YO-01A-21D-A28A-01 | Affymetrix SNP 6.0 | (TODO) -- GDC | CNV__unfiltered__snp6 |
| TCGA-LL-A5YO-01A-21D-A28A-01 | Affymetrix SNP 6.0 | (TODO) -- GDC | CNV__snp6 |
| TCGA-LL-A5YP-01A-21D-A28A-01 | Affymetrix SNP 6.0 | (TODO) -- GDC | CNV__unfiltered__snp6 |
| TCGA-LL-A5YP-01A-21D-A28A-01 | Affymetrix SNP 6.0 | (TODO) -- GDC | CNV__snp6 |
| TCGA-LL-A6FP-01A-11D-A31T-01 | Affymetrix SNP 6.0 | (TODO) -- GDC | CNV__unfiltered__snp6 |
| TCGA-LL-A6FP-01A-11D-A31T-01 | Affymetrix SNP 6.0 | (TODO) -- GDC | CNV__snp6 |
| TCGA-LL-A6FQ-01A-11D-A31T-01 | Affymetrix SNP 6.0 | (TODO) -- GDC | CNV__unfiltered__snp6 |
| TCGA-LL-A6FQ-01A-11D-A31T-01 | Affymetrix SNP 6.0 | (TODO) -- GDC | CNV__snp6 |
| TCGA-LL-A6FR-01A-12D-A31T-01 | Affymetrix SNP 6.0 | (TODO) -- GDC | CNV__unfiltered__snp6 |
| TCGA-LL-A6FR-01A-12D-A31T-01 | Affymetrix SNP 6.0 | (TODO) -- GDC | CNV__snp6 |
| TCGA-LL-A73Y-01A-11D-A33D-01 | Affymetrix SNP 6.0 | (TODO) -- GDC | CNV__unfiltered__snp6 |
| TCGA-LL-A73Y-01A-11D-A33D-01 | Affymetrix SNP 6.0 | (TODO) -- GDC | CNV__snp6 |
| TCGA-LL-A73Z-01A-11D-A32H-01 | Affymetrix SNP 6.0 | (TODO) -- GDC | CNV__unfiltered__snp6 |
| TCGA-LL-A73Z-01A-11D-A32H-01 | Affymetrix SNP 6.0 | (TODO) -- GDC | CNV__snp6 |
| TCGA-LL-A740-01A-21D-A32H-01 | Affymetrix SNP 6.0 | (TODO) -- GDC | CNV__unfiltered__snp6 |
| TCGA-LL-A740-01A-21D-A32H-01 | Affymetrix SNP 6.0 | (TODO) -- GDC | CNV__snp6 |
| TCGA-LL-A7SZ-01A-32D-A350-01 | Affymetrix SNP 6.0 | (TODO) -- GDC | CNV__unfiltered__snp6 |
| TCGA-LL-A7SZ-01A-32D-A350-01 | Affymetrix SNP 6.0 | (TODO) -- GDC | CNV__snp6 |
| TCGA-LL-A7T0-01A-31D-A350-01 | Affymetrix SNP 6.0 | (TODO) -- GDC | CNV__unfiltered__snp6 |
| TCGA-LL-A7T0-01A-31D-A350-01 | Affymetrix SNP 6.0 | (TODO) -- GDC | CNV__snp6 |
| TCGA-LL-A8F5-01A-11D-A36I-01 | Affymetrix SNP 6.0 | (TODO) -- GDC | CNV__unfiltered__snp6 |
| TCGA-LL-A8F5-01A-11D-A36I-01 | Affymetrix SNP 6.0 | (TODO) -- GDC | CNV__snp6 |
| TCGA-LL-A9Q3-01A-11D-A41E-01 | Affymetrix SNP 6.0 | (TODO) -- GDC | CNV__unfiltered__snp6 |
| TCGA-LL-A9Q3-01A-11D-A41E-01 | Affymetrix SNP 6.0 | (TODO) -- GDC | CNV__snp6 |
| TCGA-LQ-A4E4-01A-11D-A25N-01 | Affymetrix SNP 6.0 | (TODO) -- GDC | CNV__unfiltered__snp6 |
| TCGA-LQ-A4E4-01A-11D-A25N-01 | Affymetrix SNP 6.0 | (TODO) -- GDC | CNV__snp6 |
| TCGA-MS-A51U-01A-31D-A25N-01 | Affymetrix SNP 6.0 | (TODO) -- GDC | CNV__unfiltered__snp6 |
| TCGA-MS-A51U-01A-31D-A25N-01 | Affymetrix SNP 6.0 | (TODO) -- GDC | CNV__snp6 |
| TCGA-OK-A5Q2-01A-11D-A27O-01 | Affymetrix SNP 6.0 | (TODO) -- GDC | CNV__unfiltered__snp6 |
| TCGA-OK-A5Q2-01A-11D-A27O-01 | Affymetrix SNP 6.0 | (TODO) -- GDC | CNV__snp6 |
| TCGA-OL-A5D6-01A-21D-A27O-01 | Affymetrix SNP 6.0 | (TODO) -- GDC | CNV__unfiltered__snp6 |
| TCGA-OL-A5D6-01A-21D-A27O-01 | Affymetrix SNP 6.0 | (TODO) -- GDC | CNV__snp6 |
| TCGA-OL-A5D7-01A-11D-A27O-01 | Affymetrix SNP 6.0 | (TODO) -- GDC | CNV__unfiltered__snp6 |
| TCGA-OL-A5D7-01A-11D-A27O-01 | Affymetrix SNP 6.0 | (TODO) -- GDC | CNV__snp6 |
| TCGA-OL-A5D8-01A-11D-A27O-01 | Affymetrix SNP 6.0 | (TODO) -- GDC | CNV__unfiltered__snp6 |
| TCGA-OL-A5D8-01A-11D-A27O-01 | Affymetrix SNP 6.0 | (TODO) -- GDC | CNV__snp6 |
| TCGA-OL-A5DA-01A-11D-A27O-01 | Affymetrix SNP 6.0 | (TODO) -- GDC | CNV__unfiltered__snp6 |
| TCGA-OL-A5DA-01A-11D-A27O-01 | Affymetrix SNP 6.0 | (TODO) -- GDC | CNV__snp6 |
| TCGA-OL-A5RU-01A-11D-A28A-01 | Affymetrix SNP 6.0 | (TODO) -- GDC | CNV__unfiltered__snp6 |
| TCGA-OL-A5RU-01A-11D-A28A-01 | Affymetrix SNP 6.0 | (TODO) -- GDC | CNV__snp6 |
| TCGA-OL-A5RV-01A-12D-A28A-01 | Affymetrix SNP 6.0 | (TODO) -- GDC | CNV__unfiltered__snp6 |
| TCGA-OL-A5RV-01A-12D-A28A-01 | Affymetrix SNP 6.0 | (TODO) -- GDC | CNV__snp6 |
| TCGA-OL-A5RW-01A-11D-A28A-01 | Affymetrix SNP 6.0 | (TODO) -- GDC | CNV__unfiltered__snp6 |
| TCGA-OL-A5RW-01A-11D-A28A-01 | Affymetrix SNP 6.0 | (TODO) -- GDC | CNV__snp6 |
| TCGA-OL-A5RX-01A-11D-A28A-01 | Affymetrix SNP 6.0 | (TODO) -- GDC | CNV__unfiltered__snp6 |
| TCGA-OL-A5RX-01A-11D-A28A-01 | Affymetrix SNP 6.0 | (TODO) -- GDC | CNV__snp6 |
| TCGA-OL-A5RY-01A-21D-A28A-01 | Affymetrix SNP 6.0 | (TODO) -- GDC | CNV__unfiltered__snp6 |
| TCGA-OL-A5RY-01A-21D-A28A-01 | Affymetrix SNP 6.0 | (TODO) -- GDC | CNV__snp6 |
| TCGA-OL-A5RZ-01A-11D-A28A-01 | Affymetrix SNP 6.0 | (TODO) -- GDC | CNV__unfiltered__snp6 |
| TCGA-OL-A5RZ-01A-11D-A28A-01 | Affymetrix SNP 6.0 | (TODO) -- GDC | CNV__snp6 |
| TCGA-OL-A5S0-01A-11D-A28A-01 | Affymetrix SNP 6.0 | (TODO) -- GDC | CNV__unfiltered__snp6 |
| TCGA-OL-A5S0-01A-11D-A28A-01 | Affymetrix SNP 6.0 | (TODO) -- GDC | CNV__snp6 |
| TCGA-OL-A66H-01A-11D-A29M-01 | Affymetrix SNP 6.0 | (TODO) -- GDC | CNV__unfiltered__snp6 |
| TCGA-OL-A66H-01A-11D-A29M-01 | Affymetrix SNP 6.0 | (TODO) -- GDC | CNV__snp6 |
| TCGA-OL-A66I-01A-21D-A29M-01 | Affymetrix SNP 6.0 | (TODO) -- GDC | CNV__unfiltered__snp6 |
| TCGA-OL-A66I-01A-21D-A29M-01 | Affymetrix SNP 6.0 | (TODO) -- GDC | CNV__snp6 |
| TCGA-OL-A66J-01A-11D-A29M-01 | Affymetrix SNP 6.0 | (TODO) -- GDC | CNV__unfiltered__snp6 |
| TCGA-OL-A66J-01A-11D-A29M-01 | Affymetrix SNP 6.0 | (TODO) -- GDC | CNV__snp6 |
| TCGA-OL-A66K-01A-11D-A29M-01 | Affymetrix SNP 6.0 | (TODO) -- GDC | CNV__unfiltered__snp6 |
| TCGA-OL-A66K-01A-11D-A29M-01 | Affymetrix SNP 6.0 | (TODO) -- GDC | CNV__snp6 |
| TCGA-OL-A66L-01A-12D-A31T-01 | Affymetrix SNP 6.0 | (TODO) -- GDC | CNV__unfiltered__snp6 |
| TCGA-OL-A66L-01A-12D-A31T-01 | Affymetrix SNP 6.0 | (TODO) -- GDC | CNV__snp6 |
| TCGA-OL-A66N-01A-12D-A31T-01 | Affymetrix SNP 6.0 | (TODO) -- GDC | CNV__unfiltered__snp6 |
| TCGA-OL-A66N-01A-12D-A31T-01 | Affymetrix SNP 6.0 | (TODO) -- GDC | CNV__snp6 |
| TCGA-OL-A66O-01A-11D-A31T-01 | Affymetrix SNP 6.0 | (TODO) -- GDC | CNV__unfiltered__snp6 |
| TCGA-OL-A66O-01A-11D-A31T-01 | Affymetrix SNP 6.0 | (TODO) -- GDC | CNV__snp6 |
| TCGA-OL-A66P-01A-11D-A31T-01 | Affymetrix SNP 6.0 | (TODO) -- GDC | CNV__unfiltered__snp6 |
| TCGA-OL-A66P-01A-11D-A31T-01 | Affymetrix SNP 6.0 | (TODO) -- GDC | CNV__snp6 |
| TCGA-OL-A6VO-01A-12D-A33D-01 | Affymetrix SNP 6.0 | (TODO) -- GDC | CNV__unfiltered__snp6 |
| TCGA-OL-A6VO-01A-12D-A33D-01 | Affymetrix SNP 6.0 | (TODO) -- GDC | CNV__snp6 |
| TCGA-OL-A6VQ-01A-12D-A41E-01 | Affymetrix SNP 6.0 | (TODO) -- GDC | CNV__unfiltered__snp6 |
| TCGA-OL-A6VQ-01A-12D-A41E-01 | Affymetrix SNP 6.0 | (TODO) -- GDC | CNV__snp6 |
| TCGA-OL-A6VR-01A-32D-A33D-01 | Affymetrix SNP 6.0 | (TODO) -- GDC | CNV__unfiltered__snp6 |
| TCGA-OL-A6VR-01A-32D-A33D-01 | Affymetrix SNP 6.0 | (TODO) -- GDC | CNV__snp6 |
| TCGA-OL-A97C-01A-32D-A41E-01 | Affymetrix SNP 6.0 | (TODO) -- GDC | CNV__unfiltered__snp6 |
| TCGA-OL-A97C-01A-32D-A41E-01 | Affymetrix SNP 6.0 | (TODO) -- GDC | CNV__snp6 |
| TCGA-PE-A5DC-01A-12D-A27O-01 | Affymetrix SNP 6.0 | (TODO) -- GDC | CNV__unfiltered__snp6 |
| TCGA-PE-A5DC-01A-12D-A27O-01 | Affymetrix SNP 6.0 | (TODO) -- GDC | CNV__snp6 |
| TCGA-PE-A5DD-01A-12D-A27O-01 | Affymetrix SNP 6.0 | (TODO) -- GDC | CNV__unfiltered__snp6 |
| TCGA-PE-A5DD-01A-12D-A27O-01 | Affymetrix SNP 6.0 | (TODO) -- GDC | CNV__snp6 |
| TCGA-PE-A5DE-01A-11D-A27O-01 | Affymetrix SNP 6.0 | (TODO) -- GDC | CNV__unfiltered__snp6 |
| TCGA-PE-A5DE-01A-11D-A27O-01 | Affymetrix SNP 6.0 | (TODO) -- GDC | CNV__snp6 |
| TCGA-S3-A6ZF-01A-32D-A32H-01 | Affymetrix SNP 6.0 | (TODO) -- GDC | CNV__unfiltered__snp6 |
| TCGA-S3-A6ZF-01A-32D-A32H-01 | Affymetrix SNP 6.0 | (TODO) -- GDC | CNV__snp6 |
| TCGA-S3-A6ZG-01A-22D-A32H-01 | Affymetrix SNP 6.0 | (TODO) -- GDC | CNV__unfiltered__snp6 |
| TCGA-S3-A6ZG-01A-22D-A32H-01 | Affymetrix SNP 6.0 | (TODO) -- GDC | CNV__snp6 |
| TCGA-S3-A6ZH-01A-22D-A32H-01 | Affymetrix SNP 6.0 | (TODO) -- GDC | CNV__unfiltered__snp6 |
| TCGA-S3-A6ZH-01A-22D-A32H-01 | Affymetrix SNP 6.0 | (TODO) -- GDC | CNV__snp6 |
| TCGA-S3-AA0Z-01A-11D-A41E-01 | Affymetrix SNP 6.0 | (TODO) -- GDC | CNV__unfiltered__snp6 |
| TCGA-S3-AA0Z-01A-11D-A41E-01 | Affymetrix SNP 6.0 | (TODO) -- GDC | CNV__snp6 |
| TCGA-S3-AA10-01A-21D-A41E-01 | Affymetrix SNP 6.0 | (TODO) -- GDC | CNV__unfiltered__snp6 |
| TCGA-S3-AA10-01A-21D-A41E-01 | Affymetrix SNP 6.0 | (TODO) -- GDC | CNV__snp6 |
| TCGA-S3-AA11-01A-31D-A41E-01 | Affymetrix SNP 6.0 | (TODO) -- GDC | CNV__unfiltered__snp6 |
| TCGA-S3-AA11-01A-31D-A41E-01 | Affymetrix SNP 6.0 | (TODO) -- GDC | CNV__snp6 |
| TCGA-S3-AA12-01A-11D-A41E-01 | Affymetrix SNP 6.0 | (TODO) -- GDC | CNV__unfiltered__snp6 |
| TCGA-S3-AA12-01A-11D-A41E-01 | Affymetrix SNP 6.0 | (TODO) -- GDC | CNV__snp6 |
| TCGA-S3-AA14-01A-11D-A41E-01 | Affymetrix SNP 6.0 | (TODO) -- GDC | CNV__unfiltered__snp6 |
| TCGA-S3-AA14-01A-11D-A41E-01 | Affymetrix SNP 6.0 | (TODO) -- GDC | CNV__snp6 |
| TCGA-S3-AA15-01A-11D-A41E-01 | Affymetrix SNP 6.0 | (TODO) -- GDC | CNV__unfiltered__snp6 |
| TCGA-S3-AA15-01A-11D-A41E-01 | Affymetrix SNP 6.0 | (TODO) -- GDC | CNV__snp6 |
| TCGA-S3-AA17-01A-11D-A41E-01 | Affymetrix SNP 6.0 | (TODO) -- GDC | CNV__unfiltered__snp6 |
| TCGA-S3-AA17-01A-11D-A41E-01 | Affymetrix SNP 6.0 | (TODO) -- GDC | CNV__snp6 |
| TCGA-UL-AAZ6-01A-11D-A41E-01 | Affymetrix SNP 6.0 | (TODO) -- GDC | CNV__unfiltered__snp6 |
| TCGA-UL-AAZ6-01A-11D-A41E-01 | Affymetrix SNP 6.0 | (TODO) -- GDC | CNV__snp6 |
| TCGA-UU-A93S-01A-21D-A41E-01 | Affymetrix SNP 6.0 | (TODO) -- GDC | CNV__unfiltered__snp6 |
| TCGA-UU-A93S-01A-21D-A41E-01 | Affymetrix SNP 6.0 | (TODO) -- GDC | CNV__snp6 |
| TCGA-V7-A7HQ-01A-11D-A33D-01 | Affymetrix SNP 6.0 | (TODO) -- GDC | CNV__unfiltered__snp6 |
| TCGA-V7-A7HQ-01A-11D-A33D-01 | Affymetrix SNP 6.0 | (TODO) -- GDC | CNV__snp6 |
| TCGA-W8-A86G-01A-21D-A36I-01 | Affymetrix SNP 6.0 | (TODO) -- GDC | CNV__unfiltered__snp6 |
| TCGA-W8-A86G-01A-21D-A36I-01 | Affymetrix SNP 6.0 | (TODO) -- GDC | CNV__snp6 |
| TCGA-WT-AB41-01A-11D-A41E-01 | Affymetrix SNP 6.0 | (TODO) -- GDC | CNV__unfiltered__snp6 |
| TCGA-WT-AB41-01A-11D-A41E-01 | Affymetrix SNP 6.0 | (TODO) -- GDC | CNV__snp6 |
| TCGA-WT-AB44-01A-11D-A41E-01 | Affymetrix SNP 6.0 | (TODO) -- GDC | CNV__unfiltered__snp6 |
| TCGA-WT-AB44-01A-11D-A41E-01 | Affymetrix SNP 6.0 | (TODO) -- GDC | CNV__snp6 |
| TCGA-XX-A899-01A-11D-A36I-01 | Affymetrix SNP 6.0 | (TODO) -- GDC | CNV__unfiltered__snp6 |
| TCGA-XX-A899-01A-11D-A36I-01 | Affymetrix SNP 6.0 | (TODO) -- GDC | CNV__snp6 |
| TCGA-XX-A89A-01A-11D-A36I-01 | Affymetrix SNP 6.0 | (TODO) -- GDC | CNV__unfiltered__snp6 |
| TCGA-XX-A89A-01A-11D-A36I-01 | Affymetrix SNP 6.0 | (TODO) -- GDC | CNV__snp6 |
| TCGA-Z7-A8R5-01A-42D-A41E-01 | Affymetrix SNP 6.0 | (TODO) -- GDC | CNV__unfiltered__snp6 |
| TCGA-Z7-A8R5-01A-42D-A41E-01 | Affymetrix SNP 6.0 | (TODO) -- GDC | CNV__snp6 |
| TCGA-Z7-A8R6-01A-11D-A41E-01 | Affymetrix SNP 6.0 | (TODO) -- GDC | CNV__unfiltered__snp6 |
| TCGA-Z7-A8R6-01A-11D-A41E-01 | Affymetrix SNP 6.0 | (TODO) -- GDC | CNV__snp6 |
Table S27.
| TCGA Barcode | Platform | Center | Annotation |
|---|---|---|---|
| TCGA-3C-AAAU-01A-11R-A41B-07 | (TODO) -- GDC | mRNA__geneExpNormed__FPKM | |
| TCGA-3C-AAAU-01A-11R-A41B-07 | (TODO) -- GDC | mRNA__geneExp__FPKM | |
| TCGA-3C-AAAU-01A-11R-A41B-07 | (TODO) -- GDC | mRNA__counts__FPKM | |
| TCGA-3C-AALI-01A-11R-A41B-07 | (TODO) -- GDC | mRNA__geneExpNormed__FPKM | |
| TCGA-3C-AALI-01A-11R-A41B-07 | (TODO) -- GDC | mRNA__geneExp__FPKM | |
| TCGA-3C-AALI-01A-11R-A41B-07 | (TODO) -- GDC | mRNA__counts__FPKM | |
| TCGA-3C-AALJ-01A-31R-A41B-07 | (TODO) -- GDC | mRNA__geneExpNormed__FPKM | |
| TCGA-3C-AALJ-01A-31R-A41B-07 | (TODO) -- GDC | mRNA__geneExp__FPKM | |
| TCGA-3C-AALJ-01A-31R-A41B-07 | (TODO) -- GDC | mRNA__counts__FPKM | |
| TCGA-3C-AALK-01A-11R-A41B-07 | (TODO) -- GDC | mRNA__geneExpNormed__FPKM | |
| TCGA-3C-AALK-01A-11R-A41B-07 | (TODO) -- GDC | mRNA__geneExp__FPKM | |
| TCGA-3C-AALK-01A-11R-A41B-07 | (TODO) -- GDC | mRNA__counts__FPKM | |
| TCGA-4H-AAAK-01A-12R-A41B-07 | (TODO) -- GDC | mRNA__geneExpNormed__FPKM | |
| TCGA-4H-AAAK-01A-12R-A41B-07 | (TODO) -- GDC | mRNA__geneExp__FPKM | |
| TCGA-4H-AAAK-01A-12R-A41B-07 | (TODO) -- GDC | mRNA__counts__FPKM | |
| TCGA-5L-AAT0-01A-12R-A41B-07 | (TODO) -- GDC | mRNA__geneExpNormed__FPKM | |
| TCGA-5L-AAT0-01A-12R-A41B-07 | (TODO) -- GDC | mRNA__geneExp__FPKM | |
| TCGA-5L-AAT0-01A-12R-A41B-07 | (TODO) -- GDC | mRNA__counts__FPKM | |
| TCGA-5L-AAT1-01A-12R-A41B-07 | (TODO) -- GDC | mRNA__geneExpNormed__FPKM | |
| TCGA-5L-AAT1-01A-12R-A41B-07 | (TODO) -- GDC | mRNA__geneExp__FPKM | |
| TCGA-5L-AAT1-01A-12R-A41B-07 | (TODO) -- GDC | mRNA__counts__FPKM | |
| TCGA-5T-A9QA-01A-11R-A41B-07 | (TODO) -- GDC | mRNA__geneExpNormed__FPKM | |
| TCGA-5T-A9QA-01A-11R-A41B-07 | (TODO) -- GDC | mRNA__geneExp__FPKM | |
| TCGA-5T-A9QA-01A-11R-A41B-07 | (TODO) -- GDC | mRNA__counts__FPKM | |
| TCGA-A1-A0SB-01A-11R-A144-07 | (TODO) -- GDC | mRNA__geneExpNormed__FPKM | |
| TCGA-A1-A0SB-01A-11R-A144-07 | (TODO) -- GDC | mRNA__geneExp__FPKM | |
| TCGA-A1-A0SB-01A-11R-A144-07 | (TODO) -- GDC | mRNA__counts__FPKM | |
| TCGA-A1-A0SD-01A-11R-A115-07 | (TODO) -- GDC | mRNA__geneExpNormed__FPKM | |
| TCGA-A1-A0SD-01A-11R-A115-07 | (TODO) -- GDC | mRNA__geneExp__FPKM | |
| TCGA-A1-A0SD-01A-11R-A115-07 | (TODO) -- GDC | mRNA__counts__FPKM | |
| TCGA-A1-A0SE-01A-11R-A084-07 | (TODO) -- GDC | mRNA__geneExpNormed__FPKM | |
| TCGA-A1-A0SE-01A-11R-A084-07 | (TODO) -- GDC | mRNA__geneExp__FPKM | |
| TCGA-A1-A0SE-01A-11R-A084-07 | (TODO) -- GDC | mRNA__counts__FPKM | |
| TCGA-A1-A0SF-01A-11R-A144-07 | (TODO) -- GDC | mRNA__geneExpNormed__FPKM | |
| TCGA-A1-A0SF-01A-11R-A144-07 | (TODO) -- GDC | mRNA__geneExp__FPKM | |
| TCGA-A1-A0SF-01A-11R-A144-07 | (TODO) -- GDC | mRNA__counts__FPKM | |
| TCGA-A1-A0SG-01A-11R-A144-07 | (TODO) -- GDC | mRNA__geneExpNormed__FPKM | |
| TCGA-A1-A0SG-01A-11R-A144-07 | (TODO) -- GDC | mRNA__geneExp__FPKM | |
| TCGA-A1-A0SG-01A-11R-A144-07 | (TODO) -- GDC | mRNA__counts__FPKM | |
| TCGA-A1-A0SH-01A-11R-A084-07 | (TODO) -- GDC | mRNA__geneExpNormed__FPKM | |
| TCGA-A1-A0SH-01A-11R-A084-07 | (TODO) -- GDC | mRNA__geneExp__FPKM | |
| TCGA-A1-A0SH-01A-11R-A084-07 | (TODO) -- GDC | mRNA__counts__FPKM | |
| TCGA-A1-A0SI-01A-11R-A144-07 | (TODO) -- GDC | mRNA__geneExpNormed__FPKM | |
| TCGA-A1-A0SI-01A-11R-A144-07 | (TODO) -- GDC | mRNA__geneExp__FPKM | |
| TCGA-A1-A0SI-01A-11R-A144-07 | (TODO) -- GDC | mRNA__counts__FPKM | |
| TCGA-A1-A0SJ-01A-11R-A084-07 | (TODO) -- GDC | mRNA__geneExpNormed__FPKM | |
| TCGA-A1-A0SJ-01A-11R-A084-07 | (TODO) -- GDC | mRNA__geneExp__FPKM | |
| TCGA-A1-A0SJ-01A-11R-A084-07 | (TODO) -- GDC | mRNA__counts__FPKM | |
| TCGA-A1-A0SK-01A-12R-A084-07 | (TODO) -- GDC | mRNA__geneExpNormed__FPKM | |
| TCGA-A1-A0SK-01A-12R-A084-07 | (TODO) -- GDC | mRNA__geneExp__FPKM | |
| TCGA-A1-A0SK-01A-12R-A084-07 | (TODO) -- GDC | mRNA__counts__FPKM | |
| TCGA-A1-A0SM-01A-11R-A084-07 | (TODO) -- GDC | mRNA__geneExpNormed__FPKM | |
| TCGA-A1-A0SM-01A-11R-A084-07 | (TODO) -- GDC | mRNA__geneExp__FPKM | |
| TCGA-A1-A0SM-01A-11R-A084-07 | (TODO) -- GDC | mRNA__counts__FPKM | |
| TCGA-A1-A0SN-01A-11R-A144-07 | (TODO) -- GDC | mRNA__geneExpNormed__FPKM | |
| TCGA-A1-A0SN-01A-11R-A144-07 | (TODO) -- GDC | mRNA__geneExp__FPKM | |
| TCGA-A1-A0SN-01A-11R-A144-07 | (TODO) -- GDC | mRNA__counts__FPKM | |
| TCGA-A1-A0SO-01A-22R-A084-07 | (TODO) -- GDC | mRNA__geneExpNormed__FPKM | |
| TCGA-A1-A0SO-01A-22R-A084-07 | (TODO) -- GDC | mRNA__geneExp__FPKM | |
| TCGA-A1-A0SO-01A-22R-A084-07 | (TODO) -- GDC | mRNA__counts__FPKM | |
| TCGA-A1-A0SP-01A-11R-A084-07 | (TODO) -- GDC | mRNA__geneExpNormed__FPKM | |
| TCGA-A1-A0SP-01A-11R-A084-07 | (TODO) -- GDC | mRNA__geneExp__FPKM | |
| TCGA-A1-A0SP-01A-11R-A084-07 | (TODO) -- GDC | mRNA__counts__FPKM | |
| TCGA-A1-A0SQ-01A-21R-A144-07 | (TODO) -- GDC | mRNA__geneExpNormed__FPKM | |
| TCGA-A1-A0SQ-01A-21R-A144-07 | (TODO) -- GDC | mRNA__geneExp__FPKM | |
| TCGA-A1-A0SQ-01A-21R-A144-07 | (TODO) -- GDC | mRNA__counts__FPKM | |
| TCGA-A2-A04N-01A-11R-A115-07 | (TODO) -- GDC | mRNA__geneExpNormed__FPKM | |
| TCGA-A2-A04N-01A-11R-A115-07 | (TODO) -- GDC | mRNA__geneExp__FPKM | |
| TCGA-A2-A04N-01A-11R-A115-07 | (TODO) -- GDC | mRNA__counts__FPKM | |
| TCGA-A2-A04P-01A-31R-A034-07 | (TODO) -- GDC | mRNA__geneExpNormed__FPKM | |
| TCGA-A2-A04P-01A-31R-A034-07 | (TODO) -- GDC | mRNA__geneExp__FPKM | |
| TCGA-A2-A04P-01A-31R-A034-07 | (TODO) -- GDC | mRNA__counts__FPKM | |
| TCGA-A2-A04Q-01A-21R-A034-07 | (TODO) -- GDC | mRNA__geneExpNormed__FPKM | |
| TCGA-A2-A04Q-01A-21R-A034-07 | (TODO) -- GDC | mRNA__geneExp__FPKM | |
| TCGA-A2-A04Q-01A-21R-A034-07 | (TODO) -- GDC | mRNA__counts__FPKM | |
| TCGA-A2-A04R-01A-41R-A109-07 | (TODO) -- GDC | mRNA__geneExpNormed__FPKM | |
| TCGA-A2-A04R-01A-41R-A109-07 | (TODO) -- GDC | mRNA__geneExp__FPKM | |
| TCGA-A2-A04R-01A-41R-A109-07 | (TODO) -- GDC | mRNA__counts__FPKM | |
| TCGA-A2-A04T-01A-21R-A034-07 | (TODO) -- GDC | mRNA__geneExpNormed__FPKM | |
| TCGA-A2-A04T-01A-21R-A034-07 | (TODO) -- GDC | mRNA__geneExp__FPKM | |
| TCGA-A2-A04T-01A-21R-A034-07 | (TODO) -- GDC | mRNA__counts__FPKM | |
| TCGA-A2-A04U-01A-11R-A115-07 | (TODO) -- GDC | mRNA__geneExpNormed__FPKM | |
| TCGA-A2-A04U-01A-11R-A115-07 | (TODO) -- GDC | mRNA__geneExp__FPKM | |
| TCGA-A2-A04U-01A-11R-A115-07 | (TODO) -- GDC | mRNA__counts__FPKM | |
| TCGA-A2-A04V-01A-21R-A034-07 | (TODO) -- GDC | mRNA__geneExpNormed__FPKM | |
| TCGA-A2-A04V-01A-21R-A034-07 | (TODO) -- GDC | mRNA__geneExp__FPKM | |
| TCGA-A2-A04V-01A-21R-A034-07 | (TODO) -- GDC | mRNA__counts__FPKM | |
| TCGA-A2-A04W-01A-31R-A115-07 | (TODO) -- GDC | mRNA__geneExpNormed__FPKM | |
| TCGA-A2-A04W-01A-31R-A115-07 | (TODO) -- GDC | mRNA__geneExp__FPKM | |
| TCGA-A2-A04W-01A-31R-A115-07 | (TODO) -- GDC | mRNA__counts__FPKM | |
| TCGA-A2-A04X-01A-21R-A034-07 | (TODO) -- GDC | mRNA__geneExpNormed__FPKM | |
| TCGA-A2-A04X-01A-21R-A034-07 | (TODO) -- GDC | mRNA__geneExp__FPKM | |
| TCGA-A2-A04X-01A-21R-A034-07 | (TODO) -- GDC | mRNA__counts__FPKM | |
| TCGA-A2-A04Y-01A-21R-A034-07 | (TODO) -- GDC | mRNA__geneExpNormed__FPKM | |
| TCGA-A2-A04Y-01A-21R-A034-07 | (TODO) -- GDC | mRNA__geneExp__FPKM | |
| TCGA-A2-A04Y-01A-21R-A034-07 | (TODO) -- GDC | mRNA__counts__FPKM | |
| TCGA-A2-A0CK-01A-11R-A22K-07 | (TODO) -- GDC | mRNA__geneExpNormed__FPKM | |
| TCGA-A2-A0CK-01A-11R-A22K-07 | (TODO) -- GDC | mRNA__geneExp__FPKM | |
| TCGA-A2-A0CK-01A-11R-A22K-07 | (TODO) -- GDC | mRNA__counts__FPKM | |
| TCGA-A2-A0CL-01A-11R-A115-07 | (TODO) -- GDC | mRNA__geneExpNormed__FPKM | |
| TCGA-A2-A0CL-01A-11R-A115-07 | (TODO) -- GDC | mRNA__geneExp__FPKM | |
| TCGA-A2-A0CL-01A-11R-A115-07 | (TODO) -- GDC | mRNA__counts__FPKM | |
| TCGA-A2-A0CM-01A-31R-A034-07 | (TODO) -- GDC | mRNA__geneExpNormed__FPKM | |
| TCGA-A2-A0CM-01A-31R-A034-07 | (TODO) -- GDC | mRNA__geneExp__FPKM | |
| TCGA-A2-A0CM-01A-31R-A034-07 | (TODO) -- GDC | mRNA__counts__FPKM | |
| TCGA-A2-A0CO-01A-13R-A22K-07 | (TODO) -- GDC | mRNA__geneExpNormed__FPKM | |
| TCGA-A2-A0CO-01A-13R-A22K-07 | (TODO) -- GDC | mRNA__geneExp__FPKM | |
| TCGA-A2-A0CO-01A-13R-A22K-07 | (TODO) -- GDC | mRNA__counts__FPKM | |
| TCGA-A2-A0CP-01A-11R-A034-07 | (TODO) -- GDC | mRNA__geneExpNormed__FPKM | |
| TCGA-A2-A0CP-01A-11R-A034-07 | (TODO) -- GDC | mRNA__geneExp__FPKM | |
| TCGA-A2-A0CP-01A-11R-A034-07 | (TODO) -- GDC | mRNA__counts__FPKM | |
| TCGA-A2-A0CQ-01A-21R-A034-07 | (TODO) -- GDC | mRNA__geneExpNormed__FPKM | |
| TCGA-A2-A0CQ-01A-21R-A034-07 | (TODO) -- GDC | mRNA__geneExp__FPKM | |
| TCGA-A2-A0CQ-01A-21R-A034-07 | (TODO) -- GDC | mRNA__counts__FPKM | |
| TCGA-A2-A0CR-01A-11R-A22K-07 | (TODO) -- GDC | mRNA__geneExpNormed__FPKM | |
| TCGA-A2-A0CR-01A-11R-A22K-07 | (TODO) -- GDC | mRNA__geneExp__FPKM | |
| TCGA-A2-A0CR-01A-11R-A22K-07 | (TODO) -- GDC | mRNA__counts__FPKM | |
| TCGA-A2-A0CS-01A-11R-A115-07 | (TODO) -- GDC | mRNA__geneExpNormed__FPKM | |
| TCGA-A2-A0CS-01A-11R-A115-07 | (TODO) -- GDC | mRNA__geneExp__FPKM | |
| TCGA-A2-A0CS-01A-11R-A115-07 | (TODO) -- GDC | mRNA__counts__FPKM | |
| TCGA-A2-A0CT-01A-31R-A056-07 | (TODO) -- GDC | mRNA__geneExpNormed__FPKM | |
| TCGA-A2-A0CT-01A-31R-A056-07 | (TODO) -- GDC | mRNA__geneExp__FPKM | |
| TCGA-A2-A0CT-01A-31R-A056-07 | (TODO) -- GDC | mRNA__counts__FPKM | |
| TCGA-A2-A0CU-01A-12R-A034-07 | (TODO) -- GDC | mRNA__geneExpNormed__FPKM | |
| TCGA-A2-A0CU-01A-12R-A034-07 | (TODO) -- GDC | mRNA__geneExp__FPKM | |
| TCGA-A2-A0CU-01A-12R-A034-07 | (TODO) -- GDC | mRNA__counts__FPKM | |
| TCGA-A2-A0CV-01A-31R-A115-07 | (TODO) -- GDC | mRNA__geneExpNormed__FPKM | |
| TCGA-A2-A0CV-01A-31R-A115-07 | (TODO) -- GDC | mRNA__geneExp__FPKM | |
| TCGA-A2-A0CV-01A-31R-A115-07 | (TODO) -- GDC | mRNA__counts__FPKM | |
| TCGA-A2-A0CW-01A-21R-A115-07 | (TODO) -- GDC | mRNA__geneExpNormed__FPKM | |
| TCGA-A2-A0CW-01A-21R-A115-07 | (TODO) -- GDC | mRNA__geneExp__FPKM | |
| TCGA-A2-A0CW-01A-21R-A115-07 | (TODO) -- GDC | mRNA__counts__FPKM | |
| TCGA-A2-A0CX-01A-21R-A00Z-07 | (TODO) -- GDC | mRNA__geneExpNormed__FPKM | |
| TCGA-A2-A0CX-01A-21R-A00Z-07 | (TODO) -- GDC | mRNA__geneExp__FPKM | |
| TCGA-A2-A0CX-01A-21R-A00Z-07 | (TODO) -- GDC | mRNA__counts__FPKM | |
| TCGA-A2-A0CY-01A-12R-A034-07 | (TODO) -- GDC | mRNA__geneExpNormed__FPKM | |
| TCGA-A2-A0CY-01A-12R-A034-07 | (TODO) -- GDC | mRNA__geneExp__FPKM | |
| TCGA-A2-A0CY-01A-12R-A034-07 | (TODO) -- GDC | mRNA__counts__FPKM | |
| TCGA-A2-A0CZ-01A-11R-A034-07 | (TODO) -- GDC | mRNA__geneExpNormed__FPKM | |
| TCGA-A2-A0CZ-01A-11R-A034-07 | (TODO) -- GDC | mRNA__geneExp__FPKM | |
| TCGA-A2-A0CZ-01A-11R-A034-07 | (TODO) -- GDC | mRNA__counts__FPKM | |
| TCGA-A2-A0D0-01A-11R-A00Z-07 | (TODO) -- GDC | mRNA__geneExpNormed__FPKM | |
| TCGA-A2-A0D0-01A-11R-A00Z-07 | (TODO) -- GDC | mRNA__geneExp__FPKM | |
| TCGA-A2-A0D0-01A-11R-A00Z-07 | (TODO) -- GDC | mRNA__counts__FPKM | |
| TCGA-A2-A0D1-01A-11R-A034-07 | (TODO) -- GDC | mRNA__geneExpNormed__FPKM | |
| TCGA-A2-A0D1-01A-11R-A034-07 | (TODO) -- GDC | mRNA__geneExp__FPKM | |
| TCGA-A2-A0D1-01A-11R-A034-07 | (TODO) -- GDC | mRNA__counts__FPKM | |
| TCGA-A2-A0D2-01A-21R-A034-07 | (TODO) -- GDC | mRNA__geneExpNormed__FPKM | |
| TCGA-A2-A0D2-01A-21R-A034-07 | (TODO) -- GDC | mRNA__geneExp__FPKM | |
| TCGA-A2-A0D2-01A-21R-A034-07 | (TODO) -- GDC | mRNA__counts__FPKM | |
| TCGA-A2-A0D3-01A-11R-A115-07 | (TODO) -- GDC | mRNA__geneExpNormed__FPKM | |
| TCGA-A2-A0D3-01A-11R-A115-07 | (TODO) -- GDC | mRNA__geneExp__FPKM | |
| TCGA-A2-A0D3-01A-11R-A115-07 | (TODO) -- GDC | mRNA__counts__FPKM | |
| TCGA-A2-A0D4-01A-11R-A00Z-07 | (TODO) -- GDC | mRNA__geneExpNormed__FPKM | |
| TCGA-A2-A0D4-01A-11R-A00Z-07 | (TODO) -- GDC | mRNA__geneExp__FPKM | |
| TCGA-A2-A0D4-01A-11R-A00Z-07 | (TODO) -- GDC | mRNA__counts__FPKM | |
| TCGA-A2-A0EM-01A-11R-A034-07 | (TODO) -- GDC | mRNA__geneExpNormed__FPKM | |
| TCGA-A2-A0EM-01A-11R-A034-07 | (TODO) -- GDC | mRNA__geneExp__FPKM | |
| TCGA-A2-A0EM-01A-11R-A034-07 | (TODO) -- GDC | mRNA__counts__FPKM | |
| TCGA-A2-A0EN-01A-13R-A084-07 | (TODO) -- GDC | mRNA__geneExpNormed__FPKM | |
| TCGA-A2-A0EN-01A-13R-A084-07 | (TODO) -- GDC | mRNA__geneExp__FPKM | |
| TCGA-A2-A0EN-01A-13R-A084-07 | (TODO) -- GDC | mRNA__counts__FPKM | |
| TCGA-A2-A0EO-01A-11R-A034-07 | (TODO) -- GDC | mRNA__geneExpNormed__FPKM | |
| TCGA-A2-A0EO-01A-11R-A034-07 | (TODO) -- GDC | mRNA__geneExp__FPKM | |
| TCGA-A2-A0EO-01A-11R-A034-07 | (TODO) -- GDC | mRNA__counts__FPKM | |
| TCGA-A2-A0EP-01A-52R-A22U-07 | (TODO) -- GDC | mRNA__geneExpNormed__FPKM | |
| TCGA-A2-A0EP-01A-52R-A22U-07 | (TODO) -- GDC | mRNA__geneExp__FPKM | |
| TCGA-A2-A0EP-01A-52R-A22U-07 | (TODO) -- GDC | mRNA__counts__FPKM | |
| TCGA-A2-A0EQ-01A-11R-A034-07 | (TODO) -- GDC | mRNA__geneExpNormed__FPKM | |
| TCGA-A2-A0EQ-01A-11R-A034-07 | (TODO) -- GDC | mRNA__geneExp__FPKM | |
| TCGA-A2-A0EQ-01A-11R-A034-07 | (TODO) -- GDC | mRNA__counts__FPKM | |
| TCGA-A2-A0ER-01A-21R-A034-07 | (TODO) -- GDC | mRNA__geneExpNormed__FPKM | |
| TCGA-A2-A0ER-01A-21R-A034-07 | (TODO) -- GDC | mRNA__geneExp__FPKM | |
| TCGA-A2-A0ER-01A-21R-A034-07 | (TODO) -- GDC | mRNA__counts__FPKM | |
| TCGA-A2-A0ES-01A-11R-A115-07 | (TODO) -- GDC | mRNA__geneExpNormed__FPKM | |
| TCGA-A2-A0ES-01A-11R-A115-07 | (TODO) -- GDC | mRNA__geneExp__FPKM | |
| TCGA-A2-A0ES-01A-11R-A115-07 | (TODO) -- GDC | mRNA__counts__FPKM | |
| TCGA-A2-A0ET-01A-31R-A034-07 | (TODO) -- GDC | mRNA__geneExpNormed__FPKM | |
| TCGA-A2-A0ET-01A-31R-A034-07 | (TODO) -- GDC | mRNA__geneExp__FPKM | |
| TCGA-A2-A0ET-01A-31R-A034-07 | (TODO) -- GDC | mRNA__counts__FPKM | |
| TCGA-A2-A0EU-01A-22R-A056-07 | (TODO) -- GDC | mRNA__geneExpNormed__FPKM | |
| TCGA-A2-A0EU-01A-22R-A056-07 | (TODO) -- GDC | mRNA__geneExp__FPKM | |
| TCGA-A2-A0EU-01A-22R-A056-07 | (TODO) -- GDC | mRNA__counts__FPKM | |
| TCGA-A2-A0EV-01A-11R-A034-07 | (TODO) -- GDC | mRNA__geneExpNormed__FPKM | |
| TCGA-A2-A0EV-01A-11R-A034-07 | (TODO) -- GDC | mRNA__geneExp__FPKM | |
| TCGA-A2-A0EV-01A-11R-A034-07 | (TODO) -- GDC | mRNA__counts__FPKM | |
| TCGA-A2-A0EW-01A-21R-A115-07 | (TODO) -- GDC | mRNA__geneExpNormed__FPKM | |
| TCGA-A2-A0EW-01A-21R-A115-07 | (TODO) -- GDC | mRNA__geneExp__FPKM | |
| TCGA-A2-A0EW-01A-21R-A115-07 | (TODO) -- GDC | mRNA__counts__FPKM | |
| TCGA-A2-A0EX-01A-21R-A034-07 | (TODO) -- GDC | mRNA__geneExpNormed__FPKM | |
| TCGA-A2-A0EX-01A-21R-A034-07 | (TODO) -- GDC | mRNA__geneExp__FPKM | |
| TCGA-A2-A0EX-01A-21R-A034-07 | (TODO) -- GDC | mRNA__counts__FPKM | |
| TCGA-A2-A0EY-01A-11R-A034-07 | (TODO) -- GDC | mRNA__geneExpNormed__FPKM | |
| TCGA-A2-A0EY-01A-11R-A034-07 | (TODO) -- GDC | mRNA__geneExp__FPKM | |
| TCGA-A2-A0EY-01A-11R-A034-07 | (TODO) -- GDC | mRNA__counts__FPKM | |
| TCGA-A2-A0ST-01A-12R-A084-07 | (TODO) -- GDC | mRNA__geneExpNormed__FPKM | |
| TCGA-A2-A0ST-01A-12R-A084-07 | (TODO) -- GDC | mRNA__geneExp__FPKM | |
| TCGA-A2-A0ST-01A-12R-A084-07 | (TODO) -- GDC | mRNA__counts__FPKM | |
| TCGA-A2-A0SU-01A-11R-A084-07 | (TODO) -- GDC | mRNA__geneExpNormed__FPKM | |
| TCGA-A2-A0SU-01A-11R-A084-07 | (TODO) -- GDC | mRNA__geneExp__FPKM | |
| TCGA-A2-A0SU-01A-11R-A084-07 | (TODO) -- GDC | mRNA__counts__FPKM | |
| TCGA-A2-A0SV-01A-11R-A084-07 | (TODO) -- GDC | mRNA__geneExpNormed__FPKM | |
| TCGA-A2-A0SV-01A-11R-A084-07 | (TODO) -- GDC | mRNA__geneExp__FPKM | |
| TCGA-A2-A0SV-01A-11R-A084-07 | (TODO) -- GDC | mRNA__counts__FPKM | |
| TCGA-A2-A0SW-01A-11R-A084-07 | (TODO) -- GDC | mRNA__geneExpNormed__FPKM | |
| TCGA-A2-A0SW-01A-11R-A084-07 | (TODO) -- GDC | mRNA__geneExp__FPKM | |
| TCGA-A2-A0SW-01A-11R-A084-07 | (TODO) -- GDC | mRNA__counts__FPKM | |
| TCGA-A2-A0SX-01A-12R-A084-07 | (TODO) -- GDC | mRNA__geneExpNormed__FPKM | |
| TCGA-A2-A0SX-01A-12R-A084-07 | (TODO) -- GDC | mRNA__geneExp__FPKM | |
| TCGA-A2-A0SX-01A-12R-A084-07 | (TODO) -- GDC | mRNA__counts__FPKM | |
| TCGA-A2-A0SY-01A-31R-A084-07 | (TODO) -- GDC | mRNA__geneExpNormed__FPKM | |
| TCGA-A2-A0SY-01A-31R-A084-07 | (TODO) -- GDC | mRNA__geneExp__FPKM | |
| TCGA-A2-A0SY-01A-31R-A084-07 | (TODO) -- GDC | mRNA__counts__FPKM | |
| TCGA-A2-A0T0-01A-22R-A084-07 | (TODO) -- GDC | mRNA__geneExpNormed__FPKM | |
| TCGA-A2-A0T0-01A-22R-A084-07 | (TODO) -- GDC | mRNA__geneExp__FPKM | |
| TCGA-A2-A0T0-01A-22R-A084-07 | (TODO) -- GDC | mRNA__counts__FPKM | |
| TCGA-A2-A0T1-01A-21R-A084-07 | (TODO) -- GDC | mRNA__geneExpNormed__FPKM | |
| TCGA-A2-A0T1-01A-21R-A084-07 | (TODO) -- GDC | mRNA__geneExp__FPKM | |
| TCGA-A2-A0T1-01A-21R-A084-07 | (TODO) -- GDC | mRNA__counts__FPKM | |
| TCGA-A2-A0T2-01A-11R-A084-07 | (TODO) -- GDC | mRNA__geneExpNormed__FPKM | |
| TCGA-A2-A0T2-01A-11R-A084-07 | (TODO) -- GDC | mRNA__geneExp__FPKM | |
| TCGA-A2-A0T2-01A-11R-A084-07 | (TODO) -- GDC | mRNA__counts__FPKM | |
| TCGA-A2-A0T3-01A-21R-A115-07 | (TODO) -- GDC | mRNA__geneExpNormed__FPKM | |
| TCGA-A2-A0T3-01A-21R-A115-07 | (TODO) -- GDC | mRNA__geneExp__FPKM | |
| TCGA-A2-A0T3-01A-21R-A115-07 | (TODO) -- GDC | mRNA__counts__FPKM | |
| TCGA-A2-A0T4-01A-31R-A084-07 | (TODO) -- GDC | mRNA__geneExpNormed__FPKM | |
| TCGA-A2-A0T4-01A-31R-A084-07 | (TODO) -- GDC | mRNA__geneExp__FPKM | |
| TCGA-A2-A0T4-01A-31R-A084-07 | (TODO) -- GDC | mRNA__counts__FPKM | |
| TCGA-A2-A0T5-01A-21R-A084-07 | (TODO) -- GDC | mRNA__geneExpNormed__FPKM | |
| TCGA-A2-A0T5-01A-21R-A084-07 | (TODO) -- GDC | mRNA__geneExp__FPKM | |
| TCGA-A2-A0T5-01A-21R-A084-07 | (TODO) -- GDC | mRNA__counts__FPKM | |
| TCGA-A2-A0T6-01A-11R-A084-07 | (TODO) -- GDC | mRNA__geneExpNormed__FPKM | |
| TCGA-A2-A0T6-01A-11R-A084-07 | (TODO) -- GDC | mRNA__geneExp__FPKM | |
| TCGA-A2-A0T6-01A-11R-A084-07 | (TODO) -- GDC | mRNA__counts__FPKM | |
| TCGA-A2-A0T7-01A-21R-A084-07 | (TODO) -- GDC | mRNA__geneExpNormed__FPKM | |
| TCGA-A2-A0T7-01A-21R-A084-07 | (TODO) -- GDC | mRNA__geneExp__FPKM | |
| TCGA-A2-A0T7-01A-21R-A084-07 | (TODO) -- GDC | mRNA__counts__FPKM | |
| TCGA-A2-A0YC-01A-11R-A109-07 | (TODO) -- GDC | mRNA__geneExpNormed__FPKM | |
| TCGA-A2-A0YC-01A-11R-A109-07 | (TODO) -- GDC | mRNA__geneExp__FPKM | |
| TCGA-A2-A0YC-01A-11R-A109-07 | (TODO) -- GDC | mRNA__counts__FPKM | |
| TCGA-A2-A0YD-01A-11R-A109-07 | (TODO) -- GDC | mRNA__geneExpNormed__FPKM | |
| TCGA-A2-A0YD-01A-11R-A109-07 | (TODO) -- GDC | mRNA__geneExp__FPKM | |
| TCGA-A2-A0YD-01A-11R-A109-07 | (TODO) -- GDC | mRNA__counts__FPKM | |
| TCGA-A2-A0YE-01A-11R-A109-07 | (TODO) -- GDC | mRNA__geneExpNormed__FPKM | |
| TCGA-A2-A0YE-01A-11R-A109-07 | (TODO) -- GDC | mRNA__geneExp__FPKM | |
| TCGA-A2-A0YE-01A-11R-A109-07 | (TODO) -- GDC | mRNA__counts__FPKM | |
| TCGA-A2-A0YF-01A-21R-A109-07 | (TODO) -- GDC | mRNA__geneExpNormed__FPKM | |
| TCGA-A2-A0YF-01A-21R-A109-07 | (TODO) -- GDC | mRNA__geneExp__FPKM | |
| TCGA-A2-A0YF-01A-21R-A109-07 | (TODO) -- GDC | mRNA__counts__FPKM | |
| TCGA-A2-A0YG-01A-21R-A109-07 | (TODO) -- GDC | mRNA__geneExpNormed__FPKM | |
| TCGA-A2-A0YG-01A-21R-A109-07 | (TODO) -- GDC | mRNA__geneExp__FPKM | |
| TCGA-A2-A0YG-01A-21R-A109-07 | (TODO) -- GDC | mRNA__counts__FPKM | |
| TCGA-A2-A0YH-01A-11R-A109-07 | (TODO) -- GDC | mRNA__geneExpNormed__FPKM | |
| TCGA-A2-A0YH-01A-11R-A109-07 | (TODO) -- GDC | mRNA__geneExp__FPKM | |
| TCGA-A2-A0YH-01A-11R-A109-07 | (TODO) -- GDC | mRNA__counts__FPKM | |
| TCGA-A2-A0YI-01A-31R-A10J-07 | (TODO) -- GDC | mRNA__geneExpNormed__FPKM | |
| TCGA-A2-A0YI-01A-31R-A10J-07 | (TODO) -- GDC | mRNA__geneExp__FPKM | |
| TCGA-A2-A0YI-01A-31R-A10J-07 | (TODO) -- GDC | mRNA__counts__FPKM | |
| TCGA-A2-A0YJ-01A-11R-A109-07 | (TODO) -- GDC | mRNA__geneExpNormed__FPKM | |
| TCGA-A2-A0YJ-01A-11R-A109-07 | (TODO) -- GDC | mRNA__geneExp__FPKM | |
| TCGA-A2-A0YJ-01A-11R-A109-07 | (TODO) -- GDC | mRNA__counts__FPKM | |
| TCGA-A2-A0YK-01A-22R-A109-07 | (TODO) -- GDC | mRNA__geneExpNormed__FPKM | |
| TCGA-A2-A0YK-01A-22R-A109-07 | (TODO) -- GDC | mRNA__geneExp__FPKM | |
| TCGA-A2-A0YK-01A-22R-A109-07 | (TODO) -- GDC | mRNA__counts__FPKM | |
| TCGA-A2-A0YL-01A-21R-A109-07 | (TODO) -- GDC | mRNA__geneExpNormed__FPKM | |
| TCGA-A2-A0YL-01A-21R-A109-07 | (TODO) -- GDC | mRNA__geneExp__FPKM | |
| TCGA-A2-A0YL-01A-21R-A109-07 | (TODO) -- GDC | mRNA__counts__FPKM | |
| TCGA-A2-A0YM-01A-11R-A109-07 | (TODO) -- GDC | mRNA__geneExpNormed__FPKM | |
| TCGA-A2-A0YM-01A-11R-A109-07 | (TODO) -- GDC | mRNA__geneExp__FPKM | |
| TCGA-A2-A0YM-01A-11R-A109-07 | (TODO) -- GDC | mRNA__counts__FPKM | |
| TCGA-A2-A0YT-01A-11R-A109-07 | (TODO) -- GDC | mRNA__geneExpNormed__FPKM | |
| TCGA-A2-A0YT-01A-11R-A109-07 | (TODO) -- GDC | mRNA__geneExp__FPKM | |
| TCGA-A2-A0YT-01A-11R-A109-07 | (TODO) -- GDC | mRNA__counts__FPKM | |
| TCGA-A2-A1FV-01A-11R-A13Q-07 | (TODO) -- GDC | mRNA__geneExpNormed__FPKM | |
| TCGA-A2-A1FV-01A-11R-A13Q-07 | (TODO) -- GDC | mRNA__geneExp__FPKM | |
| TCGA-A2-A1FV-01A-11R-A13Q-07 | (TODO) -- GDC | mRNA__counts__FPKM | |
| TCGA-A2-A1FW-01A-11R-A13Q-07 | (TODO) -- GDC | mRNA__geneExpNormed__FPKM | |
| TCGA-A2-A1FW-01A-11R-A13Q-07 | (TODO) -- GDC | mRNA__geneExp__FPKM | |
| TCGA-A2-A1FW-01A-11R-A13Q-07 | (TODO) -- GDC | mRNA__counts__FPKM | |
| TCGA-A2-A1FX-01A-11R-A13Q-07 | (TODO) -- GDC | mRNA__geneExpNormed__FPKM | |
| TCGA-A2-A1FX-01A-11R-A13Q-07 | (TODO) -- GDC | mRNA__geneExp__FPKM | |
| TCGA-A2-A1FX-01A-11R-A13Q-07 | (TODO) -- GDC | mRNA__counts__FPKM | |
| TCGA-A2-A1FZ-01A-51R-A14D-07 | (TODO) -- GDC | mRNA__geneExpNormed__FPKM | |
| TCGA-A2-A1FZ-01A-51R-A14D-07 | (TODO) -- GDC | mRNA__geneExp__FPKM | |
| TCGA-A2-A1FZ-01A-51R-A14D-07 | (TODO) -- GDC | mRNA__counts__FPKM | |
| TCGA-A2-A1G0-01A-11R-A13Q-07 | (TODO) -- GDC | mRNA__geneExpNormed__FPKM | |
| TCGA-A2-A1G0-01A-11R-A13Q-07 | (TODO) -- GDC | mRNA__geneExp__FPKM | |
| TCGA-A2-A1G0-01A-11R-A13Q-07 | (TODO) -- GDC | mRNA__counts__FPKM | |
| TCGA-A2-A1G1-01A-21R-A13Q-07 | (TODO) -- GDC | mRNA__geneExpNormed__FPKM | |
| TCGA-A2-A1G1-01A-21R-A13Q-07 | (TODO) -- GDC | mRNA__geneExp__FPKM | |
| TCGA-A2-A1G1-01A-21R-A13Q-07 | (TODO) -- GDC | mRNA__counts__FPKM | |
| TCGA-A2-A1G4-01A-11R-A13Q-07 | (TODO) -- GDC | mRNA__geneExpNormed__FPKM | |
| TCGA-A2-A1G4-01A-11R-A13Q-07 | (TODO) -- GDC | mRNA__geneExp__FPKM | |
| TCGA-A2-A1G4-01A-11R-A13Q-07 | (TODO) -- GDC | mRNA__counts__FPKM | |
| TCGA-A2-A1G6-01A-11R-A13Q-07 | (TODO) -- GDC | mRNA__geneExpNormed__FPKM | |
| TCGA-A2-A1G6-01A-11R-A13Q-07 | (TODO) -- GDC | mRNA__geneExp__FPKM | |
| TCGA-A2-A1G6-01A-11R-A13Q-07 | (TODO) -- GDC | mRNA__counts__FPKM | |
| TCGA-A2-A259-01A-11R-A16F-07 | (TODO) -- GDC | mRNA__geneExpNormed__FPKM | |
| TCGA-A2-A259-01A-11R-A16F-07 | (TODO) -- GDC | mRNA__geneExp__FPKM | |
| TCGA-A2-A259-01A-11R-A16F-07 | (TODO) -- GDC | mRNA__counts__FPKM | |
| TCGA-A2-A25A-01A-12R-A16F-07 | (TODO) -- GDC | mRNA__geneExpNormed__FPKM | |
| TCGA-A2-A25A-01A-12R-A16F-07 | (TODO) -- GDC | mRNA__geneExp__FPKM | |
| TCGA-A2-A25A-01A-12R-A16F-07 | (TODO) -- GDC | mRNA__counts__FPKM | |
| TCGA-A2-A25B-01A-11R-A169-07 | (TODO) -- GDC | mRNA__geneExpNormed__FPKM | |
| TCGA-A2-A25B-01A-11R-A169-07 | (TODO) -- GDC | mRNA__geneExp__FPKM | |
| TCGA-A2-A25B-01A-11R-A169-07 | (TODO) -- GDC | mRNA__counts__FPKM | |
| TCGA-A2-A25C-01A-11R-A169-07 | (TODO) -- GDC | mRNA__geneExpNormed__FPKM | |
| TCGA-A2-A25C-01A-11R-A169-07 | (TODO) -- GDC | mRNA__geneExp__FPKM | |
| TCGA-A2-A25C-01A-11R-A169-07 | (TODO) -- GDC | mRNA__counts__FPKM | |
| TCGA-A2-A25D-01A-12R-A16F-07 | (TODO) -- GDC | mRNA__geneExpNormed__FPKM | |
| TCGA-A2-A25D-01A-12R-A16F-07 | (TODO) -- GDC | mRNA__geneExp__FPKM | |
| TCGA-A2-A25D-01A-12R-A16F-07 | (TODO) -- GDC | mRNA__counts__FPKM | |
| TCGA-A2-A25E-01A-11R-A169-07 | (TODO) -- GDC | mRNA__geneExpNormed__FPKM | |
| TCGA-A2-A25E-01A-11R-A169-07 | (TODO) -- GDC | mRNA__geneExp__FPKM | |
| TCGA-A2-A25E-01A-11R-A169-07 | (TODO) -- GDC | mRNA__counts__FPKM | |
| TCGA-A2-A25F-01A-11R-A169-07 | (TODO) -- GDC | mRNA__geneExpNormed__FPKM | |
| TCGA-A2-A25F-01A-11R-A169-07 | (TODO) -- GDC | mRNA__geneExp__FPKM | |
| TCGA-A2-A25F-01A-11R-A169-07 | (TODO) -- GDC | mRNA__counts__FPKM | |
| TCGA-A2-A3KC-01A-11R-A213-07 | (TODO) -- GDC | mRNA__geneExpNormed__FPKM | |
| TCGA-A2-A3KC-01A-11R-A213-07 | (TODO) -- GDC | mRNA__geneExp__FPKM | |
| TCGA-A2-A3KC-01A-11R-A213-07 | (TODO) -- GDC | mRNA__counts__FPKM | |
| TCGA-A2-A3KD-01A-12R-A213-07 | (TODO) -- GDC | mRNA__geneExpNormed__FPKM | |
| TCGA-A2-A3KD-01A-12R-A213-07 | (TODO) -- GDC | mRNA__geneExp__FPKM | |
| TCGA-A2-A3KD-01A-12R-A213-07 | (TODO) -- GDC | mRNA__counts__FPKM | |
| TCGA-A2-A3XS-01A-11R-A22U-07 | (TODO) -- GDC | mRNA__geneExpNormed__FPKM | |
| TCGA-A2-A3XS-01A-11R-A22U-07 | (TODO) -- GDC | mRNA__geneExp__FPKM | |
| TCGA-A2-A3XS-01A-11R-A22U-07 | (TODO) -- GDC | mRNA__counts__FPKM | |
| TCGA-A2-A3XT-01A-11R-A22U-07 | (TODO) -- GDC | mRNA__geneExpNormed__FPKM | |
| TCGA-A2-A3XT-01A-11R-A22U-07 | (TODO) -- GDC | mRNA__geneExp__FPKM | |
| TCGA-A2-A3XT-01A-11R-A22U-07 | (TODO) -- GDC | mRNA__counts__FPKM | |
| TCGA-A2-A3XU-01A-12R-A22U-07 | (TODO) -- GDC | mRNA__geneExpNormed__FPKM | |
| TCGA-A2-A3XU-01A-12R-A22U-07 | (TODO) -- GDC | mRNA__geneExp__FPKM | |
| TCGA-A2-A3XU-01A-12R-A22U-07 | (TODO) -- GDC | mRNA__counts__FPKM | |
| TCGA-A2-A3XV-01A-21R-A239-07 | (TODO) -- GDC | mRNA__geneExpNormed__FPKM | |
| TCGA-A2-A3XV-01A-21R-A239-07 | (TODO) -- GDC | mRNA__geneExp__FPKM | |
| TCGA-A2-A3XV-01A-21R-A239-07 | (TODO) -- GDC | mRNA__counts__FPKM | |
| TCGA-A2-A3XW-01A-11R-A239-07 | (TODO) -- GDC | mRNA__geneExpNormed__FPKM | |
| TCGA-A2-A3XW-01A-11R-A239-07 | (TODO) -- GDC | mRNA__geneExp__FPKM | |
| TCGA-A2-A3XW-01A-11R-A239-07 | (TODO) -- GDC | mRNA__counts__FPKM | |
| TCGA-A2-A3XX-01A-21R-A239-07 | (TODO) -- GDC | mRNA__geneExpNormed__FPKM | |
| TCGA-A2-A3XX-01A-21R-A239-07 | (TODO) -- GDC | mRNA__geneExp__FPKM | |
| TCGA-A2-A3XX-01A-21R-A239-07 | (TODO) -- GDC | mRNA__counts__FPKM | |
| TCGA-A2-A3XY-01A-11R-A239-07 | (TODO) -- GDC | mRNA__geneExpNormed__FPKM | |
| TCGA-A2-A3XY-01A-11R-A239-07 | (TODO) -- GDC | mRNA__geneExp__FPKM | |
| TCGA-A2-A3XY-01A-11R-A239-07 | (TODO) -- GDC | mRNA__counts__FPKM | |
| TCGA-A2-A3XZ-01A-42R-A239-07 | (TODO) -- GDC | mRNA__geneExpNormed__FPKM | |
| TCGA-A2-A3XZ-01A-42R-A239-07 | (TODO) -- GDC | mRNA__geneExp__FPKM | |
| TCGA-A2-A3XZ-01A-42R-A239-07 | (TODO) -- GDC | mRNA__counts__FPKM | |
| TCGA-A2-A3Y0-01A-11R-A239-07 | (TODO) -- GDC | mRNA__geneExpNormed__FPKM | |
| TCGA-A2-A3Y0-01A-11R-A239-07 | (TODO) -- GDC | mRNA__geneExp__FPKM | |
| TCGA-A2-A3Y0-01A-11R-A239-07 | (TODO) -- GDC | mRNA__counts__FPKM | |
| TCGA-A2-A4RW-01A-21R-A266-07 | (TODO) -- GDC | mRNA__geneExpNormed__FPKM | |
| TCGA-A2-A4RW-01A-21R-A266-07 | (TODO) -- GDC | mRNA__geneExp__FPKM | |
| TCGA-A2-A4RW-01A-21R-A266-07 | (TODO) -- GDC | mRNA__counts__FPKM | |
| TCGA-A2-A4RX-01A-11R-A266-07 | (TODO) -- GDC | mRNA__geneExpNormed__FPKM | |
| TCGA-A2-A4RX-01A-11R-A266-07 | (TODO) -- GDC | mRNA__geneExp__FPKM | |
| TCGA-A2-A4RX-01A-11R-A266-07 | (TODO) -- GDC | mRNA__counts__FPKM | |
| TCGA-A2-A4RY-01A-31R-A266-07 | (TODO) -- GDC | mRNA__geneExpNormed__FPKM | |
| TCGA-A2-A4RY-01A-31R-A266-07 | (TODO) -- GDC | mRNA__geneExp__FPKM | |
| TCGA-A2-A4RY-01A-31R-A266-07 | (TODO) -- GDC | mRNA__counts__FPKM | |
| TCGA-A2-A4S0-01A-21R-A266-07 | (TODO) -- GDC | mRNA__geneExpNormed__FPKM | |
| TCGA-A2-A4S0-01A-21R-A266-07 | (TODO) -- GDC | mRNA__geneExp__FPKM | |
| TCGA-A2-A4S0-01A-21R-A266-07 | (TODO) -- GDC | mRNA__counts__FPKM | |
| TCGA-A2-A4S1-01A-21R-A266-07 | (TODO) -- GDC | mRNA__geneExpNormed__FPKM | |
| TCGA-A2-A4S1-01A-21R-A266-07 | (TODO) -- GDC | mRNA__geneExp__FPKM | |
| TCGA-A2-A4S1-01A-21R-A266-07 | (TODO) -- GDC | mRNA__counts__FPKM | |
| TCGA-A2-A4S2-01A-12R-A266-07 | (TODO) -- GDC | mRNA__geneExpNormed__FPKM | |
| TCGA-A2-A4S2-01A-12R-A266-07 | (TODO) -- GDC | mRNA__geneExp__FPKM | |
| TCGA-A2-A4S2-01A-12R-A266-07 | (TODO) -- GDC | mRNA__counts__FPKM | |
| TCGA-A2-A4S3-01A-21R-A266-07 | (TODO) -- GDC | mRNA__geneExpNormed__FPKM | |
| TCGA-A2-A4S3-01A-21R-A266-07 | (TODO) -- GDC | mRNA__geneExp__FPKM | |
| TCGA-A2-A4S3-01A-21R-A266-07 | (TODO) -- GDC | mRNA__counts__FPKM | |
| TCGA-A7-A0CD-01A-11R-A00Z-07 | (TODO) -- GDC | mRNA__geneExpNormed__FPKM | |
| TCGA-A7-A0CD-01A-11R-A00Z-07 | (TODO) -- GDC | mRNA__geneExp__FPKM | |
| TCGA-A7-A0CD-01A-11R-A00Z-07 | (TODO) -- GDC | mRNA__counts__FPKM | |
| TCGA-A7-A0CE-01A-11R-A00Z-07 | (TODO) -- GDC | mRNA__geneExpNormed__FPKM | |
| TCGA-A7-A0CE-01A-11R-A00Z-07 | (TODO) -- GDC | mRNA__geneExp__FPKM | |
| TCGA-A7-A0CE-01A-11R-A00Z-07 | (TODO) -- GDC | mRNA__counts__FPKM | |
| TCGA-A7-A0CG-01A-12R-A056-07 | (TODO) -- GDC | mRNA__geneExpNormed__FPKM | |
| TCGA-A7-A0CG-01A-12R-A056-07 | (TODO) -- GDC | mRNA__geneExp__FPKM | |
| TCGA-A7-A0CG-01A-12R-A056-07 | (TODO) -- GDC | mRNA__counts__FPKM | |
| TCGA-A7-A0CH-01A-21R-A00Z-07 | (TODO) -- GDC | mRNA__geneExpNormed__FPKM | |
| TCGA-A7-A0CH-01A-21R-A00Z-07 | (TODO) -- GDC | mRNA__geneExp__FPKM | |
| TCGA-A7-A0CH-01A-21R-A00Z-07 | (TODO) -- GDC | mRNA__counts__FPKM | |
| TCGA-A7-A0CJ-01A-21R-A00Z-07 | (TODO) -- GDC | mRNA__geneExpNormed__FPKM | |
| TCGA-A7-A0CJ-01A-21R-A00Z-07 | (TODO) -- GDC | mRNA__geneExp__FPKM | |
| TCGA-A7-A0CJ-01A-21R-A00Z-07 | (TODO) -- GDC | mRNA__counts__FPKM | |
| TCGA-A7-A0D9-01A-31R-A056-07 | (TODO) -- GDC | mRNA__geneExpNormed__FPKM | |
| TCGA-A7-A0D9-01A-31R-A056-07 | (TODO) -- GDC | mRNA__geneExp__FPKM | |
| TCGA-A7-A0D9-01A-31R-A056-07 | (TODO) -- GDC | mRNA__counts__FPKM | |
| TCGA-A7-A0DA-01A-31R-A115-07 | (TODO) -- GDC | mRNA__geneExpNormed__FPKM | |
| TCGA-A7-A0DA-01A-31R-A115-07 | (TODO) -- GDC | mRNA__geneExp__FPKM | |
| TCGA-A7-A0DA-01A-31R-A115-07 | (TODO) -- GDC | mRNA__counts__FPKM | |
| TCGA-A7-A0DB-01A-11R-A00Z-07 | (TODO) -- GDC | mRNA__geneExpNormed__FPKM | |
| TCGA-A7-A0DB-01A-11R-A00Z-07 | (TODO) -- GDC | mRNA__geneExp__FPKM | |
| TCGA-A7-A0DB-01A-11R-A00Z-07 | (TODO) -- GDC | mRNA__counts__FPKM | |
| TCGA-A7-A0DB-01A-11R-A277-07 | (TODO) -- GDC | mRNA__geneExpNormed__FPKM | |
| TCGA-A7-A0DB-01A-11R-A277-07 | (TODO) -- GDC | mRNA__geneExp__FPKM | |
| TCGA-A7-A0DB-01A-11R-A277-07 | (TODO) -- GDC | mRNA__counts__FPKM | |
| TCGA-A7-A0DC-01A-11R-A00Z-07 | (TODO) -- GDC | mRNA__geneExpNormed__FPKM | |
| TCGA-A7-A0DC-01A-11R-A00Z-07 | (TODO) -- GDC | mRNA__geneExp__FPKM | |
| TCGA-A7-A0DC-01A-11R-A00Z-07 | (TODO) -- GDC | mRNA__counts__FPKM | |
| TCGA-A7-A13D-01A-13R-A12P-07 | (TODO) -- GDC | mRNA__geneExpNormed__FPKM | |
| TCGA-A7-A13D-01A-13R-A12P-07 | (TODO) -- GDC | mRNA__geneExp__FPKM | |
| TCGA-A7-A13D-01A-13R-A12P-07 | (TODO) -- GDC | mRNA__counts__FPKM | |
| TCGA-A7-A13D-01A-13R-A277-07 | (TODO) -- GDC | mRNA__geneExpNormed__FPKM | |
| TCGA-A7-A13D-01A-13R-A277-07 | (TODO) -- GDC | mRNA__geneExp__FPKM | |
| TCGA-A7-A13D-01A-13R-A277-07 | (TODO) -- GDC | mRNA__counts__FPKM | |
| TCGA-A7-A13E-01A-11R-A12P-07 | (TODO) -- GDC | mRNA__geneExpNormed__FPKM | |
| TCGA-A7-A13E-01A-11R-A12P-07 | (TODO) -- GDC | mRNA__geneExp__FPKM | |
| TCGA-A7-A13E-01A-11R-A12P-07 | (TODO) -- GDC | mRNA__counts__FPKM | |
| TCGA-A7-A13E-01A-11R-A277-07 | (TODO) -- GDC | mRNA__geneExpNormed__FPKM | |
| TCGA-A7-A13E-01A-11R-A277-07 | (TODO) -- GDC | mRNA__geneExp__FPKM | |
| TCGA-A7-A13E-01A-11R-A277-07 | (TODO) -- GDC | mRNA__counts__FPKM | |
| TCGA-A7-A13F-01A-11R-A12P-07 | (TODO) -- GDC | mRNA__geneExpNormed__FPKM | |
| TCGA-A7-A13F-01A-11R-A12P-07 | (TODO) -- GDC | mRNA__geneExp__FPKM | |
| TCGA-A7-A13F-01A-11R-A12P-07 | (TODO) -- GDC | mRNA__counts__FPKM | |
| TCGA-A7-A13H-01A-11R-A22K-07 | (TODO) -- GDC | mRNA__geneExpNormed__FPKM | |
| TCGA-A7-A13H-01A-11R-A22K-07 | (TODO) -- GDC | mRNA__geneExp__FPKM | |
| TCGA-A7-A13H-01A-11R-A22K-07 | (TODO) -- GDC | mRNA__counts__FPKM | |
| TCGA-A7-A26E-01A-11R-A169-07 | (TODO) -- GDC | mRNA__geneExpNormed__FPKM | |
| TCGA-A7-A26E-01A-11R-A169-07 | (TODO) -- GDC | mRNA__geneExp__FPKM | |
| TCGA-A7-A26E-01A-11R-A169-07 | (TODO) -- GDC | mRNA__counts__FPKM | |
| TCGA-A7-A26E-01A-11R-A277-07 | (TODO) -- GDC | mRNA__geneExpNormed__FPKM | |
| TCGA-A7-A26E-01A-11R-A277-07 | (TODO) -- GDC | mRNA__geneExp__FPKM | |
| TCGA-A7-A26E-01A-11R-A277-07 | (TODO) -- GDC | mRNA__counts__FPKM | |
| TCGA-A7-A26G-01A-21R-A169-07 | (TODO) -- GDC | mRNA__geneExpNormed__FPKM | |
| TCGA-A7-A26G-01A-21R-A169-07 | (TODO) -- GDC | mRNA__geneExp__FPKM | |
| TCGA-A7-A26G-01A-21R-A169-07 | (TODO) -- GDC | mRNA__counts__FPKM | |
| TCGA-A7-A26H-01A-11R-A169-07 | (TODO) -- GDC | mRNA__geneExpNormed__FPKM | |
| TCGA-A7-A26H-01A-11R-A169-07 | (TODO) -- GDC | mRNA__geneExp__FPKM | |
| TCGA-A7-A26H-01A-11R-A169-07 | (TODO) -- GDC | mRNA__counts__FPKM | |
| TCGA-A7-A26J-01A-11R-A169-07 | (TODO) -- GDC | mRNA__geneExpNormed__FPKM | |
| TCGA-A7-A26J-01A-11R-A169-07 | (TODO) -- GDC | mRNA__geneExp__FPKM | |
| TCGA-A7-A26J-01A-11R-A169-07 | (TODO) -- GDC | mRNA__counts__FPKM | |
| TCGA-A7-A26J-01A-11R-A277-07 | (TODO) -- GDC | mRNA__geneExpNormed__FPKM | |
| TCGA-A7-A26J-01A-11R-A277-07 | (TODO) -- GDC | mRNA__geneExp__FPKM | |
| TCGA-A7-A26J-01A-11R-A277-07 | (TODO) -- GDC | mRNA__counts__FPKM | |
| TCGA-A7-A2KD-01A-31R-A21T-07 | (TODO) -- GDC | mRNA__geneExpNormed__FPKM | |
| TCGA-A7-A2KD-01A-31R-A21T-07 | (TODO) -- GDC | mRNA__geneExp__FPKM | |
| TCGA-A7-A2KD-01A-31R-A21T-07 | (TODO) -- GDC | mRNA__counts__FPKM | |
| TCGA-A7-A3IY-01A-21R-A21T-07 | (TODO) -- GDC | mRNA__geneExpNormed__FPKM | |
| TCGA-A7-A3IY-01A-21R-A21T-07 | (TODO) -- GDC | mRNA__geneExp__FPKM | |
| TCGA-A7-A3IY-01A-21R-A21T-07 | (TODO) -- GDC | mRNA__counts__FPKM | |
| TCGA-A7-A3IZ-01A-11R-A213-07 | (TODO) -- GDC | mRNA__geneExpNormed__FPKM | |
| TCGA-A7-A3IZ-01A-11R-A213-07 | (TODO) -- GDC | mRNA__geneExp__FPKM | |
| TCGA-A7-A3IZ-01A-11R-A213-07 | (TODO) -- GDC | mRNA__counts__FPKM | |
| TCGA-A7-A3J0-01A-11R-A213-07 | (TODO) -- GDC | mRNA__geneExpNormed__FPKM | |
| TCGA-A7-A3J0-01A-11R-A213-07 | (TODO) -- GDC | mRNA__geneExp__FPKM | |
| TCGA-A7-A3J0-01A-11R-A213-07 | (TODO) -- GDC | mRNA__counts__FPKM | |
| TCGA-A7-A3J1-01A-11R-A213-07 | (TODO) -- GDC | mRNA__geneExpNormed__FPKM | |
| TCGA-A7-A3J1-01A-11R-A213-07 | (TODO) -- GDC | mRNA__geneExp__FPKM | |
| TCGA-A7-A3J1-01A-11R-A213-07 | (TODO) -- GDC | mRNA__counts__FPKM | |
| TCGA-A7-A3RF-01A-11R-A22K-07 | (TODO) -- GDC | mRNA__geneExpNormed__FPKM | |
| TCGA-A7-A3RF-01A-11R-A22K-07 | (TODO) -- GDC | mRNA__geneExp__FPKM | |
| TCGA-A7-A3RF-01A-11R-A22K-07 | (TODO) -- GDC | mRNA__counts__FPKM | |
| TCGA-A7-A425-01A-11R-A24H-07 | (TODO) -- GDC | mRNA__geneExpNormed__FPKM | |
| TCGA-A7-A425-01A-11R-A24H-07 | (TODO) -- GDC | mRNA__geneExp__FPKM | |
| TCGA-A7-A425-01A-11R-A24H-07 | (TODO) -- GDC | mRNA__counts__FPKM | |
| TCGA-A7-A426-01A-22R-A24H-07 | (TODO) -- GDC | mRNA__geneExpNormed__FPKM | |
| TCGA-A7-A426-01A-22R-A24H-07 | (TODO) -- GDC | mRNA__geneExp__FPKM | |
| TCGA-A7-A426-01A-22R-A24H-07 | (TODO) -- GDC | mRNA__counts__FPKM | |
| TCGA-A7-A4SA-01A-11R-A266-07 | (TODO) -- GDC | mRNA__geneExpNormed__FPKM | |
| TCGA-A7-A4SA-01A-11R-A266-07 | (TODO) -- GDC | mRNA__geneExp__FPKM | |
| TCGA-A7-A4SA-01A-11R-A266-07 | (TODO) -- GDC | mRNA__counts__FPKM | |
| TCGA-A7-A4SB-01A-21R-A266-07 | (TODO) -- GDC | mRNA__geneExpNormed__FPKM | |
| TCGA-A7-A4SB-01A-21R-A266-07 | (TODO) -- GDC | mRNA__geneExp__FPKM | |
| TCGA-A7-A4SB-01A-21R-A266-07 | (TODO) -- GDC | mRNA__counts__FPKM | |
| TCGA-A7-A4SC-01A-12R-A266-07 | (TODO) -- GDC | mRNA__geneExpNormed__FPKM | |
| TCGA-A7-A4SC-01A-12R-A266-07 | (TODO) -- GDC | mRNA__geneExp__FPKM | |
| TCGA-A7-A4SC-01A-12R-A266-07 | (TODO) -- GDC | mRNA__counts__FPKM | |
| TCGA-A7-A4SD-01A-11R-A266-07 | (TODO) -- GDC | mRNA__geneExpNormed__FPKM | |
| TCGA-A7-A4SD-01A-11R-A266-07 | (TODO) -- GDC | mRNA__geneExp__FPKM | |
| TCGA-A7-A4SD-01A-11R-A266-07 | (TODO) -- GDC | mRNA__counts__FPKM | |
| TCGA-A7-A4SE-01A-11R-A266-07 | (TODO) -- GDC | mRNA__geneExpNormed__FPKM | |
| TCGA-A7-A4SE-01A-11R-A266-07 | (TODO) -- GDC | mRNA__geneExp__FPKM | |
| TCGA-A7-A4SE-01A-11R-A266-07 | (TODO) -- GDC | mRNA__counts__FPKM | |
| TCGA-A7-A4SF-01A-11R-A266-07 | (TODO) -- GDC | mRNA__geneExpNormed__FPKM | |
| TCGA-A7-A4SF-01A-11R-A266-07 | (TODO) -- GDC | mRNA__geneExp__FPKM | |
| TCGA-A7-A4SF-01A-11R-A266-07 | (TODO) -- GDC | mRNA__counts__FPKM | |
| TCGA-A7-A56D-01A-11R-A27Q-07 | (TODO) -- GDC | mRNA__geneExpNormed__FPKM | |
| TCGA-A7-A56D-01A-11R-A27Q-07 | (TODO) -- GDC | mRNA__geneExp__FPKM | |
| TCGA-A7-A56D-01A-11R-A27Q-07 | (TODO) -- GDC | mRNA__counts__FPKM | |
| TCGA-A7-A5ZV-01A-11R-A28M-07 | (TODO) -- GDC | mRNA__geneExpNormed__FPKM | |
| TCGA-A7-A5ZV-01A-11R-A28M-07 | (TODO) -- GDC | mRNA__geneExp__FPKM | |
| TCGA-A7-A5ZV-01A-11R-A28M-07 | (TODO) -- GDC | mRNA__counts__FPKM | |
| TCGA-A7-A5ZW-01A-12R-A29R-07 | (TODO) -- GDC | mRNA__geneExpNormed__FPKM | |
| TCGA-A7-A5ZW-01A-12R-A29R-07 | (TODO) -- GDC | mRNA__geneExp__FPKM | |
| TCGA-A7-A5ZW-01A-12R-A29R-07 | (TODO) -- GDC | mRNA__counts__FPKM | |
| TCGA-A7-A5ZX-01A-12R-A29R-07 | (TODO) -- GDC | mRNA__geneExpNormed__FPKM | |
| TCGA-A7-A5ZX-01A-12R-A29R-07 | (TODO) -- GDC | mRNA__geneExp__FPKM | |
| TCGA-A7-A5ZX-01A-12R-A29R-07 | (TODO) -- GDC | mRNA__counts__FPKM | |
| TCGA-A7-A6VV-01A-22R-A33J-07 | (TODO) -- GDC | mRNA__geneExpNormed__FPKM | |
| TCGA-A7-A6VV-01A-22R-A33J-07 | (TODO) -- GDC | mRNA__geneExp__FPKM | |
| TCGA-A7-A6VV-01A-22R-A33J-07 | (TODO) -- GDC | mRNA__counts__FPKM | |
| TCGA-A7-A6VW-01A-21R-A33J-07 | (TODO) -- GDC | mRNA__geneExpNormed__FPKM | |
| TCGA-A7-A6VW-01A-21R-A33J-07 | (TODO) -- GDC | mRNA__geneExp__FPKM | |
| TCGA-A7-A6VW-01A-21R-A33J-07 | (TODO) -- GDC | mRNA__counts__FPKM | |
| TCGA-A7-A6VX-01A-12R-A33J-07 | (TODO) -- GDC | mRNA__geneExpNormed__FPKM | |
| TCGA-A7-A6VX-01A-12R-A33J-07 | (TODO) -- GDC | mRNA__geneExp__FPKM | |
| TCGA-A7-A6VX-01A-12R-A33J-07 | (TODO) -- GDC | mRNA__counts__FPKM | |
| TCGA-A7-A6VY-01A-12R-A33J-07 | (TODO) -- GDC | mRNA__geneExpNormed__FPKM | |
| TCGA-A7-A6VY-01A-12R-A33J-07 | (TODO) -- GDC | mRNA__geneExp__FPKM | |
| TCGA-A7-A6VY-01A-12R-A33J-07 | (TODO) -- GDC | mRNA__counts__FPKM | |
| TCGA-A8-A06N-01A-11R-A00Z-07 | (TODO) -- GDC | mRNA__geneExpNormed__FPKM | |
| TCGA-A8-A06N-01A-11R-A00Z-07 | (TODO) -- GDC | mRNA__geneExp__FPKM | |
| TCGA-A8-A06N-01A-11R-A00Z-07 | (TODO) -- GDC | mRNA__counts__FPKM | |
| TCGA-A8-A06O-01A-11R-A00Z-07 | (TODO) -- GDC | mRNA__geneExpNormed__FPKM | |
| TCGA-A8-A06O-01A-11R-A00Z-07 | (TODO) -- GDC | mRNA__geneExp__FPKM | |
| TCGA-A8-A06O-01A-11R-A00Z-07 | (TODO) -- GDC | mRNA__counts__FPKM | |
| TCGA-A8-A06P-01A-11R-A00Z-07 | (TODO) -- GDC | mRNA__geneExpNormed__FPKM | |
| TCGA-A8-A06P-01A-11R-A00Z-07 | (TODO) -- GDC | mRNA__geneExp__FPKM | |
| TCGA-A8-A06P-01A-11R-A00Z-07 | (TODO) -- GDC | mRNA__counts__FPKM | |
| TCGA-A8-A06Q-01A-11R-A034-07 | (TODO) -- GDC | mRNA__geneExpNormed__FPKM | |
| TCGA-A8-A06Q-01A-11R-A034-07 | (TODO) -- GDC | mRNA__geneExp__FPKM | |
| TCGA-A8-A06Q-01A-11R-A034-07 | (TODO) -- GDC | mRNA__counts__FPKM | |
| TCGA-A8-A06R-01A-11R-A00Z-07 | (TODO) -- GDC | mRNA__geneExpNormed__FPKM | |
| TCGA-A8-A06R-01A-11R-A00Z-07 | (TODO) -- GDC | mRNA__geneExp__FPKM | |
| TCGA-A8-A06R-01A-11R-A00Z-07 | (TODO) -- GDC | mRNA__counts__FPKM | |
| TCGA-A8-A06T-01A-11R-A00Z-07 | (TODO) -- GDC | mRNA__geneExpNormed__FPKM | |
| TCGA-A8-A06T-01A-11R-A00Z-07 | (TODO) -- GDC | mRNA__geneExp__FPKM | |
| TCGA-A8-A06T-01A-11R-A00Z-07 | (TODO) -- GDC | mRNA__counts__FPKM | |
| TCGA-A8-A06U-01A-11R-A00Z-07 | (TODO) -- GDC | mRNA__geneExpNormed__FPKM | |
| TCGA-A8-A06U-01A-11R-A00Z-07 | (TODO) -- GDC | mRNA__geneExp__FPKM | |
| TCGA-A8-A06U-01A-11R-A00Z-07 | (TODO) -- GDC | mRNA__counts__FPKM | |
| TCGA-A8-A06X-01A-21R-A00Z-07 | (TODO) -- GDC | mRNA__geneExpNormed__FPKM | |
| TCGA-A8-A06X-01A-21R-A00Z-07 | (TODO) -- GDC | mRNA__geneExp__FPKM | |
| TCGA-A8-A06X-01A-21R-A00Z-07 | (TODO) -- GDC | mRNA__counts__FPKM | |
| TCGA-A8-A06Y-01A-21R-A00Z-07 | (TODO) -- GDC | mRNA__geneExpNormed__FPKM | |
| TCGA-A8-A06Y-01A-21R-A00Z-07 | (TODO) -- GDC | mRNA__geneExp__FPKM | |
| TCGA-A8-A06Y-01A-21R-A00Z-07 | (TODO) -- GDC | mRNA__counts__FPKM | |
| TCGA-A8-A06Z-01A-11R-A00Z-07 | (TODO) -- GDC | mRNA__geneExpNormed__FPKM | |
| TCGA-A8-A06Z-01A-11R-A00Z-07 | (TODO) -- GDC | mRNA__geneExp__FPKM | |
| TCGA-A8-A06Z-01A-11R-A00Z-07 | (TODO) -- GDC | mRNA__counts__FPKM | |
| TCGA-A8-A075-01A-11R-A084-07 | (TODO) -- GDC | mRNA__geneExpNormed__FPKM | |
| TCGA-A8-A075-01A-11R-A084-07 | (TODO) -- GDC | mRNA__geneExp__FPKM | |
| TCGA-A8-A075-01A-11R-A084-07 | (TODO) -- GDC | mRNA__counts__FPKM | |
| TCGA-A8-A076-01A-21R-A00Z-07 | (TODO) -- GDC | mRNA__geneExpNormed__FPKM | |
| TCGA-A8-A076-01A-21R-A00Z-07 | (TODO) -- GDC | mRNA__geneExp__FPKM | |
| TCGA-A8-A076-01A-21R-A00Z-07 | (TODO) -- GDC | mRNA__counts__FPKM | |
| TCGA-A8-A079-01A-21R-A00Z-07 | (TODO) -- GDC | mRNA__geneExpNormed__FPKM | |
| TCGA-A8-A079-01A-21R-A00Z-07 | (TODO) -- GDC | mRNA__geneExp__FPKM | |
| TCGA-A8-A079-01A-21R-A00Z-07 | (TODO) -- GDC | mRNA__counts__FPKM | |
| TCGA-A8-A07B-01A-11R-A00Z-07 | (TODO) -- GDC | mRNA__geneExpNormed__FPKM | |
| TCGA-A8-A07B-01A-11R-A00Z-07 | (TODO) -- GDC | mRNA__geneExp__FPKM | |
| TCGA-A8-A07B-01A-11R-A00Z-07 | (TODO) -- GDC | mRNA__counts__FPKM | |
| TCGA-A8-A07C-01A-11R-A034-07 | (TODO) -- GDC | mRNA__geneExpNormed__FPKM | |
| TCGA-A8-A07C-01A-11R-A034-07 | (TODO) -- GDC | mRNA__geneExp__FPKM | |
| TCGA-A8-A07C-01A-11R-A034-07 | (TODO) -- GDC | mRNA__counts__FPKM | |
| TCGA-A8-A07E-01A-11R-A034-07 | (TODO) -- GDC | mRNA__geneExpNormed__FPKM | |
| TCGA-A8-A07E-01A-11R-A034-07 | (TODO) -- GDC | mRNA__geneExp__FPKM | |
| TCGA-A8-A07E-01A-11R-A034-07 | (TODO) -- GDC | mRNA__counts__FPKM | |
| TCGA-A8-A07F-01A-11R-A00Z-07 | (TODO) -- GDC | mRNA__geneExpNormed__FPKM | |
| TCGA-A8-A07F-01A-11R-A00Z-07 | (TODO) -- GDC | mRNA__geneExp__FPKM | |
| TCGA-A8-A07F-01A-11R-A00Z-07 | (TODO) -- GDC | mRNA__counts__FPKM | |
| TCGA-A8-A07G-01A-11R-A034-07 | (TODO) -- GDC | mRNA__geneExpNormed__FPKM | |
| TCGA-A8-A07G-01A-11R-A034-07 | (TODO) -- GDC | mRNA__geneExp__FPKM | |
| TCGA-A8-A07G-01A-11R-A034-07 | (TODO) -- GDC | mRNA__counts__FPKM | |
| TCGA-A8-A07I-01A-11R-A00Z-07 | (TODO) -- GDC | mRNA__geneExpNormed__FPKM | |
| TCGA-A8-A07I-01A-11R-A00Z-07 | (TODO) -- GDC | mRNA__geneExp__FPKM | |
| TCGA-A8-A07I-01A-11R-A00Z-07 | (TODO) -- GDC | mRNA__counts__FPKM | |
| TCGA-A8-A07J-01A-11R-A00Z-07 | (TODO) -- GDC | mRNA__geneExpNormed__FPKM | |
| TCGA-A8-A07J-01A-11R-A00Z-07 | (TODO) -- GDC | mRNA__geneExp__FPKM | |
| TCGA-A8-A07J-01A-11R-A00Z-07 | (TODO) -- GDC | mRNA__counts__FPKM | |
| TCGA-A8-A07L-01A-11R-A00Z-07 | (TODO) -- GDC | mRNA__geneExpNormed__FPKM | |
| TCGA-A8-A07L-01A-11R-A00Z-07 | (TODO) -- GDC | mRNA__geneExp__FPKM | |
| TCGA-A8-A07L-01A-11R-A00Z-07 | (TODO) -- GDC | mRNA__counts__FPKM | |
| TCGA-A8-A07O-01A-11R-A00Z-07 | (TODO) -- GDC | mRNA__geneExpNormed__FPKM | |
| TCGA-A8-A07O-01A-11R-A00Z-07 | (TODO) -- GDC | mRNA__geneExp__FPKM | |
| TCGA-A8-A07O-01A-11R-A00Z-07 | (TODO) -- GDC | mRNA__counts__FPKM | |
| TCGA-A8-A07P-01A-11R-A00Z-07 | (TODO) -- GDC | mRNA__geneExpNormed__FPKM | |
| TCGA-A8-A07P-01A-11R-A00Z-07 | (TODO) -- GDC | mRNA__geneExp__FPKM | |
| TCGA-A8-A07P-01A-11R-A00Z-07 | (TODO) -- GDC | mRNA__counts__FPKM | |
| TCGA-A8-A07R-01A-21R-A034-07 | (TODO) -- GDC | mRNA__geneExpNormed__FPKM | |
| TCGA-A8-A07R-01A-21R-A034-07 | (TODO) -- GDC | mRNA__geneExp__FPKM | |
| TCGA-A8-A07R-01A-21R-A034-07 | (TODO) -- GDC | mRNA__counts__FPKM | |
| TCGA-A8-A07S-01A-11R-A034-07 | (TODO) -- GDC | mRNA__geneExpNormed__FPKM | |
| TCGA-A8-A07S-01A-11R-A034-07 | (TODO) -- GDC | mRNA__geneExp__FPKM | |
| TCGA-A8-A07S-01A-11R-A034-07 | (TODO) -- GDC | mRNA__counts__FPKM | |
| TCGA-A8-A07U-01A-11R-A034-07 | (TODO) -- GDC | mRNA__geneExpNormed__FPKM | |
| TCGA-A8-A07U-01A-11R-A034-07 | (TODO) -- GDC | mRNA__geneExp__FPKM | |
| TCGA-A8-A07U-01A-11R-A034-07 | (TODO) -- GDC | mRNA__counts__FPKM | |
| TCGA-A8-A07W-01A-11R-A00Z-07 | (TODO) -- GDC | mRNA__geneExpNormed__FPKM | |
| TCGA-A8-A07W-01A-11R-A00Z-07 | (TODO) -- GDC | mRNA__geneExp__FPKM | |
| TCGA-A8-A07W-01A-11R-A00Z-07 | (TODO) -- GDC | mRNA__counts__FPKM | |
| TCGA-A8-A07Z-01A-11R-A00Z-07 | (TODO) -- GDC | mRNA__geneExpNormed__FPKM | |
| TCGA-A8-A07Z-01A-11R-A00Z-07 | (TODO) -- GDC | mRNA__geneExp__FPKM | |
| TCGA-A8-A07Z-01A-11R-A00Z-07 | (TODO) -- GDC | mRNA__counts__FPKM | |
| TCGA-A8-A081-01A-11R-A00Z-07 | (TODO) -- GDC | mRNA__geneExpNormed__FPKM | |
| TCGA-A8-A081-01A-11R-A00Z-07 | (TODO) -- GDC | mRNA__geneExp__FPKM | |
| TCGA-A8-A081-01A-11R-A00Z-07 | (TODO) -- GDC | mRNA__counts__FPKM | |
| TCGA-A8-A082-01A-11R-A00Z-07 | (TODO) -- GDC | mRNA__geneExpNormed__FPKM | |
| TCGA-A8-A082-01A-11R-A00Z-07 | (TODO) -- GDC | mRNA__geneExp__FPKM | |
| TCGA-A8-A082-01A-11R-A00Z-07 | (TODO) -- GDC | mRNA__counts__FPKM | |
| TCGA-A8-A083-01A-21R-A00Z-07 | (TODO) -- GDC | mRNA__geneExpNormed__FPKM | |
| TCGA-A8-A083-01A-21R-A00Z-07 | (TODO) -- GDC | mRNA__geneExp__FPKM | |
| TCGA-A8-A083-01A-21R-A00Z-07 | (TODO) -- GDC | mRNA__counts__FPKM | |
| TCGA-A8-A084-01A-21R-A00Z-07 | (TODO) -- GDC | mRNA__geneExpNormed__FPKM | |
| TCGA-A8-A084-01A-21R-A00Z-07 | (TODO) -- GDC | mRNA__geneExp__FPKM | |
| TCGA-A8-A084-01A-21R-A00Z-07 | (TODO) -- GDC | mRNA__counts__FPKM | |
| TCGA-A8-A085-01A-11R-A00Z-07 | (TODO) -- GDC | mRNA__geneExpNormed__FPKM | |
| TCGA-A8-A085-01A-11R-A00Z-07 | (TODO) -- GDC | mRNA__geneExp__FPKM | |
| TCGA-A8-A085-01A-11R-A00Z-07 | (TODO) -- GDC | mRNA__counts__FPKM | |
| TCGA-A8-A086-01A-11R-A00Z-07 | (TODO) -- GDC | mRNA__geneExpNormed__FPKM | |
| TCGA-A8-A086-01A-11R-A00Z-07 | (TODO) -- GDC | mRNA__geneExp__FPKM | |
| TCGA-A8-A086-01A-11R-A00Z-07 | (TODO) -- GDC | mRNA__counts__FPKM | |
| TCGA-A8-A08A-01A-11R-A32Y-07 | (TODO) -- GDC | mRNA__geneExpNormed__FPKM | |
| TCGA-A8-A08A-01A-11R-A32Y-07 | (TODO) -- GDC | mRNA__geneExp__FPKM | |
| TCGA-A8-A08A-01A-11R-A32Y-07 | (TODO) -- GDC | mRNA__counts__FPKM | |
| TCGA-A8-A08B-01A-11R-A00Z-07 | (TODO) -- GDC | mRNA__geneExpNormed__FPKM | |
| TCGA-A8-A08B-01A-11R-A00Z-07 | (TODO) -- GDC | mRNA__geneExp__FPKM | |
| TCGA-A8-A08B-01A-11R-A00Z-07 | (TODO) -- GDC | mRNA__counts__FPKM | |
| TCGA-A8-A08C-01A-11R-A00Z-07 | (TODO) -- GDC | mRNA__geneExpNormed__FPKM | |
| TCGA-A8-A08C-01A-11R-A00Z-07 | (TODO) -- GDC | mRNA__geneExp__FPKM | |
| TCGA-A8-A08C-01A-11R-A00Z-07 | (TODO) -- GDC | mRNA__counts__FPKM | |
| TCGA-A8-A08F-01A-11R-A00Z-07 | (TODO) -- GDC | mRNA__geneExpNormed__FPKM | |
| TCGA-A8-A08F-01A-11R-A00Z-07 | (TODO) -- GDC | mRNA__geneExp__FPKM | |
| TCGA-A8-A08F-01A-11R-A00Z-07 | (TODO) -- GDC | mRNA__counts__FPKM | |
| TCGA-A8-A08G-01A-11R-A00Z-07 | (TODO) -- GDC | mRNA__geneExpNormed__FPKM | |
| TCGA-A8-A08G-01A-11R-A00Z-07 | (TODO) -- GDC | mRNA__geneExp__FPKM | |
| TCGA-A8-A08G-01A-11R-A00Z-07 | (TODO) -- GDC | mRNA__counts__FPKM | |
| TCGA-A8-A08H-01A-21R-A00Z-07 | (TODO) -- GDC | mRNA__geneExpNormed__FPKM | |
| TCGA-A8-A08H-01A-21R-A00Z-07 | (TODO) -- GDC | mRNA__geneExp__FPKM | |
| TCGA-A8-A08H-01A-21R-A00Z-07 | (TODO) -- GDC | mRNA__counts__FPKM | |
| TCGA-A8-A08I-01A-11R-A00Z-07 | (TODO) -- GDC | mRNA__geneExpNormed__FPKM | |
| TCGA-A8-A08I-01A-11R-A00Z-07 | (TODO) -- GDC | mRNA__geneExp__FPKM | |
| TCGA-A8-A08I-01A-11R-A00Z-07 | (TODO) -- GDC | mRNA__counts__FPKM | |
| TCGA-A8-A08J-01A-11R-A00Z-07 | (TODO) -- GDC | mRNA__geneExpNormed__FPKM | |
| TCGA-A8-A08J-01A-11R-A00Z-07 | (TODO) -- GDC | mRNA__geneExp__FPKM | |
| TCGA-A8-A08J-01A-11R-A00Z-07 | (TODO) -- GDC | mRNA__counts__FPKM | |
| TCGA-A8-A08L-01A-11R-A00Z-07 | (TODO) -- GDC | mRNA__geneExpNormed__FPKM | |
| TCGA-A8-A08L-01A-11R-A00Z-07 | (TODO) -- GDC | mRNA__geneExp__FPKM | |
| TCGA-A8-A08L-01A-11R-A00Z-07 | (TODO) -- GDC | mRNA__counts__FPKM | |
| TCGA-A8-A08O-01A-21R-A056-07 | (TODO) -- GDC | mRNA__geneExpNormed__FPKM | |
| TCGA-A8-A08O-01A-21R-A056-07 | (TODO) -- GDC | mRNA__geneExp__FPKM | |
| TCGA-A8-A08O-01A-21R-A056-07 | (TODO) -- GDC | mRNA__counts__FPKM | |
| TCGA-A8-A08P-01A-11R-A00Z-07 | (TODO) -- GDC | mRNA__geneExpNormed__FPKM | |
| TCGA-A8-A08P-01A-11R-A00Z-07 | (TODO) -- GDC | mRNA__geneExp__FPKM | |
| TCGA-A8-A08P-01A-11R-A00Z-07 | (TODO) -- GDC | mRNA__counts__FPKM | |
| TCGA-A8-A08R-01A-11R-A034-07 | (TODO) -- GDC | mRNA__geneExpNormed__FPKM | |
| TCGA-A8-A08R-01A-11R-A034-07 | (TODO) -- GDC | mRNA__geneExp__FPKM | |
| TCGA-A8-A08R-01A-11R-A034-07 | (TODO) -- GDC | mRNA__counts__FPKM | |
| TCGA-A8-A08S-01A-11R-A034-07 | (TODO) -- GDC | mRNA__geneExpNormed__FPKM | |
| TCGA-A8-A08S-01A-11R-A034-07 | (TODO) -- GDC | mRNA__geneExp__FPKM | |
| TCGA-A8-A08S-01A-11R-A034-07 | (TODO) -- GDC | mRNA__counts__FPKM | |
| TCGA-A8-A08T-01A-21R-A00Z-07 | (TODO) -- GDC | mRNA__geneExpNormed__FPKM | |
| TCGA-A8-A08T-01A-21R-A00Z-07 | (TODO) -- GDC | mRNA__geneExp__FPKM | |
| TCGA-A8-A08T-01A-21R-A00Z-07 | (TODO) -- GDC | mRNA__counts__FPKM | |
| TCGA-A8-A08X-01A-21R-A00Z-07 | (TODO) -- GDC | mRNA__geneExpNormed__FPKM | |
| TCGA-A8-A08X-01A-21R-A00Z-07 | (TODO) -- GDC | mRNA__geneExp__FPKM | |
| TCGA-A8-A08X-01A-21R-A00Z-07 | (TODO) -- GDC | mRNA__counts__FPKM | |
| TCGA-A8-A08Z-01A-21R-A00Z-07 | (TODO) -- GDC | mRNA__geneExpNormed__FPKM | |
| TCGA-A8-A08Z-01A-21R-A00Z-07 | (TODO) -- GDC | mRNA__geneExp__FPKM | |
| TCGA-A8-A08Z-01A-21R-A00Z-07 | (TODO) -- GDC | mRNA__counts__FPKM | |
| TCGA-A8-A090-01A-11R-A00Z-07 | (TODO) -- GDC | mRNA__geneExpNormed__FPKM | |
| TCGA-A8-A090-01A-11R-A00Z-07 | (TODO) -- GDC | mRNA__geneExp__FPKM | |
| TCGA-A8-A090-01A-11R-A00Z-07 | (TODO) -- GDC | mRNA__counts__FPKM | |
| TCGA-A8-A091-01A-11R-A00Z-07 | (TODO) -- GDC | mRNA__geneExpNormed__FPKM | |
| TCGA-A8-A091-01A-11R-A00Z-07 | (TODO) -- GDC | mRNA__geneExp__FPKM | |
| TCGA-A8-A091-01A-11R-A00Z-07 | (TODO) -- GDC | mRNA__counts__FPKM | |
| TCGA-A8-A092-01A-11R-A00Z-07 | (TODO) -- GDC | mRNA__geneExpNormed__FPKM | |
| TCGA-A8-A092-01A-11R-A00Z-07 | (TODO) -- GDC | mRNA__geneExp__FPKM | |
| TCGA-A8-A092-01A-11R-A00Z-07 | (TODO) -- GDC | mRNA__counts__FPKM | |
| TCGA-A8-A093-01A-11R-A00Z-07 | (TODO) -- GDC | mRNA__geneExpNormed__FPKM | |
| TCGA-A8-A093-01A-11R-A00Z-07 | (TODO) -- GDC | mRNA__geneExp__FPKM | |
| TCGA-A8-A093-01A-11R-A00Z-07 | (TODO) -- GDC | mRNA__counts__FPKM | |
| TCGA-A8-A094-01A-11R-A00Z-07 | (TODO) -- GDC | mRNA__geneExpNormed__FPKM | |
| TCGA-A8-A094-01A-11R-A00Z-07 | (TODO) -- GDC | mRNA__geneExp__FPKM | |
| TCGA-A8-A094-01A-11R-A00Z-07 | (TODO) -- GDC | mRNA__counts__FPKM | |
| TCGA-A8-A095-01A-11R-A00Z-07 | (TODO) -- GDC | mRNA__geneExpNormed__FPKM | |
| TCGA-A8-A095-01A-11R-A00Z-07 | (TODO) -- GDC | mRNA__geneExp__FPKM | |
| TCGA-A8-A095-01A-11R-A00Z-07 | (TODO) -- GDC | mRNA__counts__FPKM | |
| TCGA-A8-A096-01A-11R-A00Z-07 | (TODO) -- GDC | mRNA__geneExpNormed__FPKM | |
| TCGA-A8-A096-01A-11R-A00Z-07 | (TODO) -- GDC | mRNA__geneExp__FPKM | |
| TCGA-A8-A096-01A-11R-A00Z-07 | (TODO) -- GDC | mRNA__counts__FPKM | |
| TCGA-A8-A097-01A-11R-A034-07 | (TODO) -- GDC | mRNA__geneExpNormed__FPKM | |
| TCGA-A8-A097-01A-11R-A034-07 | (TODO) -- GDC | mRNA__geneExp__FPKM | |
| TCGA-A8-A097-01A-11R-A034-07 | (TODO) -- GDC | mRNA__counts__FPKM | |
| TCGA-A8-A099-01A-11R-A00Z-07 | (TODO) -- GDC | mRNA__geneExpNormed__FPKM | |
| TCGA-A8-A099-01A-11R-A00Z-07 | (TODO) -- GDC | mRNA__geneExp__FPKM | |
| TCGA-A8-A099-01A-11R-A00Z-07 | (TODO) -- GDC | mRNA__counts__FPKM | |
| TCGA-A8-A09A-01A-11R-A00Z-07 | (TODO) -- GDC | mRNA__geneExpNormed__FPKM | |
| TCGA-A8-A09A-01A-11R-A00Z-07 | (TODO) -- GDC | mRNA__geneExp__FPKM | |
| TCGA-A8-A09A-01A-11R-A00Z-07 | (TODO) -- GDC | mRNA__counts__FPKM | |
| TCGA-A8-A09B-01A-11R-A00Z-07 | (TODO) -- GDC | mRNA__geneExpNormed__FPKM | |
| TCGA-A8-A09B-01A-11R-A00Z-07 | (TODO) -- GDC | mRNA__geneExp__FPKM | |
| TCGA-A8-A09B-01A-11R-A00Z-07 | (TODO) -- GDC | mRNA__counts__FPKM | |
| TCGA-A8-A09D-01A-11R-A00Z-07 | (TODO) -- GDC | mRNA__geneExpNormed__FPKM | |
| TCGA-A8-A09D-01A-11R-A00Z-07 | (TODO) -- GDC | mRNA__geneExp__FPKM | |
| TCGA-A8-A09D-01A-11R-A00Z-07 | (TODO) -- GDC | mRNA__counts__FPKM | |
| TCGA-A8-A09E-01A-11R-A00Z-07 | (TODO) -- GDC | mRNA__geneExpNormed__FPKM | |
| TCGA-A8-A09E-01A-11R-A00Z-07 | (TODO) -- GDC | mRNA__geneExp__FPKM | |
| TCGA-A8-A09E-01A-11R-A00Z-07 | (TODO) -- GDC | mRNA__counts__FPKM | |
| TCGA-A8-A09G-01A-21R-A00Z-07 | (TODO) -- GDC | mRNA__geneExpNormed__FPKM | |
| TCGA-A8-A09G-01A-21R-A00Z-07 | (TODO) -- GDC | mRNA__geneExp__FPKM | |
| TCGA-A8-A09G-01A-21R-A00Z-07 | (TODO) -- GDC | mRNA__counts__FPKM | |
| TCGA-A8-A09I-01A-22R-A034-07 | (TODO) -- GDC | mRNA__geneExpNormed__FPKM | |
| TCGA-A8-A09I-01A-22R-A034-07 | (TODO) -- GDC | mRNA__geneExp__FPKM | |
| TCGA-A8-A09I-01A-22R-A034-07 | (TODO) -- GDC | mRNA__counts__FPKM | |
| TCGA-A8-A09K-01A-11R-A00Z-07 | (TODO) -- GDC | mRNA__geneExpNormed__FPKM | |
| TCGA-A8-A09K-01A-11R-A00Z-07 | (TODO) -- GDC | mRNA__geneExp__FPKM | |
| TCGA-A8-A09K-01A-11R-A00Z-07 | (TODO) -- GDC | mRNA__counts__FPKM | |
| TCGA-A8-A09M-01A-11R-A00Z-07 | (TODO) -- GDC | mRNA__geneExpNormed__FPKM | |
| TCGA-A8-A09M-01A-11R-A00Z-07 | (TODO) -- GDC | mRNA__geneExp__FPKM | |
| TCGA-A8-A09M-01A-11R-A00Z-07 | (TODO) -- GDC | mRNA__counts__FPKM | |
| TCGA-A8-A09N-01A-11R-A00Z-07 | (TODO) -- GDC | mRNA__geneExpNormed__FPKM | |
| TCGA-A8-A09N-01A-11R-A00Z-07 | (TODO) -- GDC | mRNA__geneExp__FPKM | |
| TCGA-A8-A09N-01A-11R-A00Z-07 | (TODO) -- GDC | mRNA__counts__FPKM | |
| TCGA-A8-A09Q-01A-11R-A00Z-07 | (TODO) -- GDC | mRNA__geneExpNormed__FPKM | |
| TCGA-A8-A09Q-01A-11R-A00Z-07 | (TODO) -- GDC | mRNA__geneExp__FPKM | |
| TCGA-A8-A09Q-01A-11R-A00Z-07 | (TODO) -- GDC | mRNA__counts__FPKM | |
| TCGA-A8-A09R-01A-11R-A00Z-07 | (TODO) -- GDC | mRNA__geneExpNormed__FPKM | |
| TCGA-A8-A09R-01A-11R-A00Z-07 | (TODO) -- GDC | mRNA__geneExp__FPKM | |
| TCGA-A8-A09R-01A-11R-A00Z-07 | (TODO) -- GDC | mRNA__counts__FPKM | |
| TCGA-A8-A09T-01A-11R-A00Z-07 | (TODO) -- GDC | mRNA__geneExpNormed__FPKM | |
| TCGA-A8-A09T-01A-11R-A00Z-07 | (TODO) -- GDC | mRNA__geneExp__FPKM | |
| TCGA-A8-A09T-01A-11R-A00Z-07 | (TODO) -- GDC | mRNA__counts__FPKM | |
| TCGA-A8-A09V-01A-11R-A034-07 | (TODO) -- GDC | mRNA__geneExpNormed__FPKM | |
| TCGA-A8-A09V-01A-11R-A034-07 | (TODO) -- GDC | mRNA__geneExp__FPKM | |
| TCGA-A8-A09V-01A-11R-A034-07 | (TODO) -- GDC | mRNA__counts__FPKM | |
| TCGA-A8-A09W-01A-11R-A00Z-07 | (TODO) -- GDC | mRNA__geneExpNormed__FPKM | |
| TCGA-A8-A09W-01A-11R-A00Z-07 | (TODO) -- GDC | mRNA__geneExp__FPKM | |
| TCGA-A8-A09W-01A-11R-A00Z-07 | (TODO) -- GDC | mRNA__counts__FPKM | |
| TCGA-A8-A09X-01A-11R-A00Z-07 | (TODO) -- GDC | mRNA__geneExpNormed__FPKM | |
| TCGA-A8-A09X-01A-11R-A00Z-07 | (TODO) -- GDC | mRNA__geneExp__FPKM | |
| TCGA-A8-A09X-01A-11R-A00Z-07 | (TODO) -- GDC | mRNA__counts__FPKM | |
| TCGA-A8-A09Z-01A-11R-A00Z-07 | (TODO) -- GDC | mRNA__geneExpNormed__FPKM | |
| TCGA-A8-A09Z-01A-11R-A00Z-07 | (TODO) -- GDC | mRNA__geneExp__FPKM | |
| TCGA-A8-A09Z-01A-11R-A00Z-07 | (TODO) -- GDC | mRNA__counts__FPKM | |
| TCGA-A8-A0A1-01A-11R-A00Z-07 | (TODO) -- GDC | mRNA__geneExpNormed__FPKM | |
| TCGA-A8-A0A1-01A-11R-A00Z-07 | (TODO) -- GDC | mRNA__geneExp__FPKM | |
| TCGA-A8-A0A1-01A-11R-A00Z-07 | (TODO) -- GDC | mRNA__counts__FPKM | |
| TCGA-A8-A0A2-01A-11R-A034-07 | (TODO) -- GDC | mRNA__geneExpNormed__FPKM | |
| TCGA-A8-A0A2-01A-11R-A034-07 | (TODO) -- GDC | mRNA__geneExp__FPKM | |
| TCGA-A8-A0A2-01A-11R-A034-07 | (TODO) -- GDC | mRNA__counts__FPKM | |
| TCGA-A8-A0A4-01A-11R-A00Z-07 | (TODO) -- GDC | mRNA__geneExpNormed__FPKM | |
| TCGA-A8-A0A4-01A-11R-A00Z-07 | (TODO) -- GDC | mRNA__geneExp__FPKM | |
| TCGA-A8-A0A4-01A-11R-A00Z-07 | (TODO) -- GDC | mRNA__counts__FPKM | |
| TCGA-A8-A0A6-01A-12R-A056-07 | (TODO) -- GDC | mRNA__geneExpNormed__FPKM | |
| TCGA-A8-A0A6-01A-12R-A056-07 | (TODO) -- GDC | mRNA__geneExp__FPKM | |
| TCGA-A8-A0A6-01A-12R-A056-07 | (TODO) -- GDC | mRNA__counts__FPKM | |
| TCGA-A8-A0A7-01A-11R-A00Z-07 | (TODO) -- GDC | mRNA__geneExpNormed__FPKM | |
| TCGA-A8-A0A7-01A-11R-A00Z-07 | (TODO) -- GDC | mRNA__geneExp__FPKM | |
| TCGA-A8-A0A7-01A-11R-A00Z-07 | (TODO) -- GDC | mRNA__counts__FPKM | |
| TCGA-A8-A0A9-01A-11R-A00Z-07 | (TODO) -- GDC | mRNA__geneExpNormed__FPKM | |
| TCGA-A8-A0A9-01A-11R-A00Z-07 | (TODO) -- GDC | mRNA__geneExp__FPKM | |
| TCGA-A8-A0A9-01A-11R-A00Z-07 | (TODO) -- GDC | mRNA__counts__FPKM | |
| TCGA-A8-A0AB-01A-11R-A034-07 | (TODO) -- GDC | mRNA__geneExpNormed__FPKM | |
| TCGA-A8-A0AB-01A-11R-A034-07 | (TODO) -- GDC | mRNA__geneExp__FPKM | |
| TCGA-A8-A0AB-01A-11R-A034-07 | (TODO) -- GDC | mRNA__counts__FPKM | |
| TCGA-A8-A0AD-01A-11R-A056-07 | (TODO) -- GDC | mRNA__geneExpNormed__FPKM | |
| TCGA-A8-A0AD-01A-11R-A056-07 | (TODO) -- GDC | mRNA__geneExp__FPKM | |
| TCGA-A8-A0AD-01A-11R-A056-07 | (TODO) -- GDC | mRNA__counts__FPKM | |
| TCGA-AC-A23C-01A-12R-A169-07 | (TODO) -- GDC | mRNA__geneExpNormed__FPKM | |
| TCGA-AC-A23C-01A-12R-A169-07 | (TODO) -- GDC | mRNA__geneExp__FPKM | |
| TCGA-AC-A23C-01A-12R-A169-07 | (TODO) -- GDC | mRNA__counts__FPKM | |
| TCGA-AC-A23E-01A-11R-A157-07 | (TODO) -- GDC | mRNA__geneExpNormed__FPKM | |
| TCGA-AC-A23E-01A-11R-A157-07 | (TODO) -- GDC | mRNA__geneExp__FPKM | |
| TCGA-AC-A23E-01A-11R-A157-07 | (TODO) -- GDC | mRNA__counts__FPKM | |
| TCGA-AC-A23G-01A-11R-A213-07 | (TODO) -- GDC | mRNA__geneExpNormed__FPKM | |
| TCGA-AC-A23G-01A-11R-A213-07 | (TODO) -- GDC | mRNA__geneExp__FPKM | |
| TCGA-AC-A23G-01A-11R-A213-07 | (TODO) -- GDC | mRNA__counts__FPKM | |
| TCGA-AC-A23H-01A-11R-A157-07 | (TODO) -- GDC | mRNA__geneExpNormed__FPKM | |
| TCGA-AC-A23H-01A-11R-A157-07 | (TODO) -- GDC | mRNA__geneExp__FPKM | |
| TCGA-AC-A23H-01A-11R-A157-07 | (TODO) -- GDC | mRNA__counts__FPKM | |
| TCGA-AC-A2B8-01A-11R-A17B-07 | (TODO) -- GDC | mRNA__geneExpNormed__FPKM | |
| TCGA-AC-A2B8-01A-11R-A17B-07 | (TODO) -- GDC | mRNA__geneExp__FPKM | |
| TCGA-AC-A2B8-01A-11R-A17B-07 | (TODO) -- GDC | mRNA__counts__FPKM | |
| TCGA-AC-A2BK-01A-11R-A21T-07 | (TODO) -- GDC | mRNA__geneExpNormed__FPKM | |
| TCGA-AC-A2BK-01A-11R-A21T-07 | (TODO) -- GDC | mRNA__geneExp__FPKM | |
| TCGA-AC-A2BK-01A-11R-A21T-07 | (TODO) -- GDC | mRNA__counts__FPKM | |
| TCGA-AC-A2BM-01A-11R-A21T-07 | (TODO) -- GDC | mRNA__geneExpNormed__FPKM | |
| TCGA-AC-A2BM-01A-11R-A21T-07 | (TODO) -- GDC | mRNA__geneExp__FPKM | |
| TCGA-AC-A2BM-01A-11R-A21T-07 | (TODO) -- GDC | mRNA__counts__FPKM | |
| TCGA-AC-A2FB-01A-11R-A17B-07 | (TODO) -- GDC | mRNA__geneExpNormed__FPKM | |
| TCGA-AC-A2FB-01A-11R-A17B-07 | (TODO) -- GDC | mRNA__geneExp__FPKM | |
| TCGA-AC-A2FB-01A-11R-A17B-07 | (TODO) -- GDC | mRNA__counts__FPKM | |
| TCGA-AC-A2FE-01A-11R-A19W-07 | (TODO) -- GDC | mRNA__geneExpNormed__FPKM | |
| TCGA-AC-A2FE-01A-11R-A19W-07 | (TODO) -- GDC | mRNA__geneExp__FPKM | |
| TCGA-AC-A2FE-01A-11R-A19W-07 | (TODO) -- GDC | mRNA__counts__FPKM | |
| TCGA-AC-A2FF-01A-11R-A17B-07 | (TODO) -- GDC | mRNA__geneExpNormed__FPKM | |
| TCGA-AC-A2FF-01A-11R-A17B-07 | (TODO) -- GDC | mRNA__geneExp__FPKM | |
| TCGA-AC-A2FF-01A-11R-A17B-07 | (TODO) -- GDC | mRNA__counts__FPKM | |
| TCGA-AC-A2FG-01A-11R-A17B-07 | (TODO) -- GDC | mRNA__geneExpNormed__FPKM | |
| TCGA-AC-A2FG-01A-11R-A17B-07 | (TODO) -- GDC | mRNA__geneExp__FPKM | |
| TCGA-AC-A2FG-01A-11R-A17B-07 | (TODO) -- GDC | mRNA__counts__FPKM | |
| TCGA-AC-A2FK-01A-12R-A180-07 | (TODO) -- GDC | mRNA__geneExpNormed__FPKM | |
| TCGA-AC-A2FK-01A-12R-A180-07 | (TODO) -- GDC | mRNA__geneExp__FPKM | |
| TCGA-AC-A2FK-01A-12R-A180-07 | (TODO) -- GDC | mRNA__counts__FPKM | |
| TCGA-AC-A2FM-01A-11R-A19W-07 | (TODO) -- GDC | mRNA__geneExpNormed__FPKM | |
| TCGA-AC-A2FM-01A-11R-A19W-07 | (TODO) -- GDC | mRNA__geneExp__FPKM | |
| TCGA-AC-A2FM-01A-11R-A19W-07 | (TODO) -- GDC | mRNA__counts__FPKM | |
| TCGA-AC-A2FO-01A-11R-A180-07 | (TODO) -- GDC | mRNA__geneExpNormed__FPKM | |
| TCGA-AC-A2FO-01A-11R-A180-07 | (TODO) -- GDC | mRNA__geneExp__FPKM | |
| TCGA-AC-A2FO-01A-11R-A180-07 | (TODO) -- GDC | mRNA__counts__FPKM | |
| TCGA-AC-A2QI-01A-12R-A19W-07 | (TODO) -- GDC | mRNA__geneExpNormed__FPKM | |
| TCGA-AC-A2QI-01A-12R-A19W-07 | (TODO) -- GDC | mRNA__geneExp__FPKM | |
| TCGA-AC-A2QI-01A-12R-A19W-07 | (TODO) -- GDC | mRNA__counts__FPKM | |
| TCGA-AC-A2QJ-01A-12R-A19W-07 | (TODO) -- GDC | mRNA__geneExpNormed__FPKM | |
| TCGA-AC-A2QJ-01A-12R-A19W-07 | (TODO) -- GDC | mRNA__geneExp__FPKM | |
| TCGA-AC-A2QJ-01A-12R-A19W-07 | (TODO) -- GDC | mRNA__counts__FPKM | |
| TCGA-AC-A3BB-01A-21R-A19W-07 | (TODO) -- GDC | mRNA__geneExpNormed__FPKM | |
| TCGA-AC-A3BB-01A-21R-A19W-07 | (TODO) -- GDC | mRNA__geneExp__FPKM | |
| TCGA-AC-A3BB-01A-21R-A19W-07 | (TODO) -- GDC | mRNA__counts__FPKM | |
| TCGA-AC-A3EH-01A-22R-A22K-07 | (TODO) -- GDC | mRNA__geneExpNormed__FPKM | |
| TCGA-AC-A3EH-01A-22R-A22K-07 | (TODO) -- GDC | mRNA__geneExp__FPKM | |
| TCGA-AC-A3EH-01A-22R-A22K-07 | (TODO) -- GDC | mRNA__counts__FPKM | |
| TCGA-AC-A3HN-01A-11R-A213-07 | (TODO) -- GDC | mRNA__geneExpNormed__FPKM | |
| TCGA-AC-A3HN-01A-11R-A213-07 | (TODO) -- GDC | mRNA__geneExp__FPKM | |
| TCGA-AC-A3HN-01A-11R-A213-07 | (TODO) -- GDC | mRNA__counts__FPKM | |
| TCGA-AC-A3QP-01A-11R-A22U-07 | (TODO) -- GDC | mRNA__geneExpNormed__FPKM | |
| TCGA-AC-A3QP-01A-11R-A22U-07 | (TODO) -- GDC | mRNA__geneExp__FPKM | |
| TCGA-AC-A3QP-01A-11R-A22U-07 | (TODO) -- GDC | mRNA__counts__FPKM | |
| TCGA-AC-A3TM-01A-11R-A22K-07 | (TODO) -- GDC | mRNA__geneExpNormed__FPKM | |
| TCGA-AC-A3TM-01A-11R-A22K-07 | (TODO) -- GDC | mRNA__geneExp__FPKM | |
| TCGA-AC-A3TM-01A-11R-A22K-07 | (TODO) -- GDC | mRNA__counts__FPKM | |
| TCGA-AC-A3TN-01A-11R-A22K-07 | (TODO) -- GDC | mRNA__geneExpNormed__FPKM | |
| TCGA-AC-A3TN-01A-11R-A22K-07 | (TODO) -- GDC | mRNA__geneExp__FPKM | |
| TCGA-AC-A3TN-01A-11R-A22K-07 | (TODO) -- GDC | mRNA__counts__FPKM | |
| TCGA-AC-A3W5-01A-11R-A22K-07 | (TODO) -- GDC | mRNA__geneExpNormed__FPKM | |
| TCGA-AC-A3W5-01A-11R-A22K-07 | (TODO) -- GDC | mRNA__geneExp__FPKM | |
| TCGA-AC-A3W5-01A-11R-A22K-07 | (TODO) -- GDC | mRNA__counts__FPKM | |
| TCGA-AC-A3W6-01A-12R-A22K-07 | (TODO) -- GDC | mRNA__geneExpNormed__FPKM | |
| TCGA-AC-A3W6-01A-12R-A22K-07 | (TODO) -- GDC | mRNA__geneExp__FPKM | |
| TCGA-AC-A3W6-01A-12R-A22K-07 | (TODO) -- GDC | mRNA__counts__FPKM | |
| TCGA-AC-A3W7-01A-11R-A22K-07 | (TODO) -- GDC | mRNA__geneExpNormed__FPKM | |
| TCGA-AC-A3W7-01A-11R-A22K-07 | (TODO) -- GDC | mRNA__geneExp__FPKM | |
| TCGA-AC-A3W7-01A-11R-A22K-07 | (TODO) -- GDC | mRNA__counts__FPKM | |
| TCGA-AC-A3YI-01A-21R-A239-07 | (TODO) -- GDC | mRNA__geneExpNormed__FPKM | |
| TCGA-AC-A3YI-01A-21R-A239-07 | (TODO) -- GDC | mRNA__geneExp__FPKM | |
| TCGA-AC-A3YI-01A-21R-A239-07 | (TODO) -- GDC | mRNA__counts__FPKM | |
| TCGA-AC-A3YJ-01A-11R-A22U-07 | (TODO) -- GDC | mRNA__geneExpNormed__FPKM | |
| TCGA-AC-A3YJ-01A-11R-A22U-07 | (TODO) -- GDC | mRNA__geneExp__FPKM | |
| TCGA-AC-A3YJ-01A-11R-A22U-07 | (TODO) -- GDC | mRNA__counts__FPKM | |
| TCGA-AC-A4ZE-01A-11R-A41B-07 | (TODO) -- GDC | mRNA__geneExpNormed__FPKM | |
| TCGA-AC-A4ZE-01A-11R-A41B-07 | (TODO) -- GDC | mRNA__geneExp__FPKM | |
| TCGA-AC-A4ZE-01A-11R-A41B-07 | (TODO) -- GDC | mRNA__counts__FPKM | |
| TCGA-AC-A5EH-01A-11R-A28M-07 | (TODO) -- GDC | mRNA__geneExpNormed__FPKM | |
| TCGA-AC-A5EH-01A-11R-A28M-07 | (TODO) -- GDC | mRNA__geneExp__FPKM | |
| TCGA-AC-A5EH-01A-11R-A28M-07 | (TODO) -- GDC | mRNA__counts__FPKM | |
| TCGA-AC-A5XS-01A-11R-A29R-07 | (TODO) -- GDC | mRNA__geneExpNormed__FPKM | |
| TCGA-AC-A5XS-01A-11R-A29R-07 | (TODO) -- GDC | mRNA__geneExp__FPKM | |
| TCGA-AC-A5XS-01A-11R-A29R-07 | (TODO) -- GDC | mRNA__counts__FPKM | |
| TCGA-AC-A5XU-01A-11R-A28M-07 | (TODO) -- GDC | mRNA__geneExpNormed__FPKM | |
| TCGA-AC-A5XU-01A-11R-A28M-07 | (TODO) -- GDC | mRNA__geneExp__FPKM | |
| TCGA-AC-A5XU-01A-11R-A28M-07 | (TODO) -- GDC | mRNA__counts__FPKM | |
| TCGA-AC-A62V-01A-11R-A31O-07 | (TODO) -- GDC | mRNA__geneExpNormed__FPKM | |
| TCGA-AC-A62V-01A-11R-A31O-07 | (TODO) -- GDC | mRNA__geneExp__FPKM | |
| TCGA-AC-A62V-01A-11R-A31O-07 | (TODO) -- GDC | mRNA__counts__FPKM | |
| TCGA-AC-A62X-01A-11R-A29R-07 | (TODO) -- GDC | mRNA__geneExpNormed__FPKM | |
| TCGA-AC-A62X-01A-11R-A29R-07 | (TODO) -- GDC | mRNA__geneExp__FPKM | |
| TCGA-AC-A62X-01A-11R-A29R-07 | (TODO) -- GDC | mRNA__counts__FPKM | |
| TCGA-AC-A62Y-01A-11R-A29R-07 | (TODO) -- GDC | mRNA__geneExpNormed__FPKM | |
| TCGA-AC-A62Y-01A-11R-A29R-07 | (TODO) -- GDC | mRNA__geneExp__FPKM | |
| TCGA-AC-A62Y-01A-11R-A29R-07 | (TODO) -- GDC | mRNA__counts__FPKM | |
| TCGA-AC-A6IV-01A-12R-A33J-07 | (TODO) -- GDC | mRNA__geneExpNormed__FPKM | |
| TCGA-AC-A6IV-01A-12R-A33J-07 | (TODO) -- GDC | mRNA__geneExp__FPKM | |
| TCGA-AC-A6IV-01A-12R-A33J-07 | (TODO) -- GDC | mRNA__counts__FPKM | |
| TCGA-AC-A6IW-01A-12R-A33J-07 | (TODO) -- GDC | mRNA__geneExpNormed__FPKM | |
| TCGA-AC-A6IW-01A-12R-A33J-07 | (TODO) -- GDC | mRNA__geneExp__FPKM | |
| TCGA-AC-A6IW-01A-12R-A33J-07 | (TODO) -- GDC | mRNA__counts__FPKM | |
| TCGA-AC-A6IX-01A-12R-A32P-07 | (TODO) -- GDC | mRNA__geneExpNormed__FPKM | |
| TCGA-AC-A6IX-01A-12R-A32P-07 | (TODO) -- GDC | mRNA__geneExp__FPKM | |
| TCGA-AC-A6IX-01A-12R-A32P-07 | (TODO) -- GDC | mRNA__counts__FPKM | |
| TCGA-AC-A6NO-01A-12R-A33J-07 | (TODO) -- GDC | mRNA__geneExpNormed__FPKM | |
| TCGA-AC-A6NO-01A-12R-A33J-07 | (TODO) -- GDC | mRNA__geneExp__FPKM | |
| TCGA-AC-A6NO-01A-12R-A33J-07 | (TODO) -- GDC | mRNA__counts__FPKM | |
| TCGA-AC-A7VB-01A-11R-A352-07 | (TODO) -- GDC | mRNA__geneExpNormed__FPKM | |
| TCGA-AC-A7VB-01A-11R-A352-07 | (TODO) -- GDC | mRNA__geneExp__FPKM | |
| TCGA-AC-A7VB-01A-11R-A352-07 | (TODO) -- GDC | mRNA__counts__FPKM | |
| TCGA-AC-A7VC-01A-11R-A352-07 | (TODO) -- GDC | mRNA__geneExpNormed__FPKM | |
| TCGA-AC-A7VC-01A-11R-A352-07 | (TODO) -- GDC | mRNA__geneExp__FPKM | |
| TCGA-AC-A7VC-01A-11R-A352-07 | (TODO) -- GDC | mRNA__counts__FPKM | |
| TCGA-AC-A8OP-01A-11R-A36F-07 | (TODO) -- GDC | mRNA__geneExpNormed__FPKM | |
| TCGA-AC-A8OP-01A-11R-A36F-07 | (TODO) -- GDC | mRNA__geneExp__FPKM | |
| TCGA-AC-A8OP-01A-11R-A36F-07 | (TODO) -- GDC | mRNA__counts__FPKM | |
| TCGA-AC-A8OQ-01A-11R-A41B-07 | (TODO) -- GDC | mRNA__geneExpNormed__FPKM | |
| TCGA-AC-A8OQ-01A-11R-A41B-07 | (TODO) -- GDC | mRNA__geneExp__FPKM | |
| TCGA-AC-A8OQ-01A-11R-A41B-07 | (TODO) -- GDC | mRNA__counts__FPKM | |
| TCGA-AC-A8OR-01A-21R-A41B-07 | (TODO) -- GDC | mRNA__geneExpNormed__FPKM | |
| TCGA-AC-A8OR-01A-21R-A41B-07 | (TODO) -- GDC | mRNA__geneExp__FPKM | |
| TCGA-AC-A8OR-01A-21R-A41B-07 | (TODO) -- GDC | mRNA__counts__FPKM | |
| TCGA-AC-A8OS-01A-12R-A41B-07 | (TODO) -- GDC | mRNA__geneExpNormed__FPKM | |
| TCGA-AC-A8OS-01A-12R-A41B-07 | (TODO) -- GDC | mRNA__geneExp__FPKM | |
| TCGA-AC-A8OS-01A-12R-A41B-07 | (TODO) -- GDC | mRNA__counts__FPKM | |
| TCGA-AN-A03X-01A-21R-A00Z-07 | (TODO) -- GDC | mRNA__geneExpNormed__FPKM | |
| TCGA-AN-A03X-01A-21R-A00Z-07 | (TODO) -- GDC | mRNA__geneExp__FPKM | |
| TCGA-AN-A03X-01A-21R-A00Z-07 | (TODO) -- GDC | mRNA__counts__FPKM | |
| TCGA-AN-A03Y-01A-21R-A00Z-07 | (TODO) -- GDC | mRNA__geneExpNormed__FPKM | |
| TCGA-AN-A03Y-01A-21R-A00Z-07 | (TODO) -- GDC | mRNA__geneExp__FPKM | |
| TCGA-AN-A03Y-01A-21R-A00Z-07 | (TODO) -- GDC | mRNA__counts__FPKM | |
| TCGA-AN-A041-01A-11R-A034-07 | (TODO) -- GDC | mRNA__geneExpNormed__FPKM | |
| TCGA-AN-A041-01A-11R-A034-07 | (TODO) -- GDC | mRNA__geneExp__FPKM | |
| TCGA-AN-A041-01A-11R-A034-07 | (TODO) -- GDC | mRNA__counts__FPKM | |
| TCGA-AN-A046-01A-21R-A034-07 | (TODO) -- GDC | mRNA__geneExpNormed__FPKM | |
| TCGA-AN-A046-01A-21R-A034-07 | (TODO) -- GDC | mRNA__geneExp__FPKM | |
| TCGA-AN-A046-01A-21R-A034-07 | (TODO) -- GDC | mRNA__counts__FPKM | |
| TCGA-AN-A049-01A-21R-A00Z-07 | (TODO) -- GDC | mRNA__geneExpNormed__FPKM | |
| TCGA-AN-A049-01A-21R-A00Z-07 | (TODO) -- GDC | mRNA__geneExp__FPKM | |
| TCGA-AN-A049-01A-21R-A00Z-07 | (TODO) -- GDC | mRNA__counts__FPKM | |
| TCGA-AN-A04A-01A-21R-A034-07 | (TODO) -- GDC | mRNA__geneExpNormed__FPKM | |
| TCGA-AN-A04A-01A-21R-A034-07 | (TODO) -- GDC | mRNA__geneExp__FPKM | |
| TCGA-AN-A04A-01A-21R-A034-07 | (TODO) -- GDC | mRNA__counts__FPKM | |
| TCGA-AN-A04C-01A-21R-A034-07 | (TODO) -- GDC | mRNA__geneExpNormed__FPKM | |
| TCGA-AN-A04C-01A-21R-A034-07 | (TODO) -- GDC | mRNA__geneExp__FPKM | |
| TCGA-AN-A04C-01A-21R-A034-07 | (TODO) -- GDC | mRNA__counts__FPKM | |
| TCGA-AN-A04D-01A-21R-A034-07 | (TODO) -- GDC | mRNA__geneExpNormed__FPKM | |
| TCGA-AN-A04D-01A-21R-A034-07 | (TODO) -- GDC | mRNA__geneExp__FPKM | |
| TCGA-AN-A04D-01A-21R-A034-07 | (TODO) -- GDC | mRNA__counts__FPKM | |
| TCGA-AN-A0AJ-01A-11R-A00Z-07 | (TODO) -- GDC | mRNA__geneExpNormed__FPKM | |
| TCGA-AN-A0AJ-01A-11R-A00Z-07 | (TODO) -- GDC | mRNA__geneExp__FPKM | |
| TCGA-AN-A0AJ-01A-11R-A00Z-07 | (TODO) -- GDC | mRNA__counts__FPKM | |
| TCGA-AN-A0AK-01A-21R-A00Z-07 | (TODO) -- GDC | mRNA__geneExpNormed__FPKM | |
| TCGA-AN-A0AK-01A-21R-A00Z-07 | (TODO) -- GDC | mRNA__geneExp__FPKM | |
| TCGA-AN-A0AK-01A-21R-A00Z-07 | (TODO) -- GDC | mRNA__counts__FPKM | |
| TCGA-AN-A0AL-01A-11R-A00Z-07 | (TODO) -- GDC | mRNA__geneExpNormed__FPKM | |
| TCGA-AN-A0AL-01A-11R-A00Z-07 | (TODO) -- GDC | mRNA__geneExp__FPKM | |
| TCGA-AN-A0AL-01A-11R-A00Z-07 | (TODO) -- GDC | mRNA__counts__FPKM | |
| TCGA-AN-A0AM-01A-11R-A034-07 | (TODO) -- GDC | mRNA__geneExpNormed__FPKM | |
| TCGA-AN-A0AM-01A-11R-A034-07 | (TODO) -- GDC | mRNA__geneExp__FPKM | |
| TCGA-AN-A0AM-01A-11R-A034-07 | (TODO) -- GDC | mRNA__counts__FPKM | |
| TCGA-AN-A0AR-01A-11R-A00Z-07 | (TODO) -- GDC | mRNA__geneExpNormed__FPKM | |
| TCGA-AN-A0AR-01A-11R-A00Z-07 | (TODO) -- GDC | mRNA__geneExp__FPKM | |
| TCGA-AN-A0AR-01A-11R-A00Z-07 | (TODO) -- GDC | mRNA__counts__FPKM | |
| TCGA-AN-A0AS-01A-11R-A00Z-07 | (TODO) -- GDC | mRNA__geneExpNormed__FPKM | |
| TCGA-AN-A0AS-01A-11R-A00Z-07 | (TODO) -- GDC | mRNA__geneExp__FPKM | |
| TCGA-AN-A0AS-01A-11R-A00Z-07 | (TODO) -- GDC | mRNA__counts__FPKM | |
| TCGA-AN-A0AT-01A-11R-A034-07 | (TODO) -- GDC | mRNA__geneExpNormed__FPKM | |
| TCGA-AN-A0AT-01A-11R-A034-07 | (TODO) -- GDC | mRNA__geneExp__FPKM | |
| TCGA-AN-A0AT-01A-11R-A034-07 | (TODO) -- GDC | mRNA__counts__FPKM | |
| TCGA-AN-A0FD-01A-11R-A034-07 | (TODO) -- GDC | mRNA__geneExpNormed__FPKM | |
| TCGA-AN-A0FD-01A-11R-A034-07 | (TODO) -- GDC | mRNA__geneExp__FPKM | |
| TCGA-AN-A0FD-01A-11R-A034-07 | (TODO) -- GDC | mRNA__counts__FPKM | |
| TCGA-AN-A0FF-01A-11R-A034-07 | (TODO) -- GDC | mRNA__geneExpNormed__FPKM | |
| TCGA-AN-A0FF-01A-11R-A034-07 | (TODO) -- GDC | mRNA__geneExp__FPKM | |
| TCGA-AN-A0FF-01A-11R-A034-07 | (TODO) -- GDC | mRNA__counts__FPKM | |
| TCGA-AN-A0FJ-01A-11R-A00Z-07 | (TODO) -- GDC | mRNA__geneExpNormed__FPKM | |
| TCGA-AN-A0FJ-01A-11R-A00Z-07 | (TODO) -- GDC | mRNA__geneExp__FPKM | |
| TCGA-AN-A0FJ-01A-11R-A00Z-07 | (TODO) -- GDC | mRNA__counts__FPKM | |
| TCGA-AN-A0FK-01A-11R-A034-07 | (TODO) -- GDC | mRNA__geneExpNormed__FPKM | |
| TCGA-AN-A0FK-01A-11R-A034-07 | (TODO) -- GDC | mRNA__geneExp__FPKM | |
| TCGA-AN-A0FK-01A-11R-A034-07 | (TODO) -- GDC | mRNA__counts__FPKM | |
| TCGA-AN-A0FL-01A-11R-A034-07 | (TODO) -- GDC | mRNA__geneExpNormed__FPKM | |
| TCGA-AN-A0FL-01A-11R-A034-07 | (TODO) -- GDC | mRNA__geneExp__FPKM | |
| TCGA-AN-A0FL-01A-11R-A034-07 | (TODO) -- GDC | mRNA__counts__FPKM | |
| TCGA-AN-A0FN-01A-11R-A034-07 | (TODO) -- GDC | mRNA__geneExpNormed__FPKM | |
| TCGA-AN-A0FN-01A-11R-A034-07 | (TODO) -- GDC | mRNA__geneExp__FPKM | |
| TCGA-AN-A0FN-01A-11R-A034-07 | (TODO) -- GDC | mRNA__counts__FPKM | |
| TCGA-AN-A0FS-01A-11R-A034-07 | (TODO) -- GDC | mRNA__geneExpNormed__FPKM | |
| TCGA-AN-A0FS-01A-11R-A034-07 | (TODO) -- GDC | mRNA__geneExp__FPKM | |
| TCGA-AN-A0FS-01A-11R-A034-07 | (TODO) -- GDC | mRNA__counts__FPKM | |
| TCGA-AN-A0FT-01A-11R-A034-07 | (TODO) -- GDC | mRNA__geneExpNormed__FPKM | |
| TCGA-AN-A0FT-01A-11R-A034-07 | (TODO) -- GDC | mRNA__geneExp__FPKM | |
| TCGA-AN-A0FT-01A-11R-A034-07 | (TODO) -- GDC | mRNA__counts__FPKM | |
| TCGA-AN-A0FV-01A-11R-A00Z-07 | (TODO) -- GDC | mRNA__geneExpNormed__FPKM | |
| TCGA-AN-A0FV-01A-11R-A00Z-07 | (TODO) -- GDC | mRNA__geneExp__FPKM | |
| TCGA-AN-A0FV-01A-11R-A00Z-07 | (TODO) -- GDC | mRNA__counts__FPKM | |
| TCGA-AN-A0FW-01A-11R-A034-07 | (TODO) -- GDC | mRNA__geneExpNormed__FPKM | |
| TCGA-AN-A0FW-01A-11R-A034-07 | (TODO) -- GDC | mRNA__geneExp__FPKM | |
| TCGA-AN-A0FW-01A-11R-A034-07 | (TODO) -- GDC | mRNA__counts__FPKM | |
| TCGA-AN-A0FX-01A-11R-A034-07 | (TODO) -- GDC | mRNA__geneExpNormed__FPKM | |
| TCGA-AN-A0FX-01A-11R-A034-07 | (TODO) -- GDC | mRNA__geneExp__FPKM | |
| TCGA-AN-A0FX-01A-11R-A034-07 | (TODO) -- GDC | mRNA__counts__FPKM | |
| TCGA-AN-A0FY-01A-11R-A034-07 | (TODO) -- GDC | mRNA__geneExpNormed__FPKM | |
| TCGA-AN-A0FY-01A-11R-A034-07 | (TODO) -- GDC | mRNA__geneExp__FPKM | |
| TCGA-AN-A0FY-01A-11R-A034-07 | (TODO) -- GDC | mRNA__counts__FPKM | |
| TCGA-AN-A0FZ-01A-11R-A034-07 | (TODO) -- GDC | mRNA__geneExpNormed__FPKM | |
| TCGA-AN-A0FZ-01A-11R-A034-07 | (TODO) -- GDC | mRNA__geneExp__FPKM | |
| TCGA-AN-A0FZ-01A-11R-A034-07 | (TODO) -- GDC | mRNA__counts__FPKM | |
| TCGA-AN-A0G0-01A-11R-A034-07 | (TODO) -- GDC | mRNA__geneExpNormed__FPKM | |
| TCGA-AN-A0G0-01A-11R-A034-07 | (TODO) -- GDC | mRNA__geneExp__FPKM | |
| TCGA-AN-A0G0-01A-11R-A034-07 | (TODO) -- GDC | mRNA__counts__FPKM | |
| TCGA-AN-A0XL-01A-11R-A10J-07 | (TODO) -- GDC | mRNA__geneExpNormed__FPKM | |
| TCGA-AN-A0XL-01A-11R-A10J-07 | (TODO) -- GDC | mRNA__geneExp__FPKM | |
| TCGA-AN-A0XL-01A-11R-A10J-07 | (TODO) -- GDC | mRNA__counts__FPKM | |
| TCGA-AN-A0XN-01A-21R-A109-07 | (TODO) -- GDC | mRNA__geneExpNormed__FPKM | |
| TCGA-AN-A0XN-01A-21R-A109-07 | (TODO) -- GDC | mRNA__geneExp__FPKM | |
| TCGA-AN-A0XN-01A-21R-A109-07 | (TODO) -- GDC | mRNA__counts__FPKM | |
| TCGA-AN-A0XO-01A-11R-A109-07 | (TODO) -- GDC | mRNA__geneExpNormed__FPKM | |
| TCGA-AN-A0XO-01A-11R-A109-07 | (TODO) -- GDC | mRNA__geneExp__FPKM | |
| TCGA-AN-A0XO-01A-11R-A109-07 | (TODO) -- GDC | mRNA__counts__FPKM | |
| TCGA-AN-A0XP-01A-11R-A109-07 | (TODO) -- GDC | mRNA__geneExpNormed__FPKM | |
| TCGA-AN-A0XP-01A-11R-A109-07 | (TODO) -- GDC | mRNA__geneExp__FPKM | |
| TCGA-AN-A0XP-01A-11R-A109-07 | (TODO) -- GDC | mRNA__counts__FPKM | |
| TCGA-AN-A0XR-01A-11R-A109-07 | (TODO) -- GDC | mRNA__geneExpNormed__FPKM | |
| TCGA-AN-A0XR-01A-11R-A109-07 | (TODO) -- GDC | mRNA__geneExp__FPKM | |
| TCGA-AN-A0XR-01A-11R-A109-07 | (TODO) -- GDC | mRNA__counts__FPKM | |
| TCGA-AN-A0XS-01A-22R-A109-07 | (TODO) -- GDC | mRNA__geneExpNormed__FPKM | |
| TCGA-AN-A0XS-01A-22R-A109-07 | (TODO) -- GDC | mRNA__geneExp__FPKM | |
| TCGA-AN-A0XS-01A-22R-A109-07 | (TODO) -- GDC | mRNA__counts__FPKM | |
| TCGA-AN-A0XT-01A-11R-A109-07 | (TODO) -- GDC | mRNA__geneExpNormed__FPKM | |
| TCGA-AN-A0XT-01A-11R-A109-07 | (TODO) -- GDC | mRNA__geneExp__FPKM | |
| TCGA-AN-A0XT-01A-11R-A109-07 | (TODO) -- GDC | mRNA__counts__FPKM | |
| TCGA-AN-A0XU-01A-11R-A109-07 | (TODO) -- GDC | mRNA__geneExpNormed__FPKM | |
| TCGA-AN-A0XU-01A-11R-A109-07 | (TODO) -- GDC | mRNA__geneExp__FPKM | |
| TCGA-AN-A0XU-01A-11R-A109-07 | (TODO) -- GDC | mRNA__counts__FPKM | |
| TCGA-AN-A0XV-01A-11R-A109-07 | (TODO) -- GDC | mRNA__geneExpNormed__FPKM | |
| TCGA-AN-A0XV-01A-11R-A109-07 | (TODO) -- GDC | mRNA__geneExp__FPKM | |
| TCGA-AN-A0XV-01A-11R-A109-07 | (TODO) -- GDC | mRNA__counts__FPKM | |
| TCGA-AN-A0XW-01A-11R-A109-07 | (TODO) -- GDC | mRNA__geneExpNormed__FPKM | |
| TCGA-AN-A0XW-01A-11R-A109-07 | (TODO) -- GDC | mRNA__geneExp__FPKM | |
| TCGA-AN-A0XW-01A-11R-A109-07 | (TODO) -- GDC | mRNA__counts__FPKM | |
| TCGA-AO-A03L-01A-41R-A056-07 | (TODO) -- GDC | mRNA__geneExpNormed__FPKM | |
| TCGA-AO-A03L-01A-41R-A056-07 | (TODO) -- GDC | mRNA__geneExp__FPKM | |
| TCGA-AO-A03L-01A-41R-A056-07 | (TODO) -- GDC | mRNA__counts__FPKM | |
| TCGA-AO-A03M-01B-11R-A10J-07 | (TODO) -- GDC | mRNA__geneExpNormed__FPKM | |
| TCGA-AO-A03M-01B-11R-A10J-07 | (TODO) -- GDC | mRNA__geneExp__FPKM | |
| TCGA-AO-A03M-01B-11R-A10J-07 | (TODO) -- GDC | mRNA__counts__FPKM | |
| TCGA-AO-A03N-01B-11R-A10J-07 | (TODO) -- GDC | mRNA__geneExpNormed__FPKM | |
| TCGA-AO-A03N-01B-11R-A10J-07 | (TODO) -- GDC | mRNA__geneExp__FPKM | |
| TCGA-AO-A03N-01B-11R-A10J-07 | (TODO) -- GDC | mRNA__counts__FPKM | |
| TCGA-AO-A03O-01A-11R-A00Z-07 | (TODO) -- GDC | mRNA__geneExpNormed__FPKM | |
| TCGA-AO-A03O-01A-11R-A00Z-07 | (TODO) -- GDC | mRNA__geneExp__FPKM | |
| TCGA-AO-A03O-01A-11R-A00Z-07 | (TODO) -- GDC | mRNA__counts__FPKM | |
| TCGA-AO-A03P-01A-11R-A00Z-07 | (TODO) -- GDC | mRNA__geneExpNormed__FPKM | |
| TCGA-AO-A03P-01A-11R-A00Z-07 | (TODO) -- GDC | mRNA__geneExp__FPKM | |
| TCGA-AO-A03P-01A-11R-A00Z-07 | (TODO) -- GDC | mRNA__counts__FPKM | |
| TCGA-AO-A03R-01A-21R-A034-07 | (TODO) -- GDC | mRNA__geneExpNormed__FPKM | |
| TCGA-AO-A03R-01A-21R-A034-07 | (TODO) -- GDC | mRNA__geneExp__FPKM | |
| TCGA-AO-A03R-01A-21R-A034-07 | (TODO) -- GDC | mRNA__counts__FPKM | |
| TCGA-AO-A03T-01A-21R-A034-07 | (TODO) -- GDC | mRNA__geneExpNormed__FPKM | |
| TCGA-AO-A03T-01A-21R-A034-07 | (TODO) -- GDC | mRNA__geneExp__FPKM | |
| TCGA-AO-A03T-01A-21R-A034-07 | (TODO) -- GDC | mRNA__counts__FPKM | |
| TCGA-AO-A03U-01B-21R-A10J-07 | (TODO) -- GDC | mRNA__geneExpNormed__FPKM | |
| TCGA-AO-A03U-01B-21R-A10J-07 | (TODO) -- GDC | mRNA__geneExp__FPKM | |
| TCGA-AO-A03U-01B-21R-A10J-07 | (TODO) -- GDC | mRNA__counts__FPKM | |
| TCGA-AO-A03V-01A-11R-A115-07 | (TODO) -- GDC | mRNA__geneExpNormed__FPKM | |
| TCGA-AO-A03V-01A-11R-A115-07 | (TODO) -- GDC | mRNA__geneExp__FPKM | |
| TCGA-AO-A03V-01A-11R-A115-07 | (TODO) -- GDC | mRNA__counts__FPKM | |
| TCGA-AO-A0J2-01A-11R-A034-07 | (TODO) -- GDC | mRNA__geneExpNormed__FPKM | |
| TCGA-AO-A0J2-01A-11R-A034-07 | (TODO) -- GDC | mRNA__geneExp__FPKM | |
| TCGA-AO-A0J2-01A-11R-A034-07 | (TODO) -- GDC | mRNA__counts__FPKM | |
| TCGA-AO-A0J3-01A-11R-A034-07 | (TODO) -- GDC | mRNA__geneExpNormed__FPKM | |
| TCGA-AO-A0J3-01A-11R-A034-07 | (TODO) -- GDC | mRNA__geneExp__FPKM | |
| TCGA-AO-A0J3-01A-11R-A034-07 | (TODO) -- GDC | mRNA__counts__FPKM | |
| TCGA-AO-A0J4-01A-11R-A034-07 | (TODO) -- GDC | mRNA__geneExpNormed__FPKM | |
| TCGA-AO-A0J4-01A-11R-A034-07 | (TODO) -- GDC | mRNA__geneExp__FPKM | |
| TCGA-AO-A0J4-01A-11R-A034-07 | (TODO) -- GDC | mRNA__counts__FPKM | |
| TCGA-AO-A0J5-01A-11R-A034-07 | (TODO) -- GDC | mRNA__geneExpNormed__FPKM | |
| TCGA-AO-A0J5-01A-11R-A034-07 | (TODO) -- GDC | mRNA__geneExp__FPKM | |
| TCGA-AO-A0J5-01A-11R-A034-07 | (TODO) -- GDC | mRNA__counts__FPKM | |
| TCGA-AO-A0J6-01A-11R-A034-07 | (TODO) -- GDC | mRNA__geneExpNormed__FPKM | |
| TCGA-AO-A0J6-01A-11R-A034-07 | (TODO) -- GDC | mRNA__geneExp__FPKM | |
| TCGA-AO-A0J6-01A-11R-A034-07 | (TODO) -- GDC | mRNA__counts__FPKM | |
| TCGA-AO-A0J7-01A-11R-A034-07 | (TODO) -- GDC | mRNA__geneExpNormed__FPKM | |
| TCGA-AO-A0J7-01A-11R-A034-07 | (TODO) -- GDC | mRNA__geneExp__FPKM | |
| TCGA-AO-A0J7-01A-11R-A034-07 | (TODO) -- GDC | mRNA__counts__FPKM | |
| TCGA-AO-A0J8-01A-21R-A034-07 | (TODO) -- GDC | mRNA__geneExpNormed__FPKM | |
| TCGA-AO-A0J8-01A-21R-A034-07 | (TODO) -- GDC | mRNA__geneExp__FPKM | |
| TCGA-AO-A0J8-01A-21R-A034-07 | (TODO) -- GDC | mRNA__counts__FPKM | |
| TCGA-AO-A0J9-01A-11R-A034-07 | (TODO) -- GDC | mRNA__geneExpNormed__FPKM | |
| TCGA-AO-A0J9-01A-11R-A034-07 | (TODO) -- GDC | mRNA__geneExp__FPKM | |
| TCGA-AO-A0J9-01A-11R-A034-07 | (TODO) -- GDC | mRNA__counts__FPKM | |
| TCGA-AO-A0JA-01A-11R-A056-07 | (TODO) -- GDC | mRNA__geneExpNormed__FPKM | |
| TCGA-AO-A0JA-01A-11R-A056-07 | (TODO) -- GDC | mRNA__geneExp__FPKM | |
| TCGA-AO-A0JA-01A-11R-A056-07 | (TODO) -- GDC | mRNA__counts__FPKM | |
| TCGA-AO-A0JB-01A-11R-A32Y-07 | (TODO) -- GDC | mRNA__geneExpNormed__FPKM | |
| TCGA-AO-A0JB-01A-11R-A32Y-07 | (TODO) -- GDC | mRNA__geneExp__FPKM | |
| TCGA-AO-A0JB-01A-11R-A32Y-07 | (TODO) -- GDC | mRNA__counts__FPKM | |
| TCGA-AO-A0JC-01A-11R-A056-07 | (TODO) -- GDC | mRNA__geneExpNormed__FPKM | |
| TCGA-AO-A0JC-01A-11R-A056-07 | (TODO) -- GDC | mRNA__geneExp__FPKM | |
| TCGA-AO-A0JC-01A-11R-A056-07 | (TODO) -- GDC | mRNA__counts__FPKM | |
| TCGA-AO-A0JD-01A-11R-A056-07 | (TODO) -- GDC | mRNA__geneExpNormed__FPKM | |
| TCGA-AO-A0JD-01A-11R-A056-07 | (TODO) -- GDC | mRNA__geneExp__FPKM | |
| TCGA-AO-A0JD-01A-11R-A056-07 | (TODO) -- GDC | mRNA__counts__FPKM | |
| TCGA-AO-A0JE-01A-11R-A056-07 | (TODO) -- GDC | mRNA__geneExpNormed__FPKM | |
| TCGA-AO-A0JE-01A-11R-A056-07 | (TODO) -- GDC | mRNA__geneExp__FPKM | |
| TCGA-AO-A0JE-01A-11R-A056-07 | (TODO) -- GDC | mRNA__counts__FPKM | |
| TCGA-AO-A0JF-01A-11R-A056-07 | (TODO) -- GDC | mRNA__geneExpNormed__FPKM | |
| TCGA-AO-A0JF-01A-11R-A056-07 | (TODO) -- GDC | mRNA__geneExp__FPKM | |
| TCGA-AO-A0JF-01A-11R-A056-07 | (TODO) -- GDC | mRNA__counts__FPKM | |
| TCGA-AO-A0JG-01A-31R-A084-07 | (TODO) -- GDC | mRNA__geneExpNormed__FPKM | |
| TCGA-AO-A0JG-01A-31R-A084-07 | (TODO) -- GDC | mRNA__geneExp__FPKM | |
| TCGA-AO-A0JG-01A-31R-A084-07 | (TODO) -- GDC | mRNA__counts__FPKM | |
| TCGA-AO-A0JI-01A-21R-A056-07 | (TODO) -- GDC | mRNA__geneExpNormed__FPKM | |
| TCGA-AO-A0JI-01A-21R-A056-07 | (TODO) -- GDC | mRNA__geneExp__FPKM | |
| TCGA-AO-A0JI-01A-21R-A056-07 | (TODO) -- GDC | mRNA__counts__FPKM | |
| TCGA-AO-A0JJ-01A-11R-A056-07 | (TODO) -- GDC | mRNA__geneExpNormed__FPKM | |
| TCGA-AO-A0JJ-01A-11R-A056-07 | (TODO) -- GDC | mRNA__geneExp__FPKM | |
| TCGA-AO-A0JJ-01A-11R-A056-07 | (TODO) -- GDC | mRNA__counts__FPKM | |
| TCGA-AO-A0JL-01A-11R-A056-07 | (TODO) -- GDC | mRNA__geneExpNormed__FPKM | |
| TCGA-AO-A0JL-01A-11R-A056-07 | (TODO) -- GDC | mRNA__geneExp__FPKM | |
| TCGA-AO-A0JL-01A-11R-A056-07 | (TODO) -- GDC | mRNA__counts__FPKM | |
| TCGA-AO-A0JM-01A-21R-A056-07 | (TODO) -- GDC | mRNA__geneExpNormed__FPKM | |
| TCGA-AO-A0JM-01A-21R-A056-07 | (TODO) -- GDC | mRNA__geneExp__FPKM | |
| TCGA-AO-A0JM-01A-21R-A056-07 | (TODO) -- GDC | mRNA__counts__FPKM | |
| TCGA-AO-A124-01A-11R-A10J-07 | (TODO) -- GDC | mRNA__geneExpNormed__FPKM | |
| TCGA-AO-A124-01A-11R-A10J-07 | (TODO) -- GDC | mRNA__geneExp__FPKM | |
| TCGA-AO-A124-01A-11R-A10J-07 | (TODO) -- GDC | mRNA__counts__FPKM | |
| TCGA-AO-A125-01A-11R-A10J-07 | (TODO) -- GDC | mRNA__geneExpNormed__FPKM | |
| TCGA-AO-A125-01A-11R-A10J-07 | (TODO) -- GDC | mRNA__geneExp__FPKM | |
| TCGA-AO-A125-01A-11R-A10J-07 | (TODO) -- GDC | mRNA__counts__FPKM | |
| TCGA-AO-A126-01A-11R-A10J-07 | (TODO) -- GDC | mRNA__geneExpNormed__FPKM | |
| TCGA-AO-A126-01A-11R-A10J-07 | (TODO) -- GDC | mRNA__geneExp__FPKM | |
| TCGA-AO-A126-01A-11R-A10J-07 | (TODO) -- GDC | mRNA__counts__FPKM | |
| TCGA-AO-A128-01A-11R-A10J-07 | (TODO) -- GDC | mRNA__geneExpNormed__FPKM | |
| TCGA-AO-A128-01A-11R-A10J-07 | (TODO) -- GDC | mRNA__geneExp__FPKM | |
| TCGA-AO-A128-01A-11R-A10J-07 | (TODO) -- GDC | mRNA__counts__FPKM | |
| TCGA-AO-A129-01A-21R-A10J-07 | (TODO) -- GDC | mRNA__geneExpNormed__FPKM | |
| TCGA-AO-A129-01A-21R-A10J-07 | (TODO) -- GDC | mRNA__geneExp__FPKM | |
| TCGA-AO-A129-01A-21R-A10J-07 | (TODO) -- GDC | mRNA__counts__FPKM | |
| TCGA-AO-A12A-01A-21R-A115-07 | (TODO) -- GDC | mRNA__geneExpNormed__FPKM | |
| TCGA-AO-A12A-01A-21R-A115-07 | (TODO) -- GDC | mRNA__geneExp__FPKM | |
| TCGA-AO-A12A-01A-21R-A115-07 | (TODO) -- GDC | mRNA__counts__FPKM | |
| TCGA-AO-A12B-01A-11R-A10J-07 | (TODO) -- GDC | mRNA__geneExpNormed__FPKM | |
| TCGA-AO-A12B-01A-11R-A10J-07 | (TODO) -- GDC | mRNA__geneExp__FPKM | |
| TCGA-AO-A12B-01A-11R-A10J-07 | (TODO) -- GDC | mRNA__counts__FPKM | |
| TCGA-AO-A12C-01A-11R-A10J-07 | (TODO) -- GDC | mRNA__geneExpNormed__FPKM | |
| TCGA-AO-A12C-01A-11R-A10J-07 | (TODO) -- GDC | mRNA__geneExp__FPKM | |
| TCGA-AO-A12C-01A-11R-A10J-07 | (TODO) -- GDC | mRNA__counts__FPKM | |
| TCGA-AO-A12D-01A-11R-A115-07 | (TODO) -- GDC | mRNA__geneExpNormed__FPKM | |
| TCGA-AO-A12D-01A-11R-A115-07 | (TODO) -- GDC | mRNA__geneExp__FPKM | |
| TCGA-AO-A12D-01A-11R-A115-07 | (TODO) -- GDC | mRNA__counts__FPKM | |
| TCGA-AO-A12E-01A-11R-A10J-07 | (TODO) -- GDC | mRNA__geneExpNormed__FPKM | |
| TCGA-AO-A12E-01A-11R-A10J-07 | (TODO) -- GDC | mRNA__geneExp__FPKM | |
| TCGA-AO-A12E-01A-11R-A10J-07 | (TODO) -- GDC | mRNA__counts__FPKM | |
| TCGA-AO-A12F-01A-11R-A115-07 | (TODO) -- GDC | mRNA__geneExpNormed__FPKM | |
| TCGA-AO-A12F-01A-11R-A115-07 | (TODO) -- GDC | mRNA__geneExp__FPKM | |
| TCGA-AO-A12F-01A-11R-A115-07 | (TODO) -- GDC | mRNA__counts__FPKM | |
| TCGA-AO-A12G-01A-11R-A10J-07 | (TODO) -- GDC | mRNA__geneExpNormed__FPKM | |
| TCGA-AO-A12G-01A-11R-A10J-07 | (TODO) -- GDC | mRNA__geneExp__FPKM | |
| TCGA-AO-A12G-01A-11R-A10J-07 | (TODO) -- GDC | mRNA__counts__FPKM | |
| TCGA-AO-A12H-01A-11R-A115-07 | (TODO) -- GDC | mRNA__geneExpNormed__FPKM | |
| TCGA-AO-A12H-01A-11R-A115-07 | (TODO) -- GDC | mRNA__geneExp__FPKM | |
| TCGA-AO-A12H-01A-11R-A115-07 | (TODO) -- GDC | mRNA__counts__FPKM | |
| TCGA-AO-A1KO-01A-31R-A13Q-07 | (TODO) -- GDC | mRNA__geneExpNormed__FPKM | |
| TCGA-AO-A1KO-01A-31R-A13Q-07 | (TODO) -- GDC | mRNA__geneExp__FPKM | |
| TCGA-AO-A1KO-01A-31R-A13Q-07 | (TODO) -- GDC | mRNA__counts__FPKM | |
| TCGA-AO-A1KP-01A-11R-A13Q-07 | (TODO) -- GDC | mRNA__geneExpNormed__FPKM | |
| TCGA-AO-A1KP-01A-11R-A13Q-07 | (TODO) -- GDC | mRNA__geneExp__FPKM | |
| TCGA-AO-A1KP-01A-11R-A13Q-07 | (TODO) -- GDC | mRNA__counts__FPKM | |
| TCGA-AO-A1KQ-01A-11R-A13Q-07 | (TODO) -- GDC | mRNA__geneExpNormed__FPKM | |
| TCGA-AO-A1KQ-01A-11R-A13Q-07 | (TODO) -- GDC | mRNA__geneExp__FPKM | |
| TCGA-AO-A1KQ-01A-11R-A13Q-07 | (TODO) -- GDC | mRNA__counts__FPKM | |
| TCGA-AO-A1KR-01A-12R-A144-07 | (TODO) -- GDC | mRNA__geneExpNormed__FPKM | |
| TCGA-AO-A1KR-01A-12R-A144-07 | (TODO) -- GDC | mRNA__geneExp__FPKM | |
| TCGA-AO-A1KR-01A-12R-A144-07 | (TODO) -- GDC | mRNA__counts__FPKM | |
| TCGA-AO-A1KS-01A-11R-A13Q-07 | (TODO) -- GDC | mRNA__geneExpNormed__FPKM | |
| TCGA-AO-A1KS-01A-11R-A13Q-07 | (TODO) -- GDC | mRNA__geneExp__FPKM | |
| TCGA-AO-A1KS-01A-11R-A13Q-07 | (TODO) -- GDC | mRNA__counts__FPKM | |
| TCGA-AO-A1KT-01A-11R-A13Q-07 | (TODO) -- GDC | mRNA__geneExpNormed__FPKM | |
| TCGA-AO-A1KT-01A-11R-A13Q-07 | (TODO) -- GDC | mRNA__geneExp__FPKM | |
| TCGA-AO-A1KT-01A-11R-A13Q-07 | (TODO) -- GDC | mRNA__counts__FPKM | |
| TCGA-AQ-A04H-01B-11R-A10J-07 | (TODO) -- GDC | mRNA__geneExpNormed__FPKM | |
| TCGA-AQ-A04H-01B-11R-A10J-07 | (TODO) -- GDC | mRNA__geneExp__FPKM | |
| TCGA-AQ-A04H-01B-11R-A10J-07 | (TODO) -- GDC | mRNA__counts__FPKM | |
| TCGA-AQ-A04J-01A-02R-A034-07 | (TODO) -- GDC | mRNA__geneExpNormed__FPKM | |
| TCGA-AQ-A04J-01A-02R-A034-07 | (TODO) -- GDC | mRNA__geneExp__FPKM | |
| TCGA-AQ-A04J-01A-02R-A034-07 | (TODO) -- GDC | mRNA__counts__FPKM | |
| TCGA-AQ-A04L-01B-21R-A10J-07 | (TODO) -- GDC | mRNA__geneExpNormed__FPKM | |
| TCGA-AQ-A04L-01B-21R-A10J-07 | (TODO) -- GDC | mRNA__geneExp__FPKM | |
| TCGA-AQ-A04L-01B-21R-A10J-07 | (TODO) -- GDC | mRNA__counts__FPKM | |
| TCGA-AQ-A0Y5-01A-11R-A14M-07 | (TODO) -- GDC | mRNA__geneExpNormed__FPKM | |
| TCGA-AQ-A0Y5-01A-11R-A14M-07 | (TODO) -- GDC | mRNA__geneExp__FPKM | |
| TCGA-AQ-A0Y5-01A-11R-A14M-07 | (TODO) -- GDC | mRNA__counts__FPKM | |
| TCGA-AQ-A1H2-01A-11R-A13Q-07 | (TODO) -- GDC | mRNA__geneExpNormed__FPKM | |
| TCGA-AQ-A1H2-01A-11R-A13Q-07 | (TODO) -- GDC | mRNA__geneExp__FPKM | |
| TCGA-AQ-A1H2-01A-11R-A13Q-07 | (TODO) -- GDC | mRNA__counts__FPKM | |
| TCGA-AQ-A1H3-01A-31R-A13Q-07 | (TODO) -- GDC | mRNA__geneExpNormed__FPKM | |
| TCGA-AQ-A1H3-01A-31R-A13Q-07 | (TODO) -- GDC | mRNA__geneExp__FPKM | |
| TCGA-AQ-A1H3-01A-31R-A13Q-07 | (TODO) -- GDC | mRNA__counts__FPKM | |
| TCGA-AQ-A54N-01A-11R-A266-07 | (TODO) -- GDC | mRNA__geneExpNormed__FPKM | |
| TCGA-AQ-A54N-01A-11R-A266-07 | (TODO) -- GDC | mRNA__geneExp__FPKM | |
| TCGA-AQ-A54N-01A-11R-A266-07 | (TODO) -- GDC | mRNA__counts__FPKM | |
| TCGA-AQ-A54O-01A-11R-A266-07 | (TODO) -- GDC | mRNA__geneExpNormed__FPKM | |
| TCGA-AQ-A54O-01A-11R-A266-07 | (TODO) -- GDC | mRNA__geneExp__FPKM | |
| TCGA-AQ-A54O-01A-11R-A266-07 | (TODO) -- GDC | mRNA__counts__FPKM | |
| TCGA-AQ-A7U7-01A-22R-A352-07 | (TODO) -- GDC | mRNA__geneExpNormed__FPKM | |
| TCGA-AQ-A7U7-01A-22R-A352-07 | (TODO) -- GDC | mRNA__geneExp__FPKM | |
| TCGA-AQ-A7U7-01A-22R-A352-07 | (TODO) -- GDC | mRNA__counts__FPKM | |
| TCGA-AR-A0TP-01A-11R-A084-07 | (TODO) -- GDC | mRNA__geneExpNormed__FPKM | |
| TCGA-AR-A0TP-01A-11R-A084-07 | (TODO) -- GDC | mRNA__geneExp__FPKM | |
| TCGA-AR-A0TP-01A-11R-A084-07 | (TODO) -- GDC | mRNA__counts__FPKM | |
| TCGA-AR-A0TQ-01A-11R-A084-07 | (TODO) -- GDC | mRNA__geneExpNormed__FPKM | |
| TCGA-AR-A0TQ-01A-11R-A084-07 | (TODO) -- GDC | mRNA__geneExp__FPKM | |
| TCGA-AR-A0TQ-01A-11R-A084-07 | (TODO) -- GDC | mRNA__counts__FPKM | |
| TCGA-AR-A0TR-01A-11R-A084-07 | (TODO) -- GDC | mRNA__geneExpNormed__FPKM | |
| TCGA-AR-A0TR-01A-11R-A084-07 | (TODO) -- GDC | mRNA__geneExp__FPKM | |
| TCGA-AR-A0TR-01A-11R-A084-07 | (TODO) -- GDC | mRNA__counts__FPKM | |
| TCGA-AR-A0TS-01A-11R-A115-07 | (TODO) -- GDC | mRNA__geneExpNormed__FPKM | |
| TCGA-AR-A0TS-01A-11R-A115-07 | (TODO) -- GDC | mRNA__geneExp__FPKM | |
| TCGA-AR-A0TS-01A-11R-A115-07 | (TODO) -- GDC | mRNA__counts__FPKM | |
| TCGA-AR-A0TT-01A-31R-A084-07 | (TODO) -- GDC | mRNA__geneExpNormed__FPKM | |
| TCGA-AR-A0TT-01A-31R-A084-07 | (TODO) -- GDC | mRNA__geneExp__FPKM | |
| TCGA-AR-A0TT-01A-31R-A084-07 | (TODO) -- GDC | mRNA__counts__FPKM | |
| TCGA-AR-A0TU-01A-31R-A109-07 | (TODO) -- GDC | mRNA__geneExpNormed__FPKM | |
| TCGA-AR-A0TU-01A-31R-A109-07 | (TODO) -- GDC | mRNA__geneExp__FPKM | |
| TCGA-AR-A0TU-01A-31R-A109-07 | (TODO) -- GDC | mRNA__counts__FPKM | |
| TCGA-AR-A0TV-01A-21R-A084-07 | (TODO) -- GDC | mRNA__geneExpNormed__FPKM | |
| TCGA-AR-A0TV-01A-21R-A084-07 | (TODO) -- GDC | mRNA__geneExp__FPKM | |
| TCGA-AR-A0TV-01A-21R-A084-07 | (TODO) -- GDC | mRNA__counts__FPKM | |
| TCGA-AR-A0TW-01A-11R-A084-07 | (TODO) -- GDC | mRNA__geneExpNormed__FPKM | |
| TCGA-AR-A0TW-01A-11R-A084-07 | (TODO) -- GDC | mRNA__geneExp__FPKM | |
| TCGA-AR-A0TW-01A-11R-A084-07 | (TODO) -- GDC | mRNA__counts__FPKM | |
| TCGA-AR-A0TX-01A-11R-A084-07 | (TODO) -- GDC | mRNA__geneExpNormed__FPKM | |
| TCGA-AR-A0TX-01A-11R-A084-07 | (TODO) -- GDC | mRNA__geneExp__FPKM | |
| TCGA-AR-A0TX-01A-11R-A084-07 | (TODO) -- GDC | mRNA__counts__FPKM | |
| TCGA-AR-A0TY-01A-12R-A115-07 | (TODO) -- GDC | mRNA__geneExpNormed__FPKM | |
| TCGA-AR-A0TY-01A-12R-A115-07 | (TODO) -- GDC | mRNA__geneExp__FPKM | |
| TCGA-AR-A0TY-01A-12R-A115-07 | (TODO) -- GDC | mRNA__counts__FPKM | |
| TCGA-AR-A0TZ-01A-12R-A084-07 | (TODO) -- GDC | mRNA__geneExpNormed__FPKM | |
| TCGA-AR-A0TZ-01A-12R-A084-07 | (TODO) -- GDC | mRNA__geneExp__FPKM | |
| TCGA-AR-A0TZ-01A-12R-A084-07 | (TODO) -- GDC | mRNA__counts__FPKM | |
| TCGA-AR-A0U0-01A-11R-A109-07 | (TODO) -- GDC | mRNA__geneExpNormed__FPKM | |
| TCGA-AR-A0U0-01A-11R-A109-07 | (TODO) -- GDC | mRNA__geneExp__FPKM | |
| TCGA-AR-A0U0-01A-11R-A109-07 | (TODO) -- GDC | mRNA__counts__FPKM | |
| TCGA-AR-A0U2-01A-11R-A109-07 | (TODO) -- GDC | mRNA__geneExpNormed__FPKM | |
| TCGA-AR-A0U2-01A-11R-A109-07 | (TODO) -- GDC | mRNA__geneExp__FPKM | |
| TCGA-AR-A0U2-01A-11R-A109-07 | (TODO) -- GDC | mRNA__counts__FPKM | |
| TCGA-AR-A0U3-01A-11R-A109-07 | (TODO) -- GDC | mRNA__geneExpNormed__FPKM | |
| TCGA-AR-A0U3-01A-11R-A109-07 | (TODO) -- GDC | mRNA__geneExp__FPKM | |
| TCGA-AR-A0U3-01A-11R-A109-07 | (TODO) -- GDC | mRNA__counts__FPKM | |
| TCGA-AR-A0U4-01A-11R-A109-07 | (TODO) -- GDC | mRNA__geneExpNormed__FPKM | |
| TCGA-AR-A0U4-01A-11R-A109-07 | (TODO) -- GDC | mRNA__geneExp__FPKM | |
| TCGA-AR-A0U4-01A-11R-A109-07 | (TODO) -- GDC | mRNA__counts__FPKM | |
| TCGA-AR-A1AH-01A-11R-A12D-07 | (TODO) -- GDC | mRNA__geneExpNormed__FPKM | |
| TCGA-AR-A1AH-01A-11R-A12D-07 | (TODO) -- GDC | mRNA__geneExp__FPKM | |
| TCGA-AR-A1AH-01A-11R-A12D-07 | (TODO) -- GDC | mRNA__counts__FPKM | |
| TCGA-AR-A1AI-01A-11R-A12P-07 | (TODO) -- GDC | mRNA__geneExpNormed__FPKM | |
| TCGA-AR-A1AI-01A-11R-A12P-07 | (TODO) -- GDC | mRNA__geneExp__FPKM | |
| TCGA-AR-A1AI-01A-11R-A12P-07 | (TODO) -- GDC | mRNA__counts__FPKM | |
| TCGA-AR-A1AJ-01A-21R-A12P-07 | (TODO) -- GDC | mRNA__geneExpNormed__FPKM | |
| TCGA-AR-A1AJ-01A-21R-A12P-07 | (TODO) -- GDC | mRNA__geneExp__FPKM | |
| TCGA-AR-A1AJ-01A-21R-A12P-07 | (TODO) -- GDC | mRNA__counts__FPKM | |
| TCGA-AR-A1AK-01A-21R-A12P-07 | (TODO) -- GDC | mRNA__geneExpNormed__FPKM | |
| TCGA-AR-A1AK-01A-21R-A12P-07 | (TODO) -- GDC | mRNA__geneExp__FPKM | |
| TCGA-AR-A1AK-01A-21R-A12P-07 | (TODO) -- GDC | mRNA__counts__FPKM | |
| TCGA-AR-A1AL-01A-21R-A12P-07 | (TODO) -- GDC | mRNA__geneExpNormed__FPKM | |
| TCGA-AR-A1AL-01A-21R-A12P-07 | (TODO) -- GDC | mRNA__geneExp__FPKM | |
| TCGA-AR-A1AL-01A-21R-A12P-07 | (TODO) -- GDC | mRNA__counts__FPKM | |
| TCGA-AR-A1AM-01A-41R-A22K-07 | (TODO) -- GDC | mRNA__geneExpNormed__FPKM | |
| TCGA-AR-A1AM-01A-41R-A22K-07 | (TODO) -- GDC | mRNA__geneExp__FPKM | |
| TCGA-AR-A1AM-01A-41R-A22K-07 | (TODO) -- GDC | mRNA__counts__FPKM | |
| TCGA-AR-A1AN-01A-11R-A12P-07 | (TODO) -- GDC | mRNA__geneExpNormed__FPKM | |
| TCGA-AR-A1AN-01A-11R-A12P-07 | (TODO) -- GDC | mRNA__geneExp__FPKM | |
| TCGA-AR-A1AN-01A-11R-A12P-07 | (TODO) -- GDC | mRNA__counts__FPKM | |
| TCGA-AR-A1AO-01A-11R-A12P-07 | (TODO) -- GDC | mRNA__geneExpNormed__FPKM | |
| TCGA-AR-A1AO-01A-11R-A12P-07 | (TODO) -- GDC | mRNA__geneExp__FPKM | |
| TCGA-AR-A1AO-01A-11R-A12P-07 | (TODO) -- GDC | mRNA__counts__FPKM | |
| TCGA-AR-A1AP-01A-11R-A12P-07 | (TODO) -- GDC | mRNA__geneExpNormed__FPKM | |
| TCGA-AR-A1AP-01A-11R-A12P-07 | (TODO) -- GDC | mRNA__geneExp__FPKM | |
| TCGA-AR-A1AP-01A-11R-A12P-07 | (TODO) -- GDC | mRNA__counts__FPKM | |
| TCGA-AR-A1AQ-01A-11R-A12P-07 | (TODO) -- GDC | mRNA__geneExpNormed__FPKM | |
| TCGA-AR-A1AQ-01A-11R-A12P-07 | (TODO) -- GDC | mRNA__geneExp__FPKM | |
| TCGA-AR-A1AQ-01A-11R-A12P-07 | (TODO) -- GDC | mRNA__counts__FPKM | |
| TCGA-AR-A1AR-01A-31R-A137-07 | (TODO) -- GDC | mRNA__geneExpNormed__FPKM | |
| TCGA-AR-A1AR-01A-31R-A137-07 | (TODO) -- GDC | mRNA__geneExp__FPKM | |
| TCGA-AR-A1AR-01A-31R-A137-07 | (TODO) -- GDC | mRNA__counts__FPKM | |
| TCGA-AR-A1AS-01A-11R-A12P-07 | (TODO) -- GDC | mRNA__geneExpNormed__FPKM | |
| TCGA-AR-A1AS-01A-11R-A12P-07 | (TODO) -- GDC | mRNA__geneExp__FPKM | |
| TCGA-AR-A1AS-01A-11R-A12P-07 | (TODO) -- GDC | mRNA__counts__FPKM | |
| TCGA-AR-A1AT-01A-11R-A12P-07 | (TODO) -- GDC | mRNA__geneExpNormed__FPKM | |
| TCGA-AR-A1AT-01A-11R-A12P-07 | (TODO) -- GDC | mRNA__geneExp__FPKM | |
| TCGA-AR-A1AT-01A-11R-A12P-07 | (TODO) -- GDC | mRNA__counts__FPKM | |
| TCGA-AR-A1AU-01A-11R-A12P-07 | (TODO) -- GDC | mRNA__geneExpNormed__FPKM | |
| TCGA-AR-A1AU-01A-11R-A12P-07 | (TODO) -- GDC | mRNA__geneExp__FPKM | |
| TCGA-AR-A1AU-01A-11R-A12P-07 | (TODO) -- GDC | mRNA__counts__FPKM | |
| TCGA-AR-A1AV-01A-21R-A12P-07 | (TODO) -- GDC | mRNA__geneExpNormed__FPKM | |
| TCGA-AR-A1AV-01A-21R-A12P-07 | (TODO) -- GDC | mRNA__geneExp__FPKM | |
| TCGA-AR-A1AV-01A-21R-A12P-07 | (TODO) -- GDC | mRNA__counts__FPKM | |
| TCGA-AR-A1AW-01A-21R-A12P-07 | (TODO) -- GDC | mRNA__geneExpNormed__FPKM | |
| TCGA-AR-A1AW-01A-21R-A12P-07 | (TODO) -- GDC | mRNA__geneExp__FPKM | |
| TCGA-AR-A1AW-01A-21R-A12P-07 | (TODO) -- GDC | mRNA__counts__FPKM | |
| TCGA-AR-A1AX-01A-11R-A12P-07 | (TODO) -- GDC | mRNA__geneExpNormed__FPKM | |
| TCGA-AR-A1AX-01A-11R-A12P-07 | (TODO) -- GDC | mRNA__geneExp__FPKM | |
| TCGA-AR-A1AX-01A-11R-A12P-07 | (TODO) -- GDC | mRNA__counts__FPKM | |
| TCGA-AR-A1AY-01A-21R-A12P-07 | (TODO) -- GDC | mRNA__geneExpNormed__FPKM | |
| TCGA-AR-A1AY-01A-21R-A12P-07 | (TODO) -- GDC | mRNA__geneExp__FPKM | |
| TCGA-AR-A1AY-01A-21R-A12P-07 | (TODO) -- GDC | mRNA__counts__FPKM | |
| TCGA-AR-A24H-01A-11R-A169-07 | (TODO) -- GDC | mRNA__geneExpNormed__FPKM | |
| TCGA-AR-A24H-01A-11R-A169-07 | (TODO) -- GDC | mRNA__geneExp__FPKM | |
| TCGA-AR-A24H-01A-11R-A169-07 | (TODO) -- GDC | mRNA__counts__FPKM | |
| TCGA-AR-A24K-01A-11R-A169-07 | (TODO) -- GDC | mRNA__geneExpNormed__FPKM | |
| TCGA-AR-A24K-01A-11R-A169-07 | (TODO) -- GDC | mRNA__geneExp__FPKM | |
| TCGA-AR-A24K-01A-11R-A169-07 | (TODO) -- GDC | mRNA__counts__FPKM | |
| TCGA-AR-A24L-01A-11R-A169-07 | (TODO) -- GDC | mRNA__geneExpNormed__FPKM | |
| TCGA-AR-A24L-01A-11R-A169-07 | (TODO) -- GDC | mRNA__geneExp__FPKM | |
| TCGA-AR-A24L-01A-11R-A169-07 | (TODO) -- GDC | mRNA__counts__FPKM | |
| TCGA-AR-A24M-01A-11R-A169-07 | (TODO) -- GDC | mRNA__geneExpNormed__FPKM | |
| TCGA-AR-A24M-01A-11R-A169-07 | (TODO) -- GDC | mRNA__geneExp__FPKM | |
| TCGA-AR-A24M-01A-11R-A169-07 | (TODO) -- GDC | mRNA__counts__FPKM | |
| TCGA-AR-A24N-01A-11R-A169-07 | (TODO) -- GDC | mRNA__geneExpNormed__FPKM | |
| TCGA-AR-A24N-01A-11R-A169-07 | (TODO) -- GDC | mRNA__geneExp__FPKM | |
| TCGA-AR-A24N-01A-11R-A169-07 | (TODO) -- GDC | mRNA__counts__FPKM | |
| TCGA-AR-A24O-01A-11R-A169-07 | (TODO) -- GDC | mRNA__geneExpNormed__FPKM | |
| TCGA-AR-A24O-01A-11R-A169-07 | (TODO) -- GDC | mRNA__geneExp__FPKM | |
| TCGA-AR-A24O-01A-11R-A169-07 | (TODO) -- GDC | mRNA__counts__FPKM | |
| TCGA-AR-A24P-01A-11R-A169-07 | (TODO) -- GDC | mRNA__geneExpNormed__FPKM | |
| TCGA-AR-A24P-01A-11R-A169-07 | (TODO) -- GDC | mRNA__geneExp__FPKM | |
| TCGA-AR-A24P-01A-11R-A169-07 | (TODO) -- GDC | mRNA__counts__FPKM | |
| TCGA-AR-A24Q-01A-12R-A169-07 | (TODO) -- GDC | mRNA__geneExpNormed__FPKM | |
| TCGA-AR-A24Q-01A-12R-A169-07 | (TODO) -- GDC | mRNA__geneExp__FPKM | |
| TCGA-AR-A24Q-01A-12R-A169-07 | (TODO) -- GDC | mRNA__counts__FPKM | |
| TCGA-AR-A24R-01A-11R-A169-07 | (TODO) -- GDC | mRNA__geneExpNormed__FPKM | |
| TCGA-AR-A24R-01A-11R-A169-07 | (TODO) -- GDC | mRNA__geneExp__FPKM | |
| TCGA-AR-A24R-01A-11R-A169-07 | (TODO) -- GDC | mRNA__counts__FPKM | |
| TCGA-AR-A24S-01A-11R-A169-07 | (TODO) -- GDC | mRNA__geneExpNormed__FPKM | |
| TCGA-AR-A24S-01A-11R-A169-07 | (TODO) -- GDC | mRNA__geneExp__FPKM | |
| TCGA-AR-A24S-01A-11R-A169-07 | (TODO) -- GDC | mRNA__counts__FPKM | |
| TCGA-AR-A24T-01A-11R-A169-07 | (TODO) -- GDC | mRNA__geneExpNormed__FPKM | |
| TCGA-AR-A24T-01A-11R-A169-07 | (TODO) -- GDC | mRNA__geneExp__FPKM | |
| TCGA-AR-A24T-01A-11R-A169-07 | (TODO) -- GDC | mRNA__counts__FPKM | |
| TCGA-AR-A24U-01A-11R-A169-07 | (TODO) -- GDC | mRNA__geneExpNormed__FPKM | |
| TCGA-AR-A24U-01A-11R-A169-07 | (TODO) -- GDC | mRNA__geneExp__FPKM | |
| TCGA-AR-A24U-01A-11R-A169-07 | (TODO) -- GDC | mRNA__counts__FPKM | |
| TCGA-AR-A24V-01A-21R-A169-07 | (TODO) -- GDC | mRNA__geneExpNormed__FPKM | |
| TCGA-AR-A24V-01A-21R-A169-07 | (TODO) -- GDC | mRNA__geneExp__FPKM | |
| TCGA-AR-A24V-01A-21R-A169-07 | (TODO) -- GDC | mRNA__counts__FPKM | |
| TCGA-AR-A24W-01A-11R-A169-07 | (TODO) -- GDC | mRNA__geneExpNormed__FPKM | |
| TCGA-AR-A24W-01A-11R-A169-07 | (TODO) -- GDC | mRNA__geneExp__FPKM | |
| TCGA-AR-A24W-01A-11R-A169-07 | (TODO) -- GDC | mRNA__counts__FPKM | |
| TCGA-AR-A24X-01A-11R-A169-07 | (TODO) -- GDC | mRNA__geneExpNormed__FPKM | |
| TCGA-AR-A24X-01A-11R-A169-07 | (TODO) -- GDC | mRNA__geneExp__FPKM | |
| TCGA-AR-A24X-01A-11R-A169-07 | (TODO) -- GDC | mRNA__counts__FPKM | |
| TCGA-AR-A24Z-01A-11R-A169-07 | (TODO) -- GDC | mRNA__geneExpNormed__FPKM | |
| TCGA-AR-A24Z-01A-11R-A169-07 | (TODO) -- GDC | mRNA__geneExp__FPKM | |
| TCGA-AR-A24Z-01A-11R-A169-07 | (TODO) -- GDC | mRNA__counts__FPKM | |
| TCGA-AR-A250-01A-31R-A169-07 | (TODO) -- GDC | mRNA__geneExpNormed__FPKM | |
| TCGA-AR-A250-01A-31R-A169-07 | (TODO) -- GDC | mRNA__geneExp__FPKM | |
| TCGA-AR-A250-01A-31R-A169-07 | (TODO) -- GDC | mRNA__counts__FPKM | |
| TCGA-AR-A251-01A-12R-A169-07 | (TODO) -- GDC | mRNA__geneExpNormed__FPKM | |
| TCGA-AR-A251-01A-12R-A169-07 | (TODO) -- GDC | mRNA__geneExp__FPKM | |
| TCGA-AR-A251-01A-12R-A169-07 | (TODO) -- GDC | mRNA__counts__FPKM | |
| TCGA-AR-A252-01A-11R-A169-07 | (TODO) -- GDC | mRNA__geneExpNormed__FPKM | |
| TCGA-AR-A252-01A-11R-A169-07 | (TODO) -- GDC | mRNA__geneExp__FPKM | |
| TCGA-AR-A252-01A-11R-A169-07 | (TODO) -- GDC | mRNA__counts__FPKM | |
| TCGA-AR-A254-01A-21R-A169-07 | (TODO) -- GDC | mRNA__geneExpNormed__FPKM | |
| TCGA-AR-A254-01A-21R-A169-07 | (TODO) -- GDC | mRNA__geneExp__FPKM | |
| TCGA-AR-A254-01A-21R-A169-07 | (TODO) -- GDC | mRNA__counts__FPKM | |
| TCGA-AR-A255-01A-11R-A169-07 | (TODO) -- GDC | mRNA__geneExpNormed__FPKM | |
| TCGA-AR-A255-01A-11R-A169-07 | (TODO) -- GDC | mRNA__geneExp__FPKM | |
| TCGA-AR-A255-01A-11R-A169-07 | (TODO) -- GDC | mRNA__counts__FPKM | |
| TCGA-AR-A256-01A-11R-A169-07 | (TODO) -- GDC | mRNA__geneExpNormed__FPKM | |
| TCGA-AR-A256-01A-11R-A169-07 | (TODO) -- GDC | mRNA__geneExp__FPKM | |
| TCGA-AR-A256-01A-11R-A169-07 | (TODO) -- GDC | mRNA__counts__FPKM | |
| TCGA-AR-A2LE-01A-11R-A180-07 | (TODO) -- GDC | mRNA__geneExpNormed__FPKM | |
| TCGA-AR-A2LE-01A-11R-A180-07 | (TODO) -- GDC | mRNA__geneExp__FPKM | |
| TCGA-AR-A2LE-01A-11R-A180-07 | (TODO) -- GDC | mRNA__counts__FPKM | |
| TCGA-AR-A2LH-01A-31R-A18M-07 | (TODO) -- GDC | mRNA__geneExpNormed__FPKM | |
| TCGA-AR-A2LH-01A-31R-A18M-07 | (TODO) -- GDC | mRNA__geneExp__FPKM | |
| TCGA-AR-A2LH-01A-31R-A18M-07 | (TODO) -- GDC | mRNA__counts__FPKM | |
| TCGA-AR-A2LJ-01A-12R-A19W-07 | (TODO) -- GDC | mRNA__geneExpNormed__FPKM | |
| TCGA-AR-A2LJ-01A-12R-A19W-07 | (TODO) -- GDC | mRNA__geneExp__FPKM | |
| TCGA-AR-A2LJ-01A-12R-A19W-07 | (TODO) -- GDC | mRNA__counts__FPKM | |
| TCGA-AR-A2LK-01A-11R-A180-07 | (TODO) -- GDC | mRNA__geneExpNormed__FPKM | |
| TCGA-AR-A2LK-01A-11R-A180-07 | (TODO) -- GDC | mRNA__geneExp__FPKM | |
| TCGA-AR-A2LK-01A-11R-A180-07 | (TODO) -- GDC | mRNA__counts__FPKM | |
| TCGA-AR-A2LL-01A-11R-A180-07 | (TODO) -- GDC | mRNA__geneExpNormed__FPKM | |
| TCGA-AR-A2LL-01A-11R-A180-07 | (TODO) -- GDC | mRNA__geneExp__FPKM | |
| TCGA-AR-A2LL-01A-11R-A180-07 | (TODO) -- GDC | mRNA__counts__FPKM | |
| TCGA-AR-A2LM-01A-11R-A180-07 | (TODO) -- GDC | mRNA__geneExpNormed__FPKM | |
| TCGA-AR-A2LM-01A-11R-A180-07 | (TODO) -- GDC | mRNA__geneExp__FPKM | |
| TCGA-AR-A2LM-01A-11R-A180-07 | (TODO) -- GDC | mRNA__counts__FPKM | |
| TCGA-AR-A2LN-01A-21R-A18M-07 | (TODO) -- GDC | mRNA__geneExpNormed__FPKM | |
| TCGA-AR-A2LN-01A-21R-A18M-07 | (TODO) -- GDC | mRNA__geneExp__FPKM | |
| TCGA-AR-A2LN-01A-21R-A18M-07 | (TODO) -- GDC | mRNA__counts__FPKM | |
| TCGA-AR-A2LO-01A-31R-A18M-07 | (TODO) -- GDC | mRNA__geneExpNormed__FPKM | |
| TCGA-AR-A2LO-01A-31R-A18M-07 | (TODO) -- GDC | mRNA__geneExp__FPKM | |
| TCGA-AR-A2LO-01A-31R-A18M-07 | (TODO) -- GDC | mRNA__counts__FPKM | |
| TCGA-AR-A2LQ-01A-22R-A18M-07 | (TODO) -- GDC | mRNA__geneExpNormed__FPKM | |
| TCGA-AR-A2LQ-01A-22R-A18M-07 | (TODO) -- GDC | mRNA__geneExp__FPKM | |
| TCGA-AR-A2LQ-01A-22R-A18M-07 | (TODO) -- GDC | mRNA__counts__FPKM | |
| TCGA-AR-A2LR-01A-12R-A18M-07 | (TODO) -- GDC | mRNA__geneExpNormed__FPKM | |
| TCGA-AR-A2LR-01A-12R-A18M-07 | (TODO) -- GDC | mRNA__geneExp__FPKM | |
| TCGA-AR-A2LR-01A-12R-A18M-07 | (TODO) -- GDC | mRNA__counts__FPKM | |
| TCGA-AR-A5QM-01A-11R-A27Q-07 | (TODO) -- GDC | mRNA__geneExpNormed__FPKM | |
| TCGA-AR-A5QM-01A-11R-A27Q-07 | (TODO) -- GDC | mRNA__geneExp__FPKM | |
| TCGA-AR-A5QM-01A-11R-A27Q-07 | (TODO) -- GDC | mRNA__counts__FPKM | |
| TCGA-AR-A5QN-01A-12R-A28M-07 | (TODO) -- GDC | mRNA__geneExpNormed__FPKM | |
| TCGA-AR-A5QN-01A-12R-A28M-07 | (TODO) -- GDC | mRNA__geneExp__FPKM | |
| TCGA-AR-A5QN-01A-12R-A28M-07 | (TODO) -- GDC | mRNA__counts__FPKM | |
| TCGA-AR-A5QP-01A-11R-A28M-07 | (TODO) -- GDC | mRNA__geneExpNormed__FPKM | |
| TCGA-AR-A5QP-01A-11R-A28M-07 | (TODO) -- GDC | mRNA__geneExp__FPKM | |
| TCGA-AR-A5QP-01A-11R-A28M-07 | (TODO) -- GDC | mRNA__counts__FPKM | |
| TCGA-AR-A5QQ-01A-11R-A28M-07 | (TODO) -- GDC | mRNA__geneExpNormed__FPKM | |
| TCGA-AR-A5QQ-01A-11R-A28M-07 | (TODO) -- GDC | mRNA__geneExp__FPKM | |
| TCGA-AR-A5QQ-01A-11R-A28M-07 | (TODO) -- GDC | mRNA__counts__FPKM | |
| TCGA-B6-A0I1-01A-11R-A21T-07 | (TODO) -- GDC | mRNA__geneExpNormed__FPKM | |
| TCGA-B6-A0I1-01A-11R-A21T-07 | (TODO) -- GDC | mRNA__geneExp__FPKM | |
| TCGA-B6-A0I1-01A-11R-A21T-07 | (TODO) -- GDC | mRNA__counts__FPKM | |
| TCGA-B6-A0I2-01A-11R-A034-07 | (TODO) -- GDC | mRNA__geneExpNormed__FPKM | |
| TCGA-B6-A0I2-01A-11R-A034-07 | (TODO) -- GDC | mRNA__geneExp__FPKM | |
| TCGA-B6-A0I2-01A-11R-A034-07 | (TODO) -- GDC | mRNA__counts__FPKM | |
| TCGA-B6-A0I5-01A-11R-A034-07 | (TODO) -- GDC | mRNA__geneExpNormed__FPKM | |
| TCGA-B6-A0I5-01A-11R-A034-07 | (TODO) -- GDC | mRNA__geneExp__FPKM | |
| TCGA-B6-A0I5-01A-11R-A034-07 | (TODO) -- GDC | mRNA__counts__FPKM | |
| TCGA-B6-A0I6-01A-11R-A034-07 | (TODO) -- GDC | mRNA__geneExpNormed__FPKM | |
| TCGA-B6-A0I6-01A-11R-A034-07 | (TODO) -- GDC | mRNA__geneExp__FPKM | |
| TCGA-B6-A0I6-01A-11R-A034-07 | (TODO) -- GDC | mRNA__counts__FPKM | |
| TCGA-B6-A0I8-01A-11R-A034-07 | (TODO) -- GDC | mRNA__geneExpNormed__FPKM | |
| TCGA-B6-A0I8-01A-11R-A034-07 | (TODO) -- GDC | mRNA__geneExp__FPKM | |
| TCGA-B6-A0I8-01A-11R-A034-07 | (TODO) -- GDC | mRNA__counts__FPKM | |
| TCGA-B6-A0I9-01A-11R-A034-07 | (TODO) -- GDC | mRNA__geneExpNormed__FPKM | |
| TCGA-B6-A0I9-01A-11R-A034-07 | (TODO) -- GDC | mRNA__geneExp__FPKM | |
| TCGA-B6-A0I9-01A-11R-A034-07 | (TODO) -- GDC | mRNA__counts__FPKM | |
| TCGA-B6-A0IA-01A-11R-A034-07 | (TODO) -- GDC | mRNA__geneExpNormed__FPKM | |
| TCGA-B6-A0IA-01A-11R-A034-07 | (TODO) -- GDC | mRNA__geneExp__FPKM | |
| TCGA-B6-A0IA-01A-11R-A034-07 | (TODO) -- GDC | mRNA__counts__FPKM | |
| TCGA-B6-A0IB-01A-11R-A034-07 | (TODO) -- GDC | mRNA__geneExpNormed__FPKM | |
| TCGA-B6-A0IB-01A-11R-A034-07 | (TODO) -- GDC | mRNA__geneExp__FPKM | |
| TCGA-B6-A0IB-01A-11R-A034-07 | (TODO) -- GDC | mRNA__counts__FPKM | |
| TCGA-B6-A0IC-01A-11R-A034-07 | (TODO) -- GDC | mRNA__geneExpNormed__FPKM | |
| TCGA-B6-A0IC-01A-11R-A034-07 | (TODO) -- GDC | mRNA__counts__FPKM | |
| TCGA-B6-A0IE-01A-11R-A034-07 | (TODO) -- GDC | mRNA__geneExpNormed__FPKM | |
| TCGA-B6-A0IE-01A-11R-A034-07 | (TODO) -- GDC | mRNA__geneExp__FPKM | |
| TCGA-B6-A0IE-01A-11R-A034-07 | (TODO) -- GDC | mRNA__counts__FPKM | |
| TCGA-B6-A0IG-01A-11R-A034-07 | (TODO) -- GDC | mRNA__geneExpNormed__FPKM | |
| TCGA-B6-A0IG-01A-11R-A034-07 | (TODO) -- GDC | mRNA__geneExp__FPKM | |
| TCGA-B6-A0IG-01A-11R-A034-07 | (TODO) -- GDC | mRNA__counts__FPKM | |
| TCGA-B6-A0IH-01A-11R-A115-07 | (TODO) -- GDC | mRNA__geneExpNormed__FPKM | |
| TCGA-B6-A0IH-01A-11R-A115-07 | (TODO) -- GDC | mRNA__geneExp__FPKM | |
| TCGA-B6-A0IH-01A-11R-A115-07 | (TODO) -- GDC | mRNA__counts__FPKM | |
| TCGA-B6-A0IJ-01A-11R-A034-07 | (TODO) -- GDC | mRNA__geneExpNormed__FPKM | |
| TCGA-B6-A0IJ-01A-11R-A034-07 | (TODO) -- GDC | mRNA__geneExp__FPKM | |
| TCGA-B6-A0IJ-01A-11R-A034-07 | (TODO) -- GDC | mRNA__counts__FPKM | |
| TCGA-B6-A0IK-01A-12R-A056-07 | (TODO) -- GDC | mRNA__geneExpNormed__FPKM | |
| TCGA-B6-A0IK-01A-12R-A056-07 | (TODO) -- GDC | mRNA__geneExp__FPKM | |
| TCGA-B6-A0IK-01A-12R-A056-07 | (TODO) -- GDC | mRNA__counts__FPKM | |
| TCGA-B6-A0IM-01A-11R-A034-07 | (TODO) -- GDC | mRNA__geneExpNormed__FPKM | |
| TCGA-B6-A0IM-01A-11R-A034-07 | (TODO) -- GDC | mRNA__geneExp__FPKM | |
| TCGA-B6-A0IM-01A-11R-A034-07 | (TODO) -- GDC | mRNA__counts__FPKM | |
| TCGA-B6-A0IN-01A-11R-A034-07 | (TODO) -- GDC | mRNA__geneExpNormed__FPKM | |
| TCGA-B6-A0IN-01A-11R-A034-07 | (TODO) -- GDC | mRNA__geneExp__FPKM | |
| TCGA-B6-A0IN-01A-11R-A034-07 | (TODO) -- GDC | mRNA__counts__FPKM | |
| TCGA-B6-A0IO-01A-11R-A034-07 | (TODO) -- GDC | mRNA__geneExpNormed__FPKM | |
| TCGA-B6-A0IO-01A-11R-A034-07 | (TODO) -- GDC | mRNA__geneExp__FPKM | |
| TCGA-B6-A0IO-01A-11R-A034-07 | (TODO) -- GDC | mRNA__counts__FPKM | |
| TCGA-B6-A0IP-01A-11R-A034-07 | (TODO) -- GDC | mRNA__geneExpNormed__FPKM | |
| TCGA-B6-A0IP-01A-11R-A034-07 | (TODO) -- GDC | mRNA__geneExp__FPKM | |
| TCGA-B6-A0IP-01A-11R-A034-07 | (TODO) -- GDC | mRNA__counts__FPKM | |
| TCGA-B6-A0IQ-01A-11R-A034-07 | (TODO) -- GDC | mRNA__geneExpNormed__FPKM | |
| TCGA-B6-A0IQ-01A-11R-A034-07 | (TODO) -- GDC | mRNA__geneExp__FPKM | |
| TCGA-B6-A0IQ-01A-11R-A034-07 | (TODO) -- GDC | mRNA__counts__FPKM | |
| TCGA-B6-A0RE-01A-11R-A056-07 | (TODO) -- GDC | mRNA__geneExpNormed__FPKM | |
| TCGA-B6-A0RE-01A-11R-A056-07 | (TODO) -- GDC | mRNA__geneExp__FPKM | |
| TCGA-B6-A0RE-01A-11R-A056-07 | (TODO) -- GDC | mRNA__counts__FPKM | |
| TCGA-B6-A0RG-01A-11R-A056-07 | (TODO) -- GDC | mRNA__geneExpNormed__FPKM | |
| TCGA-B6-A0RG-01A-11R-A056-07 | (TODO) -- GDC | mRNA__geneExp__FPKM | |
| TCGA-B6-A0RG-01A-11R-A056-07 | (TODO) -- GDC | mRNA__counts__FPKM | |
| TCGA-B6-A0RH-01A-21R-A115-07 | (TODO) -- GDC | mRNA__geneExpNormed__FPKM | |
| TCGA-B6-A0RH-01A-21R-A115-07 | (TODO) -- GDC | mRNA__geneExp__FPKM | |
| TCGA-B6-A0RH-01A-21R-A115-07 | (TODO) -- GDC | mRNA__counts__FPKM | |
| TCGA-B6-A0RI-01A-11R-A056-07 | (TODO) -- GDC | mRNA__geneExpNormed__FPKM | |
| TCGA-B6-A0RI-01A-11R-A056-07 | (TODO) -- GDC | mRNA__geneExp__FPKM | |
| TCGA-B6-A0RI-01A-11R-A056-07 | (TODO) -- GDC | mRNA__counts__FPKM | |
| TCGA-B6-A0RL-01A-11R-A084-07 | (TODO) -- GDC | mRNA__geneExpNormed__FPKM | |
| TCGA-B6-A0RL-01A-11R-A084-07 | (TODO) -- GDC | mRNA__geneExp__FPKM | |
| TCGA-B6-A0RL-01A-11R-A084-07 | (TODO) -- GDC | mRNA__counts__FPKM | |
| TCGA-B6-A0RM-01A-11R-A084-07 | (TODO) -- GDC | mRNA__geneExpNormed__FPKM | |
| TCGA-B6-A0RM-01A-11R-A084-07 | (TODO) -- GDC | mRNA__geneExp__FPKM | |
| TCGA-B6-A0RM-01A-11R-A084-07 | (TODO) -- GDC | mRNA__counts__FPKM | |
| TCGA-B6-A0RN-01A-12R-A084-07 | (TODO) -- GDC | mRNA__geneExpNormed__FPKM | |
| TCGA-B6-A0RN-01A-12R-A084-07 | (TODO) -- GDC | mRNA__geneExp__FPKM | |
| TCGA-B6-A0RN-01A-12R-A084-07 | (TODO) -- GDC | mRNA__counts__FPKM | |
| TCGA-B6-A0RO-01A-22R-A084-07 | (TODO) -- GDC | mRNA__geneExpNormed__FPKM | |
| TCGA-B6-A0RO-01A-22R-A084-07 | (TODO) -- GDC | mRNA__geneExp__FPKM | |
| TCGA-B6-A0RO-01A-22R-A084-07 | (TODO) -- GDC | mRNA__counts__FPKM | |
| TCGA-B6-A0RP-01A-21R-A084-07 | (TODO) -- GDC | mRNA__geneExpNormed__FPKM | |
| TCGA-B6-A0RP-01A-21R-A084-07 | (TODO) -- GDC | mRNA__geneExp__FPKM | |
| TCGA-B6-A0RP-01A-21R-A084-07 | (TODO) -- GDC | mRNA__counts__FPKM | |
| TCGA-B6-A0RQ-01A-11R-A115-07 | (TODO) -- GDC | mRNA__geneExpNormed__FPKM | |
| TCGA-B6-A0RQ-01A-11R-A115-07 | (TODO) -- GDC | mRNA__geneExp__FPKM | |
| TCGA-B6-A0RQ-01A-11R-A115-07 | (TODO) -- GDC | mRNA__counts__FPKM | |
| TCGA-B6-A0RS-01A-11R-A084-07 | (TODO) -- GDC | mRNA__geneExpNormed__FPKM | |
| TCGA-B6-A0RS-01A-11R-A084-07 | (TODO) -- GDC | mRNA__geneExp__FPKM | |
| TCGA-B6-A0RS-01A-11R-A084-07 | (TODO) -- GDC | mRNA__counts__FPKM | |
| TCGA-B6-A0RT-01A-21R-A084-07 | (TODO) -- GDC | mRNA__geneExpNormed__FPKM | |
| TCGA-B6-A0RT-01A-21R-A084-07 | (TODO) -- GDC | mRNA__geneExp__FPKM | |
| TCGA-B6-A0RT-01A-21R-A084-07 | (TODO) -- GDC | mRNA__counts__FPKM | |
| TCGA-B6-A0RU-01A-11R-A084-07 | (TODO) -- GDC | mRNA__geneExpNormed__FPKM | |
| TCGA-B6-A0RU-01A-11R-A084-07 | (TODO) -- GDC | mRNA__geneExp__FPKM | |
| TCGA-B6-A0RU-01A-11R-A084-07 | (TODO) -- GDC | mRNA__counts__FPKM | |
| TCGA-B6-A0RV-01A-11R-A084-07 | (TODO) -- GDC | mRNA__geneExpNormed__FPKM | |
| TCGA-B6-A0RV-01A-11R-A084-07 | (TODO) -- GDC | mRNA__geneExp__FPKM | |
| TCGA-B6-A0RV-01A-11R-A084-07 | (TODO) -- GDC | mRNA__counts__FPKM | |
| TCGA-B6-A0WS-01A-11R-A115-07 | (TODO) -- GDC | mRNA__geneExpNormed__FPKM | |
| TCGA-B6-A0WS-01A-11R-A115-07 | (TODO) -- GDC | mRNA__geneExp__FPKM | |
| TCGA-B6-A0WS-01A-11R-A115-07 | (TODO) -- GDC | mRNA__counts__FPKM | |
| TCGA-B6-A0WT-01A-11R-A109-07 | (TODO) -- GDC | mRNA__geneExpNormed__FPKM | |
| TCGA-B6-A0WT-01A-11R-A109-07 | (TODO) -- GDC | mRNA__geneExp__FPKM | |
| TCGA-B6-A0WT-01A-11R-A109-07 | (TODO) -- GDC | mRNA__counts__FPKM | |
| TCGA-B6-A0WV-01A-11R-A109-07 | (TODO) -- GDC | mRNA__geneExpNormed__FPKM | |
| TCGA-B6-A0WV-01A-11R-A109-07 | (TODO) -- GDC | mRNA__geneExp__FPKM | |
| TCGA-B6-A0WV-01A-11R-A109-07 | (TODO) -- GDC | mRNA__counts__FPKM | |
| TCGA-B6-A0WW-01A-11R-A109-07 | (TODO) -- GDC | mRNA__geneExpNormed__FPKM | |
| TCGA-B6-A0WW-01A-11R-A109-07 | (TODO) -- GDC | mRNA__geneExp__FPKM | |
| TCGA-B6-A0WW-01A-11R-A109-07 | (TODO) -- GDC | mRNA__counts__FPKM | |
| TCGA-B6-A0WX-01A-11R-A109-07 | (TODO) -- GDC | mRNA__geneExpNormed__FPKM | |
| TCGA-B6-A0WX-01A-11R-A109-07 | (TODO) -- GDC | mRNA__geneExp__FPKM | |
| TCGA-B6-A0WX-01A-11R-A109-07 | (TODO) -- GDC | mRNA__counts__FPKM | |
| TCGA-B6-A0WY-01A-11R-A109-07 | (TODO) -- GDC | mRNA__geneExpNormed__FPKM | |
| TCGA-B6-A0WY-01A-11R-A109-07 | (TODO) -- GDC | mRNA__geneExp__FPKM | |
| TCGA-B6-A0WY-01A-11R-A109-07 | (TODO) -- GDC | mRNA__counts__FPKM | |
| TCGA-B6-A0WZ-01A-11R-A109-07 | (TODO) -- GDC | mRNA__geneExpNormed__FPKM | |
| TCGA-B6-A0WZ-01A-11R-A109-07 | (TODO) -- GDC | mRNA__geneExp__FPKM | |
| TCGA-B6-A0WZ-01A-11R-A109-07 | (TODO) -- GDC | mRNA__counts__FPKM | |
| TCGA-B6-A0X0-01A-21R-A115-07 | (TODO) -- GDC | mRNA__geneExpNormed__FPKM | |
| TCGA-B6-A0X0-01A-21R-A115-07 | (TODO) -- GDC | mRNA__geneExp__FPKM | |
| TCGA-B6-A0X0-01A-21R-A115-07 | (TODO) -- GDC | mRNA__counts__FPKM | |
| TCGA-B6-A0X1-01A-11R-A109-07 | (TODO) -- GDC | mRNA__geneExpNormed__FPKM | |
| TCGA-B6-A0X1-01A-11R-A109-07 | (TODO) -- GDC | mRNA__geneExp__FPKM | |
| TCGA-B6-A0X1-01A-11R-A109-07 | (TODO) -- GDC | mRNA__counts__FPKM | |
| TCGA-B6-A0X4-01A-11R-A109-07 | (TODO) -- GDC | mRNA__geneExpNormed__FPKM | |
| TCGA-B6-A0X4-01A-11R-A109-07 | (TODO) -- GDC | mRNA__geneExp__FPKM | |
| TCGA-B6-A0X4-01A-11R-A109-07 | (TODO) -- GDC | mRNA__counts__FPKM | |
| TCGA-B6-A0X5-01A-21R-A109-07 | (TODO) -- GDC | mRNA__geneExpNormed__FPKM | |
| TCGA-B6-A0X5-01A-21R-A109-07 | (TODO) -- GDC | mRNA__geneExp__FPKM | |
| TCGA-B6-A0X5-01A-21R-A109-07 | (TODO) -- GDC | mRNA__counts__FPKM | |
| TCGA-B6-A0X7-01A-11R-A10J-07 | (TODO) -- GDC | mRNA__geneExpNormed__FPKM | |
| TCGA-B6-A0X7-01A-11R-A10J-07 | (TODO) -- GDC | mRNA__geneExp__FPKM | |
| TCGA-B6-A0X7-01A-11R-A10J-07 | (TODO) -- GDC | mRNA__counts__FPKM | |
| TCGA-B6-A1KC-01B-11R-A157-07 | (TODO) -- GDC | mRNA__geneExpNormed__FPKM | |
| TCGA-B6-A1KC-01B-11R-A157-07 | (TODO) -- GDC | mRNA__geneExp__FPKM | |
| TCGA-B6-A1KC-01B-11R-A157-07 | (TODO) -- GDC | mRNA__counts__FPKM | |
| TCGA-B6-A1KF-01A-11R-A13Q-07 | (TODO) -- GDC | mRNA__geneExpNormed__FPKM | |
| TCGA-B6-A1KF-01A-11R-A13Q-07 | (TODO) -- GDC | mRNA__geneExp__FPKM | |
| TCGA-B6-A1KF-01A-11R-A13Q-07 | (TODO) -- GDC | mRNA__counts__FPKM | |
| TCGA-B6-A1KI-01A-11R-A14M-07 | (TODO) -- GDC | mRNA__geneExpNormed__FPKM | |
| TCGA-B6-A1KI-01A-11R-A14M-07 | (TODO) -- GDC | mRNA__geneExp__FPKM | |
| TCGA-B6-A1KI-01A-11R-A14M-07 | (TODO) -- GDC | mRNA__counts__FPKM | |
| TCGA-B6-A1KN-01A-11R-A13Q-07 | (TODO) -- GDC | mRNA__geneExpNormed__FPKM | |
| TCGA-B6-A1KN-01A-11R-A13Q-07 | (TODO) -- GDC | mRNA__geneExp__FPKM | |
| TCGA-B6-A1KN-01A-11R-A13Q-07 | (TODO) -- GDC | mRNA__counts__FPKM | |
| TCGA-B6-A2IU-01A-32R-A18M-07 | (TODO) -- GDC | mRNA__geneExpNormed__FPKM | |
| TCGA-B6-A2IU-01A-32R-A18M-07 | (TODO) -- GDC | mRNA__geneExp__FPKM | |
| TCGA-B6-A2IU-01A-32R-A18M-07 | (TODO) -- GDC | mRNA__counts__FPKM | |
| TCGA-B6-A3ZX-01A-11R-A239-07 | (TODO) -- GDC | mRNA__geneExpNormed__FPKM | |
| TCGA-B6-A3ZX-01A-11R-A239-07 | (TODO) -- GDC | mRNA__geneExp__FPKM | |
| TCGA-B6-A3ZX-01A-11R-A239-07 | (TODO) -- GDC | mRNA__counts__FPKM | |
| TCGA-B6-A400-01A-11R-A239-07 | (TODO) -- GDC | mRNA__geneExpNormed__FPKM | |
| TCGA-B6-A400-01A-11R-A239-07 | (TODO) -- GDC | mRNA__geneExp__FPKM | |
| TCGA-B6-A400-01A-11R-A239-07 | (TODO) -- GDC | mRNA__counts__FPKM | |
| TCGA-B6-A401-01A-11R-A239-07 | (TODO) -- GDC | mRNA__geneExpNormed__FPKM | |
| TCGA-B6-A401-01A-11R-A239-07 | (TODO) -- GDC | mRNA__geneExp__FPKM | |
| TCGA-B6-A401-01A-11R-A239-07 | (TODO) -- GDC | mRNA__counts__FPKM | |
| TCGA-B6-A402-01A-11R-A239-07 | (TODO) -- GDC | mRNA__geneExpNormed__FPKM | |
| TCGA-B6-A402-01A-11R-A239-07 | (TODO) -- GDC | mRNA__geneExp__FPKM | |
| TCGA-B6-A402-01A-11R-A239-07 | (TODO) -- GDC | mRNA__counts__FPKM | |
| TCGA-B6-A408-01A-12R-A24H-07 | (TODO) -- GDC | mRNA__geneExpNormed__FPKM | |
| TCGA-B6-A408-01A-12R-A24H-07 | (TODO) -- GDC | mRNA__geneExp__FPKM | |
| TCGA-B6-A408-01A-12R-A24H-07 | (TODO) -- GDC | mRNA__counts__FPKM | |
| TCGA-B6-A409-01A-11R-A24H-07 | (TODO) -- GDC | mRNA__geneExpNormed__FPKM | |
| TCGA-B6-A409-01A-11R-A24H-07 | (TODO) -- GDC | mRNA__geneExp__FPKM | |
| TCGA-B6-A409-01A-11R-A24H-07 | (TODO) -- GDC | mRNA__counts__FPKM | |
| TCGA-B6-A40B-01A-11R-A239-07 | (TODO) -- GDC | mRNA__geneExpNormed__FPKM | |
| TCGA-B6-A40B-01A-11R-A239-07 | (TODO) -- GDC | mRNA__geneExp__FPKM | |
| TCGA-B6-A40B-01A-11R-A239-07 | (TODO) -- GDC | mRNA__counts__FPKM | |
| TCGA-B6-A40C-01A-11R-A239-07 | (TODO) -- GDC | mRNA__geneExpNormed__FPKM | |
| TCGA-B6-A40C-01A-11R-A239-07 | (TODO) -- GDC | mRNA__geneExp__FPKM | |
| TCGA-B6-A40C-01A-11R-A239-07 | (TODO) -- GDC | mRNA__counts__FPKM | |
| TCGA-BH-A0AU-01A-11R-A12P-07 | (TODO) -- GDC | mRNA__geneExpNormed__FPKM | |
| TCGA-BH-A0AU-01A-11R-A12P-07 | (TODO) -- GDC | mRNA__geneExp__FPKM | |
| TCGA-BH-A0AU-01A-11R-A12P-07 | (TODO) -- GDC | mRNA__counts__FPKM | |
| TCGA-BH-A0AV-01A-31R-A115-07 | (TODO) -- GDC | mRNA__geneExpNormed__FPKM | |
| TCGA-BH-A0AV-01A-31R-A115-07 | (TODO) -- GDC | mRNA__geneExp__FPKM | |
| TCGA-BH-A0AV-01A-31R-A115-07 | (TODO) -- GDC | mRNA__counts__FPKM | |
| TCGA-BH-A0AW-01A-11R-A056-07 | (TODO) -- GDC | mRNA__geneExpNormed__FPKM | |
| TCGA-BH-A0AW-01A-11R-A056-07 | (TODO) -- GDC | mRNA__geneExp__FPKM | |
| TCGA-BH-A0AW-01A-11R-A056-07 | (TODO) -- GDC | mRNA__counts__FPKM | |
| TCGA-BH-A0AY-01A-21R-A00Z-07 | (TODO) -- GDC | mRNA__geneExpNormed__FPKM | |
| TCGA-BH-A0AY-01A-21R-A00Z-07 | (TODO) -- GDC | mRNA__geneExp__FPKM | |
| TCGA-BH-A0AY-01A-21R-A00Z-07 | (TODO) -- GDC | mRNA__counts__FPKM | |
| TCGA-BH-A0AZ-01A-21R-A12P-07 | (TODO) -- GDC | mRNA__geneExpNormed__FPKM | |
| TCGA-BH-A0AZ-01A-21R-A12P-07 | (TODO) -- GDC | mRNA__geneExp__FPKM | |
| TCGA-BH-A0AZ-01A-21R-A12P-07 | (TODO) -- GDC | mRNA__counts__FPKM | |
| TCGA-BH-A0B0-01A-21R-A115-07 | (TODO) -- GDC | mRNA__geneExpNormed__FPKM | |
| TCGA-BH-A0B0-01A-21R-A115-07 | (TODO) -- GDC | mRNA__geneExp__FPKM | |
| TCGA-BH-A0B0-01A-21R-A115-07 | (TODO) -- GDC | mRNA__counts__FPKM | |
| TCGA-BH-A0B1-01A-12R-A056-07 | (TODO) -- GDC | mRNA__geneExpNormed__FPKM | |
| TCGA-BH-A0B1-01A-12R-A056-07 | (TODO) -- GDC | mRNA__geneExp__FPKM | |
| TCGA-BH-A0B1-01A-12R-A056-07 | (TODO) -- GDC | mRNA__counts__FPKM | |
| TCGA-BH-A0B2-01A-11R-A10J-07 | (TODO) -- GDC | mRNA__geneExpNormed__FPKM | |
| TCGA-BH-A0B2-01A-11R-A10J-07 | (TODO) -- GDC | mRNA__geneExp__FPKM | |
| TCGA-BH-A0B2-01A-11R-A10J-07 | (TODO) -- GDC | mRNA__counts__FPKM | |
| TCGA-BH-A0B3-01A-11R-A056-07 | (TODO) -- GDC | mRNA__geneExpNormed__FPKM | |
| TCGA-BH-A0B3-01A-11R-A056-07 | (TODO) -- GDC | mRNA__geneExp__FPKM | |
| TCGA-BH-A0B3-01A-11R-A056-07 | (TODO) -- GDC | mRNA__counts__FPKM | |
| TCGA-BH-A0B4-01A-11R-A00Z-07 | (TODO) -- GDC | mRNA__geneExpNormed__FPKM | |
| TCGA-BH-A0B4-01A-11R-A00Z-07 | (TODO) -- GDC | mRNA__geneExp__FPKM | |
| TCGA-BH-A0B4-01A-11R-A00Z-07 | (TODO) -- GDC | mRNA__counts__FPKM | |
| TCGA-BH-A0B5-01A-11R-A12P-07 | (TODO) -- GDC | mRNA__geneExpNormed__FPKM | |
| TCGA-BH-A0B5-01A-11R-A12P-07 | (TODO) -- GDC | mRNA__geneExp__FPKM | |
| TCGA-BH-A0B5-01A-11R-A12P-07 | (TODO) -- GDC | mRNA__counts__FPKM | |
| TCGA-BH-A0B6-01A-11R-A19W-07 | (TODO) -- GDC | mRNA__geneExpNormed__FPKM | |
| TCGA-BH-A0B6-01A-11R-A19W-07 | (TODO) -- GDC | mRNA__geneExp__FPKM | |
| TCGA-BH-A0B6-01A-11R-A19W-07 | (TODO) -- GDC | mRNA__counts__FPKM | |
| TCGA-BH-A0B7-01A-12R-A115-07 | (TODO) -- GDC | mRNA__geneExpNormed__FPKM | |
| TCGA-BH-A0B7-01A-12R-A115-07 | (TODO) -- GDC | mRNA__geneExp__FPKM | |
| TCGA-BH-A0B7-01A-12R-A115-07 | (TODO) -- GDC | mRNA__counts__FPKM | |
| TCGA-BH-A0B8-01A-21R-A056-07 | (TODO) -- GDC | mRNA__geneExpNormed__FPKM | |
| TCGA-BH-A0B8-01A-21R-A056-07 | (TODO) -- GDC | mRNA__geneExp__FPKM | |
| TCGA-BH-A0B8-01A-21R-A056-07 | (TODO) -- GDC | mRNA__counts__FPKM | |
| TCGA-BH-A0B9-01A-11R-A056-07 | (TODO) -- GDC | mRNA__geneExpNormed__FPKM | |
| TCGA-BH-A0B9-01A-11R-A056-07 | (TODO) -- GDC | mRNA__geneExp__FPKM | |
| TCGA-BH-A0B9-01A-11R-A056-07 | (TODO) -- GDC | mRNA__counts__FPKM | |
| TCGA-BH-A0BA-01A-11R-A056-07 | (TODO) -- GDC | mRNA__geneExpNormed__FPKM | |
| TCGA-BH-A0BA-01A-11R-A056-07 | (TODO) -- GDC | mRNA__geneExp__FPKM | |
| TCGA-BH-A0BA-01A-11R-A056-07 | (TODO) -- GDC | mRNA__counts__FPKM | |
| TCGA-BH-A0BC-01A-22R-A084-07 | (TODO) -- GDC | mRNA__geneExpNormed__FPKM | |
| TCGA-BH-A0BC-01A-22R-A084-07 | (TODO) -- GDC | mRNA__geneExp__FPKM | |
| TCGA-BH-A0BC-01A-22R-A084-07 | (TODO) -- GDC | mRNA__counts__FPKM | |
| TCGA-BH-A0BD-01A-11R-A034-07 | (TODO) -- GDC | mRNA__geneExpNormed__FPKM | |
| TCGA-BH-A0BD-01A-11R-A034-07 | (TODO) -- GDC | mRNA__geneExp__FPKM | |
| TCGA-BH-A0BD-01A-11R-A034-07 | (TODO) -- GDC | mRNA__counts__FPKM | |
| TCGA-BH-A0BF-01A-21R-A12P-07 | (TODO) -- GDC | mRNA__geneExpNormed__FPKM | |
| TCGA-BH-A0BF-01A-21R-A12P-07 | (TODO) -- GDC | mRNA__geneExp__FPKM | |
| TCGA-BH-A0BF-01A-21R-A12P-07 | (TODO) -- GDC | mRNA__counts__FPKM | |
| TCGA-BH-A0BG-01A-11R-A115-07 | (TODO) -- GDC | mRNA__geneExpNormed__FPKM | |
| TCGA-BH-A0BG-01A-11R-A115-07 | (TODO) -- GDC | mRNA__geneExp__FPKM | |
| TCGA-BH-A0BG-01A-11R-A115-07 | (TODO) -- GDC | mRNA__counts__FPKM | |
| TCGA-BH-A0BJ-01A-11R-A056-07 | (TODO) -- GDC | mRNA__geneExpNormed__FPKM | |
| TCGA-BH-A0BJ-01A-11R-A056-07 | (TODO) -- GDC | mRNA__geneExp__FPKM | |
| TCGA-BH-A0BJ-01A-11R-A056-07 | (TODO) -- GDC | mRNA__counts__FPKM | |
| TCGA-BH-A0BL-01A-11R-A115-07 | (TODO) -- GDC | mRNA__geneExpNormed__FPKM | |
| TCGA-BH-A0BL-01A-11R-A115-07 | (TODO) -- GDC | mRNA__geneExp__FPKM | |
| TCGA-BH-A0BL-01A-11R-A115-07 | (TODO) -- GDC | mRNA__counts__FPKM | |
| TCGA-BH-A0BM-01A-11R-A056-07 | (TODO) -- GDC | mRNA__geneExpNormed__FPKM | |
| TCGA-BH-A0BM-01A-11R-A056-07 | (TODO) -- GDC | mRNA__geneExp__FPKM | |
| TCGA-BH-A0BM-01A-11R-A056-07 | (TODO) -- GDC | mRNA__counts__FPKM | |
| TCGA-BH-A0BO-01A-23R-A12D-07 | (TODO) -- GDC | mRNA__geneExpNormed__FPKM | |
| TCGA-BH-A0BO-01A-23R-A12D-07 | (TODO) -- GDC | mRNA__geneExp__FPKM | |
| TCGA-BH-A0BO-01A-23R-A12D-07 | (TODO) -- GDC | mRNA__counts__FPKM | |
| TCGA-BH-A0BP-01A-11R-A115-07 | (TODO) -- GDC | mRNA__geneExpNormed__FPKM | |
| TCGA-BH-A0BP-01A-11R-A115-07 | (TODO) -- GDC | mRNA__geneExp__FPKM | |
| TCGA-BH-A0BP-01A-11R-A115-07 | (TODO) -- GDC | mRNA__counts__FPKM | |
| TCGA-BH-A0BQ-01A-21R-A115-07 | (TODO) -- GDC | mRNA__geneExpNormed__FPKM | |
| TCGA-BH-A0BQ-01A-21R-A115-07 | (TODO) -- GDC | mRNA__geneExp__FPKM | |
| TCGA-BH-A0BQ-01A-21R-A115-07 | (TODO) -- GDC | mRNA__counts__FPKM | |
| TCGA-BH-A0BR-01A-21R-A115-07 | (TODO) -- GDC | mRNA__geneExpNormed__FPKM | |
| TCGA-BH-A0BR-01A-21R-A115-07 | (TODO) -- GDC | mRNA__geneExp__FPKM | |
| TCGA-BH-A0BR-01A-21R-A115-07 | (TODO) -- GDC | mRNA__counts__FPKM | |
| TCGA-BH-A0BT-01A-11R-A12P-07 | (TODO) -- GDC | mRNA__geneExpNormed__FPKM | |
| TCGA-BH-A0BT-01A-11R-A12P-07 | (TODO) -- GDC | mRNA__geneExp__FPKM | |
| TCGA-BH-A0BT-01A-11R-A12P-07 | (TODO) -- GDC | mRNA__counts__FPKM | |
| TCGA-BH-A0BV-01A-11R-A00Z-07 | (TODO) -- GDC | mRNA__geneExpNormed__FPKM | |
| TCGA-BH-A0BV-01A-11R-A00Z-07 | (TODO) -- GDC | mRNA__geneExp__FPKM | |
| TCGA-BH-A0BV-01A-11R-A00Z-07 | (TODO) -- GDC | mRNA__counts__FPKM | |
| TCGA-BH-A0BW-01A-11R-A115-07 | (TODO) -- GDC | mRNA__geneExpNormed__FPKM | |
| TCGA-BH-A0BW-01A-11R-A115-07 | (TODO) -- GDC | mRNA__geneExp__FPKM | |
| TCGA-BH-A0BW-01A-11R-A115-07 | (TODO) -- GDC | mRNA__counts__FPKM | |
| TCGA-BH-A0BZ-01A-31R-A12P-07 | (TODO) -- GDC | mRNA__geneExpNormed__FPKM | |
| TCGA-BH-A0BZ-01A-31R-A12P-07 | (TODO) -- GDC | mRNA__geneExp__FPKM | |
| TCGA-BH-A0BZ-01A-31R-A12P-07 | (TODO) -- GDC | mRNA__counts__FPKM | |
| TCGA-BH-A0C0-01A-21R-A056-07 | (TODO) -- GDC | mRNA__geneExpNormed__FPKM | |
| TCGA-BH-A0C0-01A-21R-A056-07 | (TODO) -- GDC | mRNA__geneExp__FPKM | |
| TCGA-BH-A0C0-01A-21R-A056-07 | (TODO) -- GDC | mRNA__counts__FPKM | |
| TCGA-BH-A0C1-01B-11R-A12D-07 | (TODO) -- GDC | mRNA__geneExpNormed__FPKM | |
| TCGA-BH-A0C1-01B-11R-A12D-07 | (TODO) -- GDC | mRNA__geneExp__FPKM | |
| TCGA-BH-A0C1-01B-11R-A12D-07 | (TODO) -- GDC | mRNA__counts__FPKM | |
| TCGA-BH-A0C3-01A-21R-A12P-07 | (TODO) -- GDC | mRNA__geneExpNormed__FPKM | |
| TCGA-BH-A0C3-01A-21R-A12P-07 | (TODO) -- GDC | mRNA__geneExp__FPKM | |
| TCGA-BH-A0C3-01A-21R-A12P-07 | (TODO) -- GDC | mRNA__counts__FPKM | |
| TCGA-BH-A0C7-01B-11R-A115-07 | (TODO) -- GDC | mRNA__geneExpNormed__FPKM | |
| TCGA-BH-A0C7-01B-11R-A115-07 | (TODO) -- GDC | mRNA__geneExp__FPKM | |
| TCGA-BH-A0C7-01B-11R-A115-07 | (TODO) -- GDC | mRNA__counts__FPKM | |
| TCGA-BH-A0DD-01A-31R-A12P-07 | (TODO) -- GDC | mRNA__geneExpNormed__FPKM | |
| TCGA-BH-A0DD-01A-31R-A12P-07 | (TODO) -- GDC | mRNA__geneExp__FPKM | |
| TCGA-BH-A0DD-01A-31R-A12P-07 | (TODO) -- GDC | mRNA__counts__FPKM | |
| TCGA-BH-A0DE-01A-11R-A115-07 | (TODO) -- GDC | mRNA__geneExpNormed__FPKM | |
| TCGA-BH-A0DE-01A-11R-A115-07 | (TODO) -- GDC | mRNA__geneExp__FPKM | |
| TCGA-BH-A0DE-01A-11R-A115-07 | (TODO) -- GDC | mRNA__counts__FPKM | |
| TCGA-BH-A0DG-01A-21R-A12P-07 | (TODO) -- GDC | mRNA__geneExpNormed__FPKM | |
| TCGA-BH-A0DG-01A-21R-A12P-07 | (TODO) -- GDC | mRNA__geneExp__FPKM | |
| TCGA-BH-A0DG-01A-21R-A12P-07 | (TODO) -- GDC | mRNA__counts__FPKM | |
| TCGA-BH-A0DH-01A-11R-A084-07 | (TODO) -- GDC | mRNA__geneExpNormed__FPKM | |
| TCGA-BH-A0DH-01A-11R-A084-07 | (TODO) -- GDC | mRNA__geneExp__FPKM | |
| TCGA-BH-A0DH-01A-11R-A084-07 | (TODO) -- GDC | mRNA__counts__FPKM | |
| TCGA-BH-A0DI-01A-21R-A12P-07 | (TODO) -- GDC | mRNA__geneExpNormed__FPKM | |
| TCGA-BH-A0DI-01A-21R-A12P-07 | (TODO) -- GDC | mRNA__geneExp__FPKM | |
| TCGA-BH-A0DI-01A-21R-A12P-07 | (TODO) -- GDC | mRNA__counts__FPKM | |
| TCGA-BH-A0DK-01A-21R-A056-07 | (TODO) -- GDC | mRNA__geneExpNormed__FPKM | |
| TCGA-BH-A0DK-01A-21R-A056-07 | (TODO) -- GDC | mRNA__geneExp__FPKM | |
| TCGA-BH-A0DK-01A-21R-A056-07 | (TODO) -- GDC | mRNA__counts__FPKM | |
| TCGA-BH-A0DL-01A-11R-A115-07 | (TODO) -- GDC | mRNA__geneExpNormed__FPKM | |
| TCGA-BH-A0DL-01A-11R-A115-07 | (TODO) -- GDC | mRNA__geneExp__FPKM | |
| TCGA-BH-A0DL-01A-11R-A115-07 | (TODO) -- GDC | mRNA__counts__FPKM | |
| TCGA-BH-A0DO-01B-11R-A12D-07 | (TODO) -- GDC | mRNA__geneExpNormed__FPKM | |
| TCGA-BH-A0DO-01B-11R-A12D-07 | (TODO) -- GDC | mRNA__geneExp__FPKM | |
| TCGA-BH-A0DO-01B-11R-A12D-07 | (TODO) -- GDC | mRNA__counts__FPKM | |
| TCGA-BH-A0DP-01A-21R-A056-07 | (TODO) -- GDC | mRNA__geneExpNormed__FPKM | |
| TCGA-BH-A0DP-01A-21R-A056-07 | (TODO) -- GDC | mRNA__geneExp__FPKM | |
| TCGA-BH-A0DP-01A-21R-A056-07 | (TODO) -- GDC | mRNA__counts__FPKM | |
| TCGA-BH-A0DQ-01A-11R-A084-07 | (TODO) -- GDC | mRNA__geneExpNormed__FPKM | |
| TCGA-BH-A0DQ-01A-11R-A084-07 | (TODO) -- GDC | mRNA__geneExp__FPKM | |
| TCGA-BH-A0DQ-01A-11R-A084-07 | (TODO) -- GDC | mRNA__counts__FPKM | |
| TCGA-BH-A0DS-01A-11R-A056-07 | (TODO) -- GDC | mRNA__geneExpNormed__FPKM | |
| TCGA-BH-A0DS-01A-11R-A056-07 | (TODO) -- GDC | mRNA__geneExp__FPKM | |
| TCGA-BH-A0DS-01A-11R-A056-07 | (TODO) -- GDC | mRNA__counts__FPKM | |
| TCGA-BH-A0DT-01A-21R-A12D-07 | (TODO) -- GDC | mRNA__geneExpNormed__FPKM | |
| TCGA-BH-A0DT-01A-21R-A12D-07 | (TODO) -- GDC | mRNA__geneExp__FPKM | |
| TCGA-BH-A0DT-01A-21R-A12D-07 | (TODO) -- GDC | mRNA__counts__FPKM | |
| TCGA-BH-A0DV-01A-21R-A12P-07 | (TODO) -- GDC | mRNA__geneExpNormed__FPKM | |
| TCGA-BH-A0DV-01A-21R-A12P-07 | (TODO) -- GDC | mRNA__geneExp__FPKM | |
| TCGA-BH-A0DV-01A-21R-A12P-07 | (TODO) -- GDC | mRNA__counts__FPKM | |
| TCGA-BH-A0DX-01A-11R-A115-07 | (TODO) -- GDC | mRNA__geneExpNormed__FPKM | |
| TCGA-BH-A0DX-01A-11R-A115-07 | (TODO) -- GDC | mRNA__geneExp__FPKM | |
| TCGA-BH-A0DX-01A-11R-A115-07 | (TODO) -- GDC | mRNA__counts__FPKM | |
| TCGA-BH-A0DZ-01A-11R-A00Z-07 | (TODO) -- GDC | mRNA__geneExpNormed__FPKM | |
| TCGA-BH-A0DZ-01A-11R-A00Z-07 | (TODO) -- GDC | mRNA__geneExp__FPKM | |
| TCGA-BH-A0DZ-01A-11R-A00Z-07 | (TODO) -- GDC | mRNA__counts__FPKM | |
| TCGA-BH-A0E0-01A-11R-A056-07 | (TODO) -- GDC | mRNA__geneExpNormed__FPKM | |
| TCGA-BH-A0E0-01A-11R-A056-07 | (TODO) -- GDC | mRNA__geneExp__FPKM | |
| TCGA-BH-A0E0-01A-11R-A056-07 | (TODO) -- GDC | mRNA__counts__FPKM | |
| TCGA-BH-A0E1-01A-11R-A056-07 | (TODO) -- GDC | mRNA__geneExpNormed__FPKM | |
| TCGA-BH-A0E1-01A-11R-A056-07 | (TODO) -- GDC | mRNA__geneExp__FPKM | |
| TCGA-BH-A0E1-01A-11R-A056-07 | (TODO) -- GDC | mRNA__counts__FPKM | |
| TCGA-BH-A0E2-01A-11R-A056-07 | (TODO) -- GDC | mRNA__geneExpNormed__FPKM | |
| TCGA-BH-A0E2-01A-11R-A056-07 | (TODO) -- GDC | mRNA__geneExp__FPKM | |
| TCGA-BH-A0E2-01A-11R-A056-07 | (TODO) -- GDC | mRNA__counts__FPKM | |
| TCGA-BH-A0E6-01A-11R-A034-07 | (TODO) -- GDC | mRNA__geneExpNormed__FPKM | |
| TCGA-BH-A0E6-01A-11R-A034-07 | (TODO) -- GDC | mRNA__geneExp__FPKM | |
| TCGA-BH-A0E6-01A-11R-A034-07 | (TODO) -- GDC | mRNA__counts__FPKM | |
| TCGA-BH-A0E7-01A-11R-A034-07 | (TODO) -- GDC | mRNA__geneExpNormed__FPKM | |
| TCGA-BH-A0E7-01A-11R-A034-07 | (TODO) -- GDC | mRNA__geneExp__FPKM | |
| TCGA-BH-A0E7-01A-11R-A034-07 | (TODO) -- GDC | mRNA__counts__FPKM | |
| TCGA-BH-A0E9-01B-11R-A115-07 | (TODO) -- GDC | mRNA__geneExpNormed__FPKM | |
| TCGA-BH-A0E9-01B-11R-A115-07 | (TODO) -- GDC | mRNA__geneExp__FPKM | |
| TCGA-BH-A0E9-01B-11R-A115-07 | (TODO) -- GDC | mRNA__counts__FPKM | |
| TCGA-BH-A0EA-01A-11R-A115-07 | (TODO) -- GDC | mRNA__geneExpNormed__FPKM | |
| TCGA-BH-A0EA-01A-11R-A115-07 | (TODO) -- GDC | mRNA__geneExp__FPKM | |
| TCGA-BH-A0EA-01A-11R-A115-07 | (TODO) -- GDC | mRNA__counts__FPKM | |
| TCGA-BH-A0EB-01A-11R-A034-07 | (TODO) -- GDC | mRNA__geneExpNormed__FPKM | |
| TCGA-BH-A0EB-01A-11R-A034-07 | (TODO) -- GDC | mRNA__geneExp__FPKM | |
| TCGA-BH-A0EB-01A-11R-A034-07 | (TODO) -- GDC | mRNA__counts__FPKM | |
| TCGA-BH-A0EE-01A-11R-A034-07 | (TODO) -- GDC | mRNA__geneExpNormed__FPKM | |
| TCGA-BH-A0EE-01A-11R-A034-07 | (TODO) -- GDC | mRNA__geneExp__FPKM | |
| TCGA-BH-A0EE-01A-11R-A034-07 | (TODO) -- GDC | mRNA__counts__FPKM | |
| TCGA-BH-A0EI-01A-11R-A115-07 | (TODO) -- GDC | mRNA__geneExpNormed__FPKM | |
| TCGA-BH-A0EI-01A-11R-A115-07 | (TODO) -- GDC | mRNA__geneExp__FPKM | |
| TCGA-BH-A0EI-01A-11R-A115-07 | (TODO) -- GDC | mRNA__counts__FPKM | |
| TCGA-BH-A0GY-01A-11R-A056-07 | (TODO) -- GDC | mRNA__geneExpNormed__FPKM | |
| TCGA-BH-A0GY-01A-11R-A056-07 | (TODO) -- GDC | mRNA__geneExp__FPKM | |
| TCGA-BH-A0GY-01A-11R-A056-07 | (TODO) -- GDC | mRNA__counts__FPKM | |
| TCGA-BH-A0GZ-01A-11R-A056-07 | (TODO) -- GDC | mRNA__geneExpNormed__FPKM | |
| TCGA-BH-A0GZ-01A-11R-A056-07 | (TODO) -- GDC | mRNA__geneExp__FPKM | |
| TCGA-BH-A0GZ-01A-11R-A056-07 | (TODO) -- GDC | mRNA__counts__FPKM | |
| TCGA-BH-A0H0-01A-11R-A056-07 | (TODO) -- GDC | mRNA__geneExpNormed__FPKM | |
| TCGA-BH-A0H0-01A-11R-A056-07 | (TODO) -- GDC | mRNA__geneExp__FPKM | |
| TCGA-BH-A0H0-01A-11R-A056-07 | (TODO) -- GDC | mRNA__counts__FPKM | |
| TCGA-BH-A0H3-01A-11R-A12P-07 | (TODO) -- GDC | mRNA__geneExpNormed__FPKM | |
| TCGA-BH-A0H3-01A-11R-A12P-07 | (TODO) -- GDC | mRNA__geneExp__FPKM | |
| TCGA-BH-A0H3-01A-11R-A12P-07 | (TODO) -- GDC | mRNA__counts__FPKM | |
| TCGA-BH-A0H5-01A-21R-A115-07 | (TODO) -- GDC | mRNA__geneExpNormed__FPKM | |
| TCGA-BH-A0H5-01A-21R-A115-07 | (TODO) -- GDC | mRNA__geneExp__FPKM | |
| TCGA-BH-A0H5-01A-21R-A115-07 | (TODO) -- GDC | mRNA__counts__FPKM | |
| TCGA-BH-A0H6-01A-21R-A056-07 | (TODO) -- GDC | mRNA__geneExpNormed__FPKM | |
| TCGA-BH-A0H6-01A-21R-A056-07 | (TODO) -- GDC | mRNA__geneExp__FPKM | |
| TCGA-BH-A0H6-01A-21R-A056-07 | (TODO) -- GDC | mRNA__counts__FPKM | |
| TCGA-BH-A0H7-01A-13R-A056-07 | (TODO) -- GDC | mRNA__geneExpNormed__FPKM | |
| TCGA-BH-A0H7-01A-13R-A056-07 | (TODO) -- GDC | mRNA__geneExp__FPKM | |
| TCGA-BH-A0H7-01A-13R-A056-07 | (TODO) -- GDC | mRNA__counts__FPKM | |
| TCGA-BH-A0H9-01A-11R-A056-07 | (TODO) -- GDC | mRNA__geneExpNormed__FPKM | |
| TCGA-BH-A0H9-01A-11R-A056-07 | (TODO) -- GDC | mRNA__geneExp__FPKM | |
| TCGA-BH-A0H9-01A-11R-A056-07 | (TODO) -- GDC | mRNA__counts__FPKM | |
| TCGA-BH-A0HA-01A-11R-A12P-07 | (TODO) -- GDC | mRNA__geneExpNormed__FPKM | |
| TCGA-BH-A0HA-01A-11R-A12P-07 | (TODO) -- GDC | mRNA__geneExp__FPKM | |
| TCGA-BH-A0HA-01A-11R-A12P-07 | (TODO) -- GDC | mRNA__counts__FPKM | |
| TCGA-BH-A0HB-01A-11R-A056-07 | (TODO) -- GDC | mRNA__geneExpNormed__FPKM | |
| TCGA-BH-A0HB-01A-11R-A056-07 | (TODO) -- GDC | mRNA__geneExp__FPKM | |
| TCGA-BH-A0HB-01A-11R-A056-07 | (TODO) -- GDC | mRNA__counts__FPKM | |
| TCGA-BH-A0HF-01A-11R-A056-07 | (TODO) -- GDC | mRNA__geneExpNormed__FPKM | |
| TCGA-BH-A0HF-01A-11R-A056-07 | (TODO) -- GDC | mRNA__geneExp__FPKM | |
| TCGA-BH-A0HF-01A-11R-A056-07 | (TODO) -- GDC | mRNA__counts__FPKM | |
| TCGA-BH-A0HI-01A-11R-A084-07 | (TODO) -- GDC | mRNA__geneExpNormed__FPKM | |
| TCGA-BH-A0HI-01A-11R-A084-07 | (TODO) -- GDC | mRNA__geneExp__FPKM | |
| TCGA-BH-A0HI-01A-11R-A084-07 | (TODO) -- GDC | mRNA__counts__FPKM | |
| TCGA-BH-A0HK-01A-11R-A056-07 | (TODO) -- GDC | mRNA__geneExpNormed__FPKM | |
| TCGA-BH-A0HK-01A-11R-A056-07 | (TODO) -- GDC | mRNA__geneExp__FPKM | |
| TCGA-BH-A0HK-01A-11R-A056-07 | (TODO) -- GDC | mRNA__counts__FPKM | |
| TCGA-BH-A0HL-01A-11R-A10U-07 | (TODO) -- GDC | mRNA__geneExpNormed__FPKM | |
| TCGA-BH-A0HL-01A-11R-A10U-07 | (TODO) -- GDC | mRNA__geneExp__FPKM | |
| TCGA-BH-A0HL-01A-11R-A10U-07 | (TODO) -- GDC | mRNA__counts__FPKM | |
| TCGA-BH-A0HN-01A-11R-A10U-07 | (TODO) -- GDC | mRNA__geneExpNormed__FPKM | |
| TCGA-BH-A0HN-01A-11R-A10U-07 | (TODO) -- GDC | mRNA__geneExp__FPKM | |
| TCGA-BH-A0HN-01A-11R-A10U-07 | (TODO) -- GDC | mRNA__counts__FPKM | |
| TCGA-BH-A0HO-01A-11R-A034-07 | (TODO) -- GDC | mRNA__geneExpNormed__FPKM | |
| TCGA-BH-A0HO-01A-11R-A034-07 | (TODO) -- GDC | mRNA__geneExp__FPKM | |
| TCGA-BH-A0HO-01A-11R-A034-07 | (TODO) -- GDC | mRNA__counts__FPKM | |
| TCGA-BH-A0HP-01A-12R-A084-07 | (TODO) -- GDC | mRNA__geneExpNormed__FPKM | |
| TCGA-BH-A0HP-01A-12R-A084-07 | (TODO) -- GDC | mRNA__geneExp__FPKM | |
| TCGA-BH-A0HP-01A-12R-A084-07 | (TODO) -- GDC | mRNA__counts__FPKM | |
| TCGA-BH-A0HQ-01A-11R-A034-07 | (TODO) -- GDC | mRNA__geneExpNormed__FPKM | |
| TCGA-BH-A0HQ-01A-11R-A034-07 | (TODO) -- GDC | mRNA__geneExp__FPKM | |
| TCGA-BH-A0HQ-01A-11R-A034-07 | (TODO) -- GDC | mRNA__counts__FPKM | |
| TCGA-BH-A0HU-01A-11R-A034-07 | (TODO) -- GDC | mRNA__geneExpNormed__FPKM | |
| TCGA-BH-A0HU-01A-11R-A034-07 | (TODO) -- GDC | mRNA__geneExp__FPKM | |
| TCGA-BH-A0HU-01A-11R-A034-07 | (TODO) -- GDC | mRNA__counts__FPKM | |
| TCGA-BH-A0HW-01A-11R-A034-07 | (TODO) -- GDC | mRNA__geneExpNormed__FPKM | |
| TCGA-BH-A0HW-01A-11R-A034-07 | (TODO) -- GDC | mRNA__geneExp__FPKM | |
| TCGA-BH-A0HW-01A-11R-A034-07 | (TODO) -- GDC | mRNA__counts__FPKM | |
| TCGA-BH-A0HX-01A-21R-A056-07 | (TODO) -- GDC | mRNA__geneExpNormed__FPKM | |
| TCGA-BH-A0HX-01A-21R-A056-07 | (TODO) -- GDC | mRNA__geneExp__FPKM | |
| TCGA-BH-A0HX-01A-21R-A056-07 | (TODO) -- GDC | mRNA__counts__FPKM | |
| TCGA-BH-A0HY-01A-11R-A056-07 | (TODO) -- GDC | mRNA__geneExpNormed__FPKM | |
| TCGA-BH-A0HY-01A-11R-A056-07 | (TODO) -- GDC | mRNA__geneExp__FPKM | |
| TCGA-BH-A0HY-01A-11R-A056-07 | (TODO) -- GDC | mRNA__counts__FPKM | |
| TCGA-BH-A0RX-01A-21R-A084-07 | (TODO) -- GDC | mRNA__geneExpNormed__FPKM | |
| TCGA-BH-A0RX-01A-21R-A084-07 | (TODO) -- GDC | mRNA__geneExp__FPKM | |
| TCGA-BH-A0RX-01A-21R-A084-07 | (TODO) -- GDC | mRNA__counts__FPKM | |
| TCGA-BH-A0W3-01A-11R-A109-07 | (TODO) -- GDC | mRNA__geneExpNormed__FPKM | |
| TCGA-BH-A0W3-01A-11R-A109-07 | (TODO) -- GDC | mRNA__geneExp__FPKM | |
| TCGA-BH-A0W3-01A-11R-A109-07 | (TODO) -- GDC | mRNA__counts__FPKM | |
| TCGA-BH-A0W4-01A-11R-A109-07 | (TODO) -- GDC | mRNA__geneExpNormed__FPKM | |
| TCGA-BH-A0W4-01A-11R-A109-07 | (TODO) -- GDC | mRNA__geneExp__FPKM | |
| TCGA-BH-A0W4-01A-11R-A109-07 | (TODO) -- GDC | mRNA__counts__FPKM | |
| TCGA-BH-A0W5-01A-11R-A109-07 | (TODO) -- GDC | mRNA__geneExpNormed__FPKM | |
| TCGA-BH-A0W5-01A-11R-A109-07 | (TODO) -- GDC | mRNA__geneExp__FPKM | |
| TCGA-BH-A0W5-01A-11R-A109-07 | (TODO) -- GDC | mRNA__counts__FPKM | |
| TCGA-BH-A0W7-01A-11R-A115-07 | (TODO) -- GDC | mRNA__geneExpNormed__FPKM | |
| TCGA-BH-A0W7-01A-11R-A115-07 | (TODO) -- GDC | mRNA__geneExp__FPKM | |
| TCGA-BH-A0W7-01A-11R-A115-07 | (TODO) -- GDC | mRNA__counts__FPKM | |
| TCGA-BH-A0WA-01A-11R-A109-07 | (TODO) -- GDC | mRNA__geneExpNormed__FPKM | |
| TCGA-BH-A0WA-01A-11R-A109-07 | (TODO) -- GDC | mRNA__geneExp__FPKM | |
| TCGA-BH-A0WA-01A-11R-A109-07 | (TODO) -- GDC | mRNA__counts__FPKM | |
| TCGA-BH-A18F-01A-11R-A12D-07 | (TODO) -- GDC | mRNA__geneExpNormed__FPKM | |
| TCGA-BH-A18F-01A-11R-A12D-07 | (TODO) -- GDC | mRNA__geneExp__FPKM | |
| TCGA-BH-A18F-01A-11R-A12D-07 | (TODO) -- GDC | mRNA__counts__FPKM | |
| TCGA-BH-A18G-01A-11R-A12D-07 | (TODO) -- GDC | mRNA__geneExpNormed__FPKM | |
| TCGA-BH-A18G-01A-11R-A12D-07 | (TODO) -- GDC | mRNA__geneExp__FPKM | |
| TCGA-BH-A18G-01A-11R-A12D-07 | (TODO) -- GDC | mRNA__counts__FPKM | |
| TCGA-BH-A18H-01A-11R-A12D-07 | (TODO) -- GDC | mRNA__geneExpNormed__FPKM | |
| TCGA-BH-A18H-01A-11R-A12D-07 | (TODO) -- GDC | mRNA__geneExp__FPKM | |
| TCGA-BH-A18H-01A-11R-A12D-07 | (TODO) -- GDC | mRNA__counts__FPKM | |
| TCGA-BH-A18I-01A-11R-A12D-07 | (TODO) -- GDC | mRNA__geneExpNormed__FPKM | |
| TCGA-BH-A18I-01A-11R-A12D-07 | (TODO) -- GDC | mRNA__geneExp__FPKM | |
| TCGA-BH-A18I-01A-11R-A12D-07 | (TODO) -- GDC | mRNA__counts__FPKM | |
| TCGA-BH-A18J-01A-11R-A12D-07 | (TODO) -- GDC | mRNA__geneExpNormed__FPKM | |
| TCGA-BH-A18J-01A-11R-A12D-07 | (TODO) -- GDC | mRNA__geneExp__FPKM | |
| TCGA-BH-A18J-01A-11R-A12D-07 | (TODO) -- GDC | mRNA__counts__FPKM | |
| TCGA-BH-A18K-01A-11R-A12D-07 | (TODO) -- GDC | mRNA__geneExpNormed__FPKM | |
| TCGA-BH-A18K-01A-11R-A12D-07 | (TODO) -- GDC | mRNA__geneExp__FPKM | |
| TCGA-BH-A18K-01A-11R-A12D-07 | (TODO) -- GDC | mRNA__counts__FPKM | |
| TCGA-BH-A18L-01A-32R-A12D-07 | (TODO) -- GDC | mRNA__geneExpNormed__FPKM | |
| TCGA-BH-A18L-01A-32R-A12D-07 | (TODO) -- GDC | mRNA__geneExp__FPKM | |
| TCGA-BH-A18L-01A-32R-A12D-07 | (TODO) -- GDC | mRNA__counts__FPKM | |
| TCGA-BH-A18M-01A-11R-A12D-07 | (TODO) -- GDC | mRNA__geneExpNormed__FPKM | |
| TCGA-BH-A18M-01A-11R-A12D-07 | (TODO) -- GDC | mRNA__geneExp__FPKM | |
| TCGA-BH-A18M-01A-11R-A12D-07 | (TODO) -- GDC | mRNA__counts__FPKM | |
| TCGA-BH-A18N-01A-11R-A12D-07 | (TODO) -- GDC | mRNA__geneExpNormed__FPKM | |
| TCGA-BH-A18N-01A-11R-A12D-07 | (TODO) -- GDC | mRNA__geneExp__FPKM | |
| TCGA-BH-A18N-01A-11R-A12D-07 | (TODO) -- GDC | mRNA__counts__FPKM | |
| TCGA-BH-A18P-01A-11R-A12D-07 | (TODO) -- GDC | mRNA__geneExpNormed__FPKM | |
| TCGA-BH-A18P-01A-11R-A12D-07 | (TODO) -- GDC | mRNA__geneExp__FPKM | |
| TCGA-BH-A18P-01A-11R-A12D-07 | (TODO) -- GDC | mRNA__counts__FPKM | |
| TCGA-BH-A18Q-01A-12R-A12D-07 | (TODO) -- GDC | mRNA__geneExpNormed__FPKM | |
| TCGA-BH-A18Q-01A-12R-A12D-07 | (TODO) -- GDC | mRNA__geneExp__FPKM | |
| TCGA-BH-A18Q-01A-12R-A12D-07 | (TODO) -- GDC | mRNA__counts__FPKM | |
| TCGA-BH-A18R-01A-11R-A12D-07 | (TODO) -- GDC | mRNA__geneExpNormed__FPKM | |
| TCGA-BH-A18R-01A-11R-A12D-07 | (TODO) -- GDC | mRNA__geneExp__FPKM | |
| TCGA-BH-A18R-01A-11R-A12D-07 | (TODO) -- GDC | mRNA__counts__FPKM | |
| TCGA-BH-A18S-01A-11R-A12D-07 | (TODO) -- GDC | mRNA__geneExpNormed__FPKM | |
| TCGA-BH-A18S-01A-11R-A12D-07 | (TODO) -- GDC | mRNA__geneExp__FPKM | |
| TCGA-BH-A18S-01A-11R-A12D-07 | (TODO) -- GDC | mRNA__counts__FPKM | |
| TCGA-BH-A18T-01A-11R-A12D-07 | (TODO) -- GDC | mRNA__geneExpNormed__FPKM | |
| TCGA-BH-A18T-01A-11R-A12D-07 | (TODO) -- GDC | mRNA__geneExp__FPKM | |
| TCGA-BH-A18T-01A-11R-A12D-07 | (TODO) -- GDC | mRNA__counts__FPKM | |
| TCGA-BH-A18U-01A-21R-A12D-07 | (TODO) -- GDC | mRNA__geneExpNormed__FPKM | |
| TCGA-BH-A18U-01A-21R-A12D-07 | (TODO) -- GDC | mRNA__geneExp__FPKM | |
| TCGA-BH-A18U-01A-21R-A12D-07 | (TODO) -- GDC | mRNA__counts__FPKM | |
| TCGA-BH-A18V-01A-11R-A12D-07 | (TODO) -- GDC | mRNA__geneExpNormed__FPKM | |
| TCGA-BH-A18V-01A-11R-A12D-07 | (TODO) -- GDC | mRNA__geneExp__FPKM | |
| TCGA-BH-A18V-01A-11R-A12D-07 | (TODO) -- GDC | mRNA__counts__FPKM | |
| TCGA-BH-A1EN-01A-11R-A13Q-07 | (TODO) -- GDC | mRNA__geneExpNormed__FPKM | |
| TCGA-BH-A1EN-01A-11R-A13Q-07 | (TODO) -- GDC | mRNA__geneExp__FPKM | |
| TCGA-BH-A1EN-01A-11R-A13Q-07 | (TODO) -- GDC | mRNA__counts__FPKM | |
| TCGA-BH-A1EO-01A-11R-A137-07 | (TODO) -- GDC | mRNA__geneExpNormed__FPKM | |
| TCGA-BH-A1EO-01A-11R-A137-07 | (TODO) -- GDC | mRNA__geneExp__FPKM | |
| TCGA-BH-A1EO-01A-11R-A137-07 | (TODO) -- GDC | mRNA__counts__FPKM | |
| TCGA-BH-A1ES-01A-11R-A137-07 | (TODO) -- GDC | mRNA__geneExpNormed__FPKM | |
| TCGA-BH-A1ES-01A-11R-A137-07 | (TODO) -- GDC | mRNA__geneExp__FPKM | |
| TCGA-BH-A1ES-01A-11R-A137-07 | (TODO) -- GDC | mRNA__counts__FPKM | |
| TCGA-BH-A1ET-01A-11R-A137-07 | (TODO) -- GDC | mRNA__geneExpNormed__FPKM | |
| TCGA-BH-A1ET-01A-11R-A137-07 | (TODO) -- GDC | mRNA__geneExp__FPKM | |
| TCGA-BH-A1ET-01A-11R-A137-07 | (TODO) -- GDC | mRNA__counts__FPKM | |
| TCGA-BH-A1EU-01A-11R-A137-07 | (TODO) -- GDC | mRNA__geneExpNormed__FPKM | |
| TCGA-BH-A1EU-01A-11R-A137-07 | (TODO) -- GDC | mRNA__geneExp__FPKM | |
| TCGA-BH-A1EU-01A-11R-A137-07 | (TODO) -- GDC | mRNA__counts__FPKM | |
| TCGA-BH-A1EV-01A-11R-A137-07 | (TODO) -- GDC | mRNA__geneExpNormed__FPKM | |
| TCGA-BH-A1EV-01A-11R-A137-07 | (TODO) -- GDC | mRNA__geneExp__FPKM | |
| TCGA-BH-A1EV-01A-11R-A137-07 | (TODO) -- GDC | mRNA__counts__FPKM | |
| TCGA-BH-A1EW-01A-11R-A137-07 | (TODO) -- GDC | mRNA__geneExpNormed__FPKM | |
| TCGA-BH-A1EW-01A-11R-A137-07 | (TODO) -- GDC | mRNA__geneExp__FPKM | |
| TCGA-BH-A1EW-01A-11R-A137-07 | (TODO) -- GDC | mRNA__counts__FPKM | |
| TCGA-BH-A1EX-01A-11R-A13Q-07 | (TODO) -- GDC | mRNA__geneExpNormed__FPKM | |
| TCGA-BH-A1EX-01A-11R-A13Q-07 | (TODO) -- GDC | mRNA__geneExp__FPKM | |
| TCGA-BH-A1EX-01A-11R-A13Q-07 | (TODO) -- GDC | mRNA__counts__FPKM | |
| TCGA-BH-A1EY-01A-11R-A13Q-07 | (TODO) -- GDC | mRNA__geneExpNormed__FPKM | |
| TCGA-BH-A1EY-01A-11R-A13Q-07 | (TODO) -- GDC | mRNA__geneExp__FPKM | |
| TCGA-BH-A1EY-01A-11R-A13Q-07 | (TODO) -- GDC | mRNA__counts__FPKM | |
| TCGA-BH-A1F0-01A-11R-A137-07 | (TODO) -- GDC | mRNA__geneExpNormed__FPKM | |
| TCGA-BH-A1F0-01A-11R-A137-07 | (TODO) -- GDC | mRNA__geneExp__FPKM | |
| TCGA-BH-A1F0-01A-11R-A137-07 | (TODO) -- GDC | mRNA__counts__FPKM | |
| TCGA-BH-A1F2-01A-31R-A13Q-07 | (TODO) -- GDC | mRNA__geneExpNormed__FPKM | |
| TCGA-BH-A1F2-01A-31R-A13Q-07 | (TODO) -- GDC | mRNA__geneExp__FPKM | |
| TCGA-BH-A1F2-01A-31R-A13Q-07 | (TODO) -- GDC | mRNA__counts__FPKM | |
| TCGA-BH-A1F5-01A-12R-A13Q-07 | (TODO) -- GDC | mRNA__geneExpNormed__FPKM | |
| TCGA-BH-A1F5-01A-12R-A13Q-07 | (TODO) -- GDC | mRNA__geneExp__FPKM | |
| TCGA-BH-A1F5-01A-12R-A13Q-07 | (TODO) -- GDC | mRNA__counts__FPKM | |
| TCGA-BH-A1F6-01A-11R-A13Q-07 | (TODO) -- GDC | mRNA__geneExpNormed__FPKM | |
| TCGA-BH-A1F6-01A-11R-A13Q-07 | (TODO) -- GDC | mRNA__geneExp__FPKM | |
| TCGA-BH-A1F6-01A-11R-A13Q-07 | (TODO) -- GDC | mRNA__counts__FPKM | |
| TCGA-BH-A1F8-01A-11R-A13Q-07 | (TODO) -- GDC | mRNA__geneExpNormed__FPKM | |
| TCGA-BH-A1F8-01A-11R-A13Q-07 | (TODO) -- GDC | mRNA__geneExp__FPKM | |
| TCGA-BH-A1F8-01A-11R-A13Q-07 | (TODO) -- GDC | mRNA__counts__FPKM | |
| TCGA-BH-A1FB-01A-11R-A13Q-07 | (TODO) -- GDC | mRNA__geneExpNormed__FPKM | |
| TCGA-BH-A1FB-01A-11R-A13Q-07 | (TODO) -- GDC | mRNA__geneExp__FPKM | |
| TCGA-BH-A1FB-01A-11R-A13Q-07 | (TODO) -- GDC | mRNA__counts__FPKM | |
| TCGA-BH-A1FC-01A-11R-A13Q-07 | (TODO) -- GDC | mRNA__geneExpNormed__FPKM | |
| TCGA-BH-A1FC-01A-11R-A13Q-07 | (TODO) -- GDC | mRNA__geneExp__FPKM | |
| TCGA-BH-A1FC-01A-11R-A13Q-07 | (TODO) -- GDC | mRNA__counts__FPKM | |
| TCGA-BH-A1FD-01A-11R-A13Q-07 | (TODO) -- GDC | mRNA__geneExpNormed__FPKM | |
| TCGA-BH-A1FD-01A-11R-A13Q-07 | (TODO) -- GDC | mRNA__geneExp__FPKM | |
| TCGA-BH-A1FD-01A-11R-A13Q-07 | (TODO) -- GDC | mRNA__counts__FPKM | |
| TCGA-BH-A1FE-01A-11R-A13Q-07 | (TODO) -- GDC | mRNA__geneExpNormed__FPKM | |
| TCGA-BH-A1FE-01A-11R-A13Q-07 | (TODO) -- GDC | mRNA__geneExp__FPKM | |
| TCGA-BH-A1FE-01A-11R-A13Q-07 | (TODO) -- GDC | mRNA__counts__FPKM | |
| TCGA-BH-A1FG-01A-11R-A13Q-07 | (TODO) -- GDC | mRNA__geneExpNormed__FPKM | |
| TCGA-BH-A1FG-01A-11R-A13Q-07 | (TODO) -- GDC | mRNA__geneExp__FPKM | |
| TCGA-BH-A1FG-01A-11R-A13Q-07 | (TODO) -- GDC | mRNA__counts__FPKM | |
| TCGA-BH-A1FH-01A-12R-A13Q-07 | (TODO) -- GDC | mRNA__geneExpNormed__FPKM | |
| TCGA-BH-A1FH-01A-12R-A13Q-07 | (TODO) -- GDC | mRNA__geneExp__FPKM | |
| TCGA-BH-A1FH-01A-12R-A13Q-07 | (TODO) -- GDC | mRNA__counts__FPKM | |
| TCGA-BH-A1FJ-01A-11R-A13Q-07 | (TODO) -- GDC | mRNA__geneExpNormed__FPKM | |
| TCGA-BH-A1FJ-01A-11R-A13Q-07 | (TODO) -- GDC | mRNA__geneExp__FPKM | |
| TCGA-BH-A1FJ-01A-11R-A13Q-07 | (TODO) -- GDC | mRNA__counts__FPKM | |
| TCGA-BH-A1FL-01A-11R-A13Q-07 | (TODO) -- GDC | mRNA__geneExpNormed__FPKM | |
| TCGA-BH-A1FL-01A-11R-A13Q-07 | (TODO) -- GDC | mRNA__geneExp__FPKM | |
| TCGA-BH-A1FL-01A-11R-A13Q-07 | (TODO) -- GDC | mRNA__counts__FPKM | |
| TCGA-BH-A1FM-01A-11R-A13Q-07 | (TODO) -- GDC | mRNA__geneExpNormed__FPKM | |
| TCGA-BH-A1FM-01A-11R-A13Q-07 | (TODO) -- GDC | mRNA__geneExp__FPKM | |
| TCGA-BH-A1FM-01A-11R-A13Q-07 | (TODO) -- GDC | mRNA__counts__FPKM | |
| TCGA-BH-A1FN-01A-11R-A13Q-07 | (TODO) -- GDC | mRNA__geneExpNormed__FPKM | |
| TCGA-BH-A1FN-01A-11R-A13Q-07 | (TODO) -- GDC | mRNA__geneExp__FPKM | |
| TCGA-BH-A1FN-01A-11R-A13Q-07 | (TODO) -- GDC | mRNA__counts__FPKM | |
| TCGA-BH-A1FR-01A-11R-A13Q-07 | (TODO) -- GDC | mRNA__geneExpNormed__FPKM | |
| TCGA-BH-A1FR-01A-11R-A13Q-07 | (TODO) -- GDC | mRNA__geneExp__FPKM | |
| TCGA-BH-A1FR-01A-11R-A13Q-07 | (TODO) -- GDC | mRNA__counts__FPKM | |
| TCGA-BH-A1FU-01A-11R-A14D-07 | (TODO) -- GDC | mRNA__geneExpNormed__FPKM | |
| TCGA-BH-A1FU-01A-11R-A14D-07 | (TODO) -- GDC | mRNA__geneExp__FPKM | |
| TCGA-BH-A1FU-01A-11R-A14D-07 | (TODO) -- GDC | mRNA__counts__FPKM | |
| TCGA-BH-A201-01A-11R-A14M-07 | (TODO) -- GDC | mRNA__geneExpNormed__FPKM | |
| TCGA-BH-A201-01A-11R-A14M-07 | (TODO) -- GDC | mRNA__geneExp__FPKM | |
| TCGA-BH-A201-01A-11R-A14M-07 | (TODO) -- GDC | mRNA__counts__FPKM | |
| TCGA-BH-A202-01A-11R-A14M-07 | (TODO) -- GDC | mRNA__geneExpNormed__FPKM | |
| TCGA-BH-A202-01A-11R-A14M-07 | (TODO) -- GDC | mRNA__geneExp__FPKM | |
| TCGA-BH-A202-01A-11R-A14M-07 | (TODO) -- GDC | mRNA__counts__FPKM | |
| TCGA-BH-A203-01A-12R-A169-07 | (TODO) -- GDC | mRNA__geneExpNormed__FPKM | |
| TCGA-BH-A203-01A-12R-A169-07 | (TODO) -- GDC | mRNA__geneExp__FPKM | |
| TCGA-BH-A203-01A-12R-A169-07 | (TODO) -- GDC | mRNA__counts__FPKM | |
| TCGA-BH-A204-01A-11R-A157-07 | (TODO) -- GDC | mRNA__geneExpNormed__FPKM | |
| TCGA-BH-A204-01A-11R-A157-07 | (TODO) -- GDC | mRNA__geneExp__FPKM | |
| TCGA-BH-A204-01A-11R-A157-07 | (TODO) -- GDC | mRNA__counts__FPKM | |
| TCGA-BH-A208-01A-11R-A157-07 | (TODO) -- GDC | mRNA__geneExpNormed__FPKM | |
| TCGA-BH-A208-01A-11R-A157-07 | (TODO) -- GDC | mRNA__geneExp__FPKM | |
| TCGA-BH-A208-01A-11R-A157-07 | (TODO) -- GDC | mRNA__counts__FPKM | |
| TCGA-BH-A209-01A-11R-A157-07 | (TODO) -- GDC | mRNA__geneExpNormed__FPKM | |
| TCGA-BH-A209-01A-11R-A157-07 | (TODO) -- GDC | mRNA__geneExp__FPKM | |
| TCGA-BH-A209-01A-11R-A157-07 | (TODO) -- GDC | mRNA__counts__FPKM | |
| TCGA-BH-A28O-01A-11R-A22K-07 | (TODO) -- GDC | mRNA__geneExpNormed__FPKM | |
| TCGA-BH-A28O-01A-11R-A22K-07 | (TODO) -- GDC | mRNA__geneExp__FPKM | |
| TCGA-BH-A28O-01A-11R-A22K-07 | (TODO) -- GDC | mRNA__counts__FPKM | |
| TCGA-BH-A28Q-01A-11R-A16F-07 | (TODO) -- GDC | mRNA__geneExpNormed__FPKM | |
| TCGA-BH-A28Q-01A-11R-A16F-07 | (TODO) -- GDC | mRNA__geneExp__FPKM | |
| TCGA-BH-A28Q-01A-11R-A16F-07 | (TODO) -- GDC | mRNA__counts__FPKM | |
| TCGA-BH-A2L8-01A-11R-A18M-07 | (TODO) -- GDC | mRNA__geneExpNormed__FPKM | |
| TCGA-BH-A2L8-01A-11R-A18M-07 | (TODO) -- GDC | mRNA__geneExp__FPKM | |
| TCGA-BH-A2L8-01A-11R-A18M-07 | (TODO) -- GDC | mRNA__counts__FPKM | |
| TCGA-BH-A42T-01A-11R-A24H-07 | (TODO) -- GDC | mRNA__geneExpNormed__FPKM | |
| TCGA-BH-A42T-01A-11R-A24H-07 | (TODO) -- GDC | mRNA__geneExp__FPKM | |
| TCGA-BH-A42T-01A-11R-A24H-07 | (TODO) -- GDC | mRNA__counts__FPKM | |
| TCGA-BH-A42U-01A-12R-A24H-07 | (TODO) -- GDC | mRNA__geneExpNormed__FPKM | |
| TCGA-BH-A42U-01A-12R-A24H-07 | (TODO) -- GDC | mRNA__geneExp__FPKM | |
| TCGA-BH-A42U-01A-12R-A24H-07 | (TODO) -- GDC | mRNA__counts__FPKM | |
| TCGA-BH-A42V-01A-11R-A24H-07 | (TODO) -- GDC | mRNA__geneExpNormed__FPKM | |
| TCGA-BH-A42V-01A-11R-A24H-07 | (TODO) -- GDC | mRNA__geneExp__FPKM | |
| TCGA-BH-A42V-01A-11R-A24H-07 | (TODO) -- GDC | mRNA__counts__FPKM | |
| TCGA-BH-A5IZ-01A-11R-A27Q-07 | (TODO) -- GDC | mRNA__geneExpNormed__FPKM | |
| TCGA-BH-A5IZ-01A-11R-A27Q-07 | (TODO) -- GDC | mRNA__geneExp__FPKM | |
| TCGA-BH-A5IZ-01A-11R-A27Q-07 | (TODO) -- GDC | mRNA__counts__FPKM | |
| TCGA-BH-A5J0-01A-11R-A27Q-07 | (TODO) -- GDC | mRNA__geneExpNormed__FPKM | |
| TCGA-BH-A5J0-01A-11R-A27Q-07 | (TODO) -- GDC | mRNA__geneExp__FPKM | |
| TCGA-BH-A5J0-01A-11R-A27Q-07 | (TODO) -- GDC | mRNA__counts__FPKM | |
| TCGA-BH-A6R8-01A-21R-A33J-07 | (TODO) -- GDC | mRNA__geneExpNormed__FPKM | |
| TCGA-BH-A6R8-01A-21R-A33J-07 | (TODO) -- GDC | mRNA__geneExp__FPKM | |
| TCGA-BH-A6R8-01A-21R-A33J-07 | (TODO) -- GDC | mRNA__counts__FPKM | |
| TCGA-BH-A6R9-01A-21R-A32P-07 | (TODO) -- GDC | mRNA__geneExpNormed__FPKM | |
| TCGA-BH-A6R9-01A-21R-A32P-07 | (TODO) -- GDC | mRNA__geneExp__FPKM | |
| TCGA-BH-A6R9-01A-21R-A32P-07 | (TODO) -- GDC | mRNA__counts__FPKM | |
| TCGA-BH-A8FY-01A-11R-A36F-07 | (TODO) -- GDC | mRNA__geneExpNormed__FPKM | |
| TCGA-BH-A8FY-01A-11R-A36F-07 | (TODO) -- GDC | mRNA__geneExp__FPKM | |
| TCGA-BH-A8FY-01A-11R-A36F-07 | (TODO) -- GDC | mRNA__counts__FPKM | |
| TCGA-BH-A8FZ-01A-11R-A352-07 | (TODO) -- GDC | mRNA__geneExpNormed__FPKM | |
| TCGA-BH-A8FZ-01A-11R-A352-07 | (TODO) -- GDC | mRNA__geneExp__FPKM | |
| TCGA-BH-A8FZ-01A-11R-A352-07 | (TODO) -- GDC | mRNA__counts__FPKM | |
| TCGA-BH-A8G0-01A-11R-A352-07 | (TODO) -- GDC | mRNA__geneExpNormed__FPKM | |
| TCGA-BH-A8G0-01A-11R-A352-07 | (TODO) -- GDC | mRNA__geneExp__FPKM | |
| TCGA-BH-A8G0-01A-11R-A352-07 | (TODO) -- GDC | mRNA__counts__FPKM | |
| TCGA-BH-AB28-01A-31R-A41B-07 | (TODO) -- GDC | mRNA__geneExpNormed__FPKM | |
| TCGA-BH-AB28-01A-31R-A41B-07 | (TODO) -- GDC | mRNA__geneExp__FPKM | |
| TCGA-BH-AB28-01A-31R-A41B-07 | (TODO) -- GDC | mRNA__counts__FPKM | |
| TCGA-C8-A12K-01A-21R-A115-07 | (TODO) -- GDC | mRNA__geneExpNormed__FPKM | |
| TCGA-C8-A12K-01A-21R-A115-07 | (TODO) -- GDC | mRNA__geneExp__FPKM | |
| TCGA-C8-A12K-01A-21R-A115-07 | (TODO) -- GDC | mRNA__counts__FPKM | |
| TCGA-C8-A12L-01A-11R-A115-07 | (TODO) -- GDC | mRNA__geneExpNormed__FPKM | |
| TCGA-C8-A12L-01A-11R-A115-07 | (TODO) -- GDC | mRNA__geneExp__FPKM | |
| TCGA-C8-A12L-01A-11R-A115-07 | (TODO) -- GDC | mRNA__counts__FPKM | |
| TCGA-C8-A12M-01A-11R-A115-07 | (TODO) -- GDC | mRNA__geneExpNormed__FPKM | |
| TCGA-C8-A12M-01A-11R-A115-07 | (TODO) -- GDC | mRNA__geneExp__FPKM | |
| TCGA-C8-A12M-01A-11R-A115-07 | (TODO) -- GDC | mRNA__counts__FPKM | |
| TCGA-C8-A12N-01A-11R-A115-07 | (TODO) -- GDC | mRNA__geneExpNormed__FPKM | |
| TCGA-C8-A12N-01A-11R-A115-07 | (TODO) -- GDC | mRNA__geneExp__FPKM | |
| TCGA-C8-A12N-01A-11R-A115-07 | (TODO) -- GDC | mRNA__counts__FPKM | |
| TCGA-C8-A12O-01A-11R-A115-07 | (TODO) -- GDC | mRNA__geneExpNormed__FPKM | |
| TCGA-C8-A12O-01A-11R-A115-07 | (TODO) -- GDC | mRNA__geneExp__FPKM | |
| TCGA-C8-A12O-01A-11R-A115-07 | (TODO) -- GDC | mRNA__counts__FPKM | |
| TCGA-C8-A12P-01A-11R-A115-07 | (TODO) -- GDC | mRNA__geneExpNormed__FPKM | |
| TCGA-C8-A12P-01A-11R-A115-07 | (TODO) -- GDC | mRNA__geneExp__FPKM | |
| TCGA-C8-A12P-01A-11R-A115-07 | (TODO) -- GDC | mRNA__counts__FPKM | |
| TCGA-C8-A12Q-01A-11R-A115-07 | (TODO) -- GDC | mRNA__geneExpNormed__FPKM | |
| TCGA-C8-A12Q-01A-11R-A115-07 | (TODO) -- GDC | mRNA__geneExp__FPKM | |
| TCGA-C8-A12Q-01A-11R-A115-07 | (TODO) -- GDC | mRNA__counts__FPKM | |
| TCGA-C8-A12T-01A-11R-A115-07 | (TODO) -- GDC | mRNA__geneExpNormed__FPKM | |
| TCGA-C8-A12T-01A-11R-A115-07 | (TODO) -- GDC | mRNA__geneExp__FPKM | |
| TCGA-C8-A12T-01A-11R-A115-07 | (TODO) -- GDC | mRNA__counts__FPKM | |
| TCGA-C8-A12U-01A-11R-A115-07 | (TODO) -- GDC | mRNA__geneExpNormed__FPKM | |
| TCGA-C8-A12U-01A-11R-A115-07 | (TODO) -- GDC | mRNA__geneExp__FPKM | |
| TCGA-C8-A12U-01A-11R-A115-07 | (TODO) -- GDC | mRNA__counts__FPKM | |
| TCGA-C8-A12V-01A-11R-A115-07 | (TODO) -- GDC | mRNA__geneExpNormed__FPKM | |
| TCGA-C8-A12V-01A-11R-A115-07 | (TODO) -- GDC | mRNA__geneExp__FPKM | |
| TCGA-C8-A12V-01A-11R-A115-07 | (TODO) -- GDC | mRNA__counts__FPKM | |
| TCGA-C8-A12W-01A-11R-A115-07 | (TODO) -- GDC | mRNA__geneExpNormed__FPKM | |
| TCGA-C8-A12W-01A-11R-A115-07 | (TODO) -- GDC | mRNA__geneExp__FPKM | |
| TCGA-C8-A12W-01A-11R-A115-07 | (TODO) -- GDC | mRNA__counts__FPKM | |
| TCGA-C8-A12X-01A-11R-A115-07 | (TODO) -- GDC | mRNA__geneExpNormed__FPKM | |
| TCGA-C8-A12X-01A-11R-A115-07 | (TODO) -- GDC | mRNA__geneExp__FPKM | |
| TCGA-C8-A12X-01A-11R-A115-07 | (TODO) -- GDC | mRNA__counts__FPKM | |
| TCGA-C8-A12Y-01A-11R-A12D-07 | (TODO) -- GDC | mRNA__geneExpNormed__FPKM | |
| TCGA-C8-A12Y-01A-11R-A12D-07 | (TODO) -- GDC | mRNA__geneExp__FPKM | |
| TCGA-C8-A12Y-01A-11R-A12D-07 | (TODO) -- GDC | mRNA__counts__FPKM | |
| TCGA-C8-A12Z-01A-11R-A115-07 | (TODO) -- GDC | mRNA__geneExpNormed__FPKM | |
| TCGA-C8-A12Z-01A-11R-A115-07 | (TODO) -- GDC | mRNA__geneExp__FPKM | |
| TCGA-C8-A12Z-01A-11R-A115-07 | (TODO) -- GDC | mRNA__counts__FPKM | |
| TCGA-C8-A130-01A-31R-A115-07 | (TODO) -- GDC | mRNA__geneExpNormed__FPKM | |
| TCGA-C8-A130-01A-31R-A115-07 | (TODO) -- GDC | mRNA__geneExp__FPKM | |
| TCGA-C8-A130-01A-31R-A115-07 | (TODO) -- GDC | mRNA__counts__FPKM | |
| TCGA-C8-A131-01A-11R-A115-07 | (TODO) -- GDC | mRNA__geneExpNormed__FPKM | |
| TCGA-C8-A131-01A-11R-A115-07 | (TODO) -- GDC | mRNA__geneExp__FPKM | |
| TCGA-C8-A131-01A-11R-A115-07 | (TODO) -- GDC | mRNA__counts__FPKM | |
| TCGA-C8-A132-01A-31R-A115-07 | (TODO) -- GDC | mRNA__geneExpNormed__FPKM | |
| TCGA-C8-A132-01A-31R-A115-07 | (TODO) -- GDC | mRNA__geneExp__FPKM | |
| TCGA-C8-A132-01A-31R-A115-07 | (TODO) -- GDC | mRNA__counts__FPKM | |
| TCGA-C8-A133-01A-32R-A12D-07 | (TODO) -- GDC | mRNA__geneExpNormed__FPKM | |
| TCGA-C8-A133-01A-32R-A12D-07 | (TODO) -- GDC | mRNA__geneExp__FPKM | |
| TCGA-C8-A133-01A-32R-A12D-07 | (TODO) -- GDC | mRNA__counts__FPKM | |
| TCGA-C8-A134-01A-11R-A115-07 | (TODO) -- GDC | mRNA__geneExpNormed__FPKM | |
| TCGA-C8-A134-01A-11R-A115-07 | (TODO) -- GDC | mRNA__geneExp__FPKM | |
| TCGA-C8-A134-01A-11R-A115-07 | (TODO) -- GDC | mRNA__counts__FPKM | |
| TCGA-C8-A135-01A-11R-A115-07 | (TODO) -- GDC | mRNA__geneExpNormed__FPKM | |
| TCGA-C8-A135-01A-11R-A115-07 | (TODO) -- GDC | mRNA__geneExp__FPKM | |
| TCGA-C8-A135-01A-11R-A115-07 | (TODO) -- GDC | mRNA__counts__FPKM | |
| TCGA-C8-A137-01A-11R-A115-07 | (TODO) -- GDC | mRNA__geneExpNormed__FPKM | |
| TCGA-C8-A137-01A-11R-A115-07 | (TODO) -- GDC | mRNA__geneExp__FPKM | |
| TCGA-C8-A137-01A-11R-A115-07 | (TODO) -- GDC | mRNA__counts__FPKM | |
| TCGA-C8-A138-01A-11R-A115-07 | (TODO) -- GDC | mRNA__geneExpNormed__FPKM | |
| TCGA-C8-A138-01A-11R-A115-07 | (TODO) -- GDC | mRNA__geneExp__FPKM | |
| TCGA-C8-A138-01A-11R-A115-07 | (TODO) -- GDC | mRNA__counts__FPKM | |
| TCGA-C8-A1HE-01A-11R-A13Q-07 | (TODO) -- GDC | mRNA__geneExpNormed__FPKM | |
| TCGA-C8-A1HE-01A-11R-A13Q-07 | (TODO) -- GDC | mRNA__geneExp__FPKM | |
| TCGA-C8-A1HE-01A-11R-A13Q-07 | (TODO) -- GDC | mRNA__counts__FPKM | |
| TCGA-C8-A1HF-01A-11R-A137-07 | (TODO) -- GDC | mRNA__geneExpNormed__FPKM | |
| TCGA-C8-A1HF-01A-11R-A137-07 | (TODO) -- GDC | mRNA__geneExp__FPKM | |
| TCGA-C8-A1HF-01A-11R-A137-07 | (TODO) -- GDC | mRNA__counts__FPKM | |
| TCGA-C8-A1HG-01A-11R-A137-07 | (TODO) -- GDC | mRNA__geneExpNormed__FPKM | |
| TCGA-C8-A1HG-01A-11R-A137-07 | (TODO) -- GDC | mRNA__geneExp__FPKM | |
| TCGA-C8-A1HG-01A-11R-A137-07 | (TODO) -- GDC | mRNA__counts__FPKM | |
| TCGA-C8-A1HI-01A-11R-A137-07 | (TODO) -- GDC | mRNA__geneExpNormed__FPKM | |
| TCGA-C8-A1HI-01A-11R-A137-07 | (TODO) -- GDC | mRNA__geneExp__FPKM | |
| TCGA-C8-A1HI-01A-11R-A137-07 | (TODO) -- GDC | mRNA__counts__FPKM | |
| TCGA-C8-A1HJ-01A-11R-A13Q-07 | (TODO) -- GDC | mRNA__geneExpNormed__FPKM | |
| TCGA-C8-A1HJ-01A-11R-A13Q-07 | (TODO) -- GDC | mRNA__geneExp__FPKM | |
| TCGA-C8-A1HJ-01A-11R-A13Q-07 | (TODO) -- GDC | mRNA__counts__FPKM | |
| TCGA-C8-A1HK-01A-21R-A13Q-07 | (TODO) -- GDC | mRNA__geneExpNormed__FPKM | |
| TCGA-C8-A1HK-01A-21R-A13Q-07 | (TODO) -- GDC | mRNA__geneExp__FPKM | |
| TCGA-C8-A1HK-01A-21R-A13Q-07 | (TODO) -- GDC | mRNA__counts__FPKM | |
| TCGA-C8-A1HL-01A-11R-A137-07 | (TODO) -- GDC | mRNA__geneExpNormed__FPKM | |
| TCGA-C8-A1HL-01A-11R-A137-07 | (TODO) -- GDC | mRNA__geneExp__FPKM | |
| TCGA-C8-A1HL-01A-11R-A137-07 | (TODO) -- GDC | mRNA__counts__FPKM | |
| TCGA-C8-A1HM-01A-12R-A137-07 | (TODO) -- GDC | mRNA__geneExpNormed__FPKM | |
| TCGA-C8-A1HM-01A-12R-A137-07 | (TODO) -- GDC | mRNA__geneExp__FPKM | |
| TCGA-C8-A1HM-01A-12R-A137-07 | (TODO) -- GDC | mRNA__counts__FPKM | |
| TCGA-C8-A1HN-01A-11R-A137-07 | (TODO) -- GDC | mRNA__geneExpNormed__FPKM | |
| TCGA-C8-A1HN-01A-11R-A137-07 | (TODO) -- GDC | mRNA__geneExp__FPKM | |
| TCGA-C8-A1HN-01A-11R-A137-07 | (TODO) -- GDC | mRNA__counts__FPKM | |
| TCGA-C8-A1HO-01A-11R-A13Q-07 | (TODO) -- GDC | mRNA__geneExpNormed__FPKM | |
| TCGA-C8-A1HO-01A-11R-A13Q-07 | (TODO) -- GDC | mRNA__geneExp__FPKM | |
| TCGA-C8-A1HO-01A-11R-A13Q-07 | (TODO) -- GDC | mRNA__counts__FPKM | |
| TCGA-C8-A26V-01A-11R-A16F-07 | (TODO) -- GDC | mRNA__geneExpNormed__FPKM | |
| TCGA-C8-A26V-01A-11R-A16F-07 | (TODO) -- GDC | mRNA__geneExp__FPKM | |
| TCGA-C8-A26V-01A-11R-A16F-07 | (TODO) -- GDC | mRNA__counts__FPKM | |
| TCGA-C8-A26W-01A-11R-A16F-07 | (TODO) -- GDC | mRNA__geneExpNormed__FPKM | |
| TCGA-C8-A26W-01A-11R-A16F-07 | (TODO) -- GDC | mRNA__geneExp__FPKM | |
| TCGA-C8-A26W-01A-11R-A16F-07 | (TODO) -- GDC | mRNA__counts__FPKM | |
| TCGA-C8-A26X-01A-31R-A16F-07 | (TODO) -- GDC | mRNA__geneExpNormed__FPKM | |
| TCGA-C8-A26X-01A-31R-A16F-07 | (TODO) -- GDC | mRNA__geneExp__FPKM | |
| TCGA-C8-A26X-01A-31R-A16F-07 | (TODO) -- GDC | mRNA__counts__FPKM | |
| TCGA-C8-A26Y-01A-11R-A16F-07 | (TODO) -- GDC | mRNA__geneExpNormed__FPKM | |
| TCGA-C8-A26Y-01A-11R-A16F-07 | (TODO) -- GDC | mRNA__geneExp__FPKM | |
| TCGA-C8-A26Y-01A-11R-A16F-07 | (TODO) -- GDC | mRNA__counts__FPKM | |
| TCGA-C8-A26Z-01A-11R-A16F-07 | (TODO) -- GDC | mRNA__geneExpNormed__FPKM | |
| TCGA-C8-A26Z-01A-11R-A16F-07 | (TODO) -- GDC | mRNA__geneExp__FPKM | |
| TCGA-C8-A26Z-01A-11R-A16F-07 | (TODO) -- GDC | mRNA__counts__FPKM | |
| TCGA-C8-A273-01A-11R-A16F-07 | (TODO) -- GDC | mRNA__geneExpNormed__FPKM | |
| TCGA-C8-A273-01A-11R-A16F-07 | (TODO) -- GDC | mRNA__geneExp__FPKM | |
| TCGA-C8-A273-01A-11R-A16F-07 | (TODO) -- GDC | mRNA__counts__FPKM | |
| TCGA-C8-A274-01A-11R-A16F-07 | (TODO) -- GDC | mRNA__geneExpNormed__FPKM | |
| TCGA-C8-A274-01A-11R-A16F-07 | (TODO) -- GDC | mRNA__geneExp__FPKM | |
| TCGA-C8-A274-01A-11R-A16F-07 | (TODO) -- GDC | mRNA__counts__FPKM | |
| TCGA-C8-A275-01A-21R-A16F-07 | (TODO) -- GDC | mRNA__geneExpNormed__FPKM | |
| TCGA-C8-A275-01A-21R-A16F-07 | (TODO) -- GDC | mRNA__geneExp__FPKM | |
| TCGA-C8-A275-01A-21R-A16F-07 | (TODO) -- GDC | mRNA__counts__FPKM | |
| TCGA-C8-A278-01A-11R-A169-07 | (TODO) -- GDC | mRNA__geneExpNormed__FPKM | |
| TCGA-C8-A278-01A-11R-A169-07 | (TODO) -- GDC | mRNA__geneExp__FPKM | |
| TCGA-C8-A278-01A-11R-A169-07 | (TODO) -- GDC | mRNA__counts__FPKM | |
| TCGA-C8-A27A-01A-11R-A169-07 | (TODO) -- GDC | mRNA__geneExpNormed__FPKM | |
| TCGA-C8-A27A-01A-11R-A169-07 | (TODO) -- GDC | mRNA__geneExp__FPKM | |
| TCGA-C8-A27A-01A-11R-A169-07 | (TODO) -- GDC | mRNA__counts__FPKM | |
| TCGA-C8-A27B-01A-11R-A169-07 | (TODO) -- GDC | mRNA__geneExpNormed__FPKM | |
| TCGA-C8-A27B-01A-11R-A169-07 | (TODO) -- GDC | mRNA__geneExp__FPKM | |
| TCGA-C8-A27B-01A-11R-A169-07 | (TODO) -- GDC | mRNA__counts__FPKM | |
| TCGA-C8-A3M7-01A-12R-A21T-07 | (TODO) -- GDC | mRNA__geneExpNormed__FPKM | |
| TCGA-C8-A3M7-01A-12R-A21T-07 | (TODO) -- GDC | mRNA__geneExp__FPKM | |
| TCGA-C8-A3M7-01A-12R-A21T-07 | (TODO) -- GDC | mRNA__counts__FPKM | |
| TCGA-C8-A3M8-01A-11R-A213-07 | (TODO) -- GDC | mRNA__geneExpNormed__FPKM | |
| TCGA-C8-A3M8-01A-11R-A213-07 | (TODO) -- GDC | mRNA__geneExp__FPKM | |
| TCGA-C8-A3M8-01A-11R-A213-07 | (TODO) -- GDC | mRNA__counts__FPKM | |
| TCGA-C8-A8HP-01A-11R-A36F-07 | (TODO) -- GDC | mRNA__geneExpNormed__FPKM | |
| TCGA-C8-A8HP-01A-11R-A36F-07 | (TODO) -- GDC | mRNA__geneExp__FPKM | |
| TCGA-C8-A8HP-01A-11R-A36F-07 | (TODO) -- GDC | mRNA__counts__FPKM | |
| TCGA-C8-A8HQ-01A-11R-A36F-07 | (TODO) -- GDC | mRNA__geneExpNormed__FPKM | |
| TCGA-C8-A8HQ-01A-11R-A36F-07 | (TODO) -- GDC | mRNA__geneExp__FPKM | |
| TCGA-C8-A8HQ-01A-11R-A36F-07 | (TODO) -- GDC | mRNA__counts__FPKM | |
| TCGA-C8-A8HR-01A-11R-A36F-07 | (TODO) -- GDC | mRNA__geneExpNormed__FPKM | |
| TCGA-C8-A8HR-01A-11R-A36F-07 | (TODO) -- GDC | mRNA__geneExp__FPKM | |
| TCGA-C8-A8HR-01A-11R-A36F-07 | (TODO) -- GDC | mRNA__counts__FPKM | |
| TCGA-D8-A13Y-01A-11R-A115-07 | (TODO) -- GDC | mRNA__geneExpNormed__FPKM | |
| TCGA-D8-A13Y-01A-11R-A115-07 | (TODO) -- GDC | mRNA__geneExp__FPKM | |
| TCGA-D8-A13Y-01A-11R-A115-07 | (TODO) -- GDC | mRNA__counts__FPKM | |
| TCGA-D8-A13Z-01A-11R-A115-07 | (TODO) -- GDC | mRNA__geneExpNormed__FPKM | |
| TCGA-D8-A13Z-01A-11R-A115-07 | (TODO) -- GDC | mRNA__geneExp__FPKM | |
| TCGA-D8-A13Z-01A-11R-A115-07 | (TODO) -- GDC | mRNA__counts__FPKM | |
| TCGA-D8-A140-01A-11R-A115-07 | (TODO) -- GDC | mRNA__geneExpNormed__FPKM | |
| TCGA-D8-A140-01A-11R-A115-07 | (TODO) -- GDC | mRNA__geneExp__FPKM | |
| TCGA-D8-A140-01A-11R-A115-07 | (TODO) -- GDC | mRNA__counts__FPKM | |
| TCGA-D8-A141-01A-11R-A115-07 | (TODO) -- GDC | mRNA__geneExpNormed__FPKM | |
| TCGA-D8-A141-01A-11R-A115-07 | (TODO) -- GDC | mRNA__geneExp__FPKM | |
| TCGA-D8-A141-01A-11R-A115-07 | (TODO) -- GDC | mRNA__counts__FPKM | |
| TCGA-D8-A142-01A-11R-A115-07 | (TODO) -- GDC | mRNA__geneExpNormed__FPKM | |
| TCGA-D8-A142-01A-11R-A115-07 | (TODO) -- GDC | mRNA__geneExp__FPKM | |
| TCGA-D8-A142-01A-11R-A115-07 | (TODO) -- GDC | mRNA__counts__FPKM | |
| TCGA-D8-A143-01A-11R-A115-07 | (TODO) -- GDC | mRNA__geneExpNormed__FPKM | |
| TCGA-D8-A143-01A-11R-A115-07 | (TODO) -- GDC | mRNA__geneExp__FPKM | |
| TCGA-D8-A143-01A-11R-A115-07 | (TODO) -- GDC | mRNA__counts__FPKM | |
| TCGA-D8-A145-01A-11R-A115-07 | (TODO) -- GDC | mRNA__geneExpNormed__FPKM | |
| TCGA-D8-A145-01A-11R-A115-07 | (TODO) -- GDC | mRNA__geneExp__FPKM | |
| TCGA-D8-A145-01A-11R-A115-07 | (TODO) -- GDC | mRNA__counts__FPKM | |
| TCGA-D8-A146-01A-31R-A115-07 | (TODO) -- GDC | mRNA__geneExpNormed__FPKM | |
| TCGA-D8-A146-01A-31R-A115-07 | (TODO) -- GDC | mRNA__geneExp__FPKM | |
| TCGA-D8-A146-01A-31R-A115-07 | (TODO) -- GDC | mRNA__counts__FPKM | |
| TCGA-D8-A147-01A-11R-A115-07 | (TODO) -- GDC | mRNA__geneExpNormed__FPKM | |
| TCGA-D8-A147-01A-11R-A115-07 | (TODO) -- GDC | mRNA__geneExp__FPKM | |
| TCGA-D8-A147-01A-11R-A115-07 | (TODO) -- GDC | mRNA__counts__FPKM | |
| TCGA-D8-A1J8-01A-11R-A13Q-07 | (TODO) -- GDC | mRNA__geneExpNormed__FPKM | |
| TCGA-D8-A1J8-01A-11R-A13Q-07 | (TODO) -- GDC | mRNA__geneExp__FPKM | |
| TCGA-D8-A1J8-01A-11R-A13Q-07 | (TODO) -- GDC | mRNA__counts__FPKM | |
| TCGA-D8-A1J9-01A-11R-A13Q-07 | (TODO) -- GDC | mRNA__geneExpNormed__FPKM | |
| TCGA-D8-A1J9-01A-11R-A13Q-07 | (TODO) -- GDC | mRNA__geneExp__FPKM | |
| TCGA-D8-A1J9-01A-11R-A13Q-07 | (TODO) -- GDC | mRNA__counts__FPKM | |
| TCGA-D8-A1JA-01A-11R-A13Q-07 | (TODO) -- GDC | mRNA__geneExpNormed__FPKM | |
| TCGA-D8-A1JA-01A-11R-A13Q-07 | (TODO) -- GDC | mRNA__geneExp__FPKM | |
| TCGA-D8-A1JA-01A-11R-A13Q-07 | (TODO) -- GDC | mRNA__counts__FPKM | |
| TCGA-D8-A1JB-01A-11R-A13Q-07 | (TODO) -- GDC | mRNA__geneExpNormed__FPKM | |
| TCGA-D8-A1JB-01A-11R-A13Q-07 | (TODO) -- GDC | mRNA__geneExp__FPKM | |
| TCGA-D8-A1JB-01A-11R-A13Q-07 | (TODO) -- GDC | mRNA__counts__FPKM | |
| TCGA-D8-A1JC-01A-11R-A13Q-07 | (TODO) -- GDC | mRNA__geneExpNormed__FPKM | |
| TCGA-D8-A1JC-01A-11R-A13Q-07 | (TODO) -- GDC | mRNA__geneExp__FPKM | |
| TCGA-D8-A1JC-01A-11R-A13Q-07 | (TODO) -- GDC | mRNA__counts__FPKM | |
| TCGA-D8-A1JD-01A-11R-A13Q-07 | (TODO) -- GDC | mRNA__geneExpNormed__FPKM | |
| TCGA-D8-A1JD-01A-11R-A13Q-07 | (TODO) -- GDC | mRNA__geneExp__FPKM | |
| TCGA-D8-A1JD-01A-11R-A13Q-07 | (TODO) -- GDC | mRNA__counts__FPKM | |
| TCGA-D8-A1JE-01A-11R-A13Q-07 | (TODO) -- GDC | mRNA__geneExpNormed__FPKM | |
| TCGA-D8-A1JE-01A-11R-A13Q-07 | (TODO) -- GDC | mRNA__geneExp__FPKM | |
| TCGA-D8-A1JE-01A-11R-A13Q-07 | (TODO) -- GDC | mRNA__counts__FPKM | |
| TCGA-D8-A1JF-01A-11R-A13Q-07 | (TODO) -- GDC | mRNA__geneExpNormed__FPKM | |
| TCGA-D8-A1JF-01A-11R-A13Q-07 | (TODO) -- GDC | mRNA__geneExp__FPKM | |
| TCGA-D8-A1JF-01A-11R-A13Q-07 | (TODO) -- GDC | mRNA__counts__FPKM | |
| TCGA-D8-A1JG-01B-11R-A13Q-07 | (TODO) -- GDC | mRNA__geneExpNormed__FPKM | |
| TCGA-D8-A1JG-01B-11R-A13Q-07 | (TODO) -- GDC | mRNA__geneExp__FPKM | |
| TCGA-D8-A1JG-01B-11R-A13Q-07 | (TODO) -- GDC | mRNA__counts__FPKM | |
| TCGA-D8-A1JH-01A-11R-A13Q-07 | (TODO) -- GDC | mRNA__geneExpNormed__FPKM | |
| TCGA-D8-A1JH-01A-11R-A13Q-07 | (TODO) -- GDC | mRNA__geneExp__FPKM | |
| TCGA-D8-A1JH-01A-11R-A13Q-07 | (TODO) -- GDC | mRNA__counts__FPKM | |
| TCGA-D8-A1JI-01A-11R-A13Q-07 | (TODO) -- GDC | mRNA__geneExpNormed__FPKM | |
| TCGA-D8-A1JI-01A-11R-A13Q-07 | (TODO) -- GDC | mRNA__geneExp__FPKM | |
| TCGA-D8-A1JI-01A-11R-A13Q-07 | (TODO) -- GDC | mRNA__counts__FPKM | |
| TCGA-D8-A1JJ-01A-31R-A14M-07 | (TODO) -- GDC | mRNA__geneExpNormed__FPKM | |
| TCGA-D8-A1JJ-01A-31R-A14M-07 | (TODO) -- GDC | mRNA__geneExp__FPKM | |
| TCGA-D8-A1JJ-01A-31R-A14M-07 | (TODO) -- GDC | mRNA__counts__FPKM | |
| TCGA-D8-A1JK-01A-11R-A13Q-07 | (TODO) -- GDC | mRNA__geneExpNormed__FPKM | |
| TCGA-D8-A1JK-01A-11R-A13Q-07 | (TODO) -- GDC | mRNA__geneExp__FPKM | |
| TCGA-D8-A1JK-01A-11R-A13Q-07 | (TODO) -- GDC | mRNA__counts__FPKM | |
| TCGA-D8-A1JL-01A-11R-A13Q-07 | (TODO) -- GDC | mRNA__geneExpNormed__FPKM | |
| TCGA-D8-A1JL-01A-11R-A13Q-07 | (TODO) -- GDC | mRNA__geneExp__FPKM | |
| TCGA-D8-A1JL-01A-11R-A13Q-07 | (TODO) -- GDC | mRNA__counts__FPKM | |
| TCGA-D8-A1JM-01A-11R-A13Q-07 | (TODO) -- GDC | mRNA__geneExpNormed__FPKM | |
| TCGA-D8-A1JM-01A-11R-A13Q-07 | (TODO) -- GDC | mRNA__geneExp__FPKM | |
| TCGA-D8-A1JM-01A-11R-A13Q-07 | (TODO) -- GDC | mRNA__counts__FPKM | |
| TCGA-D8-A1JN-01A-11R-A13Q-07 | (TODO) -- GDC | mRNA__geneExpNormed__FPKM | |
| TCGA-D8-A1JN-01A-11R-A13Q-07 | (TODO) -- GDC | mRNA__geneExp__FPKM | |
| TCGA-D8-A1JN-01A-11R-A13Q-07 | (TODO) -- GDC | mRNA__counts__FPKM | |
| TCGA-D8-A1JP-01A-11R-A13Q-07 | (TODO) -- GDC | mRNA__geneExpNormed__FPKM | |
| TCGA-D8-A1JP-01A-11R-A13Q-07 | (TODO) -- GDC | mRNA__geneExp__FPKM | |
| TCGA-D8-A1JP-01A-11R-A13Q-07 | (TODO) -- GDC | mRNA__counts__FPKM | |
| TCGA-D8-A1JS-01A-11R-A13Q-07 | (TODO) -- GDC | mRNA__geneExpNormed__FPKM | |
| TCGA-D8-A1JS-01A-11R-A13Q-07 | (TODO) -- GDC | mRNA__geneExp__FPKM | |
| TCGA-D8-A1JS-01A-11R-A13Q-07 | (TODO) -- GDC | mRNA__counts__FPKM | |
| TCGA-D8-A1JT-01A-31R-A13Q-07 | (TODO) -- GDC | mRNA__geneExpNormed__FPKM | |
| TCGA-D8-A1JT-01A-31R-A13Q-07 | (TODO) -- GDC | mRNA__geneExp__FPKM | |
| TCGA-D8-A1JT-01A-31R-A13Q-07 | (TODO) -- GDC | mRNA__counts__FPKM | |
| TCGA-D8-A1JU-01A-11R-A13Q-07 | (TODO) -- GDC | mRNA__geneExpNormed__FPKM | |
| TCGA-D8-A1JU-01A-11R-A13Q-07 | (TODO) -- GDC | mRNA__geneExp__FPKM | |
| TCGA-D8-A1JU-01A-11R-A13Q-07 | (TODO) -- GDC | mRNA__counts__FPKM | |
| TCGA-D8-A1X5-01A-11R-A14D-07 | (TODO) -- GDC | mRNA__geneExpNormed__FPKM | |
| TCGA-D8-A1X5-01A-11R-A14D-07 | (TODO) -- GDC | mRNA__geneExp__FPKM | |
| TCGA-D8-A1X5-01A-11R-A14D-07 | (TODO) -- GDC | mRNA__counts__FPKM | |
| TCGA-D8-A1X6-01A-11R-A14M-07 | (TODO) -- GDC | mRNA__geneExpNormed__FPKM | |
| TCGA-D8-A1X6-01A-11R-A14M-07 | (TODO) -- GDC | mRNA__geneExp__FPKM | |
| TCGA-D8-A1X6-01A-11R-A14M-07 | (TODO) -- GDC | mRNA__counts__FPKM | |
| TCGA-D8-A1X7-01A-11R-A14M-07 | (TODO) -- GDC | mRNA__geneExpNormed__FPKM | |
| TCGA-D8-A1X7-01A-11R-A14M-07 | (TODO) -- GDC | mRNA__geneExp__FPKM | |
| TCGA-D8-A1X7-01A-11R-A14M-07 | (TODO) -- GDC | mRNA__counts__FPKM | |
| TCGA-D8-A1X8-01A-11R-A14M-07 | (TODO) -- GDC | mRNA__geneExpNormed__FPKM | |
| TCGA-D8-A1X8-01A-11R-A14M-07 | (TODO) -- GDC | mRNA__geneExp__FPKM | |
| TCGA-D8-A1X8-01A-11R-A14M-07 | (TODO) -- GDC | mRNA__counts__FPKM | |
| TCGA-D8-A1X9-01A-12R-A157-07 | (TODO) -- GDC | mRNA__geneExpNormed__FPKM | |
| TCGA-D8-A1X9-01A-12R-A157-07 | (TODO) -- GDC | mRNA__geneExp__FPKM | |
| TCGA-D8-A1X9-01A-12R-A157-07 | (TODO) -- GDC | mRNA__counts__FPKM | |
| TCGA-D8-A1XA-01A-11R-A14D-07 | (TODO) -- GDC | mRNA__geneExpNormed__FPKM | |
| TCGA-D8-A1XA-01A-11R-A14D-07 | (TODO) -- GDC | mRNA__geneExp__FPKM | |
| TCGA-D8-A1XA-01A-11R-A14D-07 | (TODO) -- GDC | mRNA__counts__FPKM | |
| TCGA-D8-A1XB-01A-11R-A14D-07 | (TODO) -- GDC | mRNA__geneExpNormed__FPKM | |
| TCGA-D8-A1XB-01A-11R-A14D-07 | (TODO) -- GDC | mRNA__geneExp__FPKM | |
| TCGA-D8-A1XB-01A-11R-A14D-07 | (TODO) -- GDC | mRNA__counts__FPKM | |
| TCGA-D8-A1XC-01A-11R-A14D-07 | (TODO) -- GDC | mRNA__geneExpNormed__FPKM | |
| TCGA-D8-A1XC-01A-11R-A14D-07 | (TODO) -- GDC | mRNA__geneExp__FPKM | |
| TCGA-D8-A1XC-01A-11R-A14D-07 | (TODO) -- GDC | mRNA__counts__FPKM | |
| TCGA-D8-A1XD-01A-11R-A14D-07 | (TODO) -- GDC | mRNA__geneExpNormed__FPKM | |
| TCGA-D8-A1XD-01A-11R-A14D-07 | (TODO) -- GDC | mRNA__geneExp__FPKM | |
| TCGA-D8-A1XD-01A-11R-A14D-07 | (TODO) -- GDC | mRNA__counts__FPKM | |
| TCGA-D8-A1XF-01A-11R-A14D-07 | (TODO) -- GDC | mRNA__geneExpNormed__FPKM | |
| TCGA-D8-A1XF-01A-11R-A14D-07 | (TODO) -- GDC | mRNA__geneExp__FPKM | |
| TCGA-D8-A1XF-01A-11R-A14D-07 | (TODO) -- GDC | mRNA__counts__FPKM | |
| TCGA-D8-A1XG-01A-11R-A14D-07 | (TODO) -- GDC | mRNA__geneExpNormed__FPKM | |
| TCGA-D8-A1XG-01A-11R-A14D-07 | (TODO) -- GDC | mRNA__geneExp__FPKM | |
| TCGA-D8-A1XG-01A-11R-A14D-07 | (TODO) -- GDC | mRNA__counts__FPKM | |
| TCGA-D8-A1XJ-01A-11R-A14M-07 | (TODO) -- GDC | mRNA__geneExpNormed__FPKM | |
| TCGA-D8-A1XJ-01A-11R-A14M-07 | (TODO) -- GDC | mRNA__geneExp__FPKM | |
| TCGA-D8-A1XJ-01A-11R-A14M-07 | (TODO) -- GDC | mRNA__counts__FPKM | |
| TCGA-D8-A1XK-01A-21R-A14M-07 | (TODO) -- GDC | mRNA__geneExpNormed__FPKM | |
| TCGA-D8-A1XK-01A-21R-A14M-07 | (TODO) -- GDC | mRNA__geneExp__FPKM | |
| TCGA-D8-A1XK-01A-21R-A14M-07 | (TODO) -- GDC | mRNA__counts__FPKM | |
| TCGA-D8-A1XL-01A-11R-A14M-07 | (TODO) -- GDC | mRNA__geneExpNormed__FPKM | |
| TCGA-D8-A1XL-01A-11R-A14M-07 | (TODO) -- GDC | mRNA__geneExp__FPKM | |
| TCGA-D8-A1XL-01A-11R-A14M-07 | (TODO) -- GDC | mRNA__counts__FPKM | |
| TCGA-D8-A1XM-01A-21R-A14M-07 | (TODO) -- GDC | mRNA__geneExpNormed__FPKM | |
| TCGA-D8-A1XM-01A-21R-A14M-07 | (TODO) -- GDC | mRNA__geneExp__FPKM | |
| TCGA-D8-A1XM-01A-21R-A14M-07 | (TODO) -- GDC | mRNA__counts__FPKM | |
| TCGA-D8-A1XO-01A-11R-A14M-07 | (TODO) -- GDC | mRNA__geneExpNormed__FPKM | |
| TCGA-D8-A1XO-01A-11R-A14M-07 | (TODO) -- GDC | mRNA__geneExp__FPKM | |
| TCGA-D8-A1XO-01A-11R-A14M-07 | (TODO) -- GDC | mRNA__counts__FPKM | |
| TCGA-D8-A1XQ-01A-11R-A14M-07 | (TODO) -- GDC | mRNA__geneExpNormed__FPKM | |
| TCGA-D8-A1XQ-01A-11R-A14M-07 | (TODO) -- GDC | mRNA__geneExp__FPKM | |
| TCGA-D8-A1XQ-01A-11R-A14M-07 | (TODO) -- GDC | mRNA__counts__FPKM | |
| TCGA-D8-A1XR-01A-11R-A14M-07 | (TODO) -- GDC | mRNA__geneExpNormed__FPKM | |
| TCGA-D8-A1XR-01A-11R-A14M-07 | (TODO) -- GDC | mRNA__geneExp__FPKM | |
| TCGA-D8-A1XR-01A-11R-A14M-07 | (TODO) -- GDC | mRNA__counts__FPKM | |
| TCGA-D8-A1XS-01A-11R-A14M-07 | (TODO) -- GDC | mRNA__geneExpNormed__FPKM | |
| TCGA-D8-A1XS-01A-11R-A14M-07 | (TODO) -- GDC | mRNA__geneExp__FPKM | |
| TCGA-D8-A1XS-01A-11R-A14M-07 | (TODO) -- GDC | mRNA__counts__FPKM | |
| TCGA-D8-A1XT-01A-11R-A14M-07 | (TODO) -- GDC | mRNA__geneExpNormed__FPKM | |
| TCGA-D8-A1XT-01A-11R-A14M-07 | (TODO) -- GDC | mRNA__geneExp__FPKM | |
| TCGA-D8-A1XT-01A-11R-A14M-07 | (TODO) -- GDC | mRNA__counts__FPKM | |
| TCGA-D8-A1XU-01A-11R-A14M-07 | (TODO) -- GDC | mRNA__geneExpNormed__FPKM | |
| TCGA-D8-A1XU-01A-11R-A14M-07 | (TODO) -- GDC | mRNA__geneExp__FPKM | |
| TCGA-D8-A1XU-01A-11R-A14M-07 | (TODO) -- GDC | mRNA__counts__FPKM | |
| TCGA-D8-A1XV-01A-11R-A14M-07 | (TODO) -- GDC | mRNA__geneExpNormed__FPKM | |
| TCGA-D8-A1XV-01A-11R-A14M-07 | (TODO) -- GDC | mRNA__geneExp__FPKM | |
| TCGA-D8-A1XV-01A-11R-A14M-07 | (TODO) -- GDC | mRNA__counts__FPKM | |
| TCGA-D8-A1XW-01A-11R-A14M-07 | (TODO) -- GDC | mRNA__geneExpNormed__FPKM | |
| TCGA-D8-A1XW-01A-11R-A14M-07 | (TODO) -- GDC | mRNA__geneExp__FPKM | |
| TCGA-D8-A1XW-01A-11R-A14M-07 | (TODO) -- GDC | mRNA__counts__FPKM | |
| TCGA-D8-A1XY-01A-11R-A14M-07 | (TODO) -- GDC | mRNA__geneExpNormed__FPKM | |
| TCGA-D8-A1XY-01A-11R-A14M-07 | (TODO) -- GDC | mRNA__geneExp__FPKM | |
| TCGA-D8-A1XY-01A-11R-A14M-07 | (TODO) -- GDC | mRNA__counts__FPKM | |
| TCGA-D8-A1XZ-01A-11R-A14M-07 | (TODO) -- GDC | mRNA__geneExpNormed__FPKM | |
| TCGA-D8-A1XZ-01A-11R-A14M-07 | (TODO) -- GDC | mRNA__geneExp__FPKM | |
| TCGA-D8-A1XZ-01A-11R-A14M-07 | (TODO) -- GDC | mRNA__counts__FPKM | |
| TCGA-D8-A1Y0-01A-11R-A14M-07 | (TODO) -- GDC | mRNA__geneExpNormed__FPKM | |
| TCGA-D8-A1Y0-01A-11R-A14M-07 | (TODO) -- GDC | mRNA__geneExp__FPKM | |
| TCGA-D8-A1Y0-01A-11R-A14M-07 | (TODO) -- GDC | mRNA__counts__FPKM | |
| TCGA-D8-A1Y1-01A-21R-A14M-07 | (TODO) -- GDC | mRNA__geneExpNormed__FPKM | |
| TCGA-D8-A1Y1-01A-21R-A14M-07 | (TODO) -- GDC | mRNA__geneExp__FPKM | |
| TCGA-D8-A1Y1-01A-21R-A14M-07 | (TODO) -- GDC | mRNA__counts__FPKM | |
| TCGA-D8-A1Y2-01A-11R-A157-07 | (TODO) -- GDC | mRNA__geneExpNormed__FPKM | |
| TCGA-D8-A1Y2-01A-11R-A157-07 | (TODO) -- GDC | mRNA__geneExp__FPKM | |
| TCGA-D8-A1Y2-01A-11R-A157-07 | (TODO) -- GDC | mRNA__counts__FPKM | |
| TCGA-D8-A1Y3-01A-11R-A157-07 | (TODO) -- GDC | mRNA__geneExpNormed__FPKM | |
| TCGA-D8-A1Y3-01A-11R-A157-07 | (TODO) -- GDC | mRNA__geneExp__FPKM | |
| TCGA-D8-A1Y3-01A-11R-A157-07 | (TODO) -- GDC | mRNA__counts__FPKM | |
| TCGA-D8-A27E-01A-11R-A16F-07 | (TODO) -- GDC | mRNA__geneExpNormed__FPKM | |
| TCGA-D8-A27E-01A-11R-A16F-07 | (TODO) -- GDC | mRNA__geneExp__FPKM | |
| TCGA-D8-A27E-01A-11R-A16F-07 | (TODO) -- GDC | mRNA__counts__FPKM | |
| TCGA-D8-A27F-01A-11R-A16F-07 | (TODO) -- GDC | mRNA__geneExpNormed__FPKM | |
| TCGA-D8-A27F-01A-11R-A16F-07 | (TODO) -- GDC | mRNA__geneExp__FPKM | |
| TCGA-D8-A27F-01A-11R-A16F-07 | (TODO) -- GDC | mRNA__counts__FPKM | |
| TCGA-D8-A27G-01A-11R-A16F-07 | (TODO) -- GDC | mRNA__geneExpNormed__FPKM | |
| TCGA-D8-A27G-01A-11R-A16F-07 | (TODO) -- GDC | mRNA__geneExp__FPKM | |
| TCGA-D8-A27G-01A-11R-A16F-07 | (TODO) -- GDC | mRNA__counts__FPKM | |
| TCGA-D8-A27H-01A-11R-A16F-07 | (TODO) -- GDC | mRNA__geneExpNormed__FPKM | |
| TCGA-D8-A27H-01A-11R-A16F-07 | (TODO) -- GDC | mRNA__geneExp__FPKM | |
| TCGA-D8-A27H-01A-11R-A16F-07 | (TODO) -- GDC | mRNA__counts__FPKM | |
| TCGA-D8-A27I-01A-11R-A16F-07 | (TODO) -- GDC | mRNA__geneExpNormed__FPKM | |
| TCGA-D8-A27I-01A-11R-A16F-07 | (TODO) -- GDC | mRNA__geneExp__FPKM | |
| TCGA-D8-A27I-01A-11R-A16F-07 | (TODO) -- GDC | mRNA__counts__FPKM | |
| TCGA-D8-A27K-01A-11R-A16F-07 | (TODO) -- GDC | mRNA__geneExpNormed__FPKM | |
| TCGA-D8-A27K-01A-11R-A16F-07 | (TODO) -- GDC | mRNA__geneExp__FPKM | |
| TCGA-D8-A27K-01A-11R-A16F-07 | (TODO) -- GDC | mRNA__counts__FPKM | |
| TCGA-D8-A27L-01A-11R-A16F-07 | (TODO) -- GDC | mRNA__geneExpNormed__FPKM | |
| TCGA-D8-A27L-01A-11R-A16F-07 | (TODO) -- GDC | mRNA__geneExp__FPKM | |
| TCGA-D8-A27L-01A-11R-A16F-07 | (TODO) -- GDC | mRNA__counts__FPKM | |
| TCGA-D8-A27M-01A-11R-A16F-07 | (TODO) -- GDC | mRNA__geneExpNormed__FPKM | |
| TCGA-D8-A27M-01A-11R-A16F-07 | (TODO) -- GDC | mRNA__geneExp__FPKM | |
| TCGA-D8-A27M-01A-11R-A16F-07 | (TODO) -- GDC | mRNA__counts__FPKM | |
| TCGA-D8-A27N-01A-11R-A16F-07 | (TODO) -- GDC | mRNA__geneExpNormed__FPKM | |
| TCGA-D8-A27N-01A-11R-A16F-07 | (TODO) -- GDC | mRNA__geneExp__FPKM | |
| TCGA-D8-A27N-01A-11R-A16F-07 | (TODO) -- GDC | mRNA__counts__FPKM | |
| TCGA-D8-A27P-01A-11R-A16F-07 | (TODO) -- GDC | mRNA__geneExpNormed__FPKM | |
| TCGA-D8-A27P-01A-11R-A16F-07 | (TODO) -- GDC | mRNA__geneExp__FPKM | |
| TCGA-D8-A27P-01A-11R-A16F-07 | (TODO) -- GDC | mRNA__counts__FPKM | |
| TCGA-D8-A27R-01A-11R-A16F-07 | (TODO) -- GDC | mRNA__geneExpNormed__FPKM | |
| TCGA-D8-A27R-01A-11R-A16F-07 | (TODO) -- GDC | mRNA__geneExp__FPKM | |
| TCGA-D8-A27R-01A-11R-A16F-07 | (TODO) -- GDC | mRNA__counts__FPKM | |
| TCGA-D8-A27T-01A-11R-A16F-07 | (TODO) -- GDC | mRNA__geneExpNormed__FPKM | |
| TCGA-D8-A27T-01A-11R-A16F-07 | (TODO) -- GDC | mRNA__geneExp__FPKM | |
| TCGA-D8-A27T-01A-11R-A16F-07 | (TODO) -- GDC | mRNA__counts__FPKM | |
| TCGA-D8-A27V-01A-12R-A17B-07 | (TODO) -- GDC | mRNA__geneExpNormed__FPKM | |
| TCGA-D8-A27V-01A-12R-A17B-07 | (TODO) -- GDC | mRNA__geneExp__FPKM | |
| TCGA-D8-A27V-01A-12R-A17B-07 | (TODO) -- GDC | mRNA__counts__FPKM | |
| TCGA-D8-A27W-01A-11R-A16F-07 | (TODO) -- GDC | mRNA__geneExpNormed__FPKM | |
| TCGA-D8-A27W-01A-11R-A16F-07 | (TODO) -- GDC | mRNA__geneExp__FPKM | |
| TCGA-D8-A27W-01A-11R-A16F-07 | (TODO) -- GDC | mRNA__counts__FPKM | |
| TCGA-D8-A3Z5-01A-41R-A24H-07 | (TODO) -- GDC | mRNA__geneExpNormed__FPKM | |
| TCGA-D8-A3Z5-01A-41R-A24H-07 | (TODO) -- GDC | mRNA__geneExp__FPKM | |
| TCGA-D8-A3Z5-01A-41R-A24H-07 | (TODO) -- GDC | mRNA__counts__FPKM | |
| TCGA-D8-A3Z6-01A-11R-A239-07 | (TODO) -- GDC | mRNA__geneExpNormed__FPKM | |
| TCGA-D8-A3Z6-01A-11R-A239-07 | (TODO) -- GDC | mRNA__geneExp__FPKM | |
| TCGA-D8-A3Z6-01A-11R-A239-07 | (TODO) -- GDC | mRNA__counts__FPKM | |
| TCGA-D8-A4Z1-01A-21R-A266-07 | (TODO) -- GDC | mRNA__geneExpNormed__FPKM | |
| TCGA-D8-A4Z1-01A-21R-A266-07 | (TODO) -- GDC | mRNA__geneExp__FPKM | |
| TCGA-D8-A4Z1-01A-21R-A266-07 | (TODO) -- GDC | mRNA__counts__FPKM | |
| TCGA-D8-A73U-01A-11R-A33J-07 | (TODO) -- GDC | mRNA__geneExpNormed__FPKM | |
| TCGA-D8-A73U-01A-11R-A33J-07 | (TODO) -- GDC | mRNA__geneExp__FPKM | |
| TCGA-D8-A73U-01A-11R-A33J-07 | (TODO) -- GDC | mRNA__counts__FPKM | |
| TCGA-D8-A73W-01A-22R-A352-07 | (TODO) -- GDC | mRNA__geneExpNormed__FPKM | |
| TCGA-D8-A73W-01A-22R-A352-07 | (TODO) -- GDC | mRNA__geneExp__FPKM | |
| TCGA-D8-A73W-01A-22R-A352-07 | (TODO) -- GDC | mRNA__counts__FPKM | |
| TCGA-D8-A73X-01A-11R-A32P-07 | (TODO) -- GDC | mRNA__geneExpNormed__FPKM | |
| TCGA-D8-A73X-01A-11R-A32P-07 | (TODO) -- GDC | mRNA__geneExp__FPKM | |
| TCGA-D8-A73X-01A-11R-A32P-07 | (TODO) -- GDC | mRNA__counts__FPKM | |
| TCGA-E2-A105-01A-11R-A10J-07 | (TODO) -- GDC | mRNA__geneExpNormed__FPKM | |
| TCGA-E2-A105-01A-11R-A10J-07 | (TODO) -- GDC | mRNA__geneExp__FPKM | |
| TCGA-E2-A105-01A-11R-A10J-07 | (TODO) -- GDC | mRNA__counts__FPKM | |
| TCGA-E2-A106-01A-11R-A10J-07 | (TODO) -- GDC | mRNA__geneExpNormed__FPKM | |
| TCGA-E2-A106-01A-11R-A10J-07 | (TODO) -- GDC | mRNA__geneExp__FPKM | |
| TCGA-E2-A106-01A-11R-A10J-07 | (TODO) -- GDC | mRNA__counts__FPKM | |
| TCGA-E2-A107-01A-11R-A10J-07 | (TODO) -- GDC | mRNA__geneExpNormed__FPKM | |
| TCGA-E2-A107-01A-11R-A10J-07 | (TODO) -- GDC | mRNA__geneExp__FPKM | |
| TCGA-E2-A107-01A-11R-A10J-07 | (TODO) -- GDC | mRNA__counts__FPKM | |
| TCGA-E2-A108-01A-13R-A10J-07 | (TODO) -- GDC | mRNA__geneExpNormed__FPKM | |
| TCGA-E2-A108-01A-13R-A10J-07 | (TODO) -- GDC | mRNA__geneExp__FPKM | |
| TCGA-E2-A108-01A-13R-A10J-07 | (TODO) -- GDC | mRNA__counts__FPKM | |
| TCGA-E2-A109-01A-11R-A10J-07 | (TODO) -- GDC | mRNA__geneExpNormed__FPKM | |
| TCGA-E2-A109-01A-11R-A10J-07 | (TODO) -- GDC | mRNA__geneExp__FPKM | |
| TCGA-E2-A109-01A-11R-A10J-07 | (TODO) -- GDC | mRNA__counts__FPKM | |
| TCGA-E2-A10A-01A-21R-A115-07 | (TODO) -- GDC | mRNA__geneExpNormed__FPKM | |
| TCGA-E2-A10A-01A-21R-A115-07 | (TODO) -- GDC | mRNA__geneExp__FPKM | |
| TCGA-E2-A10A-01A-21R-A115-07 | (TODO) -- GDC | mRNA__counts__FPKM | |
| TCGA-E2-A10B-01A-11R-A10J-07 | (TODO) -- GDC | mRNA__geneExpNormed__FPKM | |
| TCGA-E2-A10B-01A-11R-A10J-07 | (TODO) -- GDC | mRNA__geneExp__FPKM | |
| TCGA-E2-A10B-01A-11R-A10J-07 | (TODO) -- GDC | mRNA__counts__FPKM | |
| TCGA-E2-A10C-01A-21R-A10J-07 | (TODO) -- GDC | mRNA__geneExpNormed__FPKM | |
| TCGA-E2-A10C-01A-21R-A10J-07 | (TODO) -- GDC | mRNA__geneExp__FPKM | |
| TCGA-E2-A10C-01A-21R-A10J-07 | (TODO) -- GDC | mRNA__counts__FPKM | |
| TCGA-E2-A10E-01A-21R-A10J-07 | (TODO) -- GDC | mRNA__geneExpNormed__FPKM | |
| TCGA-E2-A10E-01A-21R-A10J-07 | (TODO) -- GDC | mRNA__geneExp__FPKM | |
| TCGA-E2-A10E-01A-21R-A10J-07 | (TODO) -- GDC | mRNA__counts__FPKM | |
| TCGA-E2-A10F-01A-11R-A10J-07 | (TODO) -- GDC | mRNA__geneExpNormed__FPKM | |
| TCGA-E2-A10F-01A-11R-A10J-07 | (TODO) -- GDC | mRNA__geneExp__FPKM | |
| TCGA-E2-A10F-01A-11R-A10J-07 | (TODO) -- GDC | mRNA__counts__FPKM | |
| TCGA-E2-A14N-01A-31R-A137-07 | (TODO) -- GDC | mRNA__geneExpNormed__FPKM | |
| TCGA-E2-A14N-01A-31R-A137-07 | (TODO) -- GDC | mRNA__geneExp__FPKM | |
| TCGA-E2-A14N-01A-31R-A137-07 | (TODO) -- GDC | mRNA__counts__FPKM | |
| TCGA-E2-A14O-01A-31R-A115-07 | (TODO) -- GDC | mRNA__geneExpNormed__FPKM | |
| TCGA-E2-A14O-01A-31R-A115-07 | (TODO) -- GDC | mRNA__geneExp__FPKM | |
| TCGA-E2-A14O-01A-31R-A115-07 | (TODO) -- GDC | mRNA__counts__FPKM | |
| TCGA-E2-A14P-01A-31R-A12D-07 | (TODO) -- GDC | mRNA__geneExpNormed__FPKM | |
| TCGA-E2-A14P-01A-31R-A12D-07 | (TODO) -- GDC | mRNA__geneExp__FPKM | |
| TCGA-E2-A14P-01A-31R-A12D-07 | (TODO) -- GDC | mRNA__counts__FPKM | |
| TCGA-E2-A14Q-01A-11R-A12D-07 | (TODO) -- GDC | mRNA__geneExpNormed__FPKM | |
| TCGA-E2-A14Q-01A-11R-A12D-07 | (TODO) -- GDC | mRNA__geneExp__FPKM | |
| TCGA-E2-A14Q-01A-11R-A12D-07 | (TODO) -- GDC | mRNA__counts__FPKM | |
| TCGA-E2-A14R-01A-11R-A115-07 | (TODO) -- GDC | mRNA__geneExpNormed__FPKM | |
| TCGA-E2-A14R-01A-11R-A115-07 | (TODO) -- GDC | mRNA__geneExp__FPKM | |
| TCGA-E2-A14R-01A-11R-A115-07 | (TODO) -- GDC | mRNA__counts__FPKM | |
| TCGA-E2-A14T-01A-11R-A115-07 | (TODO) -- GDC | mRNA__geneExpNormed__FPKM | |
| TCGA-E2-A14T-01A-11R-A115-07 | (TODO) -- GDC | mRNA__geneExp__FPKM | |
| TCGA-E2-A14T-01A-11R-A115-07 | (TODO) -- GDC | mRNA__counts__FPKM | |
| TCGA-E2-A14U-01A-11R-A22K-07 | (TODO) -- GDC | mRNA__geneExpNormed__FPKM | |
| TCGA-E2-A14U-01A-11R-A22K-07 | (TODO) -- GDC | mRNA__geneExp__FPKM | |
| TCGA-E2-A14U-01A-11R-A22K-07 | (TODO) -- GDC | mRNA__counts__FPKM | |
| TCGA-E2-A14V-01A-11R-A12D-07 | (TODO) -- GDC | mRNA__geneExpNormed__FPKM | |
| TCGA-E2-A14V-01A-11R-A12D-07 | (TODO) -- GDC | mRNA__geneExp__FPKM | |
| TCGA-E2-A14V-01A-11R-A12D-07 | (TODO) -- GDC | mRNA__counts__FPKM | |
| TCGA-E2-A14W-01A-11R-A12D-07 | (TODO) -- GDC | mRNA__geneExpNormed__FPKM | |
| TCGA-E2-A14W-01A-11R-A12D-07 | (TODO) -- GDC | mRNA__geneExp__FPKM | |
| TCGA-E2-A14W-01A-11R-A12D-07 | (TODO) -- GDC | mRNA__counts__FPKM | |
| TCGA-E2-A14X-01A-11R-A115-07 | (TODO) -- GDC | mRNA__geneExpNormed__FPKM | |
| TCGA-E2-A14X-01A-11R-A115-07 | (TODO) -- GDC | mRNA__geneExp__FPKM | |
| TCGA-E2-A14X-01A-11R-A115-07 | (TODO) -- GDC | mRNA__counts__FPKM | |
| TCGA-E2-A14Y-01A-21R-A12D-07 | (TODO) -- GDC | mRNA__geneExpNormed__FPKM | |
| TCGA-E2-A14Y-01A-21R-A12D-07 | (TODO) -- GDC | mRNA__geneExp__FPKM | |
| TCGA-E2-A14Y-01A-21R-A12D-07 | (TODO) -- GDC | mRNA__counts__FPKM | |
| TCGA-E2-A14Z-01A-11R-A115-07 | (TODO) -- GDC | mRNA__geneExpNormed__FPKM | |
| TCGA-E2-A14Z-01A-11R-A115-07 | (TODO) -- GDC | mRNA__geneExp__FPKM | |
| TCGA-E2-A14Z-01A-11R-A115-07 | (TODO) -- GDC | mRNA__counts__FPKM | |
| TCGA-E2-A150-01A-11R-A12D-07 | (TODO) -- GDC | mRNA__geneExpNormed__FPKM | |
| TCGA-E2-A150-01A-11R-A12D-07 | (TODO) -- GDC | mRNA__geneExp__FPKM | |
| TCGA-E2-A150-01A-11R-A12D-07 | (TODO) -- GDC | mRNA__counts__FPKM | |
| TCGA-E2-A152-01A-11R-A12D-07 | (TODO) -- GDC | mRNA__geneExpNormed__FPKM | |
| TCGA-E2-A152-01A-11R-A12D-07 | (TODO) -- GDC | mRNA__geneExp__FPKM | |
| TCGA-E2-A152-01A-11R-A12D-07 | (TODO) -- GDC | mRNA__counts__FPKM | |
| TCGA-E2-A153-01A-12R-A12D-07 | (TODO) -- GDC | mRNA__geneExpNormed__FPKM | |
| TCGA-E2-A153-01A-12R-A12D-07 | (TODO) -- GDC | mRNA__geneExp__FPKM | |
| TCGA-E2-A153-01A-12R-A12D-07 | (TODO) -- GDC | mRNA__counts__FPKM | |
| TCGA-E2-A154-01A-11R-A115-07 | (TODO) -- GDC | mRNA__geneExpNormed__FPKM | |
| TCGA-E2-A154-01A-11R-A115-07 | (TODO) -- GDC | mRNA__geneExp__FPKM | |
| TCGA-E2-A154-01A-11R-A115-07 | (TODO) -- GDC | mRNA__counts__FPKM | |
| TCGA-E2-A155-01A-11R-A12D-07 | (TODO) -- GDC | mRNA__geneExpNormed__FPKM | |
| TCGA-E2-A155-01A-11R-A12D-07 | (TODO) -- GDC | mRNA__geneExp__FPKM | |
| TCGA-E2-A155-01A-11R-A12D-07 | (TODO) -- GDC | mRNA__counts__FPKM | |
| TCGA-E2-A156-01A-11R-A12D-07 | (TODO) -- GDC | mRNA__geneExpNormed__FPKM | |
| TCGA-E2-A156-01A-11R-A12D-07 | (TODO) -- GDC | mRNA__geneExp__FPKM | |
| TCGA-E2-A156-01A-11R-A12D-07 | (TODO) -- GDC | mRNA__counts__FPKM | |
| TCGA-E2-A158-01A-11R-A12D-07 | (TODO) -- GDC | mRNA__geneExpNormed__FPKM | |
| TCGA-E2-A158-01A-11R-A12D-07 | (TODO) -- GDC | mRNA__geneExp__FPKM | |
| TCGA-E2-A158-01A-11R-A12D-07 | (TODO) -- GDC | mRNA__counts__FPKM | |
| TCGA-E2-A159-01A-11R-A115-07 | (TODO) -- GDC | mRNA__geneExpNormed__FPKM | |
| TCGA-E2-A159-01A-11R-A115-07 | (TODO) -- GDC | mRNA__geneExp__FPKM | |
| TCGA-E2-A159-01A-11R-A115-07 | (TODO) -- GDC | mRNA__counts__FPKM | |
| TCGA-E2-A15A-01A-11R-A12D-07 | (TODO) -- GDC | mRNA__geneExpNormed__FPKM | |
| TCGA-E2-A15A-01A-11R-A12D-07 | (TODO) -- GDC | mRNA__geneExp__FPKM | |
| TCGA-E2-A15A-01A-11R-A12D-07 | (TODO) -- GDC | mRNA__counts__FPKM | |
| TCGA-E2-A15C-01A-31R-A12D-07 | (TODO) -- GDC | mRNA__geneExpNormed__FPKM | |
| TCGA-E2-A15C-01A-31R-A12D-07 | (TODO) -- GDC | mRNA__geneExp__FPKM | |
| TCGA-E2-A15C-01A-31R-A12D-07 | (TODO) -- GDC | mRNA__counts__FPKM | |
| TCGA-E2-A15D-01A-11R-A115-07 | (TODO) -- GDC | mRNA__geneExpNormed__FPKM | |
| TCGA-E2-A15D-01A-11R-A115-07 | (TODO) -- GDC | mRNA__geneExp__FPKM | |
| TCGA-E2-A15D-01A-11R-A115-07 | (TODO) -- GDC | mRNA__counts__FPKM | |
| TCGA-E2-A15E-01A-11R-A12D-07 | (TODO) -- GDC | mRNA__geneExpNormed__FPKM | |
| TCGA-E2-A15E-01A-11R-A12D-07 | (TODO) -- GDC | mRNA__geneExp__FPKM | |
| TCGA-E2-A15E-01A-11R-A12D-07 | (TODO) -- GDC | mRNA__counts__FPKM | |
| TCGA-E2-A15F-01A-11R-A115-07 | (TODO) -- GDC | mRNA__geneExpNormed__FPKM | |
| TCGA-E2-A15F-01A-11R-A115-07 | (TODO) -- GDC | mRNA__geneExp__FPKM | |
| TCGA-E2-A15F-01A-11R-A115-07 | (TODO) -- GDC | mRNA__counts__FPKM | |
| TCGA-E2-A15G-01A-11R-A12D-07 | (TODO) -- GDC | mRNA__geneExpNormed__FPKM | |
| TCGA-E2-A15G-01A-11R-A12D-07 | (TODO) -- GDC | mRNA__geneExp__FPKM | |
| TCGA-E2-A15G-01A-11R-A12D-07 | (TODO) -- GDC | mRNA__counts__FPKM | |
| TCGA-E2-A15H-01A-11R-A12D-07 | (TODO) -- GDC | mRNA__geneExpNormed__FPKM | |
| TCGA-E2-A15H-01A-11R-A12D-07 | (TODO) -- GDC | mRNA__geneExp__FPKM | |
| TCGA-E2-A15H-01A-11R-A12D-07 | (TODO) -- GDC | mRNA__counts__FPKM | |
| TCGA-E2-A15I-01A-21R-A137-07 | (TODO) -- GDC | mRNA__geneExpNormed__FPKM | |
| TCGA-E2-A15I-01A-21R-A137-07 | (TODO) -- GDC | mRNA__geneExp__FPKM | |
| TCGA-E2-A15I-01A-21R-A137-07 | (TODO) -- GDC | mRNA__counts__FPKM | |
| TCGA-E2-A15J-01A-11R-A12P-07 | (TODO) -- GDC | mRNA__geneExpNormed__FPKM | |
| TCGA-E2-A15J-01A-11R-A12P-07 | (TODO) -- GDC | mRNA__geneExp__FPKM | |
| TCGA-E2-A15J-01A-11R-A12P-07 | (TODO) -- GDC | mRNA__counts__FPKM | |
| TCGA-E2-A15K-01A-11R-A12P-07 | (TODO) -- GDC | mRNA__geneExpNormed__FPKM | |
| TCGA-E2-A15K-01A-11R-A12P-07 | (TODO) -- GDC | mRNA__geneExp__FPKM | |
| TCGA-E2-A15K-01A-11R-A12P-07 | (TODO) -- GDC | mRNA__counts__FPKM | |
| TCGA-E2-A15L-01A-11R-A12D-07 | (TODO) -- GDC | mRNA__geneExpNormed__FPKM | |
| TCGA-E2-A15L-01A-11R-A12D-07 | (TODO) -- GDC | mRNA__geneExp__FPKM | |
| TCGA-E2-A15L-01A-11R-A12D-07 | (TODO) -- GDC | mRNA__counts__FPKM | |
| TCGA-E2-A15M-01A-11R-A12D-07 | (TODO) -- GDC | mRNA__geneExpNormed__FPKM | |
| TCGA-E2-A15M-01A-11R-A12D-07 | (TODO) -- GDC | mRNA__geneExp__FPKM | |
| TCGA-E2-A15M-01A-11R-A12D-07 | (TODO) -- GDC | mRNA__counts__FPKM | |
| TCGA-E2-A15O-01A-11R-A115-07 | (TODO) -- GDC | mRNA__geneExpNormed__FPKM | |
| TCGA-E2-A15O-01A-11R-A115-07 | (TODO) -- GDC | mRNA__geneExp__FPKM | |
| TCGA-E2-A15O-01A-11R-A115-07 | (TODO) -- GDC | mRNA__counts__FPKM | |
| TCGA-E2-A15P-01A-11R-A115-07 | (TODO) -- GDC | mRNA__geneExpNormed__FPKM | |
| TCGA-E2-A15P-01A-11R-A115-07 | (TODO) -- GDC | mRNA__geneExp__FPKM | |
| TCGA-E2-A15P-01A-11R-A115-07 | (TODO) -- GDC | mRNA__counts__FPKM | |
| TCGA-E2-A15R-01A-11R-A115-07 | (TODO) -- GDC | mRNA__geneExpNormed__FPKM | |
| TCGA-E2-A15R-01A-11R-A115-07 | (TODO) -- GDC | mRNA__geneExp__FPKM | |
| TCGA-E2-A15R-01A-11R-A115-07 | (TODO) -- GDC | mRNA__counts__FPKM | |
| TCGA-E2-A15S-01A-11R-A115-07 | (TODO) -- GDC | mRNA__geneExpNormed__FPKM | |
| TCGA-E2-A15S-01A-11R-A115-07 | (TODO) -- GDC | mRNA__geneExp__FPKM | |
| TCGA-E2-A15S-01A-11R-A115-07 | (TODO) -- GDC | mRNA__counts__FPKM | |
| TCGA-E2-A15T-01A-11R-A115-07 | (TODO) -- GDC | mRNA__geneExpNormed__FPKM | |
| TCGA-E2-A15T-01A-11R-A115-07 | (TODO) -- GDC | mRNA__geneExp__FPKM | |
| TCGA-E2-A15T-01A-11R-A115-07 | (TODO) -- GDC | mRNA__counts__FPKM | |
| TCGA-E2-A1AZ-01A-11R-A12P-07 | (TODO) -- GDC | mRNA__geneExpNormed__FPKM | |
| TCGA-E2-A1AZ-01A-11R-A12P-07 | (TODO) -- GDC | mRNA__geneExp__FPKM | |
| TCGA-E2-A1AZ-01A-11R-A12P-07 | (TODO) -- GDC | mRNA__counts__FPKM | |
| TCGA-E2-A1B0-01A-11R-A12P-07 | (TODO) -- GDC | mRNA__geneExpNormed__FPKM | |
| TCGA-E2-A1B0-01A-11R-A12P-07 | (TODO) -- GDC | mRNA__geneExp__FPKM | |
| TCGA-E2-A1B0-01A-11R-A12P-07 | (TODO) -- GDC | mRNA__counts__FPKM | |
| TCGA-E2-A1B1-01A-21R-A12P-07 | (TODO) -- GDC | mRNA__geneExpNormed__FPKM | |
| TCGA-E2-A1B1-01A-21R-A12P-07 | (TODO) -- GDC | mRNA__geneExp__FPKM | |
| TCGA-E2-A1B1-01A-21R-A12P-07 | (TODO) -- GDC | mRNA__counts__FPKM | |
| TCGA-E2-A1B4-01A-11R-A12P-07 | (TODO) -- GDC | mRNA__geneExpNormed__FPKM | |
| TCGA-E2-A1B4-01A-11R-A12P-07 | (TODO) -- GDC | mRNA__geneExp__FPKM | |
| TCGA-E2-A1B4-01A-11R-A12P-07 | (TODO) -- GDC | mRNA__counts__FPKM | |
| TCGA-E2-A1B5-01A-21R-A12P-07 | (TODO) -- GDC | mRNA__geneExpNormed__FPKM | |
| TCGA-E2-A1B5-01A-21R-A12P-07 | (TODO) -- GDC | mRNA__geneExp__FPKM | |
| TCGA-E2-A1B5-01A-21R-A12P-07 | (TODO) -- GDC | mRNA__counts__FPKM | |
| TCGA-E2-A1B6-01A-31R-A12P-07 | (TODO) -- GDC | mRNA__geneExpNormed__FPKM | |
| TCGA-E2-A1B6-01A-31R-A12P-07 | (TODO) -- GDC | mRNA__geneExp__FPKM | |
| TCGA-E2-A1B6-01A-31R-A12P-07 | (TODO) -- GDC | mRNA__counts__FPKM | |
| TCGA-E2-A1BC-01A-11R-A12P-07 | (TODO) -- GDC | mRNA__geneExpNormed__FPKM | |
| TCGA-E2-A1BC-01A-11R-A12P-07 | (TODO) -- GDC | mRNA__geneExp__FPKM | |
| TCGA-E2-A1BC-01A-11R-A12P-07 | (TODO) -- GDC | mRNA__counts__FPKM | |
| TCGA-E2-A1BD-01A-11R-A12P-07 | (TODO) -- GDC | mRNA__geneExpNormed__FPKM | |
| TCGA-E2-A1BD-01A-11R-A12P-07 | (TODO) -- GDC | mRNA__geneExp__FPKM | |
| TCGA-E2-A1BD-01A-11R-A12P-07 | (TODO) -- GDC | mRNA__counts__FPKM | |
| TCGA-E2-A1IE-01A-11R-A13Q-07 | (TODO) -- GDC | mRNA__geneExpNormed__FPKM | |
| TCGA-E2-A1IE-01A-11R-A13Q-07 | (TODO) -- GDC | mRNA__geneExp__FPKM | |
| TCGA-E2-A1IE-01A-11R-A13Q-07 | (TODO) -- GDC | mRNA__counts__FPKM | |
| TCGA-E2-A1IF-01A-11R-A144-07 | (TODO) -- GDC | mRNA__geneExpNormed__FPKM | |
| TCGA-E2-A1IF-01A-11R-A144-07 | (TODO) -- GDC | mRNA__geneExp__FPKM | |
| TCGA-E2-A1IF-01A-11R-A144-07 | (TODO) -- GDC | mRNA__counts__FPKM | |
| TCGA-E2-A1IG-01A-11R-A144-07 | (TODO) -- GDC | mRNA__geneExpNormed__FPKM | |
| TCGA-E2-A1IG-01A-11R-A144-07 | (TODO) -- GDC | mRNA__geneExp__FPKM | |
| TCGA-E2-A1IG-01A-11R-A144-07 | (TODO) -- GDC | mRNA__counts__FPKM | |
| TCGA-E2-A1IH-01A-11R-A13Q-07 | (TODO) -- GDC | mRNA__geneExpNormed__FPKM | |
| TCGA-E2-A1IH-01A-11R-A13Q-07 | (TODO) -- GDC | mRNA__geneExp__FPKM | |
| TCGA-E2-A1IH-01A-11R-A13Q-07 | (TODO) -- GDC | mRNA__counts__FPKM | |
| TCGA-E2-A1II-01A-11R-A144-07 | (TODO) -- GDC | mRNA__geneExpNormed__FPKM | |
| TCGA-E2-A1II-01A-11R-A144-07 | (TODO) -- GDC | mRNA__geneExp__FPKM | |
| TCGA-E2-A1II-01A-11R-A144-07 | (TODO) -- GDC | mRNA__counts__FPKM | |
| TCGA-E2-A1IJ-01A-11R-A144-07 | (TODO) -- GDC | mRNA__geneExpNormed__FPKM | |
| TCGA-E2-A1IJ-01A-11R-A144-07 | (TODO) -- GDC | mRNA__geneExp__FPKM | |
| TCGA-E2-A1IJ-01A-11R-A144-07 | (TODO) -- GDC | mRNA__counts__FPKM | |
| TCGA-E2-A1IK-01A-11R-A144-07 | (TODO) -- GDC | mRNA__geneExpNormed__FPKM | |
| TCGA-E2-A1IK-01A-11R-A144-07 | (TODO) -- GDC | mRNA__geneExp__FPKM | |
| TCGA-E2-A1IK-01A-11R-A144-07 | (TODO) -- GDC | mRNA__counts__FPKM | |
| TCGA-E2-A1IL-01A-11R-A14D-07 | (TODO) -- GDC | mRNA__geneExpNormed__FPKM | |
| TCGA-E2-A1IL-01A-11R-A14D-07 | (TODO) -- GDC | mRNA__geneExp__FPKM | |
| TCGA-E2-A1IL-01A-11R-A14D-07 | (TODO) -- GDC | mRNA__counts__FPKM | |
| TCGA-E2-A1IN-01A-11R-A13Q-07 | (TODO) -- GDC | mRNA__geneExpNormed__FPKM | |
| TCGA-E2-A1IN-01A-11R-A13Q-07 | (TODO) -- GDC | mRNA__geneExp__FPKM | |
| TCGA-E2-A1IN-01A-11R-A13Q-07 | (TODO) -- GDC | mRNA__counts__FPKM | |
| TCGA-E2-A1IO-01A-11R-A144-07 | (TODO) -- GDC | mRNA__geneExpNormed__FPKM | |
| TCGA-E2-A1IO-01A-11R-A144-07 | (TODO) -- GDC | mRNA__geneExp__FPKM | |
| TCGA-E2-A1IO-01A-11R-A144-07 | (TODO) -- GDC | mRNA__counts__FPKM | |
| TCGA-E2-A1IU-01A-11R-A14D-07 | (TODO) -- GDC | mRNA__geneExpNormed__FPKM | |
| TCGA-E2-A1IU-01A-11R-A14D-07 | (TODO) -- GDC | mRNA__geneExp__FPKM | |
| TCGA-E2-A1IU-01A-11R-A14D-07 | (TODO) -- GDC | mRNA__counts__FPKM | |
| TCGA-E2-A1L6-01A-11R-A13Q-07 | (TODO) -- GDC | mRNA__geneExpNormed__FPKM | |
| TCGA-E2-A1L6-01A-11R-A13Q-07 | (TODO) -- GDC | mRNA__geneExp__FPKM | |
| TCGA-E2-A1L6-01A-11R-A13Q-07 | (TODO) -- GDC | mRNA__counts__FPKM | |
| TCGA-E2-A1L7-01A-11R-A144-07 | (TODO) -- GDC | mRNA__geneExpNormed__FPKM | |
| TCGA-E2-A1L7-01A-11R-A144-07 | (TODO) -- GDC | mRNA__geneExp__FPKM | |
| TCGA-E2-A1L7-01A-11R-A144-07 | (TODO) -- GDC | mRNA__counts__FPKM | |
| TCGA-E2-A1L8-01A-11R-A13Q-07 | (TODO) -- GDC | mRNA__geneExpNormed__FPKM | |
| TCGA-E2-A1L8-01A-11R-A13Q-07 | (TODO) -- GDC | mRNA__geneExp__FPKM | |
| TCGA-E2-A1L8-01A-11R-A13Q-07 | (TODO) -- GDC | mRNA__counts__FPKM | |
| TCGA-E2-A1L9-01A-11R-A13Q-07 | (TODO) -- GDC | mRNA__geneExpNormed__FPKM | |
| TCGA-E2-A1L9-01A-11R-A13Q-07 | (TODO) -- GDC | mRNA__geneExp__FPKM | |
| TCGA-E2-A1L9-01A-11R-A13Q-07 | (TODO) -- GDC | mRNA__counts__FPKM | |
| TCGA-E2-A1LA-01A-11R-A144-07 | (TODO) -- GDC | mRNA__geneExpNormed__FPKM | |
| TCGA-E2-A1LA-01A-11R-A144-07 | (TODO) -- GDC | mRNA__geneExp__FPKM | |
| TCGA-E2-A1LA-01A-11R-A144-07 | (TODO) -- GDC | mRNA__counts__FPKM | |
| TCGA-E2-A1LB-01A-11R-A144-07 | (TODO) -- GDC | mRNA__geneExpNormed__FPKM | |
| TCGA-E2-A1LB-01A-11R-A144-07 | (TODO) -- GDC | mRNA__geneExp__FPKM | |
| TCGA-E2-A1LB-01A-11R-A144-07 | (TODO) -- GDC | mRNA__counts__FPKM | |
| TCGA-E2-A1LE-01A-12R-A19W-07 | (TODO) -- GDC | mRNA__geneExpNormed__FPKM | |
| TCGA-E2-A1LE-01A-12R-A19W-07 | (TODO) -- GDC | mRNA__geneExp__FPKM | |
| TCGA-E2-A1LE-01A-12R-A19W-07 | (TODO) -- GDC | mRNA__counts__FPKM | |
| TCGA-E2-A1LG-01A-21R-A14M-07 | (TODO) -- GDC | mRNA__geneExpNormed__FPKM | |
| TCGA-E2-A1LG-01A-21R-A14M-07 | (TODO) -- GDC | mRNA__geneExp__FPKM | |
| TCGA-E2-A1LG-01A-21R-A14M-07 | (TODO) -- GDC | mRNA__counts__FPKM | |
| TCGA-E2-A1LH-01A-11R-A14D-07 | (TODO) -- GDC | mRNA__geneExpNormed__FPKM | |
| TCGA-E2-A1LH-01A-11R-A14D-07 | (TODO) -- GDC | mRNA__geneExp__FPKM | |
| TCGA-E2-A1LH-01A-11R-A14D-07 | (TODO) -- GDC | mRNA__counts__FPKM | |
| TCGA-E2-A1LI-01A-12R-A157-07 | (TODO) -- GDC | mRNA__geneExpNormed__FPKM | |
| TCGA-E2-A1LI-01A-12R-A157-07 | (TODO) -- GDC | mRNA__geneExp__FPKM | |
| TCGA-E2-A1LI-01A-12R-A157-07 | (TODO) -- GDC | mRNA__counts__FPKM | |
| TCGA-E2-A1LK-01A-21R-A14D-07 | (TODO) -- GDC | mRNA__geneExpNormed__FPKM | |
| TCGA-E2-A1LK-01A-21R-A14D-07 | (TODO) -- GDC | mRNA__geneExp__FPKM | |
| TCGA-E2-A1LK-01A-21R-A14D-07 | (TODO) -- GDC | mRNA__counts__FPKM | |
| TCGA-E2-A1LL-01A-11R-A144-07 | (TODO) -- GDC | mRNA__geneExpNormed__FPKM | |
| TCGA-E2-A1LL-01A-11R-A144-07 | (TODO) -- GDC | mRNA__geneExp__FPKM | |
| TCGA-E2-A1LL-01A-11R-A144-07 | (TODO) -- GDC | mRNA__counts__FPKM | |
| TCGA-E2-A1LS-01A-12R-A157-07 | (TODO) -- GDC | mRNA__geneExpNormed__FPKM | |
| TCGA-E2-A1LS-01A-12R-A157-07 | (TODO) -- GDC | mRNA__geneExp__FPKM | |
| TCGA-E2-A1LS-01A-12R-A157-07 | (TODO) -- GDC | mRNA__counts__FPKM | |
| TCGA-E2-A2P5-01A-11R-A19W-07 | (TODO) -- GDC | mRNA__geneExpNormed__FPKM | |
| TCGA-E2-A2P5-01A-11R-A19W-07 | (TODO) -- GDC | mRNA__geneExp__FPKM | |
| TCGA-E2-A2P5-01A-11R-A19W-07 | (TODO) -- GDC | mRNA__counts__FPKM | |
| TCGA-E2-A2P6-01A-11R-A19W-07 | (TODO) -- GDC | mRNA__geneExpNormed__FPKM | |
| TCGA-E2-A2P6-01A-11R-A19W-07 | (TODO) -- GDC | mRNA__geneExp__FPKM | |
| TCGA-E2-A2P6-01A-11R-A19W-07 | (TODO) -- GDC | mRNA__counts__FPKM | |
| TCGA-E2-A3DX-01A-21R-A213-07 | (TODO) -- GDC | mRNA__geneExpNormed__FPKM | |
| TCGA-E2-A3DX-01A-21R-A213-07 | (TODO) -- GDC | mRNA__geneExp__FPKM | |
| TCGA-E2-A3DX-01A-21R-A213-07 | (TODO) -- GDC | mRNA__counts__FPKM | |
| TCGA-E2-A56Z-01A-12R-A29R-07 | (TODO) -- GDC | mRNA__geneExpNormed__FPKM | |
| TCGA-E2-A56Z-01A-12R-A29R-07 | (TODO) -- GDC | mRNA__geneExp__FPKM | |
| TCGA-E2-A56Z-01A-12R-A29R-07 | (TODO) -- GDC | mRNA__counts__FPKM | |
| TCGA-E2-A570-01A-11R-A29R-07 | (TODO) -- GDC | mRNA__geneExpNormed__FPKM | |
| TCGA-E2-A570-01A-11R-A29R-07 | (TODO) -- GDC | mRNA__geneExp__FPKM | |
| TCGA-E2-A570-01A-11R-A29R-07 | (TODO) -- GDC | mRNA__counts__FPKM | |
| TCGA-E2-A572-01A-13R-A31O-07 | (TODO) -- GDC | mRNA__geneExpNormed__FPKM | |
| TCGA-E2-A572-01A-13R-A31O-07 | (TODO) -- GDC | mRNA__geneExp__FPKM | |
| TCGA-E2-A572-01A-13R-A31O-07 | (TODO) -- GDC | mRNA__counts__FPKM | |
| TCGA-E2-A573-01A-11R-A29R-07 | (TODO) -- GDC | mRNA__geneExpNormed__FPKM | |
| TCGA-E2-A573-01A-11R-A29R-07 | (TODO) -- GDC | mRNA__geneExp__FPKM | |
| TCGA-E2-A573-01A-11R-A29R-07 | (TODO) -- GDC | mRNA__counts__FPKM | |
| TCGA-E2-A574-01A-11R-A29R-07 | (TODO) -- GDC | mRNA__geneExpNormed__FPKM | |
| TCGA-E2-A574-01A-11R-A29R-07 | (TODO) -- GDC | mRNA__geneExp__FPKM | |
| TCGA-E2-A574-01A-11R-A29R-07 | (TODO) -- GDC | mRNA__counts__FPKM | |
| TCGA-E2-A576-01A-11R-A31O-07 | (TODO) -- GDC | mRNA__geneExpNormed__FPKM | |
| TCGA-E2-A576-01A-11R-A31O-07 | (TODO) -- GDC | mRNA__geneExp__FPKM | |
| TCGA-E2-A576-01A-11R-A31O-07 | (TODO) -- GDC | mRNA__counts__FPKM | |
| TCGA-E2-A9RU-01A-11R-A41B-07 | (TODO) -- GDC | mRNA__geneExpNormed__FPKM | |
| TCGA-E2-A9RU-01A-11R-A41B-07 | (TODO) -- GDC | mRNA__geneExp__FPKM | |
| TCGA-E2-A9RU-01A-11R-A41B-07 | (TODO) -- GDC | mRNA__counts__FPKM | |
| TCGA-E9-A1N3-01A-12R-A157-07 | (TODO) -- GDC | mRNA__geneExpNormed__FPKM | |
| TCGA-E9-A1N3-01A-12R-A157-07 | (TODO) -- GDC | mRNA__geneExp__FPKM | |
| TCGA-E9-A1N3-01A-12R-A157-07 | (TODO) -- GDC | mRNA__counts__FPKM | |
| TCGA-E9-A1N4-01A-11R-A14M-07 | (TODO) -- GDC | mRNA__geneExpNormed__FPKM | |
| TCGA-E9-A1N4-01A-11R-A14M-07 | (TODO) -- GDC | mRNA__geneExp__FPKM | |
| TCGA-E9-A1N4-01A-11R-A14M-07 | (TODO) -- GDC | mRNA__counts__FPKM | |
| TCGA-E9-A1N5-01A-11R-A14D-07 | (TODO) -- GDC | mRNA__geneExpNormed__FPKM | |
| TCGA-E9-A1N5-01A-11R-A14D-07 | (TODO) -- GDC | mRNA__geneExp__FPKM | |
| TCGA-E9-A1N5-01A-11R-A14D-07 | (TODO) -- GDC | mRNA__counts__FPKM | |
| TCGA-E9-A1N6-01A-11R-A144-07 | (TODO) -- GDC | mRNA__geneExpNormed__FPKM | |
| TCGA-E9-A1N6-01A-11R-A144-07 | (TODO) -- GDC | mRNA__geneExp__FPKM | |
| TCGA-E9-A1N6-01A-11R-A144-07 | (TODO) -- GDC | mRNA__counts__FPKM | |
| TCGA-E9-A1N8-01A-11R-A144-07 | (TODO) -- GDC | mRNA__geneExpNormed__FPKM | |
| TCGA-E9-A1N8-01A-11R-A144-07 | (TODO) -- GDC | mRNA__geneExp__FPKM | |
| TCGA-E9-A1N8-01A-11R-A144-07 | (TODO) -- GDC | mRNA__counts__FPKM | |
| TCGA-E9-A1N9-01A-11R-A14D-07 | (TODO) -- GDC | mRNA__geneExpNormed__FPKM | |
| TCGA-E9-A1N9-01A-11R-A14D-07 | (TODO) -- GDC | mRNA__geneExp__FPKM | |
| TCGA-E9-A1N9-01A-11R-A14D-07 | (TODO) -- GDC | mRNA__counts__FPKM | |
| TCGA-E9-A1NA-01A-11R-A144-07 | (TODO) -- GDC | mRNA__geneExpNormed__FPKM | |
| TCGA-E9-A1NA-01A-11R-A144-07 | (TODO) -- GDC | mRNA__geneExp__FPKM | |
| TCGA-E9-A1NA-01A-11R-A144-07 | (TODO) -- GDC | mRNA__counts__FPKM | |
| TCGA-E9-A1NC-01A-21R-A26B-07 | (TODO) -- GDC | mRNA__geneExpNormed__FPKM | |
| TCGA-E9-A1NC-01A-21R-A26B-07 | (TODO) -- GDC | mRNA__geneExp__FPKM | |
| TCGA-E9-A1NC-01A-21R-A26B-07 | (TODO) -- GDC | mRNA__counts__FPKM | |
| TCGA-E9-A1ND-01A-11R-A144-07 | (TODO) -- GDC | mRNA__geneExpNormed__FPKM | |
| TCGA-E9-A1ND-01A-11R-A144-07 | (TODO) -- GDC | mRNA__geneExp__FPKM | |
| TCGA-E9-A1ND-01A-11R-A144-07 | (TODO) -- GDC | mRNA__counts__FPKM | |
| TCGA-E9-A1NE-01A-21R-A14M-07 | (TODO) -- GDC | mRNA__geneExpNormed__FPKM | |
| TCGA-E9-A1NE-01A-21R-A14M-07 | (TODO) -- GDC | mRNA__geneExp__FPKM | |
| TCGA-E9-A1NE-01A-21R-A14M-07 | (TODO) -- GDC | mRNA__counts__FPKM | |
| TCGA-E9-A1NF-01A-11R-A14D-07 | (TODO) -- GDC | mRNA__geneExpNormed__FPKM | |
| TCGA-E9-A1NF-01A-11R-A14D-07 | (TODO) -- GDC | mRNA__geneExp__FPKM | |
| TCGA-E9-A1NF-01A-11R-A14D-07 | (TODO) -- GDC | mRNA__counts__FPKM | |
| TCGA-E9-A1NG-01A-21R-A14M-07 | (TODO) -- GDC | mRNA__geneExpNormed__FPKM | |
| TCGA-E9-A1NG-01A-21R-A14M-07 | (TODO) -- GDC | mRNA__geneExp__FPKM | |
| TCGA-E9-A1NG-01A-21R-A14M-07 | (TODO) -- GDC | mRNA__counts__FPKM | |
| TCGA-E9-A1NH-01A-11R-A14D-07 | (TODO) -- GDC | mRNA__geneExpNormed__FPKM | |
| TCGA-E9-A1NH-01A-11R-A14D-07 | (TODO) -- GDC | mRNA__geneExp__FPKM | |
| TCGA-E9-A1NH-01A-11R-A14D-07 | (TODO) -- GDC | mRNA__counts__FPKM | |
| TCGA-E9-A1NI-01A-11R-A14D-07 | (TODO) -- GDC | mRNA__geneExpNormed__FPKM | |
| TCGA-E9-A1NI-01A-11R-A14D-07 | (TODO) -- GDC | mRNA__geneExp__FPKM | |
| TCGA-E9-A1NI-01A-11R-A14D-07 | (TODO) -- GDC | mRNA__counts__FPKM | |
| TCGA-E9-A1QZ-01A-21R-A169-07 | (TODO) -- GDC | mRNA__geneExpNormed__FPKM | |
| TCGA-E9-A1QZ-01A-21R-A169-07 | (TODO) -- GDC | mRNA__geneExp__FPKM | |
| TCGA-E9-A1QZ-01A-21R-A169-07 | (TODO) -- GDC | mRNA__counts__FPKM | |
| TCGA-E9-A1R0-01A-22R-A16F-07 | (TODO) -- GDC | mRNA__geneExpNormed__FPKM | |
| TCGA-E9-A1R0-01A-22R-A16F-07 | (TODO) -- GDC | mRNA__geneExp__FPKM | |
| TCGA-E9-A1R0-01A-22R-A16F-07 | (TODO) -- GDC | mRNA__counts__FPKM | |
| TCGA-E9-A1R2-01A-11R-A14D-07 | (TODO) -- GDC | mRNA__geneExpNormed__FPKM | |
| TCGA-E9-A1R2-01A-11R-A14D-07 | (TODO) -- GDC | mRNA__geneExp__FPKM | |
| TCGA-E9-A1R2-01A-11R-A14D-07 | (TODO) -- GDC | mRNA__counts__FPKM | |
| TCGA-E9-A1R3-01A-31R-A14M-07 | (TODO) -- GDC | mRNA__geneExpNormed__FPKM | |
| TCGA-E9-A1R3-01A-31R-A14M-07 | (TODO) -- GDC | mRNA__geneExp__FPKM | |
| TCGA-E9-A1R3-01A-31R-A14M-07 | (TODO) -- GDC | mRNA__counts__FPKM | |
| TCGA-E9-A1R4-01A-21R-A14D-07 | (TODO) -- GDC | mRNA__geneExpNormed__FPKM | |
| TCGA-E9-A1R4-01A-21R-A14D-07 | (TODO) -- GDC | mRNA__geneExp__FPKM | |
| TCGA-E9-A1R4-01A-21R-A14D-07 | (TODO) -- GDC | mRNA__counts__FPKM | |
| TCGA-E9-A1R5-01A-11R-A14M-07 | (TODO) -- GDC | mRNA__geneExpNormed__FPKM | |
| TCGA-E9-A1R5-01A-11R-A14M-07 | (TODO) -- GDC | mRNA__geneExp__FPKM | |
| TCGA-E9-A1R5-01A-11R-A14M-07 | (TODO) -- GDC | mRNA__counts__FPKM | |
| TCGA-E9-A1R6-01A-11R-A14D-07 | (TODO) -- GDC | mRNA__geneExpNormed__FPKM | |
| TCGA-E9-A1R6-01A-11R-A14D-07 | (TODO) -- GDC | mRNA__geneExp__FPKM | |
| TCGA-E9-A1R6-01A-11R-A14D-07 | (TODO) -- GDC | mRNA__counts__FPKM | |
| TCGA-E9-A1R7-01A-11R-A14M-07 | (TODO) -- GDC | mRNA__geneExpNormed__FPKM | |
| TCGA-E9-A1R7-01A-11R-A14M-07 | (TODO) -- GDC | mRNA__geneExp__FPKM | |
| TCGA-E9-A1R7-01A-11R-A14M-07 | (TODO) -- GDC | mRNA__counts__FPKM | |
| TCGA-E9-A1RA-01A-11R-A14D-07 | (TODO) -- GDC | mRNA__geneExpNormed__FPKM | |
| TCGA-E9-A1RA-01A-11R-A14D-07 | (TODO) -- GDC | mRNA__geneExp__FPKM | |
| TCGA-E9-A1RA-01A-11R-A14D-07 | (TODO) -- GDC | mRNA__counts__FPKM | |
| TCGA-E9-A1RB-01A-11R-A157-07 | (TODO) -- GDC | mRNA__geneExpNormed__FPKM | |
| TCGA-E9-A1RB-01A-11R-A157-07 | (TODO) -- GDC | mRNA__geneExp__FPKM | |
| TCGA-E9-A1RB-01A-11R-A157-07 | (TODO) -- GDC | mRNA__counts__FPKM | |
| TCGA-E9-A1RC-01A-11R-A157-07 | (TODO) -- GDC | mRNA__geneExpNormed__FPKM | |
| TCGA-E9-A1RC-01A-11R-A157-07 | (TODO) -- GDC | mRNA__geneExp__FPKM | |
| TCGA-E9-A1RC-01A-11R-A157-07 | (TODO) -- GDC | mRNA__counts__FPKM | |
| TCGA-E9-A1RD-01A-11R-A157-07 | (TODO) -- GDC | mRNA__geneExpNormed__FPKM | |
| TCGA-E9-A1RD-01A-11R-A157-07 | (TODO) -- GDC | mRNA__geneExp__FPKM | |
| TCGA-E9-A1RD-01A-11R-A157-07 | (TODO) -- GDC | mRNA__counts__FPKM | |
| TCGA-E9-A1RE-01A-11R-A157-07 | (TODO) -- GDC | mRNA__geneExpNormed__FPKM | |
| TCGA-E9-A1RE-01A-11R-A157-07 | (TODO) -- GDC | mRNA__geneExp__FPKM | |
| TCGA-E9-A1RE-01A-11R-A157-07 | (TODO) -- GDC | mRNA__counts__FPKM | |
| TCGA-E9-A1RF-01A-11R-A157-07 | (TODO) -- GDC | mRNA__geneExpNormed__FPKM | |
| TCGA-E9-A1RF-01A-11R-A157-07 | (TODO) -- GDC | mRNA__geneExp__FPKM | |
| TCGA-E9-A1RF-01A-11R-A157-07 | (TODO) -- GDC | mRNA__counts__FPKM | |
| TCGA-E9-A1RG-01A-11R-A14D-07 | (TODO) -- GDC | mRNA__geneExpNormed__FPKM | |
| TCGA-E9-A1RG-01A-11R-A14D-07 | (TODO) -- GDC | mRNA__geneExp__FPKM | |
| TCGA-E9-A1RG-01A-11R-A14D-07 | (TODO) -- GDC | mRNA__counts__FPKM | |
| TCGA-E9-A1RH-01A-21R-A169-07 | (TODO) -- GDC | mRNA__geneExpNormed__FPKM | |
| TCGA-E9-A1RH-01A-21R-A169-07 | (TODO) -- GDC | mRNA__geneExp__FPKM | |
| TCGA-E9-A1RH-01A-21R-A169-07 | (TODO) -- GDC | mRNA__counts__FPKM | |
| TCGA-E9-A1RI-01A-11R-A169-07 | (TODO) -- GDC | mRNA__geneExpNormed__FPKM | |
| TCGA-E9-A1RI-01A-11R-A169-07 | (TODO) -- GDC | mRNA__geneExp__FPKM | |
| TCGA-E9-A1RI-01A-11R-A169-07 | (TODO) -- GDC | mRNA__counts__FPKM | |
| TCGA-E9-A226-01A-21R-A157-07 | (TODO) -- GDC | mRNA__geneExpNormed__FPKM | |
| TCGA-E9-A226-01A-21R-A157-07 | (TODO) -- GDC | mRNA__geneExp__FPKM | |
| TCGA-E9-A226-01A-21R-A157-07 | (TODO) -- GDC | mRNA__counts__FPKM | |
| TCGA-E9-A227-01A-11R-A157-07 | (TODO) -- GDC | mRNA__geneExpNormed__FPKM | |
| TCGA-E9-A227-01A-11R-A157-07 | (TODO) -- GDC | mRNA__geneExp__FPKM | |
| TCGA-E9-A227-01A-11R-A157-07 | (TODO) -- GDC | mRNA__counts__FPKM | |
| TCGA-E9-A228-01A-31R-A157-07 | (TODO) -- GDC | mRNA__geneExpNormed__FPKM | |
| TCGA-E9-A228-01A-31R-A157-07 | (TODO) -- GDC | mRNA__geneExp__FPKM | |
| TCGA-E9-A228-01A-31R-A157-07 | (TODO) -- GDC | mRNA__counts__FPKM | |
| TCGA-E9-A229-01A-31R-A157-07 | (TODO) -- GDC | mRNA__geneExpNormed__FPKM | |
| TCGA-E9-A229-01A-31R-A157-07 | (TODO) -- GDC | mRNA__geneExp__FPKM | |
| TCGA-E9-A229-01A-31R-A157-07 | (TODO) -- GDC | mRNA__counts__FPKM | |
| TCGA-E9-A22A-01A-11R-A157-07 | (TODO) -- GDC | mRNA__geneExpNormed__FPKM | |
| TCGA-E9-A22A-01A-11R-A157-07 | (TODO) -- GDC | mRNA__geneExp__FPKM | |
| TCGA-E9-A22A-01A-11R-A157-07 | (TODO) -- GDC | mRNA__counts__FPKM | |
| TCGA-E9-A22B-01A-11R-A157-07 | (TODO) -- GDC | mRNA__geneExpNormed__FPKM | |
| TCGA-E9-A22B-01A-11R-A157-07 | (TODO) -- GDC | mRNA__geneExp__FPKM | |
| TCGA-E9-A22B-01A-11R-A157-07 | (TODO) -- GDC | mRNA__counts__FPKM | |
| TCGA-E9-A22D-01A-11R-A157-07 | (TODO) -- GDC | mRNA__geneExpNormed__FPKM | |
| TCGA-E9-A22D-01A-11R-A157-07 | (TODO) -- GDC | mRNA__geneExp__FPKM | |
| TCGA-E9-A22D-01A-11R-A157-07 | (TODO) -- GDC | mRNA__counts__FPKM | |
| TCGA-E9-A22E-01A-11R-A157-07 | (TODO) -- GDC | mRNA__geneExpNormed__FPKM | |
| TCGA-E9-A22E-01A-11R-A157-07 | (TODO) -- GDC | mRNA__geneExp__FPKM | |
| TCGA-E9-A22E-01A-11R-A157-07 | (TODO) -- GDC | mRNA__counts__FPKM | |
| TCGA-E9-A22G-01A-11R-A157-07 | (TODO) -- GDC | mRNA__geneExpNormed__FPKM | |
| TCGA-E9-A22G-01A-11R-A157-07 | (TODO) -- GDC | mRNA__geneExp__FPKM | |
| TCGA-E9-A22G-01A-11R-A157-07 | (TODO) -- GDC | mRNA__counts__FPKM | |
| TCGA-E9-A22H-01A-11R-A157-07 | (TODO) -- GDC | mRNA__geneExpNormed__FPKM | |
| TCGA-E9-A22H-01A-11R-A157-07 | (TODO) -- GDC | mRNA__geneExp__FPKM | |
| TCGA-E9-A22H-01A-11R-A157-07 | (TODO) -- GDC | mRNA__counts__FPKM | |
| TCGA-E9-A243-01A-21R-A169-07 | (TODO) -- GDC | mRNA__geneExpNormed__FPKM | |
| TCGA-E9-A243-01A-21R-A169-07 | (TODO) -- GDC | mRNA__geneExp__FPKM | |
| TCGA-E9-A243-01A-21R-A169-07 | (TODO) -- GDC | mRNA__counts__FPKM | |
| TCGA-E9-A244-01A-11R-A169-07 | (TODO) -- GDC | mRNA__geneExpNormed__FPKM | |
| TCGA-E9-A244-01A-11R-A169-07 | (TODO) -- GDC | mRNA__geneExp__FPKM | |
| TCGA-E9-A244-01A-11R-A169-07 | (TODO) -- GDC | mRNA__counts__FPKM | |
| TCGA-E9-A245-01A-22R-A16F-07 | (TODO) -- GDC | mRNA__geneExpNormed__FPKM | |
| TCGA-E9-A245-01A-22R-A16F-07 | (TODO) -- GDC | mRNA__geneExp__FPKM | |
| TCGA-E9-A245-01A-22R-A16F-07 | (TODO) -- GDC | mRNA__counts__FPKM | |
| TCGA-E9-A247-01A-11R-A169-07 | (TODO) -- GDC | mRNA__geneExpNormed__FPKM | |
| TCGA-E9-A247-01A-11R-A169-07 | (TODO) -- GDC | mRNA__geneExp__FPKM | |
| TCGA-E9-A247-01A-11R-A169-07 | (TODO) -- GDC | mRNA__counts__FPKM | |
| TCGA-E9-A248-01A-11R-A169-07 | (TODO) -- GDC | mRNA__geneExpNormed__FPKM | |
| TCGA-E9-A248-01A-11R-A169-07 | (TODO) -- GDC | mRNA__geneExp__FPKM | |
| TCGA-E9-A248-01A-11R-A169-07 | (TODO) -- GDC | mRNA__counts__FPKM | |
| TCGA-E9-A249-01A-11R-A169-07 | (TODO) -- GDC | mRNA__geneExpNormed__FPKM | |
| TCGA-E9-A249-01A-11R-A169-07 | (TODO) -- GDC | mRNA__geneExp__FPKM | |
| TCGA-E9-A249-01A-11R-A169-07 | (TODO) -- GDC | mRNA__counts__FPKM | |
| TCGA-E9-A24A-01A-11R-A169-07 | (TODO) -- GDC | mRNA__geneExpNormed__FPKM | |
| TCGA-E9-A24A-01A-11R-A169-07 | (TODO) -- GDC | mRNA__geneExp__FPKM | |
| TCGA-E9-A24A-01A-11R-A169-07 | (TODO) -- GDC | mRNA__counts__FPKM | |
| TCGA-E9-A295-01A-11R-A16F-07 | (TODO) -- GDC | mRNA__geneExpNormed__FPKM | |
| TCGA-E9-A295-01A-11R-A16F-07 | (TODO) -- GDC | mRNA__geneExp__FPKM | |
| TCGA-E9-A295-01A-11R-A16F-07 | (TODO) -- GDC | mRNA__counts__FPKM | |
| TCGA-E9-A2JS-01A-11R-A180-07 | (TODO) -- GDC | mRNA__geneExpNormed__FPKM | |
| TCGA-E9-A2JS-01A-11R-A180-07 | (TODO) -- GDC | mRNA__geneExp__FPKM | |
| TCGA-E9-A2JS-01A-11R-A180-07 | (TODO) -- GDC | mRNA__counts__FPKM | |
| TCGA-E9-A2JT-01A-22R-A18M-07 | (TODO) -- GDC | mRNA__geneExpNormed__FPKM | |
| TCGA-E9-A2JT-01A-22R-A18M-07 | (TODO) -- GDC | mRNA__geneExp__FPKM | |
| TCGA-E9-A2JT-01A-22R-A18M-07 | (TODO) -- GDC | mRNA__counts__FPKM | |
| TCGA-E9-A3HO-01A-11R-A213-07 | (TODO) -- GDC | mRNA__geneExpNormed__FPKM | |
| TCGA-E9-A3HO-01A-11R-A213-07 | (TODO) -- GDC | mRNA__geneExp__FPKM | |
| TCGA-E9-A3HO-01A-11R-A213-07 | (TODO) -- GDC | mRNA__counts__FPKM | |
| TCGA-E9-A3Q9-01A-11R-A21T-07 | (TODO) -- GDC | mRNA__geneExpNormed__FPKM | |
| TCGA-E9-A3Q9-01A-11R-A21T-07 | (TODO) -- GDC | mRNA__geneExp__FPKM | |
| TCGA-E9-A3Q9-01A-11R-A21T-07 | (TODO) -- GDC | mRNA__counts__FPKM | |
| TCGA-E9-A3QA-01A-61R-A22K-07 | (TODO) -- GDC | mRNA__geneExpNormed__FPKM | |
| TCGA-E9-A3QA-01A-61R-A22K-07 | (TODO) -- GDC | mRNA__geneExp__FPKM | |
| TCGA-E9-A3QA-01A-61R-A22K-07 | (TODO) -- GDC | mRNA__counts__FPKM | |
| TCGA-E9-A3X8-01A-31R-A22U-07 | (TODO) -- GDC | mRNA__geneExpNormed__FPKM | |
| TCGA-E9-A3X8-01A-31R-A22U-07 | (TODO) -- GDC | mRNA__geneExp__FPKM | |
| TCGA-E9-A3X8-01A-31R-A22U-07 | (TODO) -- GDC | mRNA__counts__FPKM | |
| TCGA-E9-A54X-01A-11R-A266-07 | (TODO) -- GDC | mRNA__geneExpNormed__FPKM | |
| TCGA-E9-A54X-01A-11R-A266-07 | (TODO) -- GDC | mRNA__geneExp__FPKM | |
| TCGA-E9-A54X-01A-11R-A266-07 | (TODO) -- GDC | mRNA__counts__FPKM | |
| TCGA-E9-A54Y-01A-11R-A466-07 | (TODO) -- GDC | mRNA__geneExpNormed__FPKM | |
| TCGA-E9-A54Y-01A-11R-A466-07 | (TODO) -- GDC | mRNA__geneExp__FPKM | |
| TCGA-E9-A54Y-01A-11R-A466-07 | (TODO) -- GDC | mRNA__counts__FPKM | |
| TCGA-E9-A5FK-01A-11R-A27Q-07 | (TODO) -- GDC | mRNA__geneExpNormed__FPKM | |
| TCGA-E9-A5FK-01A-11R-A27Q-07 | (TODO) -- GDC | mRNA__geneExp__FPKM | |
| TCGA-E9-A5FK-01A-11R-A27Q-07 | (TODO) -- GDC | mRNA__counts__FPKM | |
| TCGA-E9-A5FL-01A-11R-A27Q-07 | (TODO) -- GDC | mRNA__geneExpNormed__FPKM | |
| TCGA-E9-A5FL-01A-11R-A27Q-07 | (TODO) -- GDC | mRNA__geneExp__FPKM | |
| TCGA-E9-A5FL-01A-11R-A27Q-07 | (TODO) -- GDC | mRNA__counts__FPKM | |
| TCGA-E9-A5UO-01A-11R-A28M-07 | (TODO) -- GDC | mRNA__geneExpNormed__FPKM | |
| TCGA-E9-A5UO-01A-11R-A28M-07 | (TODO) -- GDC | mRNA__geneExp__FPKM | |
| TCGA-E9-A5UO-01A-11R-A28M-07 | (TODO) -- GDC | mRNA__counts__FPKM | |
| TCGA-E9-A5UP-01A-11R-A28M-07 | (TODO) -- GDC | mRNA__geneExpNormed__FPKM | |
| TCGA-E9-A5UP-01A-11R-A28M-07 | (TODO) -- GDC | mRNA__geneExp__FPKM | |
| TCGA-E9-A5UP-01A-11R-A28M-07 | (TODO) -- GDC | mRNA__counts__FPKM | |
| TCGA-E9-A6HE-01A-11R-A31O-07 | (TODO) -- GDC | mRNA__geneExpNormed__FPKM | |
| TCGA-E9-A6HE-01A-11R-A31O-07 | (TODO) -- GDC | mRNA__geneExp__FPKM | |
| TCGA-E9-A6HE-01A-11R-A31O-07 | (TODO) -- GDC | mRNA__counts__FPKM | |
| TCGA-EW-A1IW-01A-11R-A13Q-07 | (TODO) -- GDC | mRNA__geneExpNormed__FPKM | |
| TCGA-EW-A1IW-01A-11R-A13Q-07 | (TODO) -- GDC | mRNA__geneExp__FPKM | |
| TCGA-EW-A1IW-01A-11R-A13Q-07 | (TODO) -- GDC | mRNA__counts__FPKM | |
| TCGA-EW-A1IX-01A-12R-A144-07 | (TODO) -- GDC | mRNA__geneExpNormed__FPKM | |
| TCGA-EW-A1IX-01A-12R-A144-07 | (TODO) -- GDC | mRNA__geneExp__FPKM | |
| TCGA-EW-A1IX-01A-12R-A144-07 | (TODO) -- GDC | mRNA__counts__FPKM | |
| TCGA-EW-A1IY-01A-11R-A13Q-07 | (TODO) -- GDC | mRNA__geneExpNormed__FPKM | |
| TCGA-EW-A1IY-01A-11R-A13Q-07 | (TODO) -- GDC | mRNA__geneExp__FPKM | |
| TCGA-EW-A1IY-01A-11R-A13Q-07 | (TODO) -- GDC | mRNA__counts__FPKM | |
| TCGA-EW-A1IZ-01A-11R-A13Q-07 | (TODO) -- GDC | mRNA__geneExpNormed__FPKM | |
| TCGA-EW-A1IZ-01A-11R-A13Q-07 | (TODO) -- GDC | mRNA__geneExp__FPKM | |
| TCGA-EW-A1IZ-01A-11R-A13Q-07 | (TODO) -- GDC | mRNA__counts__FPKM | |
| TCGA-EW-A1J1-01A-11R-A13Q-07 | (TODO) -- GDC | mRNA__geneExpNormed__FPKM | |
| TCGA-EW-A1J1-01A-11R-A13Q-07 | (TODO) -- GDC | mRNA__geneExp__FPKM | |
| TCGA-EW-A1J1-01A-11R-A13Q-07 | (TODO) -- GDC | mRNA__counts__FPKM | |
| TCGA-EW-A1J2-01A-21R-A13Q-07 | (TODO) -- GDC | mRNA__geneExpNormed__FPKM | |
| TCGA-EW-A1J2-01A-21R-A13Q-07 | (TODO) -- GDC | mRNA__geneExp__FPKM | |
| TCGA-EW-A1J2-01A-21R-A13Q-07 | (TODO) -- GDC | mRNA__counts__FPKM | |
| TCGA-EW-A1J3-01A-11R-A13Q-07 | (TODO) -- GDC | mRNA__geneExpNormed__FPKM | |
| TCGA-EW-A1J3-01A-11R-A13Q-07 | (TODO) -- GDC | mRNA__geneExp__FPKM | |
| TCGA-EW-A1J3-01A-11R-A13Q-07 | (TODO) -- GDC | mRNA__counts__FPKM | |
| TCGA-EW-A1J5-01A-11R-A13Q-07 | (TODO) -- GDC | mRNA__geneExpNormed__FPKM | |
| TCGA-EW-A1J5-01A-11R-A13Q-07 | (TODO) -- GDC | mRNA__geneExp__FPKM | |
| TCGA-EW-A1J5-01A-11R-A13Q-07 | (TODO) -- GDC | mRNA__counts__FPKM | |
| TCGA-EW-A1J6-01A-11R-A13Q-07 | (TODO) -- GDC | mRNA__geneExpNormed__FPKM | |
| TCGA-EW-A1J6-01A-11R-A13Q-07 | (TODO) -- GDC | mRNA__geneExp__FPKM | |
| TCGA-EW-A1J6-01A-11R-A13Q-07 | (TODO) -- GDC | mRNA__counts__FPKM | |
| TCGA-EW-A1OV-01A-11R-A144-07 | (TODO) -- GDC | mRNA__geneExpNormed__FPKM | |
| TCGA-EW-A1OV-01A-11R-A144-07 | (TODO) -- GDC | mRNA__geneExp__FPKM | |
| TCGA-EW-A1OV-01A-11R-A144-07 | (TODO) -- GDC | mRNA__counts__FPKM | |
| TCGA-EW-A1OW-01A-21R-A144-07 | (TODO) -- GDC | mRNA__geneExpNormed__FPKM | |
| TCGA-EW-A1OW-01A-21R-A144-07 | (TODO) -- GDC | mRNA__geneExp__FPKM | |
| TCGA-EW-A1OW-01A-21R-A144-07 | (TODO) -- GDC | mRNA__counts__FPKM | |
| TCGA-EW-A1OX-01A-11R-A144-07 | (TODO) -- GDC | mRNA__geneExpNormed__FPKM | |
| TCGA-EW-A1OX-01A-11R-A144-07 | (TODO) -- GDC | mRNA__geneExp__FPKM | |
| TCGA-EW-A1OX-01A-11R-A144-07 | (TODO) -- GDC | mRNA__counts__FPKM | |
| TCGA-EW-A1OY-01A-11R-A144-07 | (TODO) -- GDC | mRNA__geneExpNormed__FPKM | |
| TCGA-EW-A1OY-01A-11R-A144-07 | (TODO) -- GDC | mRNA__geneExp__FPKM | |
| TCGA-EW-A1OY-01A-11R-A144-07 | (TODO) -- GDC | mRNA__counts__FPKM | |
| TCGA-EW-A1OZ-01A-11R-A144-07 | (TODO) -- GDC | mRNA__geneExpNormed__FPKM | |
| TCGA-EW-A1OZ-01A-11R-A144-07 | (TODO) -- GDC | mRNA__geneExp__FPKM | |
| TCGA-EW-A1OZ-01A-11R-A144-07 | (TODO) -- GDC | mRNA__counts__FPKM | |
| TCGA-EW-A1P0-01A-11R-A144-07 | (TODO) -- GDC | mRNA__geneExpNormed__FPKM | |
| TCGA-EW-A1P0-01A-11R-A144-07 | (TODO) -- GDC | mRNA__geneExp__FPKM | |
| TCGA-EW-A1P0-01A-11R-A144-07 | (TODO) -- GDC | mRNA__counts__FPKM | |
| TCGA-EW-A1P1-01A-31R-A14D-07 | (TODO) -- GDC | mRNA__geneExpNormed__FPKM | |
| TCGA-EW-A1P1-01A-31R-A14D-07 | (TODO) -- GDC | mRNA__geneExp__FPKM | |
| TCGA-EW-A1P1-01A-31R-A14D-07 | (TODO) -- GDC | mRNA__counts__FPKM | |
| TCGA-EW-A1P3-01A-11R-A144-07 | (TODO) -- GDC | mRNA__geneExpNormed__FPKM | |
| TCGA-EW-A1P3-01A-11R-A144-07 | (TODO) -- GDC | mRNA__geneExp__FPKM | |
| TCGA-EW-A1P3-01A-11R-A144-07 | (TODO) -- GDC | mRNA__counts__FPKM | |
| TCGA-EW-A1P4-01A-21R-A144-07 | (TODO) -- GDC | mRNA__geneExpNormed__FPKM | |
| TCGA-EW-A1P4-01A-21R-A144-07 | (TODO) -- GDC | mRNA__geneExp__FPKM | |
| TCGA-EW-A1P4-01A-21R-A144-07 | (TODO) -- GDC | mRNA__counts__FPKM | |
| TCGA-EW-A1P5-01A-11R-A144-07 | (TODO) -- GDC | mRNA__geneExpNormed__FPKM | |
| TCGA-EW-A1P5-01A-11R-A144-07 | (TODO) -- GDC | mRNA__geneExp__FPKM | |
| TCGA-EW-A1P5-01A-11R-A144-07 | (TODO) -- GDC | mRNA__counts__FPKM | |
| TCGA-EW-A1P6-01A-11R-A144-07 | (TODO) -- GDC | mRNA__geneExpNormed__FPKM | |
| TCGA-EW-A1P6-01A-11R-A144-07 | (TODO) -- GDC | mRNA__geneExp__FPKM | |
| TCGA-EW-A1P6-01A-11R-A144-07 | (TODO) -- GDC | mRNA__counts__FPKM | |
| TCGA-EW-A1P7-01A-21R-A144-07 | (TODO) -- GDC | mRNA__geneExpNormed__FPKM | |
| TCGA-EW-A1P7-01A-21R-A144-07 | (TODO) -- GDC | mRNA__geneExp__FPKM | |
| TCGA-EW-A1P7-01A-21R-A144-07 | (TODO) -- GDC | mRNA__counts__FPKM | |
| TCGA-EW-A1P8-01A-11R-A144-07 | (TODO) -- GDC | mRNA__geneExpNormed__FPKM | |
| TCGA-EW-A1P8-01A-11R-A144-07 | (TODO) -- GDC | mRNA__geneExp__FPKM | |
| TCGA-EW-A1P8-01A-11R-A144-07 | (TODO) -- GDC | mRNA__counts__FPKM | |
| TCGA-EW-A1PA-01A-11R-A144-07 | (TODO) -- GDC | mRNA__geneExpNormed__FPKM | |
| TCGA-EW-A1PA-01A-11R-A144-07 | (TODO) -- GDC | mRNA__geneExp__FPKM | |
| TCGA-EW-A1PA-01A-11R-A144-07 | (TODO) -- GDC | mRNA__counts__FPKM | |
| TCGA-EW-A1PB-01A-11R-A144-07 | (TODO) -- GDC | mRNA__geneExpNormed__FPKM | |
| TCGA-EW-A1PB-01A-11R-A144-07 | (TODO) -- GDC | mRNA__geneExp__FPKM | |
| TCGA-EW-A1PB-01A-11R-A144-07 | (TODO) -- GDC | mRNA__counts__FPKM | |
| TCGA-EW-A1PC-01B-11R-A21T-07 | (TODO) -- GDC | mRNA__geneExpNormed__FPKM | |
| TCGA-EW-A1PC-01B-11R-A21T-07 | (TODO) -- GDC | mRNA__geneExp__FPKM | |
| TCGA-EW-A1PC-01B-11R-A21T-07 | (TODO) -- GDC | mRNA__counts__FPKM | |
| TCGA-EW-A1PD-01A-11R-A144-07 | (TODO) -- GDC | mRNA__geneExpNormed__FPKM | |
| TCGA-EW-A1PD-01A-11R-A144-07 | (TODO) -- GDC | mRNA__geneExp__FPKM | |
| TCGA-EW-A1PD-01A-11R-A144-07 | (TODO) -- GDC | mRNA__counts__FPKM | |
| TCGA-EW-A1PE-01A-11R-A144-07 | (TODO) -- GDC | mRNA__geneExpNormed__FPKM | |
| TCGA-EW-A1PE-01A-11R-A144-07 | (TODO) -- GDC | mRNA__geneExp__FPKM | |
| TCGA-EW-A1PE-01A-11R-A144-07 | (TODO) -- GDC | mRNA__counts__FPKM | |
| TCGA-EW-A1PF-01A-11R-A144-07 | (TODO) -- GDC | mRNA__geneExpNormed__FPKM | |
| TCGA-EW-A1PF-01A-11R-A144-07 | (TODO) -- GDC | mRNA__geneExp__FPKM | |
| TCGA-EW-A1PF-01A-11R-A144-07 | (TODO) -- GDC | mRNA__counts__FPKM | |
| TCGA-EW-A1PG-01A-11R-A144-07 | (TODO) -- GDC | mRNA__geneExpNormed__FPKM | |
| TCGA-EW-A1PG-01A-11R-A144-07 | (TODO) -- GDC | mRNA__geneExp__FPKM | |
| TCGA-EW-A1PG-01A-11R-A144-07 | (TODO) -- GDC | mRNA__counts__FPKM | |
| TCGA-EW-A1PH-01A-11R-A14M-07 | (TODO) -- GDC | mRNA__geneExpNormed__FPKM | |
| TCGA-EW-A1PH-01A-11R-A14M-07 | (TODO) -- GDC | mRNA__geneExp__FPKM | |
| TCGA-EW-A1PH-01A-11R-A14M-07 | (TODO) -- GDC | mRNA__counts__FPKM | |
| TCGA-EW-A2FR-01A-11R-A21T-07 | (TODO) -- GDC | mRNA__geneExpNormed__FPKM | |
| TCGA-EW-A2FR-01A-11R-A21T-07 | (TODO) -- GDC | mRNA__geneExp__FPKM | |
| TCGA-EW-A2FR-01A-11R-A21T-07 | (TODO) -- GDC | mRNA__counts__FPKM | |
| TCGA-EW-A2FS-01A-11R-A17B-07 | (TODO) -- GDC | mRNA__geneExpNormed__FPKM | |
| TCGA-EW-A2FS-01A-11R-A17B-07 | (TODO) -- GDC | mRNA__geneExp__FPKM | |
| TCGA-EW-A2FS-01A-11R-A17B-07 | (TODO) -- GDC | mRNA__counts__FPKM | |
| TCGA-EW-A2FV-01A-11R-A17B-07 | (TODO) -- GDC | mRNA__geneExpNormed__FPKM | |
| TCGA-EW-A2FV-01A-11R-A17B-07 | (TODO) -- GDC | mRNA__geneExp__FPKM | |
| TCGA-EW-A2FV-01A-11R-A17B-07 | (TODO) -- GDC | mRNA__counts__FPKM | |
| TCGA-EW-A2FW-01A-11R-A17B-07 | (TODO) -- GDC | mRNA__geneExpNormed__FPKM | |
| TCGA-EW-A2FW-01A-11R-A17B-07 | (TODO) -- GDC | mRNA__geneExp__FPKM | |
| TCGA-EW-A2FW-01A-11R-A17B-07 | (TODO) -- GDC | mRNA__counts__FPKM | |
| TCGA-EW-A3E8-01B-11R-A24H-07 | (TODO) -- GDC | mRNA__geneExpNormed__FPKM | |
| TCGA-EW-A3E8-01B-11R-A24H-07 | (TODO) -- GDC | mRNA__geneExp__FPKM | |
| TCGA-EW-A3E8-01B-11R-A24H-07 | (TODO) -- GDC | mRNA__counts__FPKM | |
| TCGA-EW-A3U0-01A-11R-A22K-07 | (TODO) -- GDC | mRNA__geneExpNormed__FPKM | |
| TCGA-EW-A3U0-01A-11R-A22K-07 | (TODO) -- GDC | mRNA__geneExp__FPKM | |
| TCGA-EW-A3U0-01A-11R-A22K-07 | (TODO) -- GDC | mRNA__counts__FPKM | |
| TCGA-EW-A423-01A-11R-A24H-07 | (TODO) -- GDC | mRNA__geneExpNormed__FPKM | |
| TCGA-EW-A423-01A-11R-A24H-07 | (TODO) -- GDC | mRNA__geneExp__FPKM | |
| TCGA-EW-A423-01A-11R-A24H-07 | (TODO) -- GDC | mRNA__counts__FPKM | |
| TCGA-EW-A424-01A-11R-A24H-07 | (TODO) -- GDC | mRNA__geneExpNormed__FPKM | |
| TCGA-EW-A424-01A-11R-A24H-07 | (TODO) -- GDC | mRNA__geneExp__FPKM | |
| TCGA-EW-A424-01A-11R-A24H-07 | (TODO) -- GDC | mRNA__counts__FPKM | |
| TCGA-EW-A6S9-01A-22R-A33J-07 | (TODO) -- GDC | mRNA__geneExpNormed__FPKM | |
| TCGA-EW-A6S9-01A-22R-A33J-07 | (TODO) -- GDC | mRNA__geneExp__FPKM | |
| TCGA-EW-A6S9-01A-22R-A33J-07 | (TODO) -- GDC | mRNA__counts__FPKM | |
| TCGA-EW-A6SA-01A-21R-A32P-07 | (TODO) -- GDC | mRNA__geneExpNormed__FPKM | |
| TCGA-EW-A6SA-01A-21R-A32P-07 | (TODO) -- GDC | mRNA__geneExp__FPKM | |
| TCGA-EW-A6SA-01A-21R-A32P-07 | (TODO) -- GDC | mRNA__counts__FPKM | |
| TCGA-EW-A6SB-01A-12R-A32P-07 | (TODO) -- GDC | mRNA__geneExpNormed__FPKM | |
| TCGA-EW-A6SB-01A-12R-A32P-07 | (TODO) -- GDC | mRNA__geneExp__FPKM | |
| TCGA-EW-A6SB-01A-12R-A32P-07 | (TODO) -- GDC | mRNA__counts__FPKM | |
| TCGA-EW-A6SC-01A-12R-A32P-07 | (TODO) -- GDC | mRNA__geneExpNormed__FPKM | |
| TCGA-EW-A6SC-01A-12R-A32P-07 | (TODO) -- GDC | mRNA__geneExp__FPKM | |
| TCGA-EW-A6SC-01A-12R-A32P-07 | (TODO) -- GDC | mRNA__counts__FPKM | |
| TCGA-EW-A6SD-01A-12R-A33J-07 | (TODO) -- GDC | mRNA__geneExpNormed__FPKM | |
| TCGA-EW-A6SD-01A-12R-A33J-07 | (TODO) -- GDC | mRNA__geneExp__FPKM | |
| TCGA-EW-A6SD-01A-12R-A33J-07 | (TODO) -- GDC | mRNA__counts__FPKM | |
| TCGA-GI-A2C8-01A-11R-A16F-07 | (TODO) -- GDC | mRNA__geneExpNormed__FPKM | |
| TCGA-GI-A2C8-01A-11R-A16F-07 | (TODO) -- GDC | mRNA__geneExp__FPKM | |
| TCGA-GI-A2C8-01A-11R-A16F-07 | (TODO) -- GDC | mRNA__counts__FPKM | |
| TCGA-GI-A2C9-01A-11R-A21T-07 | (TODO) -- GDC | mRNA__geneExpNormed__FPKM | |
| TCGA-GI-A2C9-01A-11R-A21T-07 | (TODO) -- GDC | mRNA__geneExp__FPKM | |
| TCGA-GI-A2C9-01A-11R-A21T-07 | (TODO) -- GDC | mRNA__counts__FPKM | |
| TCGA-GM-A2D9-01A-11R-A18M-07 | (TODO) -- GDC | mRNA__geneExpNormed__FPKM | |
| TCGA-GM-A2D9-01A-11R-A18M-07 | (TODO) -- GDC | mRNA__geneExp__FPKM | |
| TCGA-GM-A2D9-01A-11R-A18M-07 | (TODO) -- GDC | mRNA__counts__FPKM | |
| TCGA-GM-A2DA-01A-11R-A18M-07 | (TODO) -- GDC | mRNA__geneExpNormed__FPKM | |
| TCGA-GM-A2DA-01A-11R-A18M-07 | (TODO) -- GDC | mRNA__geneExp__FPKM | |
| TCGA-GM-A2DA-01A-11R-A18M-07 | (TODO) -- GDC | mRNA__counts__FPKM | |
| TCGA-GM-A2DB-01A-31R-A18M-07 | (TODO) -- GDC | mRNA__geneExpNormed__FPKM | |
| TCGA-GM-A2DB-01A-31R-A18M-07 | (TODO) -- GDC | mRNA__geneExp__FPKM | |
| TCGA-GM-A2DB-01A-31R-A18M-07 | (TODO) -- GDC | mRNA__counts__FPKM | |
| TCGA-GM-A2DC-01A-11R-A18M-07 | (TODO) -- GDC | mRNA__geneExpNormed__FPKM | |
| TCGA-GM-A2DC-01A-11R-A18M-07 | (TODO) -- GDC | mRNA__geneExp__FPKM | |
| TCGA-GM-A2DC-01A-11R-A18M-07 | (TODO) -- GDC | mRNA__counts__FPKM | |
| TCGA-GM-A2DD-01A-11R-A180-07 | (TODO) -- GDC | mRNA__geneExpNormed__FPKM | |
| TCGA-GM-A2DD-01A-11R-A180-07 | (TODO) -- GDC | mRNA__geneExp__FPKM | |
| TCGA-GM-A2DD-01A-11R-A180-07 | (TODO) -- GDC | mRNA__counts__FPKM | |
| TCGA-GM-A2DF-01A-11R-A180-07 | (TODO) -- GDC | mRNA__geneExpNormed__FPKM | |
| TCGA-GM-A2DF-01A-11R-A180-07 | (TODO) -- GDC | mRNA__geneExp__FPKM | |
| TCGA-GM-A2DF-01A-11R-A180-07 | (TODO) -- GDC | mRNA__counts__FPKM | |
| TCGA-GM-A2DH-01A-11R-A180-07 | (TODO) -- GDC | mRNA__geneExpNormed__FPKM | |
| TCGA-GM-A2DH-01A-11R-A180-07 | (TODO) -- GDC | mRNA__geneExp__FPKM | |
| TCGA-GM-A2DH-01A-11R-A180-07 | (TODO) -- GDC | mRNA__counts__FPKM | |
| TCGA-GM-A2DI-01A-31R-A18M-07 | (TODO) -- GDC | mRNA__geneExpNormed__FPKM | |
| TCGA-GM-A2DI-01A-31R-A18M-07 | (TODO) -- GDC | mRNA__geneExp__FPKM | |
| TCGA-GM-A2DI-01A-31R-A18M-07 | (TODO) -- GDC | mRNA__counts__FPKM | |
| TCGA-GM-A2DK-01A-21R-A180-07 | (TODO) -- GDC | mRNA__geneExpNormed__FPKM | |
| TCGA-GM-A2DK-01A-21R-A180-07 | (TODO) -- GDC | mRNA__geneExp__FPKM | |
| TCGA-GM-A2DK-01A-21R-A180-07 | (TODO) -- GDC | mRNA__counts__FPKM | |
| TCGA-GM-A2DL-01A-11R-A18M-07 | (TODO) -- GDC | mRNA__geneExpNormed__FPKM | |
| TCGA-GM-A2DL-01A-11R-A18M-07 | (TODO) -- GDC | mRNA__geneExp__FPKM | |
| TCGA-GM-A2DL-01A-11R-A18M-07 | (TODO) -- GDC | mRNA__counts__FPKM | |
| TCGA-GM-A2DM-01A-11R-A180-07 | (TODO) -- GDC | mRNA__geneExpNormed__FPKM | |
| TCGA-GM-A2DM-01A-11R-A180-07 | (TODO) -- GDC | mRNA__geneExp__FPKM | |
| TCGA-GM-A2DM-01A-11R-A180-07 | (TODO) -- GDC | mRNA__counts__FPKM | |
| TCGA-GM-A2DN-01A-11R-A180-07 | (TODO) -- GDC | mRNA__geneExpNormed__FPKM | |
| TCGA-GM-A2DN-01A-11R-A180-07 | (TODO) -- GDC | mRNA__geneExp__FPKM | |
| TCGA-GM-A2DN-01A-11R-A180-07 | (TODO) -- GDC | mRNA__counts__FPKM | |
| TCGA-GM-A2DO-01A-11R-A18M-07 | (TODO) -- GDC | mRNA__geneExpNormed__FPKM | |
| TCGA-GM-A2DO-01A-11R-A18M-07 | (TODO) -- GDC | mRNA__geneExp__FPKM | |
| TCGA-GM-A2DO-01A-11R-A18M-07 | (TODO) -- GDC | mRNA__counts__FPKM | |
| TCGA-GM-A3NW-01A-21R-A22K-07 | (TODO) -- GDC | mRNA__geneExpNormed__FPKM | |
| TCGA-GM-A3NW-01A-21R-A22K-07 | (TODO) -- GDC | mRNA__geneExp__FPKM | |
| TCGA-GM-A3NW-01A-21R-A22K-07 | (TODO) -- GDC | mRNA__counts__FPKM | |
| TCGA-GM-A3NY-01A-11R-A21T-07 | (TODO) -- GDC | mRNA__geneExpNormed__FPKM | |
| TCGA-GM-A3NY-01A-11R-A21T-07 | (TODO) -- GDC | mRNA__geneExp__FPKM | |
| TCGA-GM-A3NY-01A-11R-A21T-07 | (TODO) -- GDC | mRNA__counts__FPKM | |
| TCGA-GM-A3XG-01A-31R-A24H-07 | (TODO) -- GDC | mRNA__geneExpNormed__FPKM | |
| TCGA-GM-A3XG-01A-31R-A24H-07 | (TODO) -- GDC | mRNA__geneExp__FPKM | |
| TCGA-GM-A3XG-01A-31R-A24H-07 | (TODO) -- GDC | mRNA__counts__FPKM | |
| TCGA-GM-A3XL-01A-11R-A22U-07 | (TODO) -- GDC | mRNA__geneExpNormed__FPKM | |
| TCGA-GM-A3XL-01A-11R-A22U-07 | (TODO) -- GDC | mRNA__geneExp__FPKM | |
| TCGA-GM-A3XL-01A-11R-A22U-07 | (TODO) -- GDC | mRNA__counts__FPKM | |
| TCGA-GM-A3XN-01A-12R-A22U-07 | (TODO) -- GDC | mRNA__geneExpNormed__FPKM | |
| TCGA-GM-A3XN-01A-12R-A22U-07 | (TODO) -- GDC | mRNA__geneExp__FPKM | |
| TCGA-GM-A3XN-01A-12R-A22U-07 | (TODO) -- GDC | mRNA__counts__FPKM | |
| TCGA-GM-A4E0-01A-12R-A266-07 | (TODO) -- GDC | mRNA__geneExpNormed__FPKM | |
| TCGA-GM-A4E0-01A-12R-A266-07 | (TODO) -- GDC | mRNA__geneExp__FPKM | |
| TCGA-GM-A4E0-01A-12R-A266-07 | (TODO) -- GDC | mRNA__counts__FPKM | |
| TCGA-GM-A5PV-01A-11R-A28M-07 | (TODO) -- GDC | mRNA__geneExpNormed__FPKM | |
| TCGA-GM-A5PV-01A-11R-A28M-07 | (TODO) -- GDC | mRNA__geneExp__FPKM | |
| TCGA-GM-A5PV-01A-11R-A28M-07 | (TODO) -- GDC | mRNA__counts__FPKM | |
| TCGA-GM-A5PX-01A-12R-A28M-07 | (TODO) -- GDC | mRNA__geneExpNormed__FPKM | |
| TCGA-GM-A5PX-01A-12R-A28M-07 | (TODO) -- GDC | mRNA__geneExp__FPKM | |
| TCGA-GM-A5PX-01A-12R-A28M-07 | (TODO) -- GDC | mRNA__counts__FPKM | |
| TCGA-HN-A2NL-01A-11R-A18M-07 | (TODO) -- GDC | mRNA__geneExpNormed__FPKM | |
| TCGA-HN-A2NL-01A-11R-A18M-07 | (TODO) -- GDC | mRNA__geneExp__FPKM | |
| TCGA-HN-A2NL-01A-11R-A18M-07 | (TODO) -- GDC | mRNA__counts__FPKM | |
| TCGA-HN-A2OB-01A-21R-A27Q-07 | (TODO) -- GDC | mRNA__geneExpNormed__FPKM | |
| TCGA-HN-A2OB-01A-21R-A27Q-07 | (TODO) -- GDC | mRNA__geneExp__FPKM | |
| TCGA-HN-A2OB-01A-21R-A27Q-07 | (TODO) -- GDC | mRNA__counts__FPKM | |
| TCGA-JL-A3YW-01A-12R-A239-07 | (TODO) -- GDC | mRNA__geneExpNormed__FPKM | |
| TCGA-JL-A3YW-01A-12R-A239-07 | (TODO) -- GDC | mRNA__geneExp__FPKM | |
| TCGA-JL-A3YW-01A-12R-A239-07 | (TODO) -- GDC | mRNA__counts__FPKM | |
| TCGA-JL-A3YX-01A-11R-A22U-07 | (TODO) -- GDC | mRNA__geneExpNormed__FPKM | |
| TCGA-JL-A3YX-01A-11R-A22U-07 | (TODO) -- GDC | mRNA__geneExp__FPKM | |
| TCGA-JL-A3YX-01A-11R-A22U-07 | (TODO) -- GDC | mRNA__counts__FPKM | |
| TCGA-LD-A66U-01A-11R-A31O-07 | (TODO) -- GDC | mRNA__geneExpNormed__FPKM | |
| TCGA-LD-A66U-01A-11R-A31O-07 | (TODO) -- GDC | mRNA__geneExp__FPKM | |
| TCGA-LD-A66U-01A-11R-A31O-07 | (TODO) -- GDC | mRNA__counts__FPKM | |
| TCGA-LD-A74U-01A-13R-A33J-07 | (TODO) -- GDC | mRNA__geneExpNormed__FPKM | |
| TCGA-LD-A74U-01A-13R-A33J-07 | (TODO) -- GDC | mRNA__geneExp__FPKM | |
| TCGA-LD-A74U-01A-13R-A33J-07 | (TODO) -- GDC | mRNA__counts__FPKM | |
| TCGA-LD-A7W6-01A-81R-A352-07 | (TODO) -- GDC | mRNA__geneExpNormed__FPKM | |
| TCGA-LD-A7W6-01A-81R-A352-07 | (TODO) -- GDC | mRNA__geneExp__FPKM | |
| TCGA-LD-A7W6-01A-81R-A352-07 | (TODO) -- GDC | mRNA__counts__FPKM | |
| TCGA-LD-A9QF-01A-32R-A41B-07 | (TODO) -- GDC | mRNA__geneExpNormed__FPKM | |
| TCGA-LD-A9QF-01A-32R-A41B-07 | (TODO) -- GDC | mRNA__geneExp__FPKM | |
| TCGA-LD-A9QF-01A-32R-A41B-07 | (TODO) -- GDC | mRNA__counts__FPKM | |
| TCGA-LL-A440-01A-11R-A24H-07 | (TODO) -- GDC | mRNA__geneExpNormed__FPKM | |
| TCGA-LL-A440-01A-11R-A24H-07 | (TODO) -- GDC | mRNA__geneExp__FPKM | |
| TCGA-LL-A440-01A-11R-A24H-07 | (TODO) -- GDC | mRNA__counts__FPKM | |
| TCGA-LL-A441-01A-11R-A24H-07 | (TODO) -- GDC | mRNA__geneExpNormed__FPKM | |
| TCGA-LL-A441-01A-11R-A24H-07 | (TODO) -- GDC | mRNA__geneExp__FPKM | |
| TCGA-LL-A441-01A-11R-A24H-07 | (TODO) -- GDC | mRNA__counts__FPKM | |
| TCGA-LL-A442-01A-11R-A24H-07 | (TODO) -- GDC | mRNA__geneExpNormed__FPKM | |
| TCGA-LL-A442-01A-11R-A24H-07 | (TODO) -- GDC | mRNA__geneExp__FPKM | |
| TCGA-LL-A442-01A-11R-A24H-07 | (TODO) -- GDC | mRNA__counts__FPKM | |
| TCGA-LL-A50Y-01A-11R-A266-07 | (TODO) -- GDC | mRNA__geneExpNormed__FPKM | |
| TCGA-LL-A50Y-01A-11R-A266-07 | (TODO) -- GDC | mRNA__geneExp__FPKM | |
| TCGA-LL-A50Y-01A-11R-A266-07 | (TODO) -- GDC | mRNA__counts__FPKM | |
| TCGA-LL-A5YL-01A-12R-A29R-07 | (TODO) -- GDC | mRNA__geneExpNormed__FPKM | |
| TCGA-LL-A5YL-01A-12R-A29R-07 | (TODO) -- GDC | mRNA__geneExp__FPKM | |
| TCGA-LL-A5YL-01A-12R-A29R-07 | (TODO) -- GDC | mRNA__counts__FPKM | |
| TCGA-LL-A5YM-01A-11R-A28M-07 | (TODO) -- GDC | mRNA__geneExpNormed__FPKM | |
| TCGA-LL-A5YM-01A-11R-A28M-07 | (TODO) -- GDC | mRNA__geneExp__FPKM | |
| TCGA-LL-A5YM-01A-11R-A28M-07 | (TODO) -- GDC | mRNA__counts__FPKM | |
| TCGA-LL-A5YN-01A-11R-A28M-07 | (TODO) -- GDC | mRNA__geneExpNormed__FPKM | |
| TCGA-LL-A5YN-01A-11R-A28M-07 | (TODO) -- GDC | mRNA__geneExp__FPKM | |
| TCGA-LL-A5YN-01A-11R-A28M-07 | (TODO) -- GDC | mRNA__counts__FPKM | |
| TCGA-LL-A5YO-01A-21R-A28M-07 | (TODO) -- GDC | mRNA__geneExpNormed__FPKM | |
| TCGA-LL-A5YO-01A-21R-A28M-07 | (TODO) -- GDC | mRNA__geneExp__FPKM | |
| TCGA-LL-A5YO-01A-21R-A28M-07 | (TODO) -- GDC | mRNA__counts__FPKM | |
| TCGA-LL-A5YP-01A-21R-A28M-07 | (TODO) -- GDC | mRNA__geneExpNormed__FPKM | |
| TCGA-LL-A5YP-01A-21R-A28M-07 | (TODO) -- GDC | mRNA__geneExp__FPKM | |
| TCGA-LL-A5YP-01A-21R-A28M-07 | (TODO) -- GDC | mRNA__counts__FPKM | |
| TCGA-LL-A6FP-01A-11R-A31O-07 | (TODO) -- GDC | mRNA__geneExpNormed__FPKM | |
| TCGA-LL-A6FP-01A-11R-A31O-07 | (TODO) -- GDC | mRNA__geneExp__FPKM | |
| TCGA-LL-A6FP-01A-11R-A31O-07 | (TODO) -- GDC | mRNA__counts__FPKM | |
| TCGA-LL-A6FQ-01A-11R-A31O-07 | (TODO) -- GDC | mRNA__geneExpNormed__FPKM | |
| TCGA-LL-A6FQ-01A-11R-A31O-07 | (TODO) -- GDC | mRNA__geneExp__FPKM | |
| TCGA-LL-A6FQ-01A-11R-A31O-07 | (TODO) -- GDC | mRNA__counts__FPKM | |
| TCGA-LL-A6FR-01A-12R-A31O-07 | (TODO) -- GDC | mRNA__geneExpNormed__FPKM | |
| TCGA-LL-A6FR-01A-12R-A31O-07 | (TODO) -- GDC | mRNA__geneExp__FPKM | |
| TCGA-LL-A6FR-01A-12R-A31O-07 | (TODO) -- GDC | mRNA__counts__FPKM | |
| TCGA-LL-A73Y-01A-11R-A33J-07 | (TODO) -- GDC | mRNA__geneExpNormed__FPKM | |
| TCGA-LL-A73Y-01A-11R-A33J-07 | (TODO) -- GDC | mRNA__geneExp__FPKM | |
| TCGA-LL-A73Y-01A-11R-A33J-07 | (TODO) -- GDC | mRNA__counts__FPKM | |
| TCGA-LL-A73Z-01A-11R-A32P-07 | (TODO) -- GDC | mRNA__geneExpNormed__FPKM | |
| TCGA-LL-A73Z-01A-11R-A32P-07 | (TODO) -- GDC | mRNA__geneExp__FPKM | |
| TCGA-LL-A73Z-01A-11R-A32P-07 | (TODO) -- GDC | mRNA__counts__FPKM | |
| TCGA-LL-A740-01A-21R-A32P-07 | (TODO) -- GDC | mRNA__geneExpNormed__FPKM | |
| TCGA-LL-A740-01A-21R-A32P-07 | (TODO) -- GDC | mRNA__geneExp__FPKM | |
| TCGA-LL-A740-01A-21R-A32P-07 | (TODO) -- GDC | mRNA__counts__FPKM | |
| TCGA-LL-A7SZ-01A-32R-A352-07 | (TODO) -- GDC | mRNA__geneExpNormed__FPKM | |
| TCGA-LL-A7SZ-01A-32R-A352-07 | (TODO) -- GDC | mRNA__geneExp__FPKM | |
| TCGA-LL-A7SZ-01A-32R-A352-07 | (TODO) -- GDC | mRNA__counts__FPKM | |
| TCGA-LL-A7T0-01A-31R-A352-07 | (TODO) -- GDC | mRNA__geneExpNormed__FPKM | |
| TCGA-LL-A7T0-01A-31R-A352-07 | (TODO) -- GDC | mRNA__geneExp__FPKM | |
| TCGA-LL-A7T0-01A-31R-A352-07 | (TODO) -- GDC | mRNA__counts__FPKM | |
| TCGA-LL-A8F5-01A-11R-A36F-07 | (TODO) -- GDC | mRNA__geneExpNormed__FPKM | |
| TCGA-LL-A8F5-01A-11R-A36F-07 | (TODO) -- GDC | mRNA__geneExp__FPKM | |
| TCGA-LL-A8F5-01A-11R-A36F-07 | (TODO) -- GDC | mRNA__counts__FPKM | |
| TCGA-LL-A9Q3-01A-11R-A41B-07 | (TODO) -- GDC | mRNA__geneExpNormed__FPKM | |
| TCGA-LL-A9Q3-01A-11R-A41B-07 | (TODO) -- GDC | mRNA__geneExp__FPKM | |
| TCGA-LL-A9Q3-01A-11R-A41B-07 | (TODO) -- GDC | mRNA__counts__FPKM | |
| TCGA-LQ-A4E4-01A-11R-A266-07 | (TODO) -- GDC | mRNA__geneExpNormed__FPKM | |
| TCGA-LQ-A4E4-01A-11R-A266-07 | (TODO) -- GDC | mRNA__geneExp__FPKM | |
| TCGA-LQ-A4E4-01A-11R-A266-07 | (TODO) -- GDC | mRNA__counts__FPKM | |
| TCGA-MS-A51U-01A-31R-A266-07 | (TODO) -- GDC | mRNA__geneExpNormed__FPKM | |
| TCGA-MS-A51U-01A-31R-A266-07 | (TODO) -- GDC | mRNA__geneExp__FPKM | |
| TCGA-MS-A51U-01A-31R-A266-07 | (TODO) -- GDC | mRNA__counts__FPKM | |
| TCGA-OK-A5Q2-01A-11R-A27Q-07 | (TODO) -- GDC | mRNA__geneExpNormed__FPKM | |
| TCGA-OK-A5Q2-01A-11R-A27Q-07 | (TODO) -- GDC | mRNA__geneExp__FPKM | |
| TCGA-OK-A5Q2-01A-11R-A27Q-07 | (TODO) -- GDC | mRNA__counts__FPKM | |
| TCGA-OL-A5D6-01A-21R-A27Q-07 | (TODO) -- GDC | mRNA__geneExpNormed__FPKM | |
| TCGA-OL-A5D6-01A-21R-A27Q-07 | (TODO) -- GDC | mRNA__geneExp__FPKM | |
| TCGA-OL-A5D6-01A-21R-A27Q-07 | (TODO) -- GDC | mRNA__counts__FPKM | |
| TCGA-OL-A5D7-01A-11R-A27Q-07 | (TODO) -- GDC | mRNA__geneExpNormed__FPKM | |
| TCGA-OL-A5D7-01A-11R-A27Q-07 | (TODO) -- GDC | mRNA__geneExp__FPKM | |
| TCGA-OL-A5D7-01A-11R-A27Q-07 | (TODO) -- GDC | mRNA__counts__FPKM | |
| TCGA-OL-A5D8-01A-11R-A27Q-07 | (TODO) -- GDC | mRNA__geneExpNormed__FPKM | |
| TCGA-OL-A5D8-01A-11R-A27Q-07 | (TODO) -- GDC | mRNA__geneExp__FPKM | |
| TCGA-OL-A5D8-01A-11R-A27Q-07 | (TODO) -- GDC | mRNA__counts__FPKM | |
| TCGA-OL-A5DA-01A-11R-A27Q-07 | (TODO) -- GDC | mRNA__geneExpNormed__FPKM | |
| TCGA-OL-A5DA-01A-11R-A27Q-07 | (TODO) -- GDC | mRNA__geneExp__FPKM | |
| TCGA-OL-A5DA-01A-11R-A27Q-07 | (TODO) -- GDC | mRNA__counts__FPKM | |
| TCGA-OL-A5RU-01A-11R-A28M-07 | (TODO) -- GDC | mRNA__geneExpNormed__FPKM | |
| TCGA-OL-A5RU-01A-11R-A28M-07 | (TODO) -- GDC | mRNA__geneExp__FPKM | |
| TCGA-OL-A5RU-01A-11R-A28M-07 | (TODO) -- GDC | mRNA__counts__FPKM | |
| TCGA-OL-A5RV-01A-12R-A28M-07 | (TODO) -- GDC | mRNA__geneExpNormed__FPKM | |
| TCGA-OL-A5RV-01A-12R-A28M-07 | (TODO) -- GDC | mRNA__geneExp__FPKM | |
| TCGA-OL-A5RV-01A-12R-A28M-07 | (TODO) -- GDC | mRNA__counts__FPKM | |
| TCGA-OL-A5RW-01A-11R-A28M-07 | (TODO) -- GDC | mRNA__geneExpNormed__FPKM | |
| TCGA-OL-A5RW-01A-11R-A28M-07 | (TODO) -- GDC | mRNA__geneExp__FPKM | |
| TCGA-OL-A5RW-01A-11R-A28M-07 | (TODO) -- GDC | mRNA__counts__FPKM | |
| TCGA-OL-A5RX-01A-11R-A28M-07 | (TODO) -- GDC | mRNA__geneExpNormed__FPKM | |
| TCGA-OL-A5RX-01A-11R-A28M-07 | (TODO) -- GDC | mRNA__geneExp__FPKM | |
| TCGA-OL-A5RX-01A-11R-A28M-07 | (TODO) -- GDC | mRNA__counts__FPKM | |
| TCGA-OL-A5RY-01A-21R-A28M-07 | (TODO) -- GDC | mRNA__geneExpNormed__FPKM | |
| TCGA-OL-A5RY-01A-21R-A28M-07 | (TODO) -- GDC | mRNA__geneExp__FPKM | |
| TCGA-OL-A5RY-01A-21R-A28M-07 | (TODO) -- GDC | mRNA__counts__FPKM | |
| TCGA-OL-A5RZ-01A-11R-A28M-07 | (TODO) -- GDC | mRNA__geneExpNormed__FPKM | |
| TCGA-OL-A5RZ-01A-11R-A28M-07 | (TODO) -- GDC | mRNA__geneExp__FPKM | |
| TCGA-OL-A5RZ-01A-11R-A28M-07 | (TODO) -- GDC | mRNA__counts__FPKM | |
| TCGA-OL-A5S0-01A-11R-A28M-07 | (TODO) -- GDC | mRNA__geneExpNormed__FPKM | |
| TCGA-OL-A5S0-01A-11R-A28M-07 | (TODO) -- GDC | mRNA__geneExp__FPKM | |
| TCGA-OL-A5S0-01A-11R-A28M-07 | (TODO) -- GDC | mRNA__counts__FPKM | |
| TCGA-OL-A66H-01A-11R-A29R-07 | (TODO) -- GDC | mRNA__geneExpNormed__FPKM | |
| TCGA-OL-A66H-01A-11R-A29R-07 | (TODO) -- GDC | mRNA__geneExp__FPKM | |
| TCGA-OL-A66H-01A-11R-A29R-07 | (TODO) -- GDC | mRNA__counts__FPKM | |
| TCGA-OL-A66I-01A-21R-A29R-07 | (TODO) -- GDC | mRNA__geneExpNormed__FPKM | |
| TCGA-OL-A66I-01A-21R-A29R-07 | (TODO) -- GDC | mRNA__geneExp__FPKM | |
| TCGA-OL-A66I-01A-21R-A29R-07 | (TODO) -- GDC | mRNA__counts__FPKM | |
| TCGA-OL-A66J-01A-11R-A29R-07 | (TODO) -- GDC | mRNA__geneExpNormed__FPKM | |
| TCGA-OL-A66J-01A-11R-A29R-07 | (TODO) -- GDC | mRNA__geneExp__FPKM | |
| TCGA-OL-A66J-01A-11R-A29R-07 | (TODO) -- GDC | mRNA__counts__FPKM | |
| TCGA-OL-A66K-01A-11R-A29R-07 | (TODO) -- GDC | mRNA__geneExpNormed__FPKM | |
| TCGA-OL-A66K-01A-11R-A29R-07 | (TODO) -- GDC | mRNA__geneExp__FPKM | |
| TCGA-OL-A66K-01A-11R-A29R-07 | (TODO) -- GDC | mRNA__counts__FPKM | |
| TCGA-OL-A66L-01A-12R-A31O-07 | (TODO) -- GDC | mRNA__geneExpNormed__FPKM | |
| TCGA-OL-A66L-01A-12R-A31O-07 | (TODO) -- GDC | mRNA__geneExp__FPKM | |
| TCGA-OL-A66L-01A-12R-A31O-07 | (TODO) -- GDC | mRNA__counts__FPKM | |
| TCGA-OL-A66N-01A-12R-A31O-07 | (TODO) -- GDC | mRNA__geneExpNormed__FPKM | |
| TCGA-OL-A66N-01A-12R-A31O-07 | (TODO) -- GDC | mRNA__geneExp__FPKM | |
| TCGA-OL-A66N-01A-12R-A31O-07 | (TODO) -- GDC | mRNA__counts__FPKM | |
| TCGA-OL-A66O-01A-11R-A31O-07 | (TODO) -- GDC | mRNA__geneExpNormed__FPKM | |
| TCGA-OL-A66O-01A-11R-A31O-07 | (TODO) -- GDC | mRNA__geneExp__FPKM | |
| TCGA-OL-A66O-01A-11R-A31O-07 | (TODO) -- GDC | mRNA__counts__FPKM | |
| TCGA-OL-A66P-01A-11R-A31O-07 | (TODO) -- GDC | mRNA__geneExpNormed__FPKM | |
| TCGA-OL-A66P-01A-11R-A31O-07 | (TODO) -- GDC | mRNA__geneExp__FPKM | |
| TCGA-OL-A66P-01A-11R-A31O-07 | (TODO) -- GDC | mRNA__counts__FPKM | |
| TCGA-OL-A6VO-01A-12R-A33J-07 | (TODO) -- GDC | mRNA__geneExpNormed__FPKM | |
| TCGA-OL-A6VO-01A-12R-A33J-07 | (TODO) -- GDC | mRNA__geneExp__FPKM | |
| TCGA-OL-A6VO-01A-12R-A33J-07 | (TODO) -- GDC | mRNA__counts__FPKM | |
| TCGA-OL-A6VQ-01A-12R-A41B-07 | (TODO) -- GDC | mRNA__geneExpNormed__FPKM | |
| TCGA-OL-A6VQ-01A-12R-A41B-07 | (TODO) -- GDC | mRNA__geneExp__FPKM | |
| TCGA-OL-A6VQ-01A-12R-A41B-07 | (TODO) -- GDC | mRNA__counts__FPKM | |
| TCGA-OL-A6VR-01A-32R-A33J-07 | (TODO) -- GDC | mRNA__geneExpNormed__FPKM | |
| TCGA-OL-A6VR-01A-32R-A33J-07 | (TODO) -- GDC | mRNA__geneExp__FPKM | |
| TCGA-OL-A6VR-01A-32R-A33J-07 | (TODO) -- GDC | mRNA__counts__FPKM | |
| TCGA-OL-A97C-01A-32R-A41B-07 | (TODO) -- GDC | mRNA__geneExpNormed__FPKM | |
| TCGA-OL-A97C-01A-32R-A41B-07 | (TODO) -- GDC | mRNA__geneExp__FPKM | |
| TCGA-OL-A97C-01A-32R-A41B-07 | (TODO) -- GDC | mRNA__counts__FPKM | |
| TCGA-PE-A5DC-01A-12R-A27Q-07 | (TODO) -- GDC | mRNA__geneExpNormed__FPKM | |
| TCGA-PE-A5DC-01A-12R-A27Q-07 | (TODO) -- GDC | mRNA__geneExp__FPKM | |
| TCGA-PE-A5DC-01A-12R-A27Q-07 | (TODO) -- GDC | mRNA__counts__FPKM | |
| TCGA-PE-A5DD-01A-12R-A27Q-07 | (TODO) -- GDC | mRNA__geneExpNormed__FPKM | |
| TCGA-PE-A5DD-01A-12R-A27Q-07 | (TODO) -- GDC | mRNA__geneExp__FPKM | |
| TCGA-PE-A5DD-01A-12R-A27Q-07 | (TODO) -- GDC | mRNA__counts__FPKM | |
| TCGA-PE-A5DE-01A-11R-A27Q-07 | (TODO) -- GDC | mRNA__geneExpNormed__FPKM | |
| TCGA-PE-A5DE-01A-11R-A27Q-07 | (TODO) -- GDC | mRNA__geneExp__FPKM | |
| TCGA-PE-A5DE-01A-11R-A27Q-07 | (TODO) -- GDC | mRNA__counts__FPKM | |
| TCGA-S3-A6ZF-01A-32R-A32P-07 | (TODO) -- GDC | mRNA__geneExpNormed__FPKM | |
| TCGA-S3-A6ZF-01A-32R-A32P-07 | (TODO) -- GDC | mRNA__geneExp__FPKM | |
| TCGA-S3-A6ZF-01A-32R-A32P-07 | (TODO) -- GDC | mRNA__counts__FPKM | |
| TCGA-S3-A6ZG-01A-22R-A32P-07 | (TODO) -- GDC | mRNA__geneExpNormed__FPKM | |
| TCGA-S3-A6ZG-01A-22R-A32P-07 | (TODO) -- GDC | mRNA__geneExp__FPKM | |
| TCGA-S3-A6ZG-01A-22R-A32P-07 | (TODO) -- GDC | mRNA__counts__FPKM | |
| TCGA-S3-A6ZH-01A-22R-A32P-07 | (TODO) -- GDC | mRNA__geneExpNormed__FPKM | |
| TCGA-S3-A6ZH-01A-22R-A32P-07 | (TODO) -- GDC | mRNA__geneExp__FPKM | |
| TCGA-S3-A6ZH-01A-22R-A32P-07 | (TODO) -- GDC | mRNA__counts__FPKM | |
| TCGA-S3-AA0Z-01A-11R-A41B-07 | (TODO) -- GDC | mRNA__geneExpNormed__FPKM | |
| TCGA-S3-AA0Z-01A-11R-A41B-07 | (TODO) -- GDC | mRNA__geneExp__FPKM | |
| TCGA-S3-AA0Z-01A-11R-A41B-07 | (TODO) -- GDC | mRNA__counts__FPKM | |
| TCGA-S3-AA10-01A-21R-A41B-07 | (TODO) -- GDC | mRNA__geneExpNormed__FPKM | |
| TCGA-S3-AA10-01A-21R-A41B-07 | (TODO) -- GDC | mRNA__geneExp__FPKM | |
| TCGA-S3-AA10-01A-21R-A41B-07 | (TODO) -- GDC | mRNA__counts__FPKM | |
| TCGA-S3-AA11-01A-31R-A41B-07 | (TODO) -- GDC | mRNA__geneExpNormed__FPKM | |
| TCGA-S3-AA11-01A-31R-A41B-07 | (TODO) -- GDC | mRNA__geneExp__FPKM | |
| TCGA-S3-AA11-01A-31R-A41B-07 | (TODO) -- GDC | mRNA__counts__FPKM | |
| TCGA-S3-AA12-01A-11R-A41B-07 | (TODO) -- GDC | mRNA__geneExpNormed__FPKM | |
| TCGA-S3-AA12-01A-11R-A41B-07 | (TODO) -- GDC | mRNA__geneExp__FPKM | |
| TCGA-S3-AA12-01A-11R-A41B-07 | (TODO) -- GDC | mRNA__counts__FPKM | |
| TCGA-S3-AA14-01A-11R-A41B-07 | (TODO) -- GDC | mRNA__geneExpNormed__FPKM | |
| TCGA-S3-AA14-01A-11R-A41B-07 | (TODO) -- GDC | mRNA__geneExp__FPKM | |
| TCGA-S3-AA14-01A-11R-A41B-07 | (TODO) -- GDC | mRNA__counts__FPKM | |
| TCGA-S3-AA15-01A-11R-A41B-07 | (TODO) -- GDC | mRNA__geneExpNormed__FPKM | |
| TCGA-S3-AA15-01A-11R-A41B-07 | (TODO) -- GDC | mRNA__geneExp__FPKM | |
| TCGA-S3-AA15-01A-11R-A41B-07 | (TODO) -- GDC | mRNA__counts__FPKM | |
| TCGA-S3-AA17-01A-11R-A41B-07 | (TODO) -- GDC | mRNA__geneExpNormed__FPKM | |
| TCGA-S3-AA17-01A-11R-A41B-07 | (TODO) -- GDC | mRNA__geneExp__FPKM | |
| TCGA-S3-AA17-01A-11R-A41B-07 | (TODO) -- GDC | mRNA__counts__FPKM | |
| TCGA-UL-AAZ6-01A-11R-A41B-07 | (TODO) -- GDC | mRNA__geneExpNormed__FPKM | |
| TCGA-UL-AAZ6-01A-11R-A41B-07 | (TODO) -- GDC | mRNA__geneExp__FPKM | |
| TCGA-UL-AAZ6-01A-11R-A41B-07 | (TODO) -- GDC | mRNA__counts__FPKM | |
| TCGA-UU-A93S-01A-21R-A41B-07 | (TODO) -- GDC | mRNA__geneExpNormed__FPKM | |
| TCGA-UU-A93S-01A-21R-A41B-07 | (TODO) -- GDC | mRNA__geneExp__FPKM | |
| TCGA-UU-A93S-01A-21R-A41B-07 | (TODO) -- GDC | mRNA__counts__FPKM | |
| TCGA-V7-A7HQ-01A-11R-A33J-07 | (TODO) -- GDC | mRNA__geneExpNormed__FPKM | |
| TCGA-V7-A7HQ-01A-11R-A33J-07 | (TODO) -- GDC | mRNA__geneExp__FPKM | |
| TCGA-V7-A7HQ-01A-11R-A33J-07 | (TODO) -- GDC | mRNA__counts__FPKM | |
| TCGA-W8-A86G-01A-21R-A36F-07 | (TODO) -- GDC | mRNA__geneExpNormed__FPKM | |
| TCGA-W8-A86G-01A-21R-A36F-07 | (TODO) -- GDC | mRNA__geneExp__FPKM | |
| TCGA-W8-A86G-01A-21R-A36F-07 | (TODO) -- GDC | mRNA__counts__FPKM | |
| TCGA-WT-AB41-01A-11R-A41B-07 | (TODO) -- GDC | mRNA__geneExpNormed__FPKM | |
| TCGA-WT-AB41-01A-11R-A41B-07 | (TODO) -- GDC | mRNA__geneExp__FPKM | |
| TCGA-WT-AB41-01A-11R-A41B-07 | (TODO) -- GDC | mRNA__counts__FPKM | |
| TCGA-WT-AB44-01A-11R-A41B-07 | (TODO) -- GDC | mRNA__geneExpNormed__FPKM | |
| TCGA-WT-AB44-01A-11R-A41B-07 | (TODO) -- GDC | mRNA__geneExp__FPKM | |
| TCGA-WT-AB44-01A-11R-A41B-07 | (TODO) -- GDC | mRNA__counts__FPKM | |
| TCGA-XX-A899-01A-11R-A36F-07 | (TODO) -- GDC | mRNA__geneExpNormed__FPKM | |
| TCGA-XX-A899-01A-11R-A36F-07 | (TODO) -- GDC | mRNA__geneExp__FPKM | |
| TCGA-XX-A899-01A-11R-A36F-07 | (TODO) -- GDC | mRNA__counts__FPKM | |
| TCGA-XX-A89A-01A-11R-A36F-07 | (TODO) -- GDC | mRNA__geneExpNormed__FPKM | |
| TCGA-XX-A89A-01A-11R-A36F-07 | (TODO) -- GDC | mRNA__geneExp__FPKM | |
| TCGA-XX-A89A-01A-11R-A36F-07 | (TODO) -- GDC | mRNA__counts__FPKM | |
| TCGA-Z7-A8R5-01A-42R-A41B-07 | (TODO) -- GDC | mRNA__geneExpNormed__FPKM | |
| TCGA-Z7-A8R5-01A-42R-A41B-07 | (TODO) -- GDC | mRNA__geneExp__FPKM | |
| TCGA-Z7-A8R5-01A-42R-A41B-07 | (TODO) -- GDC | mRNA__counts__FPKM | |
| TCGA-Z7-A8R6-01A-11R-A41B-07 | (TODO) -- GDC | mRNA__geneExpNormed__FPKM | |
| TCGA-Z7-A8R6-01A-11R-A41B-07 | (TODO) -- GDC | mRNA__geneExp__FPKM | |
| TCGA-Z7-A8R6-01A-11R-A41B-07 | (TODO) -- GDC | mRNA__counts__FPKM |
Table S28.
| TCGA Barcode | Platform | Center | Annotation |
|---|---|---|---|
| TCGA-3C-AAAU-01A-11R-A41G-13 | (TODO) -- GDC | miR__geneExp | |
| TCGA-3C-AAAU-01A-11R-A41G-13 | (TODO) -- GDC | miR__isoformExp | |
| TCGA-3C-AALI-01A-11R-A41G-13 | (TODO) -- GDC | miR__geneExp | |
| TCGA-3C-AALI-01A-11R-A41G-13 | (TODO) -- GDC | miR__isoformExp | |
| TCGA-3C-AALJ-01A-31R-A41G-13 | (TODO) -- GDC | miR__geneExp | |
| TCGA-3C-AALJ-01A-31R-A41G-13 | (TODO) -- GDC | miR__isoformExp | |
| TCGA-3C-AALK-01A-11R-A41G-13 | (TODO) -- GDC | miR__geneExp | |
| TCGA-3C-AALK-01A-11R-A41G-13 | (TODO) -- GDC | miR__isoformExp | |
| TCGA-4H-AAAK-01A-12R-A41G-13 | (TODO) -- GDC | miR__geneExp | |
| TCGA-4H-AAAK-01A-12R-A41G-13 | (TODO) -- GDC | miR__isoformExp | |
| TCGA-5L-AAT0-01A-12R-A41G-13 | (TODO) -- GDC | miR__geneExp | |
| TCGA-5L-AAT0-01A-12R-A41G-13 | (TODO) -- GDC | miR__isoformExp | |
| TCGA-5L-AAT1-01A-12R-A41G-13 | (TODO) -- GDC | miR__geneExp | |
| TCGA-5L-AAT1-01A-12R-A41G-13 | (TODO) -- GDC | miR__isoformExp | |
| TCGA-5T-A9QA-01A-11R-A41G-13 | (TODO) -- GDC | miR__geneExp | |
| TCGA-5T-A9QA-01A-11R-A41G-13 | (TODO) -- GDC | miR__isoformExp | |
| TCGA-A1-A0SB-01A-11R-A143-13 | (TODO) -- GDC | miR__geneExp | |
| TCGA-A1-A0SB-01A-11R-A143-13 | (TODO) -- GDC | miR__isoformExp | |
| TCGA-A1-A0SD-01A-11R-A114-13 | (TODO) -- GDC | miR__geneExp | |
| TCGA-A1-A0SD-01A-11R-A114-13 | (TODO) -- GDC | miR__isoformExp | |
| TCGA-A1-A0SE-01A-11R-A085-13 | (TODO) -- GDC | miR__geneExp | |
| TCGA-A1-A0SE-01A-11R-A085-13 | (TODO) -- GDC | miR__isoformExp | |
| TCGA-A1-A0SF-01A-11R-A143-13 | (TODO) -- GDC | miR__geneExp | |
| TCGA-A1-A0SF-01A-11R-A143-13 | (TODO) -- GDC | miR__isoformExp | |
| TCGA-A1-A0SG-01A-11R-A143-13 | (TODO) -- GDC | miR__geneExp | |
| TCGA-A1-A0SG-01A-11R-A143-13 | (TODO) -- GDC | miR__isoformExp | |
| TCGA-A1-A0SH-01A-11R-A085-13 | (TODO) -- GDC | miR__geneExp | |
| TCGA-A1-A0SH-01A-11R-A085-13 | (TODO) -- GDC | miR__isoformExp | |
| TCGA-A1-A0SI-01A-11R-A143-13 | (TODO) -- GDC | miR__geneExp | |
| TCGA-A1-A0SI-01A-11R-A143-13 | (TODO) -- GDC | miR__isoformExp | |
| TCGA-A1-A0SJ-01A-11R-A085-13 | (TODO) -- GDC | miR__geneExp | |
| TCGA-A1-A0SJ-01A-11R-A085-13 | (TODO) -- GDC | miR__isoformExp | |
| TCGA-A1-A0SK-01A-12R-A085-13 | (TODO) -- GDC | miR__geneExp | |
| TCGA-A1-A0SK-01A-12R-A085-13 | (TODO) -- GDC | miR__isoformExp | |
| TCGA-A1-A0SM-01A-11R-A085-13 | (TODO) -- GDC | miR__geneExp | |
| TCGA-A1-A0SM-01A-11R-A085-13 | (TODO) -- GDC | miR__isoformExp | |
| TCGA-A1-A0SN-01A-11R-A143-13 | (TODO) -- GDC | miR__geneExp | |
| TCGA-A1-A0SN-01A-11R-A143-13 | (TODO) -- GDC | miR__isoformExp | |
| TCGA-A1-A0SO-01A-22R-A085-13 | (TODO) -- GDC | miR__geneExp | |
| TCGA-A1-A0SO-01A-22R-A085-13 | (TODO) -- GDC | miR__isoformExp | |
| TCGA-A1-A0SP-01A-11R-A085-13 | (TODO) -- GDC | miR__geneExp | |
| TCGA-A1-A0SP-01A-11R-A085-13 | (TODO) -- GDC | miR__isoformExp | |
| TCGA-A1-A0SQ-01A-21R-A143-13 | (TODO) -- GDC | miR__geneExp | |
| TCGA-A1-A0SQ-01A-21R-A143-13 | (TODO) -- GDC | miR__isoformExp | |
| TCGA-A2-A04N-01A-11R-A114-13 | (TODO) -- GDC | miR__geneExp | |
| TCGA-A2-A04N-01A-11R-A114-13 | (TODO) -- GDC | miR__isoformExp | |
| TCGA-A2-A04P-01A-31R-A035-13 | (TODO) -- GDC | miR__geneExp | |
| TCGA-A2-A04P-01A-31R-A035-13 | (TODO) -- GDC | miR__isoformExp | |
| TCGA-A2-A04Q-01A-21R-A035-13 | (TODO) -- GDC | miR__geneExp | |
| TCGA-A2-A04Q-01A-21R-A035-13 | (TODO) -- GDC | miR__isoformExp | |
| TCGA-A2-A04R-01A-41R-A108-13 | (TODO) -- GDC | miR__geneExp | |
| TCGA-A2-A04R-01A-41R-A108-13 | (TODO) -- GDC | miR__isoformExp | |
| TCGA-A2-A04T-01A-21R-A035-13 | (TODO) -- GDC | miR__geneExp | |
| TCGA-A2-A04T-01A-21R-A035-13 | (TODO) -- GDC | miR__isoformExp | |
| TCGA-A2-A04U-01A-11R-A114-13 | (TODO) -- GDC | miR__geneExp | |
| TCGA-A2-A04U-01A-11R-A114-13 | (TODO) -- GDC | miR__isoformExp | |
| TCGA-A2-A04V-01A-21R-A035-13 | (TODO) -- GDC | miR__geneExp | |
| TCGA-A2-A04V-01A-21R-A035-13 | (TODO) -- GDC | miR__isoformExp | |
| TCGA-A2-A04W-01A-31R-A114-13 | (TODO) -- GDC | miR__geneExp | |
| TCGA-A2-A04W-01A-31R-A114-13 | (TODO) -- GDC | miR__isoformExp | |
| TCGA-A2-A04X-01A-21R-A035-13 | (TODO) -- GDC | miR__geneExp | |
| TCGA-A2-A04X-01A-21R-A035-13 | (TODO) -- GDC | miR__isoformExp | |
| TCGA-A2-A04Y-01A-21R-A035-13 | (TODO) -- GDC | miR__geneExp | |
| TCGA-A2-A04Y-01A-21R-A035-13 | (TODO) -- GDC | miR__isoformExp | |
| TCGA-A2-A0CK-01A-11R-A22I-13 | (TODO) -- GDC | miR__geneExp | |
| TCGA-A2-A0CK-01A-11R-A22I-13 | (TODO) -- GDC | miR__isoformExp | |
| TCGA-A2-A0CL-01A-11R-A114-13 | (TODO) -- GDC | miR__geneExp | |
| TCGA-A2-A0CL-01A-11R-A114-13 | (TODO) -- GDC | miR__isoformExp | |
| TCGA-A2-A0CM-01A-31R-A035-13 | (TODO) -- GDC | miR__geneExp | |
| TCGA-A2-A0CM-01A-31R-A035-13 | (TODO) -- GDC | miR__isoformExp | |
| TCGA-A2-A0CO-01A-13R-A22I-13 | (TODO) -- GDC | miR__geneExp | |
| TCGA-A2-A0CO-01A-13R-A22I-13 | (TODO) -- GDC | miR__isoformExp | |
| TCGA-A2-A0CP-01A-11R-A035-13 | (TODO) -- GDC | miR__geneExp | |
| TCGA-A2-A0CP-01A-11R-A035-13 | (TODO) -- GDC | miR__isoformExp | |
| TCGA-A2-A0CQ-01A-21R-A035-13 | (TODO) -- GDC | miR__geneExp | |
| TCGA-A2-A0CQ-01A-21R-A035-13 | (TODO) -- GDC | miR__isoformExp | |
| TCGA-A2-A0CR-01A-11R-A22I-13 | (TODO) -- GDC | miR__geneExp | |
| TCGA-A2-A0CR-01A-11R-A22I-13 | (TODO) -- GDC | miR__isoformExp | |
| TCGA-A2-A0CS-01A-11R-A114-13 | (TODO) -- GDC | miR__geneExp | |
| TCGA-A2-A0CS-01A-11R-A114-13 | (TODO) -- GDC | miR__isoformExp | |
| TCGA-A2-A0CT-01A-31R-A057-13 | (TODO) -- GDC | miR__geneExp | |
| TCGA-A2-A0CT-01A-31R-A057-13 | (TODO) -- GDC | miR__isoformExp | |
| TCGA-A2-A0CU-01A-12R-A035-13 | (TODO) -- GDC | miR__geneExp | |
| TCGA-A2-A0CU-01A-12R-A035-13 | (TODO) -- GDC | miR__isoformExp | |
| TCGA-A2-A0CV-01A-31R-A114-13 | (TODO) -- GDC | miR__geneExp | |
| TCGA-A2-A0CV-01A-31R-A114-13 | (TODO) -- GDC | miR__isoformExp | |
| TCGA-A2-A0CW-01A-21R-A114-13 | (TODO) -- GDC | miR__geneExp | |
| TCGA-A2-A0CW-01A-21R-A114-13 | (TODO) -- GDC | miR__isoformExp | |
| TCGA-A2-A0CY-01A-12R-A035-13 | (TODO) -- GDC | miR__geneExp | |
| TCGA-A2-A0CY-01A-12R-A035-13 | (TODO) -- GDC | miR__isoformExp | |
| TCGA-A2-A0CZ-01A-11R-A035-13 | (TODO) -- GDC | miR__geneExp | |
| TCGA-A2-A0CZ-01A-11R-A035-13 | (TODO) -- GDC | miR__isoformExp | |
| TCGA-A2-A0D0-01A-11R-A010-13 | (TODO) -- GDC | miR__geneExp | |
| TCGA-A2-A0D0-01A-11R-A010-13 | (TODO) -- GDC | miR__isoformExp | |
| TCGA-A2-A0D1-01A-11R-A035-13 | (TODO) -- GDC | miR__geneExp | |
| TCGA-A2-A0D1-01A-11R-A035-13 | (TODO) -- GDC | miR__isoformExp | |
| TCGA-A2-A0D2-01A-21R-A035-13 | (TODO) -- GDC | miR__geneExp | |
| TCGA-A2-A0D2-01A-21R-A035-13 | (TODO) -- GDC | miR__isoformExp | |
| TCGA-A2-A0D3-01A-11R-A114-13 | (TODO) -- GDC | miR__geneExp | |
| TCGA-A2-A0D3-01A-11R-A114-13 | (TODO) -- GDC | miR__isoformExp | |
| TCGA-A2-A0D4-01A-11R-A038-13 | (TODO) -- GDC | miR__geneExp | |
| TCGA-A2-A0D4-01A-11R-A038-13 | (TODO) -- GDC | miR__isoformExp | |
| TCGA-A2-A0EM-01A-11R-A035-13 | (TODO) -- GDC | miR__geneExp | |
| TCGA-A2-A0EM-01A-11R-A035-13 | (TODO) -- GDC | miR__isoformExp | |
| TCGA-A2-A0EN-01A-13R-A085-13 | (TODO) -- GDC | miR__geneExp | |
| TCGA-A2-A0EN-01A-13R-A085-13 | (TODO) -- GDC | miR__isoformExp | |
| TCGA-A2-A0EO-01A-11R-A035-13 | (TODO) -- GDC | miR__geneExp | |
| TCGA-A2-A0EO-01A-11R-A035-13 | (TODO) -- GDC | miR__isoformExp | |
| TCGA-A2-A0EP-01A-52R-A22V-13 | (TODO) -- GDC | miR__geneExp | |
| TCGA-A2-A0EP-01A-52R-A22V-13 | (TODO) -- GDC | miR__isoformExp | |
| TCGA-A2-A0EQ-01A-11R-A035-13 | (TODO) -- GDC | miR__geneExp | |
| TCGA-A2-A0EQ-01A-11R-A035-13 | (TODO) -- GDC | miR__isoformExp | |
| TCGA-A2-A0ER-01A-21R-A035-13 | (TODO) -- GDC | miR__geneExp | |
| TCGA-A2-A0ER-01A-21R-A035-13 | (TODO) -- GDC | miR__isoformExp | |
| TCGA-A2-A0ES-01A-11R-A114-13 | (TODO) -- GDC | miR__geneExp | |
| TCGA-A2-A0ES-01A-11R-A114-13 | (TODO) -- GDC | miR__isoformExp | |
| TCGA-A2-A0ET-01A-31R-A035-13 | (TODO) -- GDC | miR__geneExp | |
| TCGA-A2-A0ET-01A-31R-A035-13 | (TODO) -- GDC | miR__isoformExp | |
| TCGA-A2-A0EU-01A-22R-A057-13 | (TODO) -- GDC | miR__geneExp | |
| TCGA-A2-A0EU-01A-22R-A057-13 | (TODO) -- GDC | miR__isoformExp | |
| TCGA-A2-A0EV-01A-11R-A035-13 | (TODO) -- GDC | miR__geneExp | |
| TCGA-A2-A0EV-01A-11R-A035-13 | (TODO) -- GDC | miR__isoformExp | |
| TCGA-A2-A0EW-01A-21R-A114-13 | (TODO) -- GDC | miR__geneExp | |
| TCGA-A2-A0EW-01A-21R-A114-13 | (TODO) -- GDC | miR__isoformExp | |
| TCGA-A2-A0EX-01A-21R-A035-13 | (TODO) -- GDC | miR__geneExp | |
| TCGA-A2-A0EX-01A-21R-A035-13 | (TODO) -- GDC | miR__isoformExp | |
| TCGA-A2-A0EY-01A-11R-A035-13 | (TODO) -- GDC | miR__geneExp | |
| TCGA-A2-A0EY-01A-11R-A035-13 | (TODO) -- GDC | miR__isoformExp | |
| TCGA-A2-A0ST-01A-12R-A085-13 | (TODO) -- GDC | miR__geneExp | |
| TCGA-A2-A0ST-01A-12R-A085-13 | (TODO) -- GDC | miR__isoformExp | |
| TCGA-A2-A0SU-01A-11R-A085-13 | (TODO) -- GDC | miR__geneExp | |
| TCGA-A2-A0SU-01A-11R-A085-13 | (TODO) -- GDC | miR__isoformExp | |
| TCGA-A2-A0SV-01A-11R-A085-13 | (TODO) -- GDC | miR__geneExp | |
| TCGA-A2-A0SV-01A-11R-A085-13 | (TODO) -- GDC | miR__isoformExp | |
| TCGA-A2-A0SW-01A-11R-A085-13 | (TODO) -- GDC | miR__geneExp | |
| TCGA-A2-A0SW-01A-11R-A085-13 | (TODO) -- GDC | miR__isoformExp | |
| TCGA-A2-A0SX-01A-12R-A085-13 | (TODO) -- GDC | miR__geneExp | |
| TCGA-A2-A0SX-01A-12R-A085-13 | (TODO) -- GDC | miR__isoformExp | |
| TCGA-A2-A0SY-01A-31R-A085-13 | (TODO) -- GDC | miR__geneExp | |
| TCGA-A2-A0SY-01A-31R-A085-13 | (TODO) -- GDC | miR__isoformExp | |
| TCGA-A2-A0T0-01A-22R-A085-13 | (TODO) -- GDC | miR__geneExp | |
| TCGA-A2-A0T0-01A-22R-A085-13 | (TODO) -- GDC | miR__isoformExp | |
| TCGA-A2-A0T1-01A-21R-A085-13 | (TODO) -- GDC | miR__geneExp | |
| TCGA-A2-A0T1-01A-21R-A085-13 | (TODO) -- GDC | miR__isoformExp | |
| TCGA-A2-A0T2-01A-11R-A085-13 | (TODO) -- GDC | miR__geneExp | |
| TCGA-A2-A0T2-01A-11R-A085-13 | (TODO) -- GDC | miR__isoformExp | |
| TCGA-A2-A0T3-01A-21R-A114-13 | (TODO) -- GDC | miR__geneExp | |
| TCGA-A2-A0T3-01A-21R-A114-13 | (TODO) -- GDC | miR__isoformExp | |
| TCGA-A2-A0T4-01A-31R-A085-13 | (TODO) -- GDC | miR__geneExp | |
| TCGA-A2-A0T4-01A-31R-A085-13 | (TODO) -- GDC | miR__isoformExp | |
| TCGA-A2-A0T5-01A-21R-A085-13 | (TODO) -- GDC | miR__geneExp | |
| TCGA-A2-A0T5-01A-21R-A085-13 | (TODO) -- GDC | miR__isoformExp | |
| TCGA-A2-A0T6-01A-11R-A085-13 | (TODO) -- GDC | miR__geneExp | |
| TCGA-A2-A0T6-01A-11R-A085-13 | (TODO) -- GDC | miR__isoformExp | |
| TCGA-A2-A0T7-01A-21R-A085-13 | (TODO) -- GDC | miR__geneExp | |
| TCGA-A2-A0T7-01A-21R-A085-13 | (TODO) -- GDC | miR__isoformExp | |
| TCGA-A2-A0YC-01A-11R-A108-13 | (TODO) -- GDC | miR__geneExp | |
| TCGA-A2-A0YC-01A-11R-A108-13 | (TODO) -- GDC | miR__isoformExp | |
| TCGA-A2-A0YD-01A-11R-A108-13 | (TODO) -- GDC | miR__geneExp | |
| TCGA-A2-A0YD-01A-11R-A108-13 | (TODO) -- GDC | miR__isoformExp | |
| TCGA-A2-A0YF-01A-21R-A108-13 | (TODO) -- GDC | miR__geneExp | |
| TCGA-A2-A0YF-01A-21R-A108-13 | (TODO) -- GDC | miR__isoformExp | |
| TCGA-A2-A0YG-01A-21R-A108-13 | (TODO) -- GDC | miR__geneExp | |
| TCGA-A2-A0YG-01A-21R-A108-13 | (TODO) -- GDC | miR__isoformExp | |
| TCGA-A2-A0YH-01A-11R-A108-13 | (TODO) -- GDC | miR__geneExp | |
| TCGA-A2-A0YH-01A-11R-A108-13 | (TODO) -- GDC | miR__isoformExp | |
| TCGA-A2-A0YI-01A-31R-A10I-13 | (TODO) -- GDC | miR__geneExp | |
| TCGA-A2-A0YI-01A-31R-A10I-13 | (TODO) -- GDC | miR__isoformExp | |
| TCGA-A2-A0YK-01A-22R-A108-13 | (TODO) -- GDC | miR__geneExp | |
| TCGA-A2-A0YK-01A-22R-A108-13 | (TODO) -- GDC | miR__isoformExp | |
| TCGA-A2-A0YL-01A-21R-A108-13 | (TODO) -- GDC | miR__geneExp | |
| TCGA-A2-A0YL-01A-21R-A108-13 | (TODO) -- GDC | miR__isoformExp | |
| TCGA-A2-A0YM-01A-11R-A108-13 | (TODO) -- GDC | miR__geneExp | |
| TCGA-A2-A0YM-01A-11R-A108-13 | (TODO) -- GDC | miR__isoformExp | |
| TCGA-A2-A0YT-01A-11R-A108-13 | (TODO) -- GDC | miR__geneExp | |
| TCGA-A2-A0YT-01A-11R-A108-13 | (TODO) -- GDC | miR__isoformExp | |
| TCGA-A2-A1FV-01A-11R-A13P-13 | (TODO) -- GDC | miR__geneExp | |
| TCGA-A2-A1FV-01A-11R-A13P-13 | (TODO) -- GDC | miR__isoformExp | |
| TCGA-A2-A1FW-01A-11R-A13P-13 | (TODO) -- GDC | miR__geneExp | |
| TCGA-A2-A1FW-01A-11R-A13P-13 | (TODO) -- GDC | miR__isoformExp | |
| TCGA-A2-A1FX-01A-11R-A13P-13 | (TODO) -- GDC | miR__geneExp | |
| TCGA-A2-A1FX-01A-11R-A13P-13 | (TODO) -- GDC | miR__isoformExp | |
| TCGA-A2-A1FZ-01A-51R-A14C-13 | (TODO) -- GDC | miR__geneExp | |
| TCGA-A2-A1FZ-01A-51R-A14C-13 | (TODO) -- GDC | miR__isoformExp | |
| TCGA-A2-A1G0-01A-11R-A13P-13 | (TODO) -- GDC | miR__geneExp | |
| TCGA-A2-A1G0-01A-11R-A13P-13 | (TODO) -- GDC | miR__isoformExp | |
| TCGA-A2-A1G1-01A-21R-A13P-13 | (TODO) -- GDC | miR__geneExp | |
| TCGA-A2-A1G1-01A-21R-A13P-13 | (TODO) -- GDC | miR__isoformExp | |
| TCGA-A2-A1G4-01A-11R-A13P-13 | (TODO) -- GDC | miR__geneExp | |
| TCGA-A2-A1G4-01A-11R-A13P-13 | (TODO) -- GDC | miR__isoformExp | |
| TCGA-A2-A1G6-01A-11R-A13P-13 | (TODO) -- GDC | miR__geneExp | |
| TCGA-A2-A1G6-01A-11R-A13P-13 | (TODO) -- GDC | miR__isoformExp | |
| TCGA-A2-A259-01A-11R-A16E-13 | (TODO) -- GDC | miR__geneExp | |
| TCGA-A2-A259-01A-11R-A16E-13 | (TODO) -- GDC | miR__isoformExp | |
| TCGA-A2-A25A-01A-12R-A16E-13 | (TODO) -- GDC | miR__geneExp | |
| TCGA-A2-A25A-01A-12R-A16E-13 | (TODO) -- GDC | miR__isoformExp | |
| TCGA-A2-A25B-01A-11R-A168-13 | (TODO) -- GDC | miR__geneExp | |
| TCGA-A2-A25B-01A-11R-A168-13 | (TODO) -- GDC | miR__isoformExp | |
| TCGA-A2-A25C-01A-11R-A168-13 | (TODO) -- GDC | miR__geneExp | |
| TCGA-A2-A25C-01A-11R-A168-13 | (TODO) -- GDC | miR__isoformExp | |
| TCGA-A2-A25D-01A-12R-A16E-13 | (TODO) -- GDC | miR__geneExp | |
| TCGA-A2-A25D-01A-12R-A16E-13 | (TODO) -- GDC | miR__isoformExp | |
| TCGA-A2-A25E-01A-11R-A168-13 | (TODO) -- GDC | miR__geneExp | |
| TCGA-A2-A25E-01A-11R-A168-13 | (TODO) -- GDC | miR__isoformExp | |
| TCGA-A2-A25F-01A-11R-A168-13 | (TODO) -- GDC | miR__geneExp | |
| TCGA-A2-A25F-01A-11R-A168-13 | (TODO) -- GDC | miR__isoformExp | |
| TCGA-A2-A3KC-01A-11R-A214-13 | (TODO) -- GDC | miR__geneExp | |
| TCGA-A2-A3KC-01A-11R-A214-13 | (TODO) -- GDC | miR__isoformExp | |
| TCGA-A2-A3KD-01A-12R-A214-13 | (TODO) -- GDC | miR__geneExp | |
| TCGA-A2-A3KD-01A-12R-A214-13 | (TODO) -- GDC | miR__isoformExp | |
| TCGA-A2-A3XS-01A-11R-A22V-13 | (TODO) -- GDC | miR__geneExp | |
| TCGA-A2-A3XS-01A-11R-A22V-13 | (TODO) -- GDC | miR__isoformExp | |
| TCGA-A2-A3XT-01A-11R-A22V-13 | (TODO) -- GDC | miR__geneExp | |
| TCGA-A2-A3XT-01A-11R-A22V-13 | (TODO) -- GDC | miR__isoformExp | |
| TCGA-A2-A3XU-01A-12R-A22V-13 | (TODO) -- GDC | miR__geneExp | |
| TCGA-A2-A3XU-01A-12R-A22V-13 | (TODO) -- GDC | miR__isoformExp | |
| TCGA-A2-A3XV-01A-21R-A23A-13 | (TODO) -- GDC | miR__geneExp | |
| TCGA-A2-A3XV-01A-21R-A23A-13 | (TODO) -- GDC | miR__isoformExp | |
| TCGA-A2-A3XW-01A-11R-A23A-13 | (TODO) -- GDC | miR__geneExp | |
| TCGA-A2-A3XW-01A-11R-A23A-13 | (TODO) -- GDC | miR__isoformExp | |
| TCGA-A2-A3XX-01A-21R-A23A-13 | (TODO) -- GDC | miR__geneExp | |
| TCGA-A2-A3XX-01A-21R-A23A-13 | (TODO) -- GDC | miR__isoformExp | |
| TCGA-A2-A3XY-01A-11R-A23A-13 | (TODO) -- GDC | miR__geneExp | |
| TCGA-A2-A3XY-01A-11R-A23A-13 | (TODO) -- GDC | miR__isoformExp | |
| TCGA-A2-A3XZ-01A-42R-A23A-13 | (TODO) -- GDC | miR__geneExp | |
| TCGA-A2-A3XZ-01A-42R-A23A-13 | (TODO) -- GDC | miR__isoformExp | |
| TCGA-A2-A3Y0-01A-11R-A23A-13 | (TODO) -- GDC | miR__geneExp | |
| TCGA-A2-A3Y0-01A-11R-A23A-13 | (TODO) -- GDC | miR__isoformExp | |
| TCGA-A2-A4RW-01A-21R-A25Z-13 | (TODO) -- GDC | miR__geneExp | |
| TCGA-A2-A4RW-01A-21R-A25Z-13 | (TODO) -- GDC | miR__isoformExp | |
| TCGA-A2-A4RX-01A-11R-A25Z-13 | (TODO) -- GDC | miR__geneExp | |
| TCGA-A2-A4RX-01A-11R-A25Z-13 | (TODO) -- GDC | miR__isoformExp | |
| TCGA-A2-A4RY-01A-31R-A25Z-13 | (TODO) -- GDC | miR__geneExp | |
| TCGA-A2-A4RY-01A-31R-A25Z-13 | (TODO) -- GDC | miR__isoformExp | |
| TCGA-A2-A4S0-01A-21R-A25Z-13 | (TODO) -- GDC | miR__geneExp | |
| TCGA-A2-A4S0-01A-21R-A25Z-13 | (TODO) -- GDC | miR__isoformExp | |
| TCGA-A2-A4S1-01A-21R-A25Z-13 | (TODO) -- GDC | miR__geneExp | |
| TCGA-A2-A4S1-01A-21R-A25Z-13 | (TODO) -- GDC | miR__isoformExp | |
| TCGA-A2-A4S2-01A-12R-A25Z-13 | (TODO) -- GDC | miR__geneExp | |
| TCGA-A2-A4S2-01A-12R-A25Z-13 | (TODO) -- GDC | miR__isoformExp | |
| TCGA-A2-A4S3-01A-21R-A25Z-13 | (TODO) -- GDC | miR__geneExp | |
| TCGA-A2-A4S3-01A-21R-A25Z-13 | (TODO) -- GDC | miR__isoformExp | |
| TCGA-A7-A0CD-01A-11R-A010-13 | (TODO) -- GDC | miR__geneExp | |
| TCGA-A7-A0CD-01A-11R-A010-13 | (TODO) -- GDC | miR__isoformExp | |
| TCGA-A7-A0CE-01A-11R-A010-13 | (TODO) -- GDC | miR__geneExp | |
| TCGA-A7-A0CE-01A-11R-A010-13 | (TODO) -- GDC | miR__isoformExp | |
| TCGA-A7-A0CG-01A-11R-A038-13 | (TODO) -- GDC | miR__geneExp | |
| TCGA-A7-A0CG-01A-11R-A038-13 | (TODO) -- GDC | miR__isoformExp | |
| TCGA-A7-A0CH-01A-21R-A038-13 | (TODO) -- GDC | miR__geneExp | |
| TCGA-A7-A0CH-01A-21R-A038-13 | (TODO) -- GDC | miR__isoformExp | |
| TCGA-A7-A0CJ-01A-21R-A010-13 | (TODO) -- GDC | miR__geneExp | |
| TCGA-A7-A0CJ-01A-21R-A010-13 | (TODO) -- GDC | miR__isoformExp | |
| TCGA-A7-A0D9-01A-31R-A057-13 | (TODO) -- GDC | miR__geneExp | |
| TCGA-A7-A0D9-01A-31R-A057-13 | (TODO) -- GDC | miR__isoformExp | |
| TCGA-A7-A0DA-01A-31R-A114-13 | (TODO) -- GDC | miR__geneExp | |
| TCGA-A7-A0DA-01A-31R-A114-13 | (TODO) -- GDC | miR__isoformExp | |
| TCGA-A7-A0DB-01A-11R-A010-13 | (TODO) -- GDC | miR__geneExp | |
| TCGA-A7-A0DB-01A-11R-A010-13 | (TODO) -- GDC | miR__isoformExp | |
| TCGA-A7-A0DB-01A-11R-A27D-13 | (TODO) -- GDC | miR__geneExp | |
| TCGA-A7-A0DB-01A-11R-A27D-13 | (TODO) -- GDC | miR__isoformExp | |
| TCGA-A7-A0DC-01A-11R-A010-13 | (TODO) -- GDC | miR__geneExp | |
| TCGA-A7-A0DC-01A-11R-A010-13 | (TODO) -- GDC | miR__isoformExp | |
| TCGA-A7-A13D-01A-13R-A12O-13 | (TODO) -- GDC | miR__geneExp | |
| TCGA-A7-A13D-01A-13R-A12O-13 | (TODO) -- GDC | miR__isoformExp | |
| TCGA-A7-A13D-01A-13R-A27D-13 | (TODO) -- GDC | miR__geneExp | |
| TCGA-A7-A13D-01A-13R-A27D-13 | (TODO) -- GDC | miR__isoformExp | |
| TCGA-A7-A13E-01A-11R-A12O-13 | (TODO) -- GDC | miR__geneExp | |
| TCGA-A7-A13E-01A-11R-A12O-13 | (TODO) -- GDC | miR__isoformExp | |
| TCGA-A7-A13E-01A-11R-A27D-13 | (TODO) -- GDC | miR__geneExp | |
| TCGA-A7-A13E-01A-11R-A27D-13 | (TODO) -- GDC | miR__isoformExp | |
| TCGA-A7-A13F-01A-11R-A12O-13 | (TODO) -- GDC | miR__geneExp | |
| TCGA-A7-A13F-01A-11R-A12O-13 | (TODO) -- GDC | miR__isoformExp | |
| TCGA-A7-A13G-01A-11R-A13P-13 | (TODO) -- GDC | miR__geneExp | |
| TCGA-A7-A13G-01A-11R-A13P-13 | (TODO) -- GDC | miR__isoformExp | |
| TCGA-A7-A13H-01A-11R-A22I-13 | (TODO) -- GDC | miR__geneExp | |
| TCGA-A7-A13H-01A-11R-A22I-13 | (TODO) -- GDC | miR__isoformExp | |
| TCGA-A7-A26E-01A-11R-A168-13 | (TODO) -- GDC | miR__geneExp | |
| TCGA-A7-A26E-01A-11R-A168-13 | (TODO) -- GDC | miR__isoformExp | |
| TCGA-A7-A26E-01A-11R-A27D-13 | (TODO) -- GDC | miR__geneExp | |
| TCGA-A7-A26E-01A-11R-A27D-13 | (TODO) -- GDC | miR__isoformExp | |
| TCGA-A7-A26F-01A-21R-A168-13 | (TODO) -- GDC | miR__geneExp | |
| TCGA-A7-A26F-01A-21R-A168-13 | (TODO) -- GDC | miR__isoformExp | |
| TCGA-A7-A26G-01A-21R-A168-13 | (TODO) -- GDC | miR__geneExp | |
| TCGA-A7-A26G-01A-21R-A168-13 | (TODO) -- GDC | miR__isoformExp | |
| TCGA-A7-A26H-01A-11R-A168-13 | (TODO) -- GDC | miR__geneExp | |
| TCGA-A7-A26H-01A-11R-A168-13 | (TODO) -- GDC | miR__isoformExp | |
| TCGA-A7-A26I-01A-11R-A168-13 | (TODO) -- GDC | miR__geneExp | |
| TCGA-A7-A26I-01A-11R-A168-13 | (TODO) -- GDC | miR__isoformExp | |
| TCGA-A7-A26J-01A-11R-A168-13 | (TODO) -- GDC | miR__geneExp | |
| TCGA-A7-A26J-01A-11R-A168-13 | (TODO) -- GDC | miR__isoformExp | |
| TCGA-A7-A26J-01A-11R-A27D-13 | (TODO) -- GDC | miR__geneExp | |
| TCGA-A7-A26J-01A-11R-A27D-13 | (TODO) -- GDC | miR__isoformExp | |
| TCGA-A7-A2KD-01A-31R-A21U-13 | (TODO) -- GDC | miR__geneExp | |
| TCGA-A7-A2KD-01A-31R-A21U-13 | (TODO) -- GDC | miR__isoformExp | |
| TCGA-A7-A3IY-01A-21R-A21U-13 | (TODO) -- GDC | miR__geneExp | |
| TCGA-A7-A3IY-01A-21R-A21U-13 | (TODO) -- GDC | miR__isoformExp | |
| TCGA-A7-A3IZ-01A-11R-A214-13 | (TODO) -- GDC | miR__geneExp | |
| TCGA-A7-A3IZ-01A-11R-A214-13 | (TODO) -- GDC | miR__isoformExp | |
| TCGA-A7-A3J0-01A-11R-A214-13 | (TODO) -- GDC | miR__geneExp | |
| TCGA-A7-A3J0-01A-11R-A214-13 | (TODO) -- GDC | miR__isoformExp | |
| TCGA-A7-A3J1-01A-11R-A214-13 | (TODO) -- GDC | miR__geneExp | |
| TCGA-A7-A3J1-01A-11R-A214-13 | (TODO) -- GDC | miR__isoformExp | |
| TCGA-A7-A3RF-01A-11R-A22I-13 | (TODO) -- GDC | miR__geneExp | |
| TCGA-A7-A3RF-01A-11R-A22I-13 | (TODO) -- GDC | miR__isoformExp | |
| TCGA-A7-A425-01A-11R-A24J-13 | (TODO) -- GDC | miR__geneExp | |
| TCGA-A7-A425-01A-11R-A24J-13 | (TODO) -- GDC | miR__isoformExp | |
| TCGA-A7-A426-01A-22R-A24J-13 | (TODO) -- GDC | miR__geneExp | |
| TCGA-A7-A426-01A-22R-A24J-13 | (TODO) -- GDC | miR__isoformExp | |
| TCGA-A7-A4SA-01A-11R-A25Z-13 | (TODO) -- GDC | miR__geneExp | |
| TCGA-A7-A4SA-01A-11R-A25Z-13 | (TODO) -- GDC | miR__isoformExp | |
| TCGA-A7-A4SB-01A-21R-A25Z-13 | (TODO) -- GDC | miR__geneExp | |
| TCGA-A7-A4SB-01A-21R-A25Z-13 | (TODO) -- GDC | miR__isoformExp | |
| TCGA-A7-A4SC-01A-12R-A25Z-13 | (TODO) -- GDC | miR__geneExp | |
| TCGA-A7-A4SC-01A-12R-A25Z-13 | (TODO) -- GDC | miR__isoformExp | |
| TCGA-A7-A4SD-01A-11R-A25Z-13 | (TODO) -- GDC | miR__geneExp | |
| TCGA-A7-A4SD-01A-11R-A25Z-13 | (TODO) -- GDC | miR__isoformExp | |
| TCGA-A7-A4SE-01A-11R-A25Z-13 | (TODO) -- GDC | miR__geneExp | |
| TCGA-A7-A4SE-01A-11R-A25Z-13 | (TODO) -- GDC | miR__isoformExp | |
| TCGA-A7-A4SF-01A-11R-A25Z-13 | (TODO) -- GDC | miR__geneExp | |
| TCGA-A7-A4SF-01A-11R-A25Z-13 | (TODO) -- GDC | miR__isoformExp | |
| TCGA-A7-A56D-01A-11R-A27U-13 | (TODO) -- GDC | miR__geneExp | |
| TCGA-A7-A56D-01A-11R-A27U-13 | (TODO) -- GDC | miR__isoformExp | |
| TCGA-A7-A5ZV-01A-11R-A28I-13 | (TODO) -- GDC | miR__geneExp | |
| TCGA-A7-A5ZV-01A-11R-A28I-13 | (TODO) -- GDC | miR__isoformExp | |
| TCGA-A7-A5ZW-01A-12R-A29V-13 | (TODO) -- GDC | miR__geneExp | |
| TCGA-A7-A5ZW-01A-12R-A29V-13 | (TODO) -- GDC | miR__isoformExp | |
| TCGA-A7-A5ZX-01A-12R-A29V-13 | (TODO) -- GDC | miR__geneExp | |
| TCGA-A7-A5ZX-01A-12R-A29V-13 | (TODO) -- GDC | miR__isoformExp | |
| TCGA-A7-A6VV-01A-22R-A33A-13 | (TODO) -- GDC | miR__geneExp | |
| TCGA-A7-A6VV-01A-22R-A33A-13 | (TODO) -- GDC | miR__isoformExp | |
| TCGA-A7-A6VW-01A-21R-A33A-13 | (TODO) -- GDC | miR__geneExp | |
| TCGA-A7-A6VW-01A-21R-A33A-13 | (TODO) -- GDC | miR__isoformExp | |
| TCGA-A7-A6VX-01A-12R-A33A-13 | (TODO) -- GDC | miR__geneExp | |
| TCGA-A7-A6VX-01A-12R-A33A-13 | (TODO) -- GDC | miR__isoformExp | |
| TCGA-A7-A6VY-01A-12R-A33A-13 | (TODO) -- GDC | miR__geneExp | |
| TCGA-A7-A6VY-01A-12R-A33A-13 | (TODO) -- GDC | miR__isoformExp | |
| TCGA-A8-A06N-01A-11R-A010-13 | (TODO) -- GDC | miR__geneExp | |
| TCGA-A8-A06N-01A-11R-A010-13 | (TODO) -- GDC | miR__isoformExp | |
| TCGA-A8-A06O-01A-11R-A010-13 | (TODO) -- GDC | miR__geneExp | |
| TCGA-A8-A06O-01A-11R-A010-13 | (TODO) -- GDC | miR__isoformExp | |
| TCGA-A8-A06P-01A-11R-A010-13 | (TODO) -- GDC | miR__geneExp | |
| TCGA-A8-A06P-01A-11R-A010-13 | (TODO) -- GDC | miR__isoformExp | |
| TCGA-A8-A06Q-01A-11R-A035-13 | (TODO) -- GDC | miR__geneExp | |
| TCGA-A8-A06Q-01A-11R-A035-13 | (TODO) -- GDC | miR__isoformExp | |
| TCGA-A8-A06R-01A-11R-A010-13 | (TODO) -- GDC | miR__geneExp | |
| TCGA-A8-A06R-01A-11R-A010-13 | (TODO) -- GDC | miR__isoformExp | |
| TCGA-A8-A06T-01A-11R-A010-13 | (TODO) -- GDC | miR__geneExp | |
| TCGA-A8-A06T-01A-11R-A010-13 | (TODO) -- GDC | miR__isoformExp | |
| TCGA-A8-A06U-01A-11R-A010-13 | (TODO) -- GDC | miR__geneExp | |
| TCGA-A8-A06U-01A-11R-A010-13 | (TODO) -- GDC | miR__isoformExp | |
| TCGA-A8-A06Y-01A-21R-A010-13 | (TODO) -- GDC | miR__geneExp | |
| TCGA-A8-A06Y-01A-21R-A010-13 | (TODO) -- GDC | miR__isoformExp | |
| TCGA-A8-A06Z-01A-11R-A010-13 | (TODO) -- GDC | miR__geneExp | |
| TCGA-A8-A06Z-01A-11R-A010-13 | (TODO) -- GDC | miR__isoformExp | |
| TCGA-A8-A075-01A-11R-A085-13 | (TODO) -- GDC | miR__geneExp | |
| TCGA-A8-A075-01A-11R-A085-13 | (TODO) -- GDC | miR__isoformExp | |
| TCGA-A8-A076-01A-21R-A010-13 | (TODO) -- GDC | miR__geneExp | |
| TCGA-A8-A076-01A-21R-A010-13 | (TODO) -- GDC | miR__isoformExp | |
| TCGA-A8-A079-01A-21R-A010-13 | (TODO) -- GDC | miR__geneExp | |
| TCGA-A8-A079-01A-21R-A010-13 | (TODO) -- GDC | miR__isoformExp | |
| TCGA-A8-A07B-01A-11R-A010-13 | (TODO) -- GDC | miR__geneExp | |
| TCGA-A8-A07B-01A-11R-A010-13 | (TODO) -- GDC | miR__isoformExp | |
| TCGA-A8-A07C-01A-11R-A035-13 | (TODO) -- GDC | miR__geneExp | |
| TCGA-A8-A07C-01A-11R-A035-13 | (TODO) -- GDC | miR__isoformExp | |
| TCGA-A8-A07E-01A-11R-A035-13 | (TODO) -- GDC | miR__geneExp | |
| TCGA-A8-A07E-01A-11R-A035-13 | (TODO) -- GDC | miR__isoformExp | |
| TCGA-A8-A07F-01A-11R-A038-13 | (TODO) -- GDC | miR__geneExp | |
| TCGA-A8-A07F-01A-11R-A038-13 | (TODO) -- GDC | miR__isoformExp | |
| TCGA-A8-A07G-01A-11R-A035-13 | (TODO) -- GDC | miR__geneExp | |
| TCGA-A8-A07G-01A-11R-A035-13 | (TODO) -- GDC | miR__isoformExp | |
| TCGA-A8-A07I-01A-11R-A010-13 | (TODO) -- GDC | miR__geneExp | |
| TCGA-A8-A07I-01A-11R-A010-13 | (TODO) -- GDC | miR__isoformExp | |
| TCGA-A8-A07J-01A-21R-A057-13 | (TODO) -- GDC | miR__geneExp | |
| TCGA-A8-A07J-01A-21R-A057-13 | (TODO) -- GDC | miR__isoformExp | |
| TCGA-A8-A07L-01A-11R-A010-13 | (TODO) -- GDC | miR__geneExp | |
| TCGA-A8-A07L-01A-11R-A010-13 | (TODO) -- GDC | miR__isoformExp | |
| TCGA-A8-A07O-01A-11R-A038-13 | (TODO) -- GDC | miR__geneExp | |
| TCGA-A8-A07O-01A-11R-A038-13 | (TODO) -- GDC | miR__isoformExp | |
| TCGA-A8-A07P-01A-11R-A010-13 | (TODO) -- GDC | miR__geneExp | |
| TCGA-A8-A07P-01A-11R-A010-13 | (TODO) -- GDC | miR__isoformExp | |
| TCGA-A8-A07R-01A-21R-A035-13 | (TODO) -- GDC | miR__geneExp | |
| TCGA-A8-A07R-01A-21R-A035-13 | (TODO) -- GDC | miR__isoformExp | |
| TCGA-A8-A07S-01A-11R-A035-13 | (TODO) -- GDC | miR__geneExp | |
| TCGA-A8-A07S-01A-11R-A035-13 | (TODO) -- GDC | miR__isoformExp | |
| TCGA-A8-A07U-01A-11R-A035-13 | (TODO) -- GDC | miR__geneExp | |
| TCGA-A8-A07U-01A-11R-A035-13 | (TODO) -- GDC | miR__isoformExp | |
| TCGA-A8-A07W-01A-11R-A010-13 | (TODO) -- GDC | miR__geneExp | |
| TCGA-A8-A07W-01A-11R-A010-13 | (TODO) -- GDC | miR__isoformExp | |
| TCGA-A8-A07Z-01A-11R-A010-13 | (TODO) -- GDC | miR__geneExp | |
| TCGA-A8-A07Z-01A-11R-A010-13 | (TODO) -- GDC | miR__isoformExp | |
| TCGA-A8-A081-01A-11R-A010-13 | (TODO) -- GDC | miR__geneExp | |
| TCGA-A8-A081-01A-11R-A010-13 | (TODO) -- GDC | miR__isoformExp | |
| TCGA-A8-A082-01A-11R-A010-13 | (TODO) -- GDC | miR__geneExp | |
| TCGA-A8-A082-01A-11R-A010-13 | (TODO) -- GDC | miR__isoformExp | |
| TCGA-A8-A083-01A-21R-A010-13 | (TODO) -- GDC | miR__geneExp | |
| TCGA-A8-A083-01A-21R-A010-13 | (TODO) -- GDC | miR__isoformExp | |
| TCGA-A8-A084-01A-21R-A010-13 | (TODO) -- GDC | miR__geneExp | |
| TCGA-A8-A084-01A-21R-A010-13 | (TODO) -- GDC | miR__isoformExp | |
| TCGA-A8-A085-01A-11R-A010-13 | (TODO) -- GDC | miR__geneExp | |
| TCGA-A8-A085-01A-11R-A010-13 | (TODO) -- GDC | miR__isoformExp | |
| TCGA-A8-A086-01A-11R-A010-13 | (TODO) -- GDC | miR__geneExp | |
| TCGA-A8-A086-01A-11R-A010-13 | (TODO) -- GDC | miR__isoformExp | |
| TCGA-A8-A08A-01A-11R-A010-13 | (TODO) -- GDC | miR__geneExp | |
| TCGA-A8-A08A-01A-11R-A010-13 | (TODO) -- GDC | miR__isoformExp | |
| TCGA-A8-A08B-01A-11R-A010-13 | (TODO) -- GDC | miR__geneExp | |
| TCGA-A8-A08B-01A-11R-A010-13 | (TODO) -- GDC | miR__isoformExp | |
| TCGA-A8-A08G-01A-11R-A010-13 | (TODO) -- GDC | miR__geneExp | |
| TCGA-A8-A08G-01A-11R-A010-13 | (TODO) -- GDC | miR__isoformExp | |
| TCGA-A8-A08H-01A-21R-A010-13 | (TODO) -- GDC | miR__geneExp | |
| TCGA-A8-A08H-01A-21R-A010-13 | (TODO) -- GDC | miR__isoformExp | |
| TCGA-A8-A08I-01A-11R-A010-13 | (TODO) -- GDC | miR__geneExp | |
| TCGA-A8-A08I-01A-11R-A010-13 | (TODO) -- GDC | miR__isoformExp | |
| TCGA-A8-A08J-01A-11R-A010-13 | (TODO) -- GDC | miR__geneExp | |
| TCGA-A8-A08J-01A-11R-A010-13 | (TODO) -- GDC | miR__isoformExp | |
| TCGA-A8-A08L-01A-11R-A010-13 | (TODO) -- GDC | miR__geneExp | |
| TCGA-A8-A08L-01A-11R-A010-13 | (TODO) -- GDC | miR__isoformExp | |
| TCGA-A8-A08O-01A-21R-A057-13 | (TODO) -- GDC | miR__geneExp | |
| TCGA-A8-A08O-01A-21R-A057-13 | (TODO) -- GDC | miR__isoformExp | |
| TCGA-A8-A08R-01A-11R-A035-13 | (TODO) -- GDC | miR__geneExp | |
| TCGA-A8-A08R-01A-11R-A035-13 | (TODO) -- GDC | miR__isoformExp | |
| TCGA-A8-A08S-01A-11R-A035-13 | (TODO) -- GDC | miR__geneExp | |
| TCGA-A8-A08S-01A-11R-A035-13 | (TODO) -- GDC | miR__isoformExp | |
| TCGA-A8-A08T-01A-21R-A010-13 | (TODO) -- GDC | miR__geneExp | |
| TCGA-A8-A08T-01A-21R-A010-13 | (TODO) -- GDC | miR__isoformExp | |
| TCGA-A8-A08X-01A-21R-A010-13 | (TODO) -- GDC | miR__geneExp | |
| TCGA-A8-A08X-01A-21R-A010-13 | (TODO) -- GDC | miR__isoformExp | |
| TCGA-A8-A08Z-01A-21R-A010-13 | (TODO) -- GDC | miR__geneExp | |
| TCGA-A8-A08Z-01A-21R-A010-13 | (TODO) -- GDC | miR__isoformExp | |
| TCGA-A8-A090-01A-11R-A010-13 | (TODO) -- GDC | miR__geneExp | |
| TCGA-A8-A090-01A-11R-A010-13 | (TODO) -- GDC | miR__isoformExp | |
| TCGA-A8-A091-01A-11R-A010-13 | (TODO) -- GDC | miR__geneExp | |
| TCGA-A8-A091-01A-11R-A010-13 | (TODO) -- GDC | miR__isoformExp | |
| TCGA-A8-A092-01A-11R-A010-13 | (TODO) -- GDC | miR__geneExp | |
| TCGA-A8-A092-01A-11R-A010-13 | (TODO) -- GDC | miR__isoformExp | |
| TCGA-A8-A093-01A-11R-A010-13 | (TODO) -- GDC | miR__geneExp | |
| TCGA-A8-A093-01A-11R-A010-13 | (TODO) -- GDC | miR__isoformExp | |
| TCGA-A8-A094-01A-11R-A038-13 | (TODO) -- GDC | miR__geneExp | |
| TCGA-A8-A094-01A-11R-A038-13 | (TODO) -- GDC | miR__isoformExp | |
| TCGA-A8-A095-01A-11R-A010-13 | (TODO) -- GDC | miR__geneExp | |
| TCGA-A8-A095-01A-11R-A010-13 | (TODO) -- GDC | miR__isoformExp | |
| TCGA-A8-A096-01A-11R-A038-13 | (TODO) -- GDC | miR__geneExp | |
| TCGA-A8-A096-01A-11R-A038-13 | (TODO) -- GDC | miR__isoformExp | |
| TCGA-A8-A097-01A-11R-A035-13 | (TODO) -- GDC | miR__geneExp | |
| TCGA-A8-A097-01A-11R-A035-13 | (TODO) -- GDC | miR__isoformExp | |
| TCGA-A8-A099-01A-11R-A010-13 | (TODO) -- GDC | miR__geneExp | |
| TCGA-A8-A099-01A-11R-A010-13 | (TODO) -- GDC | miR__isoformExp | |
| TCGA-A8-A09A-01A-11R-A038-13 | (TODO) -- GDC | miR__geneExp | |
| TCGA-A8-A09A-01A-11R-A038-13 | (TODO) -- GDC | miR__isoformExp | |
| TCGA-A8-A09B-01A-11R-A010-13 | (TODO) -- GDC | miR__geneExp | |
| TCGA-A8-A09B-01A-11R-A010-13 | (TODO) -- GDC | miR__isoformExp | |
| TCGA-A8-A09C-01A-11R-A010-13 | (TODO) -- GDC | miR__geneExp | |
| TCGA-A8-A09C-01A-11R-A010-13 | (TODO) -- GDC | miR__isoformExp | |
| TCGA-A8-A09D-01A-11R-A010-13 | (TODO) -- GDC | miR__geneExp | |
| TCGA-A8-A09D-01A-11R-A010-13 | (TODO) -- GDC | miR__isoformExp | |
| TCGA-A8-A09E-01A-11R-A010-13 | (TODO) -- GDC | miR__geneExp | |
| TCGA-A8-A09E-01A-11R-A010-13 | (TODO) -- GDC | miR__isoformExp | |
| TCGA-A8-A09G-01A-21R-A010-13 | (TODO) -- GDC | miR__geneExp | |
| TCGA-A8-A09G-01A-21R-A010-13 | (TODO) -- GDC | miR__isoformExp | |
| TCGA-A8-A09I-01A-22R-A035-13 | (TODO) -- GDC | miR__geneExp | |
| TCGA-A8-A09I-01A-22R-A035-13 | (TODO) -- GDC | miR__isoformExp | |
| TCGA-A8-A09K-01A-11R-A010-13 | (TODO) -- GDC | miR__geneExp | |
| TCGA-A8-A09K-01A-11R-A010-13 | (TODO) -- GDC | miR__isoformExp | |
| TCGA-A8-A09M-01A-11R-A010-13 | (TODO) -- GDC | miR__geneExp | |
| TCGA-A8-A09M-01A-11R-A010-13 | (TODO) -- GDC | miR__isoformExp | |
| TCGA-A8-A09N-01A-11R-A010-13 | (TODO) -- GDC | miR__geneExp | |
| TCGA-A8-A09N-01A-11R-A010-13 | (TODO) -- GDC | miR__isoformExp | |
| TCGA-A8-A09Q-01A-11R-A010-13 | (TODO) -- GDC | miR__geneExp | |
| TCGA-A8-A09Q-01A-11R-A010-13 | (TODO) -- GDC | miR__isoformExp | |
| TCGA-A8-A09R-01A-11R-A010-13 | (TODO) -- GDC | miR__geneExp | |
| TCGA-A8-A09R-01A-11R-A010-13 | (TODO) -- GDC | miR__isoformExp | |
| TCGA-A8-A09T-01A-11R-A010-13 | (TODO) -- GDC | miR__geneExp | |
| TCGA-A8-A09T-01A-11R-A010-13 | (TODO) -- GDC | miR__isoformExp | |
| TCGA-A8-A09X-01A-11R-A010-13 | (TODO) -- GDC | miR__geneExp | |
| TCGA-A8-A09X-01A-11R-A010-13 | (TODO) -- GDC | miR__isoformExp | |
| TCGA-A8-A09Z-01A-11R-A010-13 | (TODO) -- GDC | miR__geneExp | |
| TCGA-A8-A09Z-01A-11R-A010-13 | (TODO) -- GDC | miR__isoformExp | |
| TCGA-A8-A0A1-01A-11R-A010-13 | (TODO) -- GDC | miR__geneExp | |
| TCGA-A8-A0A1-01A-11R-A010-13 | (TODO) -- GDC | miR__isoformExp | |
| TCGA-A8-A0A2-01A-11R-A035-13 | (TODO) -- GDC | miR__geneExp | |
| TCGA-A8-A0A2-01A-11R-A035-13 | (TODO) -- GDC | miR__isoformExp | |
| TCGA-A8-A0A4-01A-11R-A010-13 | (TODO) -- GDC | miR__geneExp | |
| TCGA-A8-A0A4-01A-11R-A010-13 | (TODO) -- GDC | miR__isoformExp | |
| TCGA-A8-A0A6-01A-12R-A057-13 | (TODO) -- GDC | miR__geneExp | |
| TCGA-A8-A0A6-01A-12R-A057-13 | (TODO) -- GDC | miR__isoformExp | |
| TCGA-A8-A0A7-01A-11R-A010-13 | (TODO) -- GDC | miR__geneExp | |
| TCGA-A8-A0A7-01A-11R-A010-13 | (TODO) -- GDC | miR__isoformExp | |
| TCGA-A8-A0A9-01A-11R-A010-13 | (TODO) -- GDC | miR__geneExp | |
| TCGA-A8-A0A9-01A-11R-A010-13 | (TODO) -- GDC | miR__isoformExp | |
| TCGA-A8-A0AB-01A-11R-A035-13 | (TODO) -- GDC | miR__geneExp | |
| TCGA-A8-A0AB-01A-11R-A035-13 | (TODO) -- GDC | miR__isoformExp | |
| TCGA-A8-A0AD-01A-11R-A057-13 | (TODO) -- GDC | miR__geneExp | |
| TCGA-A8-A0AD-01A-11R-A057-13 | (TODO) -- GDC | miR__isoformExp | |
| TCGA-AC-A23C-01A-12R-A168-13 | (TODO) -- GDC | miR__geneExp | |
| TCGA-AC-A23C-01A-12R-A168-13 | (TODO) -- GDC | miR__isoformExp | |
| TCGA-AC-A23E-01A-11R-A156-13 | (TODO) -- GDC | miR__geneExp | |
| TCGA-AC-A23E-01A-11R-A156-13 | (TODO) -- GDC | miR__isoformExp | |
| TCGA-AC-A23G-01A-11R-A214-13 | (TODO) -- GDC | miR__geneExp | |
| TCGA-AC-A23G-01A-11R-A214-13 | (TODO) -- GDC | miR__isoformExp | |
| TCGA-AC-A23H-01A-11R-A156-13 | (TODO) -- GDC | miR__geneExp | |
| TCGA-AC-A23H-01A-11R-A156-13 | (TODO) -- GDC | miR__isoformExp | |
| TCGA-AC-A2B8-01A-11R-A17A-13 | (TODO) -- GDC | miR__geneExp | |
| TCGA-AC-A2B8-01A-11R-A17A-13 | (TODO) -- GDC | miR__isoformExp | |
| TCGA-AC-A2BK-01A-11R-A21U-13 | (TODO) -- GDC | miR__geneExp | |
| TCGA-AC-A2BK-01A-11R-A21U-13 | (TODO) -- GDC | miR__isoformExp | |
| TCGA-AC-A2BM-01A-11R-A21U-13 | (TODO) -- GDC | miR__geneExp | |
| TCGA-AC-A2BM-01A-11R-A21U-13 | (TODO) -- GDC | miR__isoformExp | |
| TCGA-AC-A2FB-01A-11R-A17A-13 | (TODO) -- GDC | miR__geneExp | |
| TCGA-AC-A2FB-01A-11R-A17A-13 | (TODO) -- GDC | miR__isoformExp | |
| TCGA-AC-A2FE-01A-11R-A19V-13 | (TODO) -- GDC | miR__geneExp | |
| TCGA-AC-A2FE-01A-11R-A19V-13 | (TODO) -- GDC | miR__isoformExp | |
| TCGA-AC-A2FF-01A-11R-A17A-13 | (TODO) -- GDC | miR__geneExp | |
| TCGA-AC-A2FF-01A-11R-A17A-13 | (TODO) -- GDC | miR__isoformExp | |
| TCGA-AC-A2FG-01A-11R-A17A-13 | (TODO) -- GDC | miR__geneExp | |
| TCGA-AC-A2FG-01A-11R-A17A-13 | (TODO) -- GDC | miR__isoformExp | |
| TCGA-AC-A2FK-01A-12R-A17X-13 | (TODO) -- GDC | miR__geneExp | |
| TCGA-AC-A2FK-01A-12R-A17X-13 | (TODO) -- GDC | miR__isoformExp | |
| TCGA-AC-A2FM-01A-11R-A19V-13 | (TODO) -- GDC | miR__geneExp | |
| TCGA-AC-A2FM-01A-11R-A19V-13 | (TODO) -- GDC | miR__isoformExp | |
| TCGA-AC-A2FO-01A-11R-A17X-13 | (TODO) -- GDC | miR__geneExp | |
| TCGA-AC-A2FO-01A-11R-A17X-13 | (TODO) -- GDC | miR__isoformExp | |
| TCGA-AC-A2QH-01A-11R-A18L-13 | (TODO) -- GDC | miR__geneExp | |
| TCGA-AC-A2QH-01A-11R-A18L-13 | (TODO) -- GDC | miR__isoformExp | |
| TCGA-AC-A2QI-01A-12R-A19V-13 | (TODO) -- GDC | miR__geneExp | |
| TCGA-AC-A2QI-01A-12R-A19V-13 | (TODO) -- GDC | miR__isoformExp | |
| TCGA-AC-A2QJ-01A-12R-A19V-13 | (TODO) -- GDC | miR__geneExp | |
| TCGA-AC-A2QJ-01A-12R-A19V-13 | (TODO) -- GDC | miR__isoformExp | |
| TCGA-AC-A3BB-01A-21R-A19V-13 | (TODO) -- GDC | miR__geneExp | |
| TCGA-AC-A3BB-01A-21R-A19V-13 | (TODO) -- GDC | miR__isoformExp | |
| TCGA-AC-A3EH-01A-22R-A22I-13 | (TODO) -- GDC | miR__geneExp | |
| TCGA-AC-A3EH-01A-22R-A22I-13 | (TODO) -- GDC | miR__isoformExp | |
| TCGA-AC-A3HN-01A-11R-A214-13 | (TODO) -- GDC | miR__geneExp | |
| TCGA-AC-A3HN-01A-11R-A214-13 | (TODO) -- GDC | miR__isoformExp | |
| TCGA-AC-A3OD-01A-11R-A21U-13 | (TODO) -- GDC | miR__geneExp | |
| TCGA-AC-A3OD-01A-11R-A21U-13 | (TODO) -- GDC | miR__isoformExp | |
| TCGA-AC-A3QP-01A-11R-A22V-13 | (TODO) -- GDC | miR__geneExp | |
| TCGA-AC-A3QP-01A-11R-A22V-13 | (TODO) -- GDC | miR__isoformExp | |
| TCGA-AC-A3QQ-01A-11R-A22I-13 | (TODO) -- GDC | miR__geneExp | |
| TCGA-AC-A3QQ-01A-11R-A22I-13 | (TODO) -- GDC | miR__isoformExp | |
| TCGA-AC-A3TM-01A-11R-A22I-13 | (TODO) -- GDC | miR__geneExp | |
| TCGA-AC-A3TM-01A-11R-A22I-13 | (TODO) -- GDC | miR__isoformExp | |
| TCGA-AC-A3TN-01A-11R-A22I-13 | (TODO) -- GDC | miR__geneExp | |
| TCGA-AC-A3TN-01A-11R-A22I-13 | (TODO) -- GDC | miR__isoformExp | |
| TCGA-AC-A3W5-01A-11R-A22I-13 | (TODO) -- GDC | miR__geneExp | |
| TCGA-AC-A3W5-01A-11R-A22I-13 | (TODO) -- GDC | miR__isoformExp | |
| TCGA-AC-A3W6-01A-12R-A22I-13 | (TODO) -- GDC | miR__geneExp | |
| TCGA-AC-A3W6-01A-12R-A22I-13 | (TODO) -- GDC | miR__isoformExp | |
| TCGA-AC-A3W7-01A-11R-A22I-13 | (TODO) -- GDC | miR__geneExp | |
| TCGA-AC-A3W7-01A-11R-A22I-13 | (TODO) -- GDC | miR__isoformExp | |
| TCGA-AC-A3YI-01A-21R-A23A-13 | (TODO) -- GDC | miR__geneExp | |
| TCGA-AC-A3YI-01A-21R-A23A-13 | (TODO) -- GDC | miR__isoformExp | |
| TCGA-AC-A3YJ-01A-11R-A22V-13 | (TODO) -- GDC | miR__geneExp | |
| TCGA-AC-A3YJ-01A-11R-A22V-13 | (TODO) -- GDC | miR__isoformExp | |
| TCGA-AC-A4ZE-01A-11R-A41G-13 | (TODO) -- GDC | miR__geneExp | |
| TCGA-AC-A4ZE-01A-11R-A41G-13 | (TODO) -- GDC | miR__isoformExp | |
| TCGA-AC-A5EH-01A-11R-A28I-13 | (TODO) -- GDC | miR__geneExp | |
| TCGA-AC-A5EH-01A-11R-A28I-13 | (TODO) -- GDC | miR__isoformExp | |
| TCGA-AC-A5EI-01A-11R-A27U-13 | (TODO) -- GDC | miR__geneExp | |
| TCGA-AC-A5EI-01A-11R-A27U-13 | (TODO) -- GDC | miR__isoformExp | |
| TCGA-AC-A5XS-01A-11R-A29V-13 | (TODO) -- GDC | miR__geneExp | |
| TCGA-AC-A5XS-01A-11R-A29V-13 | (TODO) -- GDC | miR__isoformExp | |
| TCGA-AC-A5XU-01A-11R-A28I-13 | (TODO) -- GDC | miR__geneExp | |
| TCGA-AC-A5XU-01A-11R-A28I-13 | (TODO) -- GDC | miR__isoformExp | |
| TCGA-AC-A62V-01A-11R-A31S-13 | (TODO) -- GDC | miR__geneExp | |
| TCGA-AC-A62V-01A-11R-A31S-13 | (TODO) -- GDC | miR__isoformExp | |
| TCGA-AC-A62X-01A-11R-A29V-13 | (TODO) -- GDC | miR__geneExp | |
| TCGA-AC-A62X-01A-11R-A29V-13 | (TODO) -- GDC | miR__isoformExp | |
| TCGA-AC-A62Y-01A-11R-A29V-13 | (TODO) -- GDC | miR__geneExp | |
| TCGA-AC-A62Y-01A-11R-A29V-13 | (TODO) -- GDC | miR__isoformExp | |
| TCGA-AC-A6IV-01A-12R-A33A-13 | (TODO) -- GDC | miR__geneExp | |
| TCGA-AC-A6IV-01A-12R-A33A-13 | (TODO) -- GDC | miR__isoformExp | |
| TCGA-AC-A6IW-01A-12R-A33A-13 | (TODO) -- GDC | miR__geneExp | |
| TCGA-AC-A6IW-01A-12R-A33A-13 | (TODO) -- GDC | miR__isoformExp | |
| TCGA-AC-A6IX-01A-12R-A32K-13 | (TODO) -- GDC | miR__geneExp | |
| TCGA-AC-A6IX-01A-12R-A32K-13 | (TODO) -- GDC | miR__isoformExp | |
| TCGA-AC-A6NO-01A-12R-A33A-13 | (TODO) -- GDC | miR__geneExp | |
| TCGA-AC-A6NO-01A-12R-A33A-13 | (TODO) -- GDC | miR__isoformExp | |
| TCGA-AC-A7VB-01A-11R-A358-13 | (TODO) -- GDC | miR__geneExp | |
| TCGA-AC-A7VB-01A-11R-A358-13 | (TODO) -- GDC | miR__isoformExp | |
| TCGA-AC-A7VC-01A-11R-A358-13 | (TODO) -- GDC | miR__geneExp | |
| TCGA-AC-A7VC-01A-11R-A358-13 | (TODO) -- GDC | miR__isoformExp | |
| TCGA-AC-A8OP-01A-11R-A36A-13 | (TODO) -- GDC | miR__geneExp | |
| TCGA-AC-A8OP-01A-11R-A36A-13 | (TODO) -- GDC | miR__isoformExp | |
| TCGA-AC-A8OQ-01A-11R-A41G-13 | (TODO) -- GDC | miR__geneExp | |
| TCGA-AC-A8OQ-01A-11R-A41G-13 | (TODO) -- GDC | miR__isoformExp | |
| TCGA-AC-A8OR-01A-21R-A41G-13 | (TODO) -- GDC | miR__geneExp | |
| TCGA-AC-A8OR-01A-21R-A41G-13 | (TODO) -- GDC | miR__isoformExp | |
| TCGA-AC-A8OS-01A-12R-A41G-13 | (TODO) -- GDC | miR__geneExp | |
| TCGA-AC-A8OS-01A-12R-A41G-13 | (TODO) -- GDC | miR__isoformExp | |
| TCGA-AN-A03X-01A-21R-A010-13 | (TODO) -- GDC | miR__geneExp | |
| TCGA-AN-A03X-01A-21R-A010-13 | (TODO) -- GDC | miR__isoformExp | |
| TCGA-AN-A03Y-01A-21R-A010-13 | (TODO) -- GDC | miR__geneExp | |
| TCGA-AN-A03Y-01A-21R-A010-13 | (TODO) -- GDC | miR__isoformExp | |
| TCGA-AN-A041-01A-11R-A035-13 | (TODO) -- GDC | miR__geneExp | |
| TCGA-AN-A041-01A-11R-A035-13 | (TODO) -- GDC | miR__isoformExp | |
| TCGA-AN-A046-01A-21R-A035-13 | (TODO) -- GDC | miR__geneExp | |
| TCGA-AN-A046-01A-21R-A035-13 | (TODO) -- GDC | miR__isoformExp | |
| TCGA-AN-A049-01A-21R-A010-13 | (TODO) -- GDC | miR__geneExp | |
| TCGA-AN-A049-01A-21R-A010-13 | (TODO) -- GDC | miR__isoformExp | |
| TCGA-AN-A04A-01A-21R-A035-13 | (TODO) -- GDC | miR__geneExp | |
| TCGA-AN-A04A-01A-21R-A035-13 | (TODO) -- GDC | miR__isoformExp | |
| TCGA-AN-A04C-01A-21R-A035-13 | (TODO) -- GDC | miR__geneExp | |
| TCGA-AN-A04C-01A-21R-A035-13 | (TODO) -- GDC | miR__isoformExp | |
| TCGA-AN-A04D-01A-21R-A035-13 | (TODO) -- GDC | miR__geneExp | |
| TCGA-AN-A04D-01A-21R-A035-13 | (TODO) -- GDC | miR__isoformExp | |
| TCGA-AN-A0AJ-01A-11R-A010-13 | (TODO) -- GDC | miR__geneExp | |
| TCGA-AN-A0AJ-01A-11R-A010-13 | (TODO) -- GDC | miR__isoformExp | |
| TCGA-AN-A0AK-01A-21R-A010-13 | (TODO) -- GDC | miR__geneExp | |
| TCGA-AN-A0AK-01A-21R-A010-13 | (TODO) -- GDC | miR__isoformExp | |
| TCGA-AN-A0AL-01A-11R-A010-13 | (TODO) -- GDC | miR__geneExp | |
| TCGA-AN-A0AL-01A-11R-A010-13 | (TODO) -- GDC | miR__isoformExp | |
| TCGA-AN-A0AM-01A-11R-A035-13 | (TODO) -- GDC | miR__geneExp | |
| TCGA-AN-A0AM-01A-11R-A035-13 | (TODO) -- GDC | miR__isoformExp | |
| TCGA-AN-A0AR-01A-11R-A010-13 | (TODO) -- GDC | miR__geneExp | |
| TCGA-AN-A0AR-01A-11R-A010-13 | (TODO) -- GDC | miR__isoformExp | |
| TCGA-AN-A0AS-01A-11R-A010-13 | (TODO) -- GDC | miR__geneExp | |
| TCGA-AN-A0AS-01A-11R-A010-13 | (TODO) -- GDC | miR__isoformExp | |
| TCGA-AN-A0AT-01A-11R-A035-13 | (TODO) -- GDC | miR__geneExp | |
| TCGA-AN-A0AT-01A-11R-A035-13 | (TODO) -- GDC | miR__isoformExp | |
| TCGA-AN-A0FD-01A-11R-A035-13 | (TODO) -- GDC | miR__geneExp | |
| TCGA-AN-A0FD-01A-11R-A035-13 | (TODO) -- GDC | miR__isoformExp | |
| TCGA-AN-A0FF-01A-11R-A035-13 | (TODO) -- GDC | miR__geneExp | |
| TCGA-AN-A0FF-01A-11R-A035-13 | (TODO) -- GDC | miR__isoformExp | |
| TCGA-AN-A0FJ-01A-11R-A010-13 | (TODO) -- GDC | miR__geneExp | |
| TCGA-AN-A0FJ-01A-11R-A010-13 | (TODO) -- GDC | miR__isoformExp | |
| TCGA-AN-A0FK-01A-11R-A035-13 | (TODO) -- GDC | miR__geneExp | |
| TCGA-AN-A0FK-01A-11R-A035-13 | (TODO) -- GDC | miR__isoformExp | |
| TCGA-AN-A0FL-01A-11R-A035-13 | (TODO) -- GDC | miR__geneExp | |
| TCGA-AN-A0FL-01A-11R-A035-13 | (TODO) -- GDC | miR__isoformExp | |
| TCGA-AN-A0FN-01A-11R-A035-13 | (TODO) -- GDC | miR__geneExp | |
| TCGA-AN-A0FN-01A-11R-A035-13 | (TODO) -- GDC | miR__isoformExp | |
| TCGA-AN-A0FS-01A-11R-A035-13 | (TODO) -- GDC | miR__geneExp | |
| TCGA-AN-A0FS-01A-11R-A035-13 | (TODO) -- GDC | miR__isoformExp | |
| TCGA-AN-A0FT-01A-11R-A035-13 | (TODO) -- GDC | miR__geneExp | |
| TCGA-AN-A0FT-01A-11R-A035-13 | (TODO) -- GDC | miR__isoformExp | |
| TCGA-AN-A0FV-01A-11R-A010-13 | (TODO) -- GDC | miR__geneExp | |
| TCGA-AN-A0FV-01A-11R-A010-13 | (TODO) -- GDC | miR__isoformExp | |
| TCGA-AN-A0FW-01A-11R-A035-13 | (TODO) -- GDC | miR__geneExp | |
| TCGA-AN-A0FW-01A-11R-A035-13 | (TODO) -- GDC | miR__isoformExp | |
| TCGA-AN-A0FX-01A-11R-A035-13 | (TODO) -- GDC | miR__geneExp | |
| TCGA-AN-A0FX-01A-11R-A035-13 | (TODO) -- GDC | miR__isoformExp | |
| TCGA-AN-A0FY-01A-11R-A035-13 | (TODO) -- GDC | miR__geneExp | |
| TCGA-AN-A0FY-01A-11R-A035-13 | (TODO) -- GDC | miR__isoformExp | |
| TCGA-AN-A0FZ-01A-11R-A035-13 | (TODO) -- GDC | miR__geneExp | |
| TCGA-AN-A0FZ-01A-11R-A035-13 | (TODO) -- GDC | miR__isoformExp | |
| TCGA-AN-A0G0-01A-11R-A035-13 | (TODO) -- GDC | miR__geneExp | |
| TCGA-AN-A0G0-01A-11R-A035-13 | (TODO) -- GDC | miR__isoformExp | |
| TCGA-AN-A0XL-01A-11R-A10I-13 | (TODO) -- GDC | miR__geneExp | |
| TCGA-AN-A0XL-01A-11R-A10I-13 | (TODO) -- GDC | miR__isoformExp | |
| TCGA-AN-A0XN-01A-21R-A108-13 | (TODO) -- GDC | miR__geneExp | |
| TCGA-AN-A0XN-01A-21R-A108-13 | (TODO) -- GDC | miR__isoformExp | |
| TCGA-AN-A0XO-01A-11R-A108-13 | (TODO) -- GDC | miR__geneExp | |
| TCGA-AN-A0XO-01A-11R-A108-13 | (TODO) -- GDC | miR__isoformExp | |
| TCGA-AN-A0XP-01A-11R-A108-13 | (TODO) -- GDC | miR__geneExp | |
| TCGA-AN-A0XP-01A-11R-A108-13 | (TODO) -- GDC | miR__isoformExp | |
| TCGA-AN-A0XR-01A-11R-A108-13 | (TODO) -- GDC | miR__geneExp | |
| TCGA-AN-A0XR-01A-11R-A108-13 | (TODO) -- GDC | miR__isoformExp | |
| TCGA-AN-A0XS-01A-22R-A108-13 | (TODO) -- GDC | miR__geneExp | |
| TCGA-AN-A0XS-01A-22R-A108-13 | (TODO) -- GDC | miR__isoformExp | |
| TCGA-AN-A0XT-01A-11R-A108-13 | (TODO) -- GDC | miR__geneExp | |
| TCGA-AN-A0XT-01A-11R-A108-13 | (TODO) -- GDC | miR__isoformExp | |
| TCGA-AN-A0XU-01A-11R-A108-13 | (TODO) -- GDC | miR__geneExp | |
| TCGA-AN-A0XU-01A-11R-A108-13 | (TODO) -- GDC | miR__isoformExp | |
| TCGA-AN-A0XV-01A-11R-A108-13 | (TODO) -- GDC | miR__geneExp | |
| TCGA-AN-A0XV-01A-11R-A108-13 | (TODO) -- GDC | miR__isoformExp | |
| TCGA-AN-A0XW-01A-11R-A108-13 | (TODO) -- GDC | miR__geneExp | |
| TCGA-AN-A0XW-01A-11R-A108-13 | (TODO) -- GDC | miR__isoformExp | |
| TCGA-AO-A03L-01A-41R-A057-13 | (TODO) -- GDC | miR__geneExp | |
| TCGA-AO-A03L-01A-41R-A057-13 | (TODO) -- GDC | miR__isoformExp | |
| TCGA-AO-A03M-01B-11R-A10I-13 | (TODO) -- GDC | miR__geneExp | |
| TCGA-AO-A03M-01B-11R-A10I-13 | (TODO) -- GDC | miR__isoformExp | |
| TCGA-AO-A03N-01B-11R-A10I-13 | (TODO) -- GDC | miR__geneExp | |
| TCGA-AO-A03N-01B-11R-A10I-13 | (TODO) -- GDC | miR__isoformExp | |
| TCGA-AO-A03O-01A-11R-A010-13 | (TODO) -- GDC | miR__geneExp | |
| TCGA-AO-A03O-01A-11R-A010-13 | (TODO) -- GDC | miR__isoformExp | |
| TCGA-AO-A03R-01A-21R-A035-13 | (TODO) -- GDC | miR__geneExp | |
| TCGA-AO-A03R-01A-21R-A035-13 | (TODO) -- GDC | miR__isoformExp | |
| TCGA-AO-A03T-01A-21R-A035-13 | (TODO) -- GDC | miR__geneExp | |
| TCGA-AO-A03T-01A-21R-A035-13 | (TODO) -- GDC | miR__isoformExp | |
| TCGA-AO-A03U-01B-21R-A10I-13 | (TODO) -- GDC | miR__geneExp | |
| TCGA-AO-A03U-01B-21R-A10I-13 | (TODO) -- GDC | miR__isoformExp | |
| TCGA-AO-A03V-01A-11R-A114-13 | (TODO) -- GDC | miR__geneExp | |
| TCGA-AO-A03V-01A-11R-A114-13 | (TODO) -- GDC | miR__isoformExp | |
| TCGA-AO-A0J2-01A-11R-A035-13 | (TODO) -- GDC | miR__geneExp | |
| TCGA-AO-A0J2-01A-11R-A035-13 | (TODO) -- GDC | miR__isoformExp | |
| TCGA-AO-A0J3-01A-11R-A035-13 | (TODO) -- GDC | miR__geneExp | |
| TCGA-AO-A0J3-01A-11R-A035-13 | (TODO) -- GDC | miR__isoformExp | |
| TCGA-AO-A0J4-01A-11R-A035-13 | (TODO) -- GDC | miR__geneExp | |
| TCGA-AO-A0J4-01A-11R-A035-13 | (TODO) -- GDC | miR__isoformExp | |
| TCGA-AO-A0J5-01A-11R-A035-13 | (TODO) -- GDC | miR__geneExp | |
| TCGA-AO-A0J5-01A-11R-A035-13 | (TODO) -- GDC | miR__isoformExp | |
| TCGA-AO-A0J6-01A-11R-A035-13 | (TODO) -- GDC | miR__geneExp | |
| TCGA-AO-A0J6-01A-11R-A035-13 | (TODO) -- GDC | miR__isoformExp | |
| TCGA-AO-A0J7-01A-11R-A035-13 | (TODO) -- GDC | miR__geneExp | |
| TCGA-AO-A0J7-01A-11R-A035-13 | (TODO) -- GDC | miR__isoformExp | |
| TCGA-AO-A0J8-01A-21R-A035-13 | (TODO) -- GDC | miR__geneExp | |
| TCGA-AO-A0J8-01A-21R-A035-13 | (TODO) -- GDC | miR__isoformExp | |
| TCGA-AO-A0J9-01A-11R-A035-13 | (TODO) -- GDC | miR__geneExp | |
| TCGA-AO-A0J9-01A-11R-A035-13 | (TODO) -- GDC | miR__isoformExp | |
| TCGA-AO-A0JA-01A-11R-A057-13 | (TODO) -- GDC | miR__geneExp | |
| TCGA-AO-A0JA-01A-11R-A057-13 | (TODO) -- GDC | miR__isoformExp | |
| TCGA-AO-A0JB-01A-11R-A057-13 | (TODO) -- GDC | miR__geneExp | |
| TCGA-AO-A0JB-01A-11R-A057-13 | (TODO) -- GDC | miR__isoformExp | |
| TCGA-AO-A0JC-01A-11R-A057-13 | (TODO) -- GDC | miR__geneExp | |
| TCGA-AO-A0JC-01A-11R-A057-13 | (TODO) -- GDC | miR__isoformExp | |
| TCGA-AO-A0JD-01A-11R-A057-13 | (TODO) -- GDC | miR__geneExp | |
| TCGA-AO-A0JD-01A-11R-A057-13 | (TODO) -- GDC | miR__isoformExp | |
| TCGA-AO-A0JE-01A-11R-A057-13 | (TODO) -- GDC | miR__geneExp | |
| TCGA-AO-A0JE-01A-11R-A057-13 | (TODO) -- GDC | miR__isoformExp | |
| TCGA-AO-A0JF-01A-11R-A057-13 | (TODO) -- GDC | miR__geneExp | |
| TCGA-AO-A0JF-01A-11R-A057-13 | (TODO) -- GDC | miR__isoformExp | |
| TCGA-AO-A0JG-01A-31R-A085-13 | (TODO) -- GDC | miR__geneExp | |
| TCGA-AO-A0JG-01A-31R-A085-13 | (TODO) -- GDC | miR__isoformExp | |
| TCGA-AO-A0JI-01A-21R-A057-13 | (TODO) -- GDC | miR__geneExp | |
| TCGA-AO-A0JI-01A-21R-A057-13 | (TODO) -- GDC | miR__isoformExp | |
| TCGA-AO-A0JJ-01A-11R-A057-13 | (TODO) -- GDC | miR__geneExp | |
| TCGA-AO-A0JJ-01A-11R-A057-13 | (TODO) -- GDC | miR__isoformExp | |
| TCGA-AO-A0JL-01A-11R-A057-13 | (TODO) -- GDC | miR__geneExp | |
| TCGA-AO-A0JL-01A-11R-A057-13 | (TODO) -- GDC | miR__isoformExp | |
| TCGA-AO-A0JM-01A-21R-A057-13 | (TODO) -- GDC | miR__geneExp | |
| TCGA-AO-A0JM-01A-21R-A057-13 | (TODO) -- GDC | miR__isoformExp | |
| TCGA-AO-A124-01A-11R-A10I-13 | (TODO) -- GDC | miR__geneExp | |
| TCGA-AO-A124-01A-11R-A10I-13 | (TODO) -- GDC | miR__isoformExp | |
| TCGA-AO-A125-01A-11R-A10I-13 | (TODO) -- GDC | miR__geneExp | |
| TCGA-AO-A125-01A-11R-A10I-13 | (TODO) -- GDC | miR__isoformExp | |
| TCGA-AO-A126-01A-11R-A10I-13 | (TODO) -- GDC | miR__geneExp | |
| TCGA-AO-A126-01A-11R-A10I-13 | (TODO) -- GDC | miR__isoformExp | |
| TCGA-AO-A128-01A-11R-A10I-13 | (TODO) -- GDC | miR__geneExp | |
| TCGA-AO-A128-01A-11R-A10I-13 | (TODO) -- GDC | miR__isoformExp | |
| TCGA-AO-A129-01A-21R-A10I-13 | (TODO) -- GDC | miR__geneExp | |
| TCGA-AO-A129-01A-21R-A10I-13 | (TODO) -- GDC | miR__isoformExp | |
| TCGA-AO-A12A-01A-21R-A114-13 | (TODO) -- GDC | miR__geneExp | |
| TCGA-AO-A12A-01A-21R-A114-13 | (TODO) -- GDC | miR__isoformExp | |
| TCGA-AO-A12B-01A-11R-A10I-13 | (TODO) -- GDC | miR__geneExp | |
| TCGA-AO-A12B-01A-11R-A10I-13 | (TODO) -- GDC | miR__isoformExp | |
| TCGA-AO-A12C-01A-11R-A10I-13 | (TODO) -- GDC | miR__geneExp | |
| TCGA-AO-A12C-01A-11R-A10I-13 | (TODO) -- GDC | miR__isoformExp | |
| TCGA-AO-A12D-01A-11R-A114-13 | (TODO) -- GDC | miR__geneExp | |
| TCGA-AO-A12D-01A-11R-A114-13 | (TODO) -- GDC | miR__isoformExp | |
| TCGA-AO-A12E-01A-11R-A10I-13 | (TODO) -- GDC | miR__geneExp | |
| TCGA-AO-A12E-01A-11R-A10I-13 | (TODO) -- GDC | miR__isoformExp | |
| TCGA-AO-A12F-01A-11R-A114-13 | (TODO) -- GDC | miR__geneExp | |
| TCGA-AO-A12F-01A-11R-A114-13 | (TODO) -- GDC | miR__isoformExp | |
| TCGA-AO-A12G-01A-11R-A10I-13 | (TODO) -- GDC | miR__geneExp | |
| TCGA-AO-A12G-01A-11R-A10I-13 | (TODO) -- GDC | miR__isoformExp | |
| TCGA-AO-A12H-01A-11R-A114-13 | (TODO) -- GDC | miR__geneExp | |
| TCGA-AO-A12H-01A-11R-A114-13 | (TODO) -- GDC | miR__isoformExp | |
| TCGA-AO-A1KO-01A-31R-A13P-13 | (TODO) -- GDC | miR__geneExp | |
| TCGA-AO-A1KO-01A-31R-A13P-13 | (TODO) -- GDC | miR__isoformExp | |
| TCGA-AO-A1KP-01A-11R-A13P-13 | (TODO) -- GDC | miR__geneExp | |
| TCGA-AO-A1KP-01A-11R-A13P-13 | (TODO) -- GDC | miR__isoformExp | |
| TCGA-AO-A1KQ-01A-11R-A13P-13 | (TODO) -- GDC | miR__geneExp | |
| TCGA-AO-A1KQ-01A-11R-A13P-13 | (TODO) -- GDC | miR__isoformExp | |
| TCGA-AO-A1KR-01A-12R-A143-13 | (TODO) -- GDC | miR__geneExp | |
| TCGA-AO-A1KR-01A-12R-A143-13 | (TODO) -- GDC | miR__isoformExp | |
| TCGA-AO-A1KS-01A-11R-A13P-13 | (TODO) -- GDC | miR__geneExp | |
| TCGA-AO-A1KS-01A-11R-A13P-13 | (TODO) -- GDC | miR__isoformExp | |
| TCGA-AO-A1KT-01A-11R-A13P-13 | (TODO) -- GDC | miR__geneExp | |
| TCGA-AO-A1KT-01A-11R-A13P-13 | (TODO) -- GDC | miR__isoformExp | |
| TCGA-AQ-A04H-01B-11R-A10I-13 | (TODO) -- GDC | miR__geneExp | |
| TCGA-AQ-A04H-01B-11R-A10I-13 | (TODO) -- GDC | miR__isoformExp | |
| TCGA-AQ-A04J-01A-02R-A035-13 | (TODO) -- GDC | miR__geneExp | |
| TCGA-AQ-A04J-01A-02R-A035-13 | (TODO) -- GDC | miR__isoformExp | |
| TCGA-AQ-A04L-01B-21R-A10I-13 | (TODO) -- GDC | miR__geneExp | |
| TCGA-AQ-A04L-01B-21R-A10I-13 | (TODO) -- GDC | miR__isoformExp | |
| TCGA-AQ-A0Y5-01A-11R-A14L-13 | (TODO) -- GDC | miR__geneExp | |
| TCGA-AQ-A0Y5-01A-11R-A14L-13 | (TODO) -- GDC | miR__isoformExp | |
| TCGA-AQ-A1H2-01A-11R-A13P-13 | (TODO) -- GDC | miR__geneExp | |
| TCGA-AQ-A1H2-01A-11R-A13P-13 | (TODO) -- GDC | miR__isoformExp | |
| TCGA-AQ-A1H3-01A-31R-A13P-13 | (TODO) -- GDC | miR__geneExp | |
| TCGA-AQ-A1H3-01A-31R-A13P-13 | (TODO) -- GDC | miR__isoformExp | |
| TCGA-AQ-A54N-01A-11R-A25Z-13 | (TODO) -- GDC | miR__geneExp | |
| TCGA-AQ-A54N-01A-11R-A25Z-13 | (TODO) -- GDC | miR__isoformExp | |
| TCGA-AQ-A54O-01A-11R-A25Z-13 | (TODO) -- GDC | miR__geneExp | |
| TCGA-AQ-A54O-01A-11R-A25Z-13 | (TODO) -- GDC | miR__isoformExp | |
| TCGA-AQ-A7U7-01A-22R-A358-13 | (TODO) -- GDC | miR__geneExp | |
| TCGA-AQ-A7U7-01A-22R-A358-13 | (TODO) -- GDC | miR__isoformExp | |
| TCGA-AR-A0TP-01A-11R-A085-13 | (TODO) -- GDC | miR__geneExp | |
| TCGA-AR-A0TP-01A-11R-A085-13 | (TODO) -- GDC | miR__isoformExp | |
| TCGA-AR-A0TQ-01A-11R-A085-13 | (TODO) -- GDC | miR__geneExp | |
| TCGA-AR-A0TQ-01A-11R-A085-13 | (TODO) -- GDC | miR__isoformExp | |
| TCGA-AR-A0TR-01A-11R-A085-13 | (TODO) -- GDC | miR__geneExp | |
| TCGA-AR-A0TR-01A-11R-A085-13 | (TODO) -- GDC | miR__isoformExp | |
| TCGA-AR-A0TS-01A-11R-A114-13 | (TODO) -- GDC | miR__geneExp | |
| TCGA-AR-A0TS-01A-11R-A114-13 | (TODO) -- GDC | miR__isoformExp | |
| TCGA-AR-A0TT-01A-31R-A085-13 | (TODO) -- GDC | miR__geneExp | |
| TCGA-AR-A0TT-01A-31R-A085-13 | (TODO) -- GDC | miR__isoformExp | |
| TCGA-AR-A0TV-01A-21R-A085-13 | (TODO) -- GDC | miR__geneExp | |
| TCGA-AR-A0TV-01A-21R-A085-13 | (TODO) -- GDC | miR__isoformExp | |
| TCGA-AR-A0TX-01A-11R-A085-13 | (TODO) -- GDC | miR__geneExp | |
| TCGA-AR-A0TX-01A-11R-A085-13 | (TODO) -- GDC | miR__isoformExp | |
| TCGA-AR-A0TY-01A-12R-A114-13 | (TODO) -- GDC | miR__geneExp | |
| TCGA-AR-A0TY-01A-12R-A114-13 | (TODO) -- GDC | miR__isoformExp | |
| TCGA-AR-A0TZ-01A-12R-A085-13 | (TODO) -- GDC | miR__geneExp | |
| TCGA-AR-A0TZ-01A-12R-A085-13 | (TODO) -- GDC | miR__isoformExp | |
| TCGA-AR-A0U2-01A-11R-A108-13 | (TODO) -- GDC | miR__geneExp | |
| TCGA-AR-A0U2-01A-11R-A108-13 | (TODO) -- GDC | miR__isoformExp | |
| TCGA-AR-A0U3-01A-11R-A108-13 | (TODO) -- GDC | miR__geneExp | |
| TCGA-AR-A0U3-01A-11R-A108-13 | (TODO) -- GDC | miR__isoformExp | |
| TCGA-AR-A0U4-01A-11R-A108-13 | (TODO) -- GDC | miR__geneExp | |
| TCGA-AR-A0U4-01A-11R-A108-13 | (TODO) -- GDC | miR__isoformExp | |
| TCGA-AR-A1AH-01A-11R-A12C-13 | (TODO) -- GDC | miR__geneExp | |
| TCGA-AR-A1AH-01A-11R-A12C-13 | (TODO) -- GDC | miR__isoformExp | |
| TCGA-AR-A1AI-01A-11R-A12O-13 | (TODO) -- GDC | miR__geneExp | |
| TCGA-AR-A1AI-01A-11R-A12O-13 | (TODO) -- GDC | miR__isoformExp | |
| TCGA-AR-A1AJ-01A-21R-A12O-13 | (TODO) -- GDC | miR__geneExp | |
| TCGA-AR-A1AJ-01A-21R-A12O-13 | (TODO) -- GDC | miR__isoformExp | |
| TCGA-AR-A1AK-01A-21R-A12O-13 | (TODO) -- GDC | miR__geneExp | |
| TCGA-AR-A1AK-01A-21R-A12O-13 | (TODO) -- GDC | miR__isoformExp | |
| TCGA-AR-A1AL-01A-21R-A12O-13 | (TODO) -- GDC | miR__geneExp | |
| TCGA-AR-A1AL-01A-21R-A12O-13 | (TODO) -- GDC | miR__isoformExp | |
| TCGA-AR-A1AM-01A-41R-A22I-13 | (TODO) -- GDC | miR__geneExp | |
| TCGA-AR-A1AM-01A-41R-A22I-13 | (TODO) -- GDC | miR__isoformExp | |
| TCGA-AR-A1AN-01A-11R-A12O-13 | (TODO) -- GDC | miR__geneExp | |
| TCGA-AR-A1AN-01A-11R-A12O-13 | (TODO) -- GDC | miR__isoformExp | |
| TCGA-AR-A1AO-01A-11R-A12O-13 | (TODO) -- GDC | miR__geneExp | |
| TCGA-AR-A1AO-01A-11R-A12O-13 | (TODO) -- GDC | miR__isoformExp | |
| TCGA-AR-A1AP-01A-11R-A12O-13 | (TODO) -- GDC | miR__geneExp | |
| TCGA-AR-A1AP-01A-11R-A12O-13 | (TODO) -- GDC | miR__isoformExp | |
| TCGA-AR-A1AQ-01A-11R-A12O-13 | (TODO) -- GDC | miR__geneExp | |
| TCGA-AR-A1AQ-01A-11R-A12O-13 | (TODO) -- GDC | miR__isoformExp | |
| TCGA-AR-A1AR-01A-31R-A136-13 | (TODO) -- GDC | miR__geneExp | |
| TCGA-AR-A1AR-01A-31R-A136-13 | (TODO) -- GDC | miR__isoformExp | |
| TCGA-AR-A1AS-01A-11R-A12O-13 | (TODO) -- GDC | miR__geneExp | |
| TCGA-AR-A1AS-01A-11R-A12O-13 | (TODO) -- GDC | miR__isoformExp | |
| TCGA-AR-A1AT-01A-11R-A12O-13 | (TODO) -- GDC | miR__geneExp | |
| TCGA-AR-A1AT-01A-11R-A12O-13 | (TODO) -- GDC | miR__isoformExp | |
| TCGA-AR-A1AU-01A-11R-A12O-13 | (TODO) -- GDC | miR__geneExp | |
| TCGA-AR-A1AU-01A-11R-A12O-13 | (TODO) -- GDC | miR__isoformExp | |
| TCGA-AR-A1AV-01A-21R-A12O-13 | (TODO) -- GDC | miR__geneExp | |
| TCGA-AR-A1AV-01A-21R-A12O-13 | (TODO) -- GDC | miR__isoformExp | |
| TCGA-AR-A1AW-01A-21R-A12O-13 | (TODO) -- GDC | miR__geneExp | |
| TCGA-AR-A1AW-01A-21R-A12O-13 | (TODO) -- GDC | miR__isoformExp | |
| TCGA-AR-A1AX-01A-11R-A12O-13 | (TODO) -- GDC | miR__geneExp | |
| TCGA-AR-A1AX-01A-11R-A12O-13 | (TODO) -- GDC | miR__isoformExp | |
| TCGA-AR-A1AY-01A-21R-A12O-13 | (TODO) -- GDC | miR__geneExp | |
| TCGA-AR-A1AY-01A-21R-A12O-13 | (TODO) -- GDC | miR__isoformExp | |
| TCGA-AR-A24H-01A-11R-A168-13 | (TODO) -- GDC | miR__geneExp | |
| TCGA-AR-A24H-01A-11R-A168-13 | (TODO) -- GDC | miR__isoformExp | |
| TCGA-AR-A24K-01A-11R-A168-13 | (TODO) -- GDC | miR__geneExp | |
| TCGA-AR-A24K-01A-11R-A168-13 | (TODO) -- GDC | miR__isoformExp | |
| TCGA-AR-A24L-01A-11R-A168-13 | (TODO) -- GDC | miR__geneExp | |
| TCGA-AR-A24L-01A-11R-A168-13 | (TODO) -- GDC | miR__isoformExp | |
| TCGA-AR-A24M-01A-11R-A168-13 | (TODO) -- GDC | miR__geneExp | |
| TCGA-AR-A24M-01A-11R-A168-13 | (TODO) -- GDC | miR__isoformExp | |
| TCGA-AR-A24N-01A-11R-A168-13 | (TODO) -- GDC | miR__geneExp | |
| TCGA-AR-A24N-01A-11R-A168-13 | (TODO) -- GDC | miR__isoformExp | |
| TCGA-AR-A24O-01A-11R-A168-13 | (TODO) -- GDC | miR__geneExp | |
| TCGA-AR-A24O-01A-11R-A168-13 | (TODO) -- GDC | miR__isoformExp | |
| TCGA-AR-A24P-01A-11R-A168-13 | (TODO) -- GDC | miR__geneExp | |
| TCGA-AR-A24P-01A-11R-A168-13 | (TODO) -- GDC | miR__isoformExp | |
| TCGA-AR-A24Q-01A-12R-A168-13 | (TODO) -- GDC | miR__geneExp | |
| TCGA-AR-A24Q-01A-12R-A168-13 | (TODO) -- GDC | miR__isoformExp | |
| TCGA-AR-A24R-01A-11R-A168-13 | (TODO) -- GDC | miR__geneExp | |
| TCGA-AR-A24R-01A-11R-A168-13 | (TODO) -- GDC | miR__isoformExp | |
| TCGA-AR-A24S-01A-11R-A168-13 | (TODO) -- GDC | miR__geneExp | |
| TCGA-AR-A24S-01A-11R-A168-13 | (TODO) -- GDC | miR__isoformExp | |
| TCGA-AR-A24T-01A-11R-A168-13 | (TODO) -- GDC | miR__geneExp | |
| TCGA-AR-A24T-01A-11R-A168-13 | (TODO) -- GDC | miR__isoformExp | |
| TCGA-AR-A24U-01A-11R-A168-13 | (TODO) -- GDC | miR__geneExp | |
| TCGA-AR-A24U-01A-11R-A168-13 | (TODO) -- GDC | miR__isoformExp | |
| TCGA-AR-A24V-01A-21R-A168-13 | (TODO) -- GDC | miR__geneExp | |
| TCGA-AR-A24V-01A-21R-A168-13 | (TODO) -- GDC | miR__isoformExp | |
| TCGA-AR-A24W-01A-11R-A168-13 | (TODO) -- GDC | miR__geneExp | |
| TCGA-AR-A24W-01A-11R-A168-13 | (TODO) -- GDC | miR__isoformExp | |
| TCGA-AR-A24X-01A-11R-A168-13 | (TODO) -- GDC | miR__geneExp | |
| TCGA-AR-A24X-01A-11R-A168-13 | (TODO) -- GDC | miR__isoformExp | |
| TCGA-AR-A24Z-01A-11R-A168-13 | (TODO) -- GDC | miR__geneExp | |
| TCGA-AR-A24Z-01A-11R-A168-13 | (TODO) -- GDC | miR__isoformExp | |
| TCGA-AR-A250-01A-31R-A168-13 | (TODO) -- GDC | miR__geneExp | |
| TCGA-AR-A250-01A-31R-A168-13 | (TODO) -- GDC | miR__isoformExp | |
| TCGA-AR-A251-01A-12R-A168-13 | (TODO) -- GDC | miR__geneExp | |
| TCGA-AR-A251-01A-12R-A168-13 | (TODO) -- GDC | miR__isoformExp | |
| TCGA-AR-A252-01A-11R-A168-13 | (TODO) -- GDC | miR__geneExp | |
| TCGA-AR-A252-01A-11R-A168-13 | (TODO) -- GDC | miR__isoformExp | |
| TCGA-AR-A254-01A-21R-A168-13 | (TODO) -- GDC | miR__geneExp | |
| TCGA-AR-A254-01A-21R-A168-13 | (TODO) -- GDC | miR__isoformExp | |
| TCGA-AR-A255-01A-11R-A168-13 | (TODO) -- GDC | miR__geneExp | |
| TCGA-AR-A255-01A-11R-A168-13 | (TODO) -- GDC | miR__isoformExp | |
| TCGA-AR-A256-01A-11R-A168-13 | (TODO) -- GDC | miR__geneExp | |
| TCGA-AR-A256-01A-11R-A168-13 | (TODO) -- GDC | miR__isoformExp | |
| TCGA-AR-A2LE-01A-11R-A17X-13 | (TODO) -- GDC | miR__geneExp | |
| TCGA-AR-A2LE-01A-11R-A17X-13 | (TODO) -- GDC | miR__isoformExp | |
| TCGA-AR-A2LH-01A-31R-A18L-13 | (TODO) -- GDC | miR__geneExp | |
| TCGA-AR-A2LH-01A-31R-A18L-13 | (TODO) -- GDC | miR__isoformExp | |
| TCGA-AR-A2LJ-01A-12R-A19V-13 | (TODO) -- GDC | miR__geneExp | |
| TCGA-AR-A2LJ-01A-12R-A19V-13 | (TODO) -- GDC | miR__isoformExp | |
| TCGA-AR-A2LK-01A-11R-A17X-13 | (TODO) -- GDC | miR__geneExp | |
| TCGA-AR-A2LK-01A-11R-A17X-13 | (TODO) -- GDC | miR__isoformExp | |
| TCGA-AR-A2LL-01A-11R-A17X-13 | (TODO) -- GDC | miR__geneExp | |
| TCGA-AR-A2LL-01A-11R-A17X-13 | (TODO) -- GDC | miR__isoformExp | |
| TCGA-AR-A2LM-01A-11R-A17X-13 | (TODO) -- GDC | miR__geneExp | |
| TCGA-AR-A2LM-01A-11R-A17X-13 | (TODO) -- GDC | miR__isoformExp | |
| TCGA-AR-A2LN-01A-21R-A18L-13 | (TODO) -- GDC | miR__geneExp | |
| TCGA-AR-A2LN-01A-21R-A18L-13 | (TODO) -- GDC | miR__isoformExp | |
| TCGA-AR-A2LO-01A-31R-A18L-13 | (TODO) -- GDC | miR__geneExp | |
| TCGA-AR-A2LO-01A-31R-A18L-13 | (TODO) -- GDC | miR__isoformExp | |
| TCGA-AR-A2LQ-01A-22R-A18L-13 | (TODO) -- GDC | miR__geneExp | |
| TCGA-AR-A2LQ-01A-22R-A18L-13 | (TODO) -- GDC | miR__isoformExp | |
| TCGA-AR-A2LR-01A-12R-A18L-13 | (TODO) -- GDC | miR__geneExp | |
| TCGA-AR-A2LR-01A-12R-A18L-13 | (TODO) -- GDC | miR__isoformExp | |
| TCGA-AR-A5QM-01A-11R-A27U-13 | (TODO) -- GDC | miR__geneExp | |
| TCGA-AR-A5QM-01A-11R-A27U-13 | (TODO) -- GDC | miR__isoformExp | |
| TCGA-AR-A5QN-01A-12R-A28I-13 | (TODO) -- GDC | miR__geneExp | |
| TCGA-AR-A5QN-01A-12R-A28I-13 | (TODO) -- GDC | miR__isoformExp | |
| TCGA-AR-A5QP-01A-11R-A28I-13 | (TODO) -- GDC | miR__geneExp | |
| TCGA-AR-A5QP-01A-11R-A28I-13 | (TODO) -- GDC | miR__isoformExp | |
| TCGA-AR-A5QQ-01A-11R-A28I-13 | (TODO) -- GDC | miR__geneExp | |
| TCGA-AR-A5QQ-01A-11R-A28I-13 | (TODO) -- GDC | miR__isoformExp | |
| TCGA-B6-A0I1-01A-11R-A21U-13 | (TODO) -- GDC | miR__geneExp | |
| TCGA-B6-A0I1-01A-11R-A21U-13 | (TODO) -- GDC | miR__isoformExp | |
| TCGA-B6-A0I2-01A-11R-A035-13 | (TODO) -- GDC | miR__geneExp | |
| TCGA-B6-A0I2-01A-11R-A035-13 | (TODO) -- GDC | miR__isoformExp | |
| TCGA-B6-A0I5-01A-11R-A035-13 | (TODO) -- GDC | miR__geneExp | |
| TCGA-B6-A0I5-01A-11R-A035-13 | (TODO) -- GDC | miR__isoformExp | |
| TCGA-B6-A0I6-01A-11R-A035-13 | (TODO) -- GDC | miR__geneExp | |
| TCGA-B6-A0I6-01A-11R-A035-13 | (TODO) -- GDC | miR__isoformExp | |
| TCGA-B6-A0I8-01A-11R-A035-13 | (TODO) -- GDC | miR__geneExp | |
| TCGA-B6-A0I8-01A-11R-A035-13 | (TODO) -- GDC | miR__isoformExp | |
| TCGA-B6-A0I9-01A-11R-A035-13 | (TODO) -- GDC | miR__geneExp | |
| TCGA-B6-A0I9-01A-11R-A035-13 | (TODO) -- GDC | miR__isoformExp | |
| TCGA-B6-A0IA-01A-11R-A035-13 | (TODO) -- GDC | miR__geneExp | |
| TCGA-B6-A0IA-01A-11R-A035-13 | (TODO) -- GDC | miR__isoformExp | |
| TCGA-B6-A0IB-01A-11R-A035-13 | (TODO) -- GDC | miR__geneExp | |
| TCGA-B6-A0IB-01A-11R-A035-13 | (TODO) -- GDC | miR__isoformExp | |
| TCGA-B6-A0IC-01A-11R-A035-13 | (TODO) -- GDC | miR__geneExp | |
| TCGA-B6-A0IC-01A-11R-A035-13 | (TODO) -- GDC | miR__isoformExp | |
| TCGA-B6-A0IE-01A-11R-A035-13 | (TODO) -- GDC | miR__geneExp | |
| TCGA-B6-A0IE-01A-11R-A035-13 | (TODO) -- GDC | miR__isoformExp | |
| TCGA-B6-A0IG-01A-11R-A035-13 | (TODO) -- GDC | miR__geneExp | |
| TCGA-B6-A0IG-01A-11R-A035-13 | (TODO) -- GDC | miR__isoformExp | |
| TCGA-B6-A0IH-01A-11R-A114-13 | (TODO) -- GDC | miR__geneExp | |
| TCGA-B6-A0IH-01A-11R-A114-13 | (TODO) -- GDC | miR__isoformExp | |
| TCGA-B6-A0IJ-01A-11R-A035-13 | (TODO) -- GDC | miR__geneExp | |
| TCGA-B6-A0IJ-01A-11R-A035-13 | (TODO) -- GDC | miR__isoformExp | |
| TCGA-B6-A0IK-01A-12R-A057-13 | (TODO) -- GDC | miR__geneExp | |
| TCGA-B6-A0IK-01A-12R-A057-13 | (TODO) -- GDC | miR__isoformExp | |
| TCGA-B6-A0IM-01A-11R-A035-13 | (TODO) -- GDC | miR__geneExp | |
| TCGA-B6-A0IM-01A-11R-A035-13 | (TODO) -- GDC | miR__isoformExp | |
| TCGA-B6-A0IN-01A-11R-A035-13 | (TODO) -- GDC | miR__geneExp | |
| TCGA-B6-A0IN-01A-11R-A035-13 | (TODO) -- GDC | miR__isoformExp | |
| TCGA-B6-A0IO-01A-11R-A035-13 | (TODO) -- GDC | miR__geneExp | |
| TCGA-B6-A0IO-01A-11R-A035-13 | (TODO) -- GDC | miR__isoformExp | |
| TCGA-B6-A0IP-01A-11R-A035-13 | (TODO) -- GDC | miR__geneExp | |
| TCGA-B6-A0IP-01A-11R-A035-13 | (TODO) -- GDC | miR__isoformExp | |
| TCGA-B6-A0IQ-01A-11R-A035-13 | (TODO) -- GDC | miR__geneExp | |
| TCGA-B6-A0IQ-01A-11R-A035-13 | (TODO) -- GDC | miR__isoformExp | |
| TCGA-B6-A0RE-01A-11R-A057-13 | (TODO) -- GDC | miR__geneExp | |
| TCGA-B6-A0RE-01A-11R-A057-13 | (TODO) -- GDC | miR__isoformExp | |
| TCGA-B6-A0RG-01A-11R-A057-13 | (TODO) -- GDC | miR__geneExp | |
| TCGA-B6-A0RG-01A-11R-A057-13 | (TODO) -- GDC | miR__isoformExp | |
| TCGA-B6-A0RH-01A-21R-A114-13 | (TODO) -- GDC | miR__geneExp | |
| TCGA-B6-A0RH-01A-21R-A114-13 | (TODO) -- GDC | miR__isoformExp | |
| TCGA-B6-A0RI-01A-11R-A057-13 | (TODO) -- GDC | miR__geneExp | |
| TCGA-B6-A0RI-01A-11R-A057-13 | (TODO) -- GDC | miR__isoformExp | |
| TCGA-B6-A0RL-01A-11R-A085-13 | (TODO) -- GDC | miR__geneExp | |
| TCGA-B6-A0RL-01A-11R-A085-13 | (TODO) -- GDC | miR__isoformExp | |
| TCGA-B6-A0RM-01A-11R-A085-13 | (TODO) -- GDC | miR__geneExp | |
| TCGA-B6-A0RM-01A-11R-A085-13 | (TODO) -- GDC | miR__isoformExp | |
| TCGA-B6-A0RN-01A-12R-A085-13 | (TODO) -- GDC | miR__geneExp | |
| TCGA-B6-A0RN-01A-12R-A085-13 | (TODO) -- GDC | miR__isoformExp | |
| TCGA-B6-A0RO-01A-22R-A085-13 | (TODO) -- GDC | miR__geneExp | |
| TCGA-B6-A0RO-01A-22R-A085-13 | (TODO) -- GDC | miR__isoformExp | |
| TCGA-B6-A0RP-01A-21R-A085-13 | (TODO) -- GDC | miR__geneExp | |
| TCGA-B6-A0RP-01A-21R-A085-13 | (TODO) -- GDC | miR__isoformExp | |
| TCGA-B6-A0RQ-01A-11R-A114-13 | (TODO) -- GDC | miR__geneExp | |
| TCGA-B6-A0RQ-01A-11R-A114-13 | (TODO) -- GDC | miR__isoformExp | |
| TCGA-B6-A0RS-01A-11R-A085-13 | (TODO) -- GDC | miR__geneExp | |
| TCGA-B6-A0RS-01A-11R-A085-13 | (TODO) -- GDC | miR__isoformExp | |
| TCGA-B6-A0RT-01A-21R-A085-13 | (TODO) -- GDC | miR__geneExp | |
| TCGA-B6-A0RT-01A-21R-A085-13 | (TODO) -- GDC | miR__isoformExp | |
| TCGA-B6-A0RU-01A-11R-A085-13 | (TODO) -- GDC | miR__geneExp | |
| TCGA-B6-A0RU-01A-11R-A085-13 | (TODO) -- GDC | miR__isoformExp | |
| TCGA-B6-A0RV-01A-11R-A085-13 | (TODO) -- GDC | miR__geneExp | |
| TCGA-B6-A0RV-01A-11R-A085-13 | (TODO) -- GDC | miR__isoformExp | |
| TCGA-B6-A0WS-01A-11R-A114-13 | (TODO) -- GDC | miR__geneExp | |
| TCGA-B6-A0WS-01A-11R-A114-13 | (TODO) -- GDC | miR__isoformExp | |
| TCGA-B6-A0WT-01A-11R-A108-13 | (TODO) -- GDC | miR__geneExp | |
| TCGA-B6-A0WT-01A-11R-A108-13 | (TODO) -- GDC | miR__isoformExp | |
| TCGA-B6-A0WV-01A-11R-A108-13 | (TODO) -- GDC | miR__geneExp | |
| TCGA-B6-A0WV-01A-11R-A108-13 | (TODO) -- GDC | miR__isoformExp | |
| TCGA-B6-A0WW-01A-11R-A108-13 | (TODO) -- GDC | miR__geneExp | |
| TCGA-B6-A0WW-01A-11R-A108-13 | (TODO) -- GDC | miR__isoformExp | |
| TCGA-B6-A0WX-01A-11R-A108-13 | (TODO) -- GDC | miR__geneExp | |
| TCGA-B6-A0WX-01A-11R-A108-13 | (TODO) -- GDC | miR__isoformExp | |
| TCGA-B6-A0WY-01A-11R-A108-13 | (TODO) -- GDC | miR__geneExp | |
| TCGA-B6-A0WY-01A-11R-A108-13 | (TODO) -- GDC | miR__isoformExp | |
| TCGA-B6-A0WZ-01A-11R-A108-13 | (TODO) -- GDC | miR__geneExp | |
| TCGA-B6-A0WZ-01A-11R-A108-13 | (TODO) -- GDC | miR__isoformExp | |
| TCGA-B6-A0X0-01A-21R-A114-13 | (TODO) -- GDC | miR__geneExp | |
| TCGA-B6-A0X0-01A-21R-A114-13 | (TODO) -- GDC | miR__isoformExp | |
| TCGA-B6-A0X4-01A-11R-A108-13 | (TODO) -- GDC | miR__geneExp | |
| TCGA-B6-A0X4-01A-11R-A108-13 | (TODO) -- GDC | miR__isoformExp | |
| TCGA-B6-A0X5-01A-21R-A108-13 | (TODO) -- GDC | miR__geneExp | |
| TCGA-B6-A0X5-01A-21R-A108-13 | (TODO) -- GDC | miR__isoformExp | |
| TCGA-B6-A0X7-01A-11R-A10I-13 | (TODO) -- GDC | miR__geneExp | |
| TCGA-B6-A0X7-01A-11R-A10I-13 | (TODO) -- GDC | miR__isoformExp | |
| TCGA-B6-A1KC-01A-11R-A13P-13 | (TODO) -- GDC | miR__geneExp | |
| TCGA-B6-A1KC-01A-11R-A13P-13 | (TODO) -- GDC | miR__isoformExp | |
| TCGA-B6-A1KC-01B-11R-A156-13 | (TODO) -- GDC | miR__geneExp | |
| TCGA-B6-A1KC-01B-11R-A156-13 | (TODO) -- GDC | miR__isoformExp | |
| TCGA-B6-A1KF-01A-11R-A13P-13 | (TODO) -- GDC | miR__geneExp | |
| TCGA-B6-A1KF-01A-11R-A13P-13 | (TODO) -- GDC | miR__isoformExp | |
| TCGA-B6-A1KI-01A-11R-A14L-13 | (TODO) -- GDC | miR__geneExp | |
| TCGA-B6-A1KI-01A-11R-A14L-13 | (TODO) -- GDC | miR__isoformExp | |
| TCGA-B6-A1KN-01A-11R-A13P-13 | (TODO) -- GDC | miR__geneExp | |
| TCGA-B6-A1KN-01A-11R-A13P-13 | (TODO) -- GDC | miR__isoformExp | |
| TCGA-B6-A2IU-01A-32R-A18L-13 | (TODO) -- GDC | miR__geneExp | |
| TCGA-B6-A2IU-01A-32R-A18L-13 | (TODO) -- GDC | miR__isoformExp | |
| TCGA-B6-A3ZX-01A-11R-A23A-13 | (TODO) -- GDC | miR__geneExp | |
| TCGA-B6-A3ZX-01A-11R-A23A-13 | (TODO) -- GDC | miR__isoformExp | |
| TCGA-B6-A400-01A-11R-A23A-13 | (TODO) -- GDC | miR__geneExp | |
| TCGA-B6-A400-01A-11R-A23A-13 | (TODO) -- GDC | miR__isoformExp | |
| TCGA-B6-A401-01A-11R-A23A-13 | (TODO) -- GDC | miR__geneExp | |
| TCGA-B6-A401-01A-11R-A23A-13 | (TODO) -- GDC | miR__isoformExp | |
| TCGA-B6-A402-01A-11R-A23A-13 | (TODO) -- GDC | miR__geneExp | |
| TCGA-B6-A402-01A-11R-A23A-13 | (TODO) -- GDC | miR__isoformExp | |
| TCGA-B6-A408-01A-12R-A24J-13 | (TODO) -- GDC | miR__geneExp | |
| TCGA-B6-A408-01A-12R-A24J-13 | (TODO) -- GDC | miR__isoformExp | |
| TCGA-B6-A409-01A-11R-A24J-13 | (TODO) -- GDC | miR__geneExp | |
| TCGA-B6-A409-01A-11R-A24J-13 | (TODO) -- GDC | miR__isoformExp | |
| TCGA-B6-A40B-01A-11R-A23A-13 | (TODO) -- GDC | miR__geneExp | |
| TCGA-B6-A40B-01A-11R-A23A-13 | (TODO) -- GDC | miR__isoformExp | |
| TCGA-B6-A40C-01A-11R-A23A-13 | (TODO) -- GDC | miR__geneExp | |
| TCGA-B6-A40C-01A-11R-A23A-13 | (TODO) -- GDC | miR__isoformExp | |
| TCGA-BH-A0AU-01A-11R-A12O-13 | (TODO) -- GDC | miR__geneExp | |
| TCGA-BH-A0AU-01A-11R-A12O-13 | (TODO) -- GDC | miR__isoformExp | |
| TCGA-BH-A0AV-01A-31R-A114-13 | (TODO) -- GDC | miR__geneExp | |
| TCGA-BH-A0AV-01A-31R-A114-13 | (TODO) -- GDC | miR__isoformExp | |
| TCGA-BH-A0AW-01A-11R-A057-13 | (TODO) -- GDC | miR__geneExp | |
| TCGA-BH-A0AW-01A-11R-A057-13 | (TODO) -- GDC | miR__isoformExp | |
| TCGA-BH-A0AY-01A-21R-A010-13 | (TODO) -- GDC | miR__geneExp | |
| TCGA-BH-A0AY-01A-21R-A010-13 | (TODO) -- GDC | miR__isoformExp | |
| TCGA-BH-A0AZ-01A-21R-A12O-13 | (TODO) -- GDC | miR__geneExp | |
| TCGA-BH-A0AZ-01A-21R-A12O-13 | (TODO) -- GDC | miR__isoformExp | |
| TCGA-BH-A0B0-01A-21R-A114-13 | (TODO) -- GDC | miR__geneExp | |
| TCGA-BH-A0B0-01A-21R-A114-13 | (TODO) -- GDC | miR__isoformExp | |
| TCGA-BH-A0B1-01A-12R-A057-13 | (TODO) -- GDC | miR__geneExp | |
| TCGA-BH-A0B1-01A-12R-A057-13 | (TODO) -- GDC | miR__isoformExp | |
| TCGA-BH-A0B2-01A-11R-A10I-13 | (TODO) -- GDC | miR__geneExp | |
| TCGA-BH-A0B2-01A-11R-A10I-13 | (TODO) -- GDC | miR__isoformExp | |
| TCGA-BH-A0B3-01A-11R-A057-13 | (TODO) -- GDC | miR__geneExp | |
| TCGA-BH-A0B3-01A-11R-A057-13 | (TODO) -- GDC | miR__isoformExp | |
| TCGA-BH-A0B4-01A-11R-A010-13 | (TODO) -- GDC | miR__geneExp | |
| TCGA-BH-A0B4-01A-11R-A010-13 | (TODO) -- GDC | miR__isoformExp | |
| TCGA-BH-A0B5-01A-11R-A12O-13 | (TODO) -- GDC | miR__geneExp | |
| TCGA-BH-A0B5-01A-11R-A12O-13 | (TODO) -- GDC | miR__isoformExp | |
| TCGA-BH-A0B6-01A-11R-A19V-13 | (TODO) -- GDC | miR__geneExp | |
| TCGA-BH-A0B6-01A-11R-A19V-13 | (TODO) -- GDC | miR__isoformExp | |
| TCGA-BH-A0B7-01A-12R-A114-13 | (TODO) -- GDC | miR__geneExp | |
| TCGA-BH-A0B7-01A-12R-A114-13 | (TODO) -- GDC | miR__isoformExp | |
| TCGA-BH-A0B8-01A-21R-A057-13 | (TODO) -- GDC | miR__geneExp | |
| TCGA-BH-A0B8-01A-21R-A057-13 | (TODO) -- GDC | miR__isoformExp | |
| TCGA-BH-A0B9-01A-11R-A057-13 | (TODO) -- GDC | miR__geneExp | |
| TCGA-BH-A0B9-01A-11R-A057-13 | (TODO) -- GDC | miR__isoformExp | |
| TCGA-BH-A0BA-01A-11R-A057-13 | (TODO) -- GDC | miR__geneExp | |
| TCGA-BH-A0BA-01A-11R-A057-13 | (TODO) -- GDC | miR__isoformExp | |
| TCGA-BH-A0BC-01A-22R-A085-13 | (TODO) -- GDC | miR__geneExp | |
| TCGA-BH-A0BC-01A-22R-A085-13 | (TODO) -- GDC | miR__isoformExp | |
| TCGA-BH-A0BD-01A-11R-A035-13 | (TODO) -- GDC | miR__geneExp | |
| TCGA-BH-A0BD-01A-11R-A035-13 | (TODO) -- GDC | miR__isoformExp | |
| TCGA-BH-A0BF-01A-21R-A12O-13 | (TODO) -- GDC | miR__geneExp | |
| TCGA-BH-A0BF-01A-21R-A12O-13 | (TODO) -- GDC | miR__isoformExp | |
| TCGA-BH-A0BG-01A-11R-A114-13 | (TODO) -- GDC | miR__geneExp | |
| TCGA-BH-A0BG-01A-11R-A114-13 | (TODO) -- GDC | miR__isoformExp | |
| TCGA-BH-A0BJ-01A-11R-A057-13 | (TODO) -- GDC | miR__geneExp | |
| TCGA-BH-A0BJ-01A-11R-A057-13 | (TODO) -- GDC | miR__isoformExp | |
| TCGA-BH-A0BL-01A-11R-A114-13 | (TODO) -- GDC | miR__geneExp | |
| TCGA-BH-A0BL-01A-11R-A114-13 | (TODO) -- GDC | miR__isoformExp | |
| TCGA-BH-A0BM-01A-11R-A057-13 | (TODO) -- GDC | miR__geneExp | |
| TCGA-BH-A0BM-01A-11R-A057-13 | (TODO) -- GDC | miR__isoformExp | |
| TCGA-BH-A0BO-01A-23R-A12C-13 | (TODO) -- GDC | miR__geneExp | |
| TCGA-BH-A0BO-01A-23R-A12C-13 | (TODO) -- GDC | miR__isoformExp | |
| TCGA-BH-A0BP-01A-11R-A114-13 | (TODO) -- GDC | miR__geneExp | |
| TCGA-BH-A0BP-01A-11R-A114-13 | (TODO) -- GDC | miR__isoformExp | |
| TCGA-BH-A0BQ-01A-21R-A114-13 | (TODO) -- GDC | miR__geneExp | |
| TCGA-BH-A0BQ-01A-21R-A114-13 | (TODO) -- GDC | miR__isoformExp | |
| TCGA-BH-A0BR-01A-21R-A114-13 | (TODO) -- GDC | miR__geneExp | |
| TCGA-BH-A0BR-01A-21R-A114-13 | (TODO) -- GDC | miR__isoformExp | |
| TCGA-BH-A0BS-01A-11R-A12O-13 | (TODO) -- GDC | miR__geneExp | |
| TCGA-BH-A0BS-01A-11R-A12O-13 | (TODO) -- GDC | miR__isoformExp | |
| TCGA-BH-A0BT-01A-11R-A12O-13 | (TODO) -- GDC | miR__geneExp | |
| TCGA-BH-A0BT-01A-11R-A12O-13 | (TODO) -- GDC | miR__isoformExp | |
| TCGA-BH-A0BV-01A-11R-A010-13 | (TODO) -- GDC | miR__geneExp | |
| TCGA-BH-A0BV-01A-11R-A010-13 | (TODO) -- GDC | miR__isoformExp | |
| TCGA-BH-A0BW-01A-11R-A114-13 | (TODO) -- GDC | miR__geneExp | |
| TCGA-BH-A0BW-01A-11R-A114-13 | (TODO) -- GDC | miR__isoformExp | |
| TCGA-BH-A0BZ-01A-31R-A12O-13 | (TODO) -- GDC | miR__geneExp | |
| TCGA-BH-A0BZ-01A-31R-A12O-13 | (TODO) -- GDC | miR__isoformExp | |
| TCGA-BH-A0C0-01A-21R-A057-13 | (TODO) -- GDC | miR__geneExp | |
| TCGA-BH-A0C0-01A-21R-A057-13 | (TODO) -- GDC | miR__isoformExp | |
| TCGA-BH-A0C1-01B-11R-A12C-13 | (TODO) -- GDC | miR__geneExp | |
| TCGA-BH-A0C1-01B-11R-A12C-13 | (TODO) -- GDC | miR__isoformExp | |
| TCGA-BH-A0C3-01A-21R-A12O-13 | (TODO) -- GDC | miR__geneExp | |
| TCGA-BH-A0C3-01A-21R-A12O-13 | (TODO) -- GDC | miR__isoformExp | |
| TCGA-BH-A0C7-01B-11R-A114-13 | (TODO) -- GDC | miR__geneExp | |
| TCGA-BH-A0C7-01B-11R-A114-13 | (TODO) -- GDC | miR__isoformExp | |
| TCGA-BH-A0DD-01A-31R-A12O-13 | (TODO) -- GDC | miR__geneExp | |
| TCGA-BH-A0DD-01A-31R-A12O-13 | (TODO) -- GDC | miR__isoformExp | |
| TCGA-BH-A0DE-01A-11R-A114-13 | (TODO) -- GDC | miR__geneExp | |
| TCGA-BH-A0DE-01A-11R-A114-13 | (TODO) -- GDC | miR__isoformExp | |
| TCGA-BH-A0DG-01A-21R-A12O-13 | (TODO) -- GDC | miR__geneExp | |
| TCGA-BH-A0DG-01A-21R-A12O-13 | (TODO) -- GDC | miR__isoformExp | |
| TCGA-BH-A0DH-01A-11R-A085-13 | (TODO) -- GDC | miR__geneExp | |
| TCGA-BH-A0DH-01A-11R-A085-13 | (TODO) -- GDC | miR__isoformExp | |
| TCGA-BH-A0DI-01A-21R-A12O-13 | (TODO) -- GDC | miR__geneExp | |
| TCGA-BH-A0DI-01A-21R-A12O-13 | (TODO) -- GDC | miR__isoformExp | |
| TCGA-BH-A0DK-01A-21R-A057-13 | (TODO) -- GDC | miR__geneExp | |
| TCGA-BH-A0DK-01A-21R-A057-13 | (TODO) -- GDC | miR__isoformExp | |
| TCGA-BH-A0DL-01A-11R-A114-13 | (TODO) -- GDC | miR__geneExp | |
| TCGA-BH-A0DL-01A-11R-A114-13 | (TODO) -- GDC | miR__isoformExp | |
| TCGA-BH-A0DO-01B-11R-A12C-13 | (TODO) -- GDC | miR__geneExp | |
| TCGA-BH-A0DO-01B-11R-A12C-13 | (TODO) -- GDC | miR__isoformExp | |
| TCGA-BH-A0DP-01A-21R-A057-13 | (TODO) -- GDC | miR__geneExp | |
| TCGA-BH-A0DP-01A-21R-A057-13 | (TODO) -- GDC | miR__isoformExp | |
| TCGA-BH-A0DQ-01A-11R-A085-13 | (TODO) -- GDC | miR__geneExp | |
| TCGA-BH-A0DQ-01A-11R-A085-13 | (TODO) -- GDC | miR__isoformExp | |
| TCGA-BH-A0DS-01A-11R-A057-13 | (TODO) -- GDC | miR__geneExp | |
| TCGA-BH-A0DS-01A-11R-A057-13 | (TODO) -- GDC | miR__isoformExp | |
| TCGA-BH-A0DT-01A-21R-A12C-13 | (TODO) -- GDC | miR__geneExp | |
| TCGA-BH-A0DT-01A-21R-A12C-13 | (TODO) -- GDC | miR__isoformExp | |
| TCGA-BH-A0DV-01A-21R-A12O-13 | (TODO) -- GDC | miR__geneExp | |
| TCGA-BH-A0DV-01A-21R-A12O-13 | (TODO) -- GDC | miR__isoformExp | |
| TCGA-BH-A0DX-01A-11R-A114-13 | (TODO) -- GDC | miR__geneExp | |
| TCGA-BH-A0DX-01A-11R-A114-13 | (TODO) -- GDC | miR__isoformExp | |
| TCGA-BH-A0DZ-01A-11R-A010-13 | (TODO) -- GDC | miR__geneExp | |
| TCGA-BH-A0DZ-01A-11R-A010-13 | (TODO) -- GDC | miR__isoformExp | |
| TCGA-BH-A0E0-01A-11R-A057-13 | (TODO) -- GDC | miR__geneExp | |
| TCGA-BH-A0E0-01A-11R-A057-13 | (TODO) -- GDC | miR__isoformExp | |
| TCGA-BH-A0E1-01A-11R-A057-13 | (TODO) -- GDC | miR__geneExp | |
| TCGA-BH-A0E1-01A-11R-A057-13 | (TODO) -- GDC | miR__isoformExp | |
| TCGA-BH-A0E2-01A-11R-A057-13 | (TODO) -- GDC | miR__geneExp | |
| TCGA-BH-A0E2-01A-11R-A057-13 | (TODO) -- GDC | miR__isoformExp | |
| TCGA-BH-A0E6-01A-11R-A035-13 | (TODO) -- GDC | miR__geneExp | |
| TCGA-BH-A0E6-01A-11R-A035-13 | (TODO) -- GDC | miR__isoformExp | |
| TCGA-BH-A0E7-01A-11R-A035-13 | (TODO) -- GDC | miR__geneExp | |
| TCGA-BH-A0E7-01A-11R-A035-13 | (TODO) -- GDC | miR__isoformExp | |
| TCGA-BH-A0E9-01B-11R-A114-13 | (TODO) -- GDC | miR__geneExp | |
| TCGA-BH-A0E9-01B-11R-A114-13 | (TODO) -- GDC | miR__isoformExp | |
| TCGA-BH-A0EA-01A-11R-A114-13 | (TODO) -- GDC | miR__geneExp | |
| TCGA-BH-A0EA-01A-11R-A114-13 | (TODO) -- GDC | miR__isoformExp | |
| TCGA-BH-A0EE-01A-11R-A035-13 | (TODO) -- GDC | miR__geneExp | |
| TCGA-BH-A0EE-01A-11R-A035-13 | (TODO) -- GDC | miR__isoformExp | |
| TCGA-BH-A0EI-01A-11R-A114-13 | (TODO) -- GDC | miR__geneExp | |
| TCGA-BH-A0EI-01A-11R-A114-13 | (TODO) -- GDC | miR__isoformExp | |
| TCGA-BH-A0GY-01A-11R-A057-13 | (TODO) -- GDC | miR__geneExp | |
| TCGA-BH-A0GY-01A-11R-A057-13 | (TODO) -- GDC | miR__isoformExp | |
| TCGA-BH-A0GZ-01A-11R-A057-13 | (TODO) -- GDC | miR__geneExp | |
| TCGA-BH-A0GZ-01A-11R-A057-13 | (TODO) -- GDC | miR__isoformExp | |
| TCGA-BH-A0H0-01A-11R-A057-13 | (TODO) -- GDC | miR__geneExp | |
| TCGA-BH-A0H0-01A-11R-A057-13 | (TODO) -- GDC | miR__isoformExp | |
| TCGA-BH-A0H3-01A-11R-A12O-13 | (TODO) -- GDC | miR__geneExp | |
| TCGA-BH-A0H3-01A-11R-A12O-13 | (TODO) -- GDC | miR__isoformExp | |
| TCGA-BH-A0H5-01A-21R-A114-13 | (TODO) -- GDC | miR__geneExp | |
| TCGA-BH-A0H5-01A-21R-A114-13 | (TODO) -- GDC | miR__isoformExp | |
| TCGA-BH-A0H6-01A-21R-A057-13 | (TODO) -- GDC | miR__geneExp | |
| TCGA-BH-A0H6-01A-21R-A057-13 | (TODO) -- GDC | miR__isoformExp | |
| TCGA-BH-A0H7-01A-13R-A057-13 | (TODO) -- GDC | miR__geneExp | |
| TCGA-BH-A0H7-01A-13R-A057-13 | (TODO) -- GDC | miR__isoformExp | |
| TCGA-BH-A0H9-01A-11R-A057-13 | (TODO) -- GDC | miR__geneExp | |
| TCGA-BH-A0H9-01A-11R-A057-13 | (TODO) -- GDC | miR__isoformExp | |
| TCGA-BH-A0HA-01A-11R-A12O-13 | (TODO) -- GDC | miR__geneExp | |
| TCGA-BH-A0HA-01A-11R-A12O-13 | (TODO) -- GDC | miR__isoformExp | |
| TCGA-BH-A0HB-01A-11R-A057-13 | (TODO) -- GDC | miR__geneExp | |
| TCGA-BH-A0HB-01A-11R-A057-13 | (TODO) -- GDC | miR__isoformExp | |
| TCGA-BH-A0HF-01A-11R-A057-13 | (TODO) -- GDC | miR__geneExp | |
| TCGA-BH-A0HF-01A-11R-A057-13 | (TODO) -- GDC | miR__isoformExp | |
| TCGA-BH-A0HI-01A-11R-A085-13 | (TODO) -- GDC | miR__geneExp | |
| TCGA-BH-A0HI-01A-11R-A085-13 | (TODO) -- GDC | miR__isoformExp | |
| TCGA-BH-A0HK-01A-11R-A057-13 | (TODO) -- GDC | miR__geneExp | |
| TCGA-BH-A0HK-01A-11R-A057-13 | (TODO) -- GDC | miR__isoformExp | |
| TCGA-BH-A0HL-01A-11R-A10V-13 | (TODO) -- GDC | miR__geneExp | |
| TCGA-BH-A0HL-01A-11R-A10V-13 | (TODO) -- GDC | miR__isoformExp | |
| TCGA-BH-A0HN-01A-11R-A10V-13 | (TODO) -- GDC | miR__geneExp | |
| TCGA-BH-A0HN-01A-11R-A10V-13 | (TODO) -- GDC | miR__isoformExp | |
| TCGA-BH-A0HO-01A-11R-A035-13 | (TODO) -- GDC | miR__geneExp | |
| TCGA-BH-A0HO-01A-11R-A035-13 | (TODO) -- GDC | miR__isoformExp | |
| TCGA-BH-A0HP-01A-12R-A085-13 | (TODO) -- GDC | miR__geneExp | |
| TCGA-BH-A0HP-01A-12R-A085-13 | (TODO) -- GDC | miR__isoformExp | |
| TCGA-BH-A0HQ-01A-11R-A035-13 | (TODO) -- GDC | miR__geneExp | |
| TCGA-BH-A0HQ-01A-11R-A035-13 | (TODO) -- GDC | miR__isoformExp | |
| TCGA-BH-A0HU-01A-11R-A035-13 | (TODO) -- GDC | miR__geneExp | |
| TCGA-BH-A0HU-01A-11R-A035-13 | (TODO) -- GDC | miR__isoformExp | |
| TCGA-BH-A0HW-01A-11R-A035-13 | (TODO) -- GDC | miR__geneExp | |
| TCGA-BH-A0HW-01A-11R-A035-13 | (TODO) -- GDC | miR__isoformExp | |
| TCGA-BH-A0HX-01A-21R-A057-13 | (TODO) -- GDC | miR__geneExp | |
| TCGA-BH-A0HX-01A-21R-A057-13 | (TODO) -- GDC | miR__isoformExp | |
| TCGA-BH-A0HY-01A-11R-A057-13 | (TODO) -- GDC | miR__geneExp | |
| TCGA-BH-A0HY-01A-11R-A057-13 | (TODO) -- GDC | miR__isoformExp | |
| TCGA-BH-A0RX-01A-21R-A085-13 | (TODO) -- GDC | miR__geneExp | |
| TCGA-BH-A0RX-01A-21R-A085-13 | (TODO) -- GDC | miR__isoformExp | |
| TCGA-BH-A0W3-01A-11R-A108-13 | (TODO) -- GDC | miR__geneExp | |
| TCGA-BH-A0W3-01A-11R-A108-13 | (TODO) -- GDC | miR__isoformExp | |
| TCGA-BH-A0W4-01A-11R-A108-13 | (TODO) -- GDC | miR__geneExp | |
| TCGA-BH-A0W4-01A-11R-A108-13 | (TODO) -- GDC | miR__isoformExp | |
| TCGA-BH-A0W5-01A-11R-A108-13 | (TODO) -- GDC | miR__geneExp | |
| TCGA-BH-A0W5-01A-11R-A108-13 | (TODO) -- GDC | miR__isoformExp | |
| TCGA-BH-A0W7-01A-11R-A114-13 | (TODO) -- GDC | miR__geneExp | |
| TCGA-BH-A0W7-01A-11R-A114-13 | (TODO) -- GDC | miR__isoformExp | |
| TCGA-BH-A0WA-01A-11R-A108-13 | (TODO) -- GDC | miR__geneExp | |
| TCGA-BH-A0WA-01A-11R-A108-13 | (TODO) -- GDC | miR__isoformExp | |
| TCGA-BH-A18F-01A-11R-A12C-13 | (TODO) -- GDC | miR__geneExp | |
| TCGA-BH-A18F-01A-11R-A12C-13 | (TODO) -- GDC | miR__isoformExp | |
| TCGA-BH-A18G-01A-11R-A12C-13 | (TODO) -- GDC | miR__geneExp | |
| TCGA-BH-A18G-01A-11R-A12C-13 | (TODO) -- GDC | miR__isoformExp | |
| TCGA-BH-A18H-01A-11R-A12C-13 | (TODO) -- GDC | miR__geneExp | |
| TCGA-BH-A18H-01A-11R-A12C-13 | (TODO) -- GDC | miR__isoformExp | |
| TCGA-BH-A18I-01A-11R-A12C-13 | (TODO) -- GDC | miR__geneExp | |
| TCGA-BH-A18I-01A-11R-A12C-13 | (TODO) -- GDC | miR__isoformExp | |
| TCGA-BH-A18J-01A-11R-A12C-13 | (TODO) -- GDC | miR__geneExp | |
| TCGA-BH-A18J-01A-11R-A12C-13 | (TODO) -- GDC | miR__isoformExp | |
| TCGA-BH-A18K-01A-11R-A12C-13 | (TODO) -- GDC | miR__geneExp | |
| TCGA-BH-A18K-01A-11R-A12C-13 | (TODO) -- GDC | miR__isoformExp | |
| TCGA-BH-A18L-01A-32R-A12C-13 | (TODO) -- GDC | miR__geneExp | |
| TCGA-BH-A18L-01A-32R-A12C-13 | (TODO) -- GDC | miR__isoformExp | |
| TCGA-BH-A18M-01A-11R-A12C-13 | (TODO) -- GDC | miR__geneExp | |
| TCGA-BH-A18M-01A-11R-A12C-13 | (TODO) -- GDC | miR__isoformExp | |
| TCGA-BH-A18N-01A-11R-A12C-13 | (TODO) -- GDC | miR__geneExp | |
| TCGA-BH-A18N-01A-11R-A12C-13 | (TODO) -- GDC | miR__isoformExp | |
| TCGA-BH-A18P-01A-11R-A12C-13 | (TODO) -- GDC | miR__geneExp | |
| TCGA-BH-A18P-01A-11R-A12C-13 | (TODO) -- GDC | miR__isoformExp | |
| TCGA-BH-A18Q-01A-12R-A12C-13 | (TODO) -- GDC | miR__geneExp | |
| TCGA-BH-A18Q-01A-12R-A12C-13 | (TODO) -- GDC | miR__isoformExp | |
| TCGA-BH-A18R-01A-11R-A12C-13 | (TODO) -- GDC | miR__geneExp | |
| TCGA-BH-A18R-01A-11R-A12C-13 | (TODO) -- GDC | miR__isoformExp | |
| TCGA-BH-A18S-01A-11R-A12C-13 | (TODO) -- GDC | miR__geneExp | |
| TCGA-BH-A18S-01A-11R-A12C-13 | (TODO) -- GDC | miR__isoformExp | |
| TCGA-BH-A18T-01A-11R-A12C-13 | (TODO) -- GDC | miR__geneExp | |
| TCGA-BH-A18T-01A-11R-A12C-13 | (TODO) -- GDC | miR__isoformExp | |
| TCGA-BH-A18U-01A-21R-A12C-13 | (TODO) -- GDC | miR__geneExp | |
| TCGA-BH-A18U-01A-21R-A12C-13 | (TODO) -- GDC | miR__isoformExp | |
| TCGA-BH-A18V-01A-11R-A12C-13 | (TODO) -- GDC | miR__geneExp | |
| TCGA-BH-A18V-01A-11R-A12C-13 | (TODO) -- GDC | miR__isoformExp | |
| TCGA-BH-A1EN-01A-11R-A13P-13 | (TODO) -- GDC | miR__geneExp | |
| TCGA-BH-A1EN-01A-11R-A13P-13 | (TODO) -- GDC | miR__isoformExp | |
| TCGA-BH-A1EO-01A-11R-A136-13 | (TODO) -- GDC | miR__geneExp | |
| TCGA-BH-A1EO-01A-11R-A136-13 | (TODO) -- GDC | miR__isoformExp | |
| TCGA-BH-A1ES-01A-11R-A136-13 | (TODO) -- GDC | miR__geneExp | |
| TCGA-BH-A1ES-01A-11R-A136-13 | (TODO) -- GDC | miR__isoformExp | |
| TCGA-BH-A1ET-01A-11R-A136-13 | (TODO) -- GDC | miR__geneExp | |
| TCGA-BH-A1ET-01A-11R-A136-13 | (TODO) -- GDC | miR__isoformExp | |
| TCGA-BH-A1EU-01A-11R-A136-13 | (TODO) -- GDC | miR__geneExp | |
| TCGA-BH-A1EU-01A-11R-A136-13 | (TODO) -- GDC | miR__isoformExp | |
| TCGA-BH-A1EV-01A-11R-A136-13 | (TODO) -- GDC | miR__geneExp | |
| TCGA-BH-A1EV-01A-11R-A136-13 | (TODO) -- GDC | miR__isoformExp | |
| TCGA-BH-A1EW-01A-11R-A136-13 | (TODO) -- GDC | miR__geneExp | |
| TCGA-BH-A1EW-01A-11R-A136-13 | (TODO) -- GDC | miR__isoformExp | |
| TCGA-BH-A1EX-01A-11R-A13P-13 | (TODO) -- GDC | miR__geneExp | |
| TCGA-BH-A1EX-01A-11R-A13P-13 | (TODO) -- GDC | miR__isoformExp | |
| TCGA-BH-A1EY-01A-11R-A13P-13 | (TODO) -- GDC | miR__geneExp | |
| TCGA-BH-A1EY-01A-11R-A13P-13 | (TODO) -- GDC | miR__isoformExp | |
| TCGA-BH-A1F0-01A-11R-A136-13 | (TODO) -- GDC | miR__geneExp | |
| TCGA-BH-A1F0-01A-11R-A136-13 | (TODO) -- GDC | miR__isoformExp | |
| TCGA-BH-A1F2-01A-31R-A13P-13 | (TODO) -- GDC | miR__geneExp | |
| TCGA-BH-A1F2-01A-31R-A13P-13 | (TODO) -- GDC | miR__isoformExp | |
| TCGA-BH-A1F5-01A-12R-A13P-13 | (TODO) -- GDC | miR__geneExp | |
| TCGA-BH-A1F5-01A-12R-A13P-13 | (TODO) -- GDC | miR__isoformExp | |
| TCGA-BH-A1F6-01A-11R-A13P-13 | (TODO) -- GDC | miR__geneExp | |
| TCGA-BH-A1F6-01A-11R-A13P-13 | (TODO) -- GDC | miR__isoformExp | |
| TCGA-BH-A1F8-01A-11R-A13P-13 | (TODO) -- GDC | miR__geneExp | |
| TCGA-BH-A1F8-01A-11R-A13P-13 | (TODO) -- GDC | miR__isoformExp | |
| TCGA-BH-A1FB-01A-11R-A13P-13 | (TODO) -- GDC | miR__geneExp | |
| TCGA-BH-A1FB-01A-11R-A13P-13 | (TODO) -- GDC | miR__isoformExp | |
| TCGA-BH-A1FC-01A-11R-A13P-13 | (TODO) -- GDC | miR__geneExp | |
| TCGA-BH-A1FC-01A-11R-A13P-13 | (TODO) -- GDC | miR__isoformExp | |
| TCGA-BH-A1FE-01A-11R-A13P-13 | (TODO) -- GDC | miR__geneExp | |
| TCGA-BH-A1FE-01A-11R-A13P-13 | (TODO) -- GDC | miR__isoformExp | |
| TCGA-BH-A1FG-01A-11R-A13P-13 | (TODO) -- GDC | miR__geneExp | |
| TCGA-BH-A1FG-01A-11R-A13P-13 | (TODO) -- GDC | miR__isoformExp | |
| TCGA-BH-A1FH-01A-12R-A13P-13 | (TODO) -- GDC | miR__geneExp | |
| TCGA-BH-A1FH-01A-12R-A13P-13 | (TODO) -- GDC | miR__isoformExp | |
| TCGA-BH-A1FJ-01A-11R-A13P-13 | (TODO) -- GDC | miR__geneExp | |
| TCGA-BH-A1FJ-01A-11R-A13P-13 | (TODO) -- GDC | miR__isoformExp | |
| TCGA-BH-A1FL-01A-11R-A13P-13 | (TODO) -- GDC | miR__geneExp | |
| TCGA-BH-A1FL-01A-11R-A13P-13 | (TODO) -- GDC | miR__isoformExp | |
| TCGA-BH-A1FM-01A-11R-A13P-13 | (TODO) -- GDC | miR__geneExp | |
| TCGA-BH-A1FM-01A-11R-A13P-13 | (TODO) -- GDC | miR__isoformExp | |
| TCGA-BH-A1FN-01A-11R-A13P-13 | (TODO) -- GDC | miR__geneExp | |
| TCGA-BH-A1FN-01A-11R-A13P-13 | (TODO) -- GDC | miR__isoformExp | |
| TCGA-BH-A1FR-01A-11R-A13P-13 | (TODO) -- GDC | miR__geneExp | |
| TCGA-BH-A1FR-01A-11R-A13P-13 | (TODO) -- GDC | miR__isoformExp | |
| TCGA-BH-A1FU-01A-11R-A14C-13 | (TODO) -- GDC | miR__geneExp | |
| TCGA-BH-A1FU-01A-11R-A14C-13 | (TODO) -- GDC | miR__isoformExp | |
| TCGA-BH-A201-01A-11R-A14L-13 | (TODO) -- GDC | miR__geneExp | |
| TCGA-BH-A201-01A-11R-A14L-13 | (TODO) -- GDC | miR__isoformExp | |
| TCGA-BH-A202-01A-11R-A14L-13 | (TODO) -- GDC | miR__geneExp | |
| TCGA-BH-A202-01A-11R-A14L-13 | (TODO) -- GDC | miR__isoformExp | |
| TCGA-BH-A203-01A-12R-A168-13 | (TODO) -- GDC | miR__geneExp | |
| TCGA-BH-A203-01A-12R-A168-13 | (TODO) -- GDC | miR__isoformExp | |
| TCGA-BH-A204-01A-11R-A156-13 | (TODO) -- GDC | miR__geneExp | |
| TCGA-BH-A204-01A-11R-A156-13 | (TODO) -- GDC | miR__isoformExp | |
| TCGA-BH-A208-01A-11R-A156-13 | (TODO) -- GDC | miR__geneExp | |
| TCGA-BH-A208-01A-11R-A156-13 | (TODO) -- GDC | miR__isoformExp | |
| TCGA-BH-A209-01A-11R-A156-13 | (TODO) -- GDC | miR__geneExp | |
| TCGA-BH-A209-01A-11R-A156-13 | (TODO) -- GDC | miR__isoformExp | |
| TCGA-BH-A28O-01A-11R-A22I-13 | (TODO) -- GDC | miR__geneExp | |
| TCGA-BH-A28O-01A-11R-A22I-13 | (TODO) -- GDC | miR__isoformExp | |
| TCGA-BH-A28Q-01A-11R-A16E-13 | (TODO) -- GDC | miR__geneExp | |
| TCGA-BH-A28Q-01A-11R-A16E-13 | (TODO) -- GDC | miR__isoformExp | |
| TCGA-BH-A2L8-01A-11R-A18L-13 | (TODO) -- GDC | miR__geneExp | |
| TCGA-BH-A2L8-01A-11R-A18L-13 | (TODO) -- GDC | miR__isoformExp | |
| TCGA-BH-A42T-01A-11R-A24J-13 | (TODO) -- GDC | miR__geneExp | |
| TCGA-BH-A42T-01A-11R-A24J-13 | (TODO) -- GDC | miR__isoformExp | |
| TCGA-BH-A42U-01A-12R-A24J-13 | (TODO) -- GDC | miR__geneExp | |
| TCGA-BH-A42U-01A-12R-A24J-13 | (TODO) -- GDC | miR__isoformExp | |
| TCGA-BH-A42V-01A-11R-A24J-13 | (TODO) -- GDC | miR__geneExp | |
| TCGA-BH-A42V-01A-11R-A24J-13 | (TODO) -- GDC | miR__isoformExp | |
| TCGA-BH-A5IZ-01A-11R-A27U-13 | (TODO) -- GDC | miR__geneExp | |
| TCGA-BH-A5IZ-01A-11R-A27U-13 | (TODO) -- GDC | miR__isoformExp | |
| TCGA-BH-A5J0-01A-11R-A27U-13 | (TODO) -- GDC | miR__geneExp | |
| TCGA-BH-A5J0-01A-11R-A27U-13 | (TODO) -- GDC | miR__isoformExp | |
| TCGA-BH-A6R8-01A-21R-A33A-13 | (TODO) -- GDC | miR__geneExp | |
| TCGA-BH-A6R8-01A-21R-A33A-13 | (TODO) -- GDC | miR__isoformExp | |
| TCGA-BH-A6R9-01A-21R-A32K-13 | (TODO) -- GDC | miR__geneExp | |
| TCGA-BH-A6R9-01A-21R-A32K-13 | (TODO) -- GDC | miR__isoformExp | |
| TCGA-BH-A8FY-01A-11R-A36A-13 | (TODO) -- GDC | miR__geneExp | |
| TCGA-BH-A8FY-01A-11R-A36A-13 | (TODO) -- GDC | miR__isoformExp | |
| TCGA-BH-A8FZ-01A-11R-A358-13 | (TODO) -- GDC | miR__geneExp | |
| TCGA-BH-A8FZ-01A-11R-A358-13 | (TODO) -- GDC | miR__isoformExp | |
| TCGA-BH-A8G0-01A-11R-A358-13 | (TODO) -- GDC | miR__geneExp | |
| TCGA-BH-A8G0-01A-11R-A358-13 | (TODO) -- GDC | miR__isoformExp | |
| TCGA-BH-AB28-01A-31R-A41G-13 | (TODO) -- GDC | miR__geneExp | |
| TCGA-BH-AB28-01A-31R-A41G-13 | (TODO) -- GDC | miR__isoformExp | |
| TCGA-C8-A12K-01A-21R-A114-13 | (TODO) -- GDC | miR__geneExp | |
| TCGA-C8-A12K-01A-21R-A114-13 | (TODO) -- GDC | miR__isoformExp | |
| TCGA-C8-A12L-01A-11R-A114-13 | (TODO) -- GDC | miR__geneExp | |
| TCGA-C8-A12L-01A-11R-A114-13 | (TODO) -- GDC | miR__isoformExp | |
| TCGA-C8-A12M-01A-11R-A114-13 | (TODO) -- GDC | miR__geneExp | |
| TCGA-C8-A12M-01A-11R-A114-13 | (TODO) -- GDC | miR__isoformExp | |
| TCGA-C8-A12N-01A-11R-A114-13 | (TODO) -- GDC | miR__geneExp | |
| TCGA-C8-A12N-01A-11R-A114-13 | (TODO) -- GDC | miR__isoformExp | |
| TCGA-C8-A12O-01A-11R-A114-13 | (TODO) -- GDC | miR__geneExp | |
| TCGA-C8-A12O-01A-11R-A114-13 | (TODO) -- GDC | miR__isoformExp | |
| TCGA-C8-A12P-01A-11R-A114-13 | (TODO) -- GDC | miR__geneExp | |
| TCGA-C8-A12P-01A-11R-A114-13 | (TODO) -- GDC | miR__isoformExp | |
| TCGA-C8-A12Q-01A-11R-A114-13 | (TODO) -- GDC | miR__geneExp | |
| TCGA-C8-A12Q-01A-11R-A114-13 | (TODO) -- GDC | miR__isoformExp | |
| TCGA-C8-A12T-01A-11R-A114-13 | (TODO) -- GDC | miR__geneExp | |
| TCGA-C8-A12T-01A-11R-A114-13 | (TODO) -- GDC | miR__isoformExp | |
| TCGA-C8-A12U-01A-11R-A114-13 | (TODO) -- GDC | miR__geneExp | |
| TCGA-C8-A12U-01A-11R-A114-13 | (TODO) -- GDC | miR__isoformExp | |
| TCGA-C8-A12V-01A-11R-A114-13 | (TODO) -- GDC | miR__geneExp | |
| TCGA-C8-A12V-01A-11R-A114-13 | (TODO) -- GDC | miR__isoformExp | |
| TCGA-C8-A12W-01A-11R-A114-13 | (TODO) -- GDC | miR__geneExp | |
| TCGA-C8-A12W-01A-11R-A114-13 | (TODO) -- GDC | miR__isoformExp | |
| TCGA-C8-A12X-01A-11R-A114-13 | (TODO) -- GDC | miR__geneExp | |
| TCGA-C8-A12X-01A-11R-A114-13 | (TODO) -- GDC | miR__isoformExp | |
| TCGA-C8-A12Y-01A-11R-A12C-13 | (TODO) -- GDC | miR__geneExp | |
| TCGA-C8-A12Y-01A-11R-A12C-13 | (TODO) -- GDC | miR__isoformExp | |
| TCGA-C8-A12Z-01A-11R-A114-13 | (TODO) -- GDC | miR__geneExp | |
| TCGA-C8-A12Z-01A-11R-A114-13 | (TODO) -- GDC | miR__isoformExp | |
| TCGA-C8-A130-01A-31R-A114-13 | (TODO) -- GDC | miR__geneExp | |
| TCGA-C8-A130-01A-31R-A114-13 | (TODO) -- GDC | miR__isoformExp | |
| TCGA-C8-A131-01A-11R-A114-13 | (TODO) -- GDC | miR__geneExp | |
| TCGA-C8-A131-01A-11R-A114-13 | (TODO) -- GDC | miR__isoformExp | |
| TCGA-C8-A132-01A-31R-A114-13 | (TODO) -- GDC | miR__geneExp | |
| TCGA-C8-A132-01A-31R-A114-13 | (TODO) -- GDC | miR__isoformExp | |
| TCGA-C8-A133-01A-32R-A12C-13 | (TODO) -- GDC | miR__geneExp | |
| TCGA-C8-A133-01A-32R-A12C-13 | (TODO) -- GDC | miR__isoformExp | |
| TCGA-C8-A134-01A-11R-A114-13 | (TODO) -- GDC | miR__geneExp | |
| TCGA-C8-A134-01A-11R-A114-13 | (TODO) -- GDC | miR__isoformExp | |
| TCGA-C8-A135-01A-11R-A114-13 | (TODO) -- GDC | miR__geneExp | |
| TCGA-C8-A135-01A-11R-A114-13 | (TODO) -- GDC | miR__isoformExp | |
| TCGA-C8-A137-01A-11R-A114-13 | (TODO) -- GDC | miR__geneExp | |
| TCGA-C8-A137-01A-11R-A114-13 | (TODO) -- GDC | miR__isoformExp | |
| TCGA-C8-A138-01A-11R-A114-13 | (TODO) -- GDC | miR__geneExp | |
| TCGA-C8-A138-01A-11R-A114-13 | (TODO) -- GDC | miR__isoformExp | |
| TCGA-C8-A1HE-01A-11R-A13P-13 | (TODO) -- GDC | miR__geneExp | |
| TCGA-C8-A1HE-01A-11R-A13P-13 | (TODO) -- GDC | miR__isoformExp | |
| TCGA-C8-A1HF-01A-11R-A136-13 | (TODO) -- GDC | miR__geneExp | |
| TCGA-C8-A1HF-01A-11R-A136-13 | (TODO) -- GDC | miR__isoformExp | |
| TCGA-C8-A1HG-01A-11R-A136-13 | (TODO) -- GDC | miR__geneExp | |
| TCGA-C8-A1HG-01A-11R-A136-13 | (TODO) -- GDC | miR__isoformExp | |
| TCGA-C8-A1HI-01A-11R-A136-13 | (TODO) -- GDC | miR__geneExp | |
| TCGA-C8-A1HI-01A-11R-A136-13 | (TODO) -- GDC | miR__isoformExp | |
| TCGA-C8-A1HJ-01A-11R-A13P-13 | (TODO) -- GDC | miR__geneExp | |
| TCGA-C8-A1HJ-01A-11R-A13P-13 | (TODO) -- GDC | miR__isoformExp | |
| TCGA-C8-A1HK-01A-21R-A13P-13 | (TODO) -- GDC | miR__geneExp | |
| TCGA-C8-A1HK-01A-21R-A13P-13 | (TODO) -- GDC | miR__isoformExp | |
| TCGA-C8-A1HL-01A-11R-A136-13 | (TODO) -- GDC | miR__geneExp | |
| TCGA-C8-A1HL-01A-11R-A136-13 | (TODO) -- GDC | miR__isoformExp | |
| TCGA-C8-A1HM-01A-12R-A136-13 | (TODO) -- GDC | miR__geneExp | |
| TCGA-C8-A1HM-01A-12R-A136-13 | (TODO) -- GDC | miR__isoformExp | |
| TCGA-C8-A1HN-01A-11R-A136-13 | (TODO) -- GDC | miR__geneExp | |
| TCGA-C8-A1HN-01A-11R-A136-13 | (TODO) -- GDC | miR__isoformExp | |
| TCGA-C8-A1HO-01A-11R-A13P-13 | (TODO) -- GDC | miR__geneExp | |
| TCGA-C8-A1HO-01A-11R-A13P-13 | (TODO) -- GDC | miR__isoformExp | |
| TCGA-C8-A26V-01A-11R-A16E-13 | (TODO) -- GDC | miR__geneExp | |
| TCGA-C8-A26V-01A-11R-A16E-13 | (TODO) -- GDC | miR__isoformExp | |
| TCGA-C8-A26W-01A-11R-A16E-13 | (TODO) -- GDC | miR__geneExp | |
| TCGA-C8-A26W-01A-11R-A16E-13 | (TODO) -- GDC | miR__isoformExp | |
| TCGA-C8-A26X-01A-31R-A16E-13 | (TODO) -- GDC | miR__geneExp | |
| TCGA-C8-A26X-01A-31R-A16E-13 | (TODO) -- GDC | miR__isoformExp | |
| TCGA-C8-A26Y-01A-11R-A16E-13 | (TODO) -- GDC | miR__geneExp | |
| TCGA-C8-A26Y-01A-11R-A16E-13 | (TODO) -- GDC | miR__isoformExp | |
| TCGA-C8-A26Z-01A-11R-A16E-13 | (TODO) -- GDC | miR__geneExp | |
| TCGA-C8-A26Z-01A-11R-A16E-13 | (TODO) -- GDC | miR__isoformExp | |
| TCGA-C8-A273-01A-11R-A16E-13 | (TODO) -- GDC | miR__geneExp | |
| TCGA-C8-A273-01A-11R-A16E-13 | (TODO) -- GDC | miR__isoformExp | |
| TCGA-C8-A274-01A-11R-A16E-13 | (TODO) -- GDC | miR__geneExp | |
| TCGA-C8-A274-01A-11R-A16E-13 | (TODO) -- GDC | miR__isoformExp | |
| TCGA-C8-A275-01A-21R-A16E-13 | (TODO) -- GDC | miR__geneExp | |
| TCGA-C8-A275-01A-21R-A16E-13 | (TODO) -- GDC | miR__isoformExp | |
| TCGA-C8-A278-01A-11R-A168-13 | (TODO) -- GDC | miR__geneExp | |
| TCGA-C8-A278-01A-11R-A168-13 | (TODO) -- GDC | miR__isoformExp | |
| TCGA-C8-A27A-01A-11R-A168-13 | (TODO) -- GDC | miR__geneExp | |
| TCGA-C8-A27A-01A-11R-A168-13 | (TODO) -- GDC | miR__isoformExp | |
| TCGA-C8-A27B-01A-11R-A168-13 | (TODO) -- GDC | miR__geneExp | |
| TCGA-C8-A27B-01A-11R-A168-13 | (TODO) -- GDC | miR__isoformExp | |
| TCGA-C8-A3M7-01A-12R-A21U-13 | (TODO) -- GDC | miR__geneExp | |
| TCGA-C8-A3M7-01A-12R-A21U-13 | (TODO) -- GDC | miR__isoformExp | |
| TCGA-C8-A3M8-01A-11R-A214-13 | (TODO) -- GDC | miR__geneExp | |
| TCGA-C8-A3M8-01A-11R-A214-13 | (TODO) -- GDC | miR__isoformExp | |
| TCGA-C8-A8HP-01A-11R-A36A-13 | (TODO) -- GDC | miR__geneExp | |
| TCGA-C8-A8HP-01A-11R-A36A-13 | (TODO) -- GDC | miR__isoformExp | |
| TCGA-C8-A8HQ-01A-11R-A36A-13 | (TODO) -- GDC | miR__geneExp | |
| TCGA-C8-A8HQ-01A-11R-A36A-13 | (TODO) -- GDC | miR__isoformExp | |
| TCGA-C8-A8HR-01A-11R-A36A-13 | (TODO) -- GDC | miR__geneExp | |
| TCGA-C8-A8HR-01A-11R-A36A-13 | (TODO) -- GDC | miR__isoformExp | |
| TCGA-C8-A9FZ-01A-11R-A41G-13 | (TODO) -- GDC | miR__geneExp | |
| TCGA-C8-A9FZ-01A-11R-A41G-13 | (TODO) -- GDC | miR__isoformExp | |
| TCGA-D8-A13Y-01A-11R-A114-13 | (TODO) -- GDC | miR__geneExp | |
| TCGA-D8-A13Y-01A-11R-A114-13 | (TODO) -- GDC | miR__isoformExp | |
| TCGA-D8-A13Z-01A-11R-A114-13 | (TODO) -- GDC | miR__geneExp | |
| TCGA-D8-A13Z-01A-11R-A114-13 | (TODO) -- GDC | miR__isoformExp | |
| TCGA-D8-A140-01A-11R-A114-13 | (TODO) -- GDC | miR__geneExp | |
| TCGA-D8-A140-01A-11R-A114-13 | (TODO) -- GDC | miR__isoformExp | |
| TCGA-D8-A141-01A-11R-A114-13 | (TODO) -- GDC | miR__geneExp | |
| TCGA-D8-A141-01A-11R-A114-13 | (TODO) -- GDC | miR__isoformExp | |
| TCGA-D8-A142-01A-11R-A114-13 | (TODO) -- GDC | miR__geneExp | |
| TCGA-D8-A142-01A-11R-A114-13 | (TODO) -- GDC | miR__isoformExp | |
| TCGA-D8-A143-01A-11R-A114-13 | (TODO) -- GDC | miR__geneExp | |
| TCGA-D8-A143-01A-11R-A114-13 | (TODO) -- GDC | miR__isoformExp | |
| TCGA-D8-A145-01A-11R-A114-13 | (TODO) -- GDC | miR__geneExp | |
| TCGA-D8-A145-01A-11R-A114-13 | (TODO) -- GDC | miR__isoformExp | |
| TCGA-D8-A146-01A-31R-A114-13 | (TODO) -- GDC | miR__geneExp | |
| TCGA-D8-A146-01A-31R-A114-13 | (TODO) -- GDC | miR__isoformExp | |
| TCGA-D8-A147-01A-11R-A114-13 | (TODO) -- GDC | miR__geneExp | |
| TCGA-D8-A147-01A-11R-A114-13 | (TODO) -- GDC | miR__isoformExp | |
| TCGA-D8-A1J8-01A-11R-A13P-13 | (TODO) -- GDC | miR__geneExp | |
| TCGA-D8-A1J8-01A-11R-A13P-13 | (TODO) -- GDC | miR__isoformExp | |
| TCGA-D8-A1J9-01A-11R-A13P-13 | (TODO) -- GDC | miR__geneExp | |
| TCGA-D8-A1J9-01A-11R-A13P-13 | (TODO) -- GDC | miR__isoformExp | |
| TCGA-D8-A1JA-01A-11R-A13P-13 | (TODO) -- GDC | miR__geneExp | |
| TCGA-D8-A1JA-01A-11R-A13P-13 | (TODO) -- GDC | miR__isoformExp | |
| TCGA-D8-A1JB-01A-11R-A13P-13 | (TODO) -- GDC | miR__geneExp | |
| TCGA-D8-A1JB-01A-11R-A13P-13 | (TODO) -- GDC | miR__isoformExp | |
| TCGA-D8-A1JC-01A-11R-A13P-13 | (TODO) -- GDC | miR__geneExp | |
| TCGA-D8-A1JC-01A-11R-A13P-13 | (TODO) -- GDC | miR__isoformExp | |
| TCGA-D8-A1JD-01A-11R-A13P-13 | (TODO) -- GDC | miR__geneExp | |
| TCGA-D8-A1JD-01A-11R-A13P-13 | (TODO) -- GDC | miR__isoformExp | |
| TCGA-D8-A1JE-01A-11R-A13P-13 | (TODO) -- GDC | miR__geneExp | |
| TCGA-D8-A1JE-01A-11R-A13P-13 | (TODO) -- GDC | miR__isoformExp | |
| TCGA-D8-A1JF-01A-11R-A13P-13 | (TODO) -- GDC | miR__geneExp | |
| TCGA-D8-A1JF-01A-11R-A13P-13 | (TODO) -- GDC | miR__isoformExp | |
| TCGA-D8-A1JG-01B-11R-A13P-13 | (TODO) -- GDC | miR__geneExp | |
| TCGA-D8-A1JG-01B-11R-A13P-13 | (TODO) -- GDC | miR__isoformExp | |
| TCGA-D8-A1JH-01A-11R-A13P-13 | (TODO) -- GDC | miR__geneExp | |
| TCGA-D8-A1JH-01A-11R-A13P-13 | (TODO) -- GDC | miR__isoformExp | |
| TCGA-D8-A1JI-01A-11R-A13P-13 | (TODO) -- GDC | miR__geneExp | |
| TCGA-D8-A1JI-01A-11R-A13P-13 | (TODO) -- GDC | miR__isoformExp | |
| TCGA-D8-A1JJ-01A-31R-A14L-13 | (TODO) -- GDC | miR__geneExp | |
| TCGA-D8-A1JJ-01A-31R-A14L-13 | (TODO) -- GDC | miR__isoformExp | |
| TCGA-D8-A1JK-01A-11R-A13P-13 | (TODO) -- GDC | miR__geneExp | |
| TCGA-D8-A1JK-01A-11R-A13P-13 | (TODO) -- GDC | miR__isoformExp | |
| TCGA-D8-A1JL-01A-11R-A13P-13 | (TODO) -- GDC | miR__geneExp | |
| TCGA-D8-A1JL-01A-11R-A13P-13 | (TODO) -- GDC | miR__isoformExp | |
| TCGA-D8-A1JN-01A-11R-A13P-13 | (TODO) -- GDC | miR__geneExp | |
| TCGA-D8-A1JN-01A-11R-A13P-13 | (TODO) -- GDC | miR__isoformExp | |
| TCGA-D8-A1JP-01A-11R-A13P-13 | (TODO) -- GDC | miR__geneExp | |
| TCGA-D8-A1JP-01A-11R-A13P-13 | (TODO) -- GDC | miR__isoformExp | |
| TCGA-D8-A1JS-01A-11R-A13P-13 | (TODO) -- GDC | miR__geneExp | |
| TCGA-D8-A1JS-01A-11R-A13P-13 | (TODO) -- GDC | miR__isoformExp | |
| TCGA-D8-A1JT-01A-31R-A13P-13 | (TODO) -- GDC | miR__geneExp | |
| TCGA-D8-A1JT-01A-31R-A13P-13 | (TODO) -- GDC | miR__isoformExp | |
| TCGA-D8-A1JU-01A-11R-A13P-13 | (TODO) -- GDC | miR__geneExp | |
| TCGA-D8-A1JU-01A-11R-A13P-13 | (TODO) -- GDC | miR__isoformExp | |
| TCGA-D8-A1X5-01A-11R-A14C-13 | (TODO) -- GDC | miR__geneExp | |
| TCGA-D8-A1X5-01A-11R-A14C-13 | (TODO) -- GDC | miR__isoformExp | |
| TCGA-D8-A1X6-01A-11R-A14L-13 | (TODO) -- GDC | miR__geneExp | |
| TCGA-D8-A1X6-01A-11R-A14L-13 | (TODO) -- GDC | miR__isoformExp | |
| TCGA-D8-A1X7-01A-11R-A14L-13 | (TODO) -- GDC | miR__geneExp | |
| TCGA-D8-A1X7-01A-11R-A14L-13 | (TODO) -- GDC | miR__isoformExp | |
| TCGA-D8-A1X8-01A-11R-A14L-13 | (TODO) -- GDC | miR__geneExp | |
| TCGA-D8-A1X8-01A-11R-A14L-13 | (TODO) -- GDC | miR__isoformExp | |
| TCGA-D8-A1X9-01A-12R-A156-13 | (TODO) -- GDC | miR__geneExp | |
| TCGA-D8-A1X9-01A-12R-A156-13 | (TODO) -- GDC | miR__isoformExp | |
| TCGA-D8-A1XA-01A-11R-A14C-13 | (TODO) -- GDC | miR__geneExp | |
| TCGA-D8-A1XA-01A-11R-A14C-13 | (TODO) -- GDC | miR__isoformExp | |
| TCGA-D8-A1XB-01A-11R-A14C-13 | (TODO) -- GDC | miR__geneExp | |
| TCGA-D8-A1XB-01A-11R-A14C-13 | (TODO) -- GDC | miR__isoformExp | |
| TCGA-D8-A1XC-01A-11R-A14C-13 | (TODO) -- GDC | miR__geneExp | |
| TCGA-D8-A1XC-01A-11R-A14C-13 | (TODO) -- GDC | miR__isoformExp | |
| TCGA-D8-A1XD-01A-11R-A14C-13 | (TODO) -- GDC | miR__geneExp | |
| TCGA-D8-A1XD-01A-11R-A14C-13 | (TODO) -- GDC | miR__isoformExp | |
| TCGA-D8-A1XF-01A-11R-A14C-13 | (TODO) -- GDC | miR__geneExp | |
| TCGA-D8-A1XF-01A-11R-A14C-13 | (TODO) -- GDC | miR__isoformExp | |
| TCGA-D8-A1XG-01A-11R-A14C-13 | (TODO) -- GDC | miR__geneExp | |
| TCGA-D8-A1XG-01A-11R-A14C-13 | (TODO) -- GDC | miR__isoformExp | |
| TCGA-D8-A1XJ-01A-11R-A14L-13 | (TODO) -- GDC | miR__geneExp | |
| TCGA-D8-A1XJ-01A-11R-A14L-13 | (TODO) -- GDC | miR__isoformExp | |
| TCGA-D8-A1XK-01A-21R-A14L-13 | (TODO) -- GDC | miR__geneExp | |
| TCGA-D8-A1XK-01A-21R-A14L-13 | (TODO) -- GDC | miR__isoformExp | |
| TCGA-D8-A1XL-01A-11R-A14L-13 | (TODO) -- GDC | miR__geneExp | |
| TCGA-D8-A1XL-01A-11R-A14L-13 | (TODO) -- GDC | miR__isoformExp | |
| TCGA-D8-A1XM-01A-21R-A14L-13 | (TODO) -- GDC | miR__geneExp | |
| TCGA-D8-A1XM-01A-21R-A14L-13 | (TODO) -- GDC | miR__isoformExp | |
| TCGA-D8-A1XO-01A-11R-A14L-13 | (TODO) -- GDC | miR__geneExp | |
| TCGA-D8-A1XO-01A-11R-A14L-13 | (TODO) -- GDC | miR__isoformExp | |
| TCGA-D8-A1XQ-01A-11R-A14L-13 | (TODO) -- GDC | miR__geneExp | |
| TCGA-D8-A1XQ-01A-11R-A14L-13 | (TODO) -- GDC | miR__isoformExp | |
| TCGA-D8-A1XR-01A-11R-A14L-13 | (TODO) -- GDC | miR__geneExp | |
| TCGA-D8-A1XR-01A-11R-A14L-13 | (TODO) -- GDC | miR__isoformExp | |
| TCGA-D8-A1XS-01A-11R-A14L-13 | (TODO) -- GDC | miR__geneExp | |
| TCGA-D8-A1XS-01A-11R-A14L-13 | (TODO) -- GDC | miR__isoformExp | |
| TCGA-D8-A1XT-01A-11R-A14L-13 | (TODO) -- GDC | miR__geneExp | |
| TCGA-D8-A1XT-01A-11R-A14L-13 | (TODO) -- GDC | miR__isoformExp | |
| TCGA-D8-A1XU-01A-11R-A14L-13 | (TODO) -- GDC | miR__geneExp | |
| TCGA-D8-A1XU-01A-11R-A14L-13 | (TODO) -- GDC | miR__isoformExp | |
| TCGA-D8-A1XV-01A-11R-A14L-13 | (TODO) -- GDC | miR__geneExp | |
| TCGA-D8-A1XV-01A-11R-A14L-13 | (TODO) -- GDC | miR__isoformExp | |
| TCGA-D8-A1XW-01A-11R-A14L-13 | (TODO) -- GDC | miR__geneExp | |
| TCGA-D8-A1XW-01A-11R-A14L-13 | (TODO) -- GDC | miR__isoformExp | |
| TCGA-D8-A1XY-01A-11R-A14L-13 | (TODO) -- GDC | miR__geneExp | |
| TCGA-D8-A1XY-01A-11R-A14L-13 | (TODO) -- GDC | miR__isoformExp | |
| TCGA-D8-A1XZ-01A-11R-A14L-13 | (TODO) -- GDC | miR__geneExp | |
| TCGA-D8-A1XZ-01A-11R-A14L-13 | (TODO) -- GDC | miR__isoformExp | |
| TCGA-D8-A1Y0-01A-11R-A14L-13 | (TODO) -- GDC | miR__geneExp | |
| TCGA-D8-A1Y0-01A-11R-A14L-13 | (TODO) -- GDC | miR__isoformExp | |
| TCGA-D8-A1Y1-01A-21R-A14L-13 | (TODO) -- GDC | miR__geneExp | |
| TCGA-D8-A1Y1-01A-21R-A14L-13 | (TODO) -- GDC | miR__isoformExp | |
| TCGA-D8-A1Y2-01A-11R-A156-13 | (TODO) -- GDC | miR__geneExp | |
| TCGA-D8-A1Y2-01A-11R-A156-13 | (TODO) -- GDC | miR__isoformExp | |
| TCGA-D8-A1Y3-01A-11R-A156-13 | (TODO) -- GDC | miR__geneExp | |
| TCGA-D8-A1Y3-01A-11R-A156-13 | (TODO) -- GDC | miR__isoformExp | |
| TCGA-D8-A27E-01A-11R-A16E-13 | (TODO) -- GDC | miR__geneExp | |
| TCGA-D8-A27E-01A-11R-A16E-13 | (TODO) -- GDC | miR__isoformExp | |
| TCGA-D8-A27F-01A-11R-A16E-13 | (TODO) -- GDC | miR__geneExp | |
| TCGA-D8-A27F-01A-11R-A16E-13 | (TODO) -- GDC | miR__isoformExp | |
| TCGA-D8-A27G-01A-11R-A16E-13 | (TODO) -- GDC | miR__geneExp | |
| TCGA-D8-A27G-01A-11R-A16E-13 | (TODO) -- GDC | miR__isoformExp | |
| TCGA-D8-A27H-01A-11R-A16E-13 | (TODO) -- GDC | miR__geneExp | |
| TCGA-D8-A27H-01A-11R-A16E-13 | (TODO) -- GDC | miR__isoformExp | |
| TCGA-D8-A27I-01A-11R-A16E-13 | (TODO) -- GDC | miR__geneExp | |
| TCGA-D8-A27I-01A-11R-A16E-13 | (TODO) -- GDC | miR__isoformExp | |
| TCGA-D8-A27K-01A-11R-A16E-13 | (TODO) -- GDC | miR__geneExp | |
| TCGA-D8-A27K-01A-11R-A16E-13 | (TODO) -- GDC | miR__isoformExp | |
| TCGA-D8-A27L-01A-11R-A16E-13 | (TODO) -- GDC | miR__geneExp | |
| TCGA-D8-A27L-01A-11R-A16E-13 | (TODO) -- GDC | miR__isoformExp | |
| TCGA-D8-A27M-01A-11R-A16E-13 | (TODO) -- GDC | miR__geneExp | |
| TCGA-D8-A27M-01A-11R-A16E-13 | (TODO) -- GDC | miR__isoformExp | |
| TCGA-D8-A27N-01A-11R-A16E-13 | (TODO) -- GDC | miR__geneExp | |
| TCGA-D8-A27N-01A-11R-A16E-13 | (TODO) -- GDC | miR__isoformExp | |
| TCGA-D8-A27P-01A-11R-A16E-13 | (TODO) -- GDC | miR__geneExp | |
| TCGA-D8-A27P-01A-11R-A16E-13 | (TODO) -- GDC | miR__isoformExp | |
| TCGA-D8-A27R-01A-11R-A16E-13 | (TODO) -- GDC | miR__geneExp | |
| TCGA-D8-A27R-01A-11R-A16E-13 | (TODO) -- GDC | miR__isoformExp | |
| TCGA-D8-A27T-01A-11R-A16E-13 | (TODO) -- GDC | miR__geneExp | |
| TCGA-D8-A27T-01A-11R-A16E-13 | (TODO) -- GDC | miR__isoformExp | |
| TCGA-D8-A27V-01A-12R-A17A-13 | (TODO) -- GDC | miR__geneExp | |
| TCGA-D8-A27V-01A-12R-A17A-13 | (TODO) -- GDC | miR__isoformExp | |
| TCGA-D8-A27W-01A-11R-A16E-13 | (TODO) -- GDC | miR__geneExp | |
| TCGA-D8-A27W-01A-11R-A16E-13 | (TODO) -- GDC | miR__isoformExp | |
| TCGA-D8-A3Z5-01A-41R-A24J-13 | (TODO) -- GDC | miR__geneExp | |
| TCGA-D8-A3Z5-01A-41R-A24J-13 | (TODO) -- GDC | miR__isoformExp | |
| TCGA-D8-A3Z6-01A-11R-A23A-13 | (TODO) -- GDC | miR__geneExp | |
| TCGA-D8-A3Z6-01A-11R-A23A-13 | (TODO) -- GDC | miR__isoformExp | |
| TCGA-D8-A4Z1-01A-21R-A25Z-13 | (TODO) -- GDC | miR__geneExp | |
| TCGA-D8-A4Z1-01A-21R-A25Z-13 | (TODO) -- GDC | miR__isoformExp | |
| TCGA-D8-A73U-01A-11R-A33A-13 | (TODO) -- GDC | miR__geneExp | |
| TCGA-D8-A73U-01A-11R-A33A-13 | (TODO) -- GDC | miR__isoformExp | |
| TCGA-D8-A73W-01A-22R-A358-13 | (TODO) -- GDC | miR__geneExp | |
| TCGA-D8-A73W-01A-22R-A358-13 | (TODO) -- GDC | miR__isoformExp | |
| TCGA-D8-A73X-01A-11R-A32K-13 | (TODO) -- GDC | miR__geneExp | |
| TCGA-D8-A73X-01A-11R-A32K-13 | (TODO) -- GDC | miR__isoformExp | |
| TCGA-E2-A105-01A-11R-A10I-13 | (TODO) -- GDC | miR__geneExp | |
| TCGA-E2-A105-01A-11R-A10I-13 | (TODO) -- GDC | miR__isoformExp | |
| TCGA-E2-A106-01A-11R-A10I-13 | (TODO) -- GDC | miR__geneExp | |
| TCGA-E2-A106-01A-11R-A10I-13 | (TODO) -- GDC | miR__isoformExp | |
| TCGA-E2-A107-01A-11R-A10I-13 | (TODO) -- GDC | miR__geneExp | |
| TCGA-E2-A107-01A-11R-A10I-13 | (TODO) -- GDC | miR__isoformExp | |
| TCGA-E2-A108-01A-13R-A10I-13 | (TODO) -- GDC | miR__geneExp | |
| TCGA-E2-A108-01A-13R-A10I-13 | (TODO) -- GDC | miR__isoformExp | |
| TCGA-E2-A109-01A-11R-A10I-13 | (TODO) -- GDC | miR__geneExp | |
| TCGA-E2-A109-01A-11R-A10I-13 | (TODO) -- GDC | miR__isoformExp | |
| TCGA-E2-A10A-01A-21R-A114-13 | (TODO) -- GDC | miR__geneExp | |
| TCGA-E2-A10A-01A-21R-A114-13 | (TODO) -- GDC | miR__isoformExp | |
| TCGA-E2-A10B-01A-11R-A10I-13 | (TODO) -- GDC | miR__geneExp | |
| TCGA-E2-A10B-01A-11R-A10I-13 | (TODO) -- GDC | miR__isoformExp | |
| TCGA-E2-A10C-01A-21R-A10I-13 | (TODO) -- GDC | miR__geneExp | |
| TCGA-E2-A10C-01A-21R-A10I-13 | (TODO) -- GDC | miR__isoformExp | |
| TCGA-E2-A10E-01A-21R-A10I-13 | (TODO) -- GDC | miR__geneExp | |
| TCGA-E2-A10E-01A-21R-A10I-13 | (TODO) -- GDC | miR__isoformExp | |
| TCGA-E2-A10F-01A-11R-A10I-13 | (TODO) -- GDC | miR__geneExp | |
| TCGA-E2-A10F-01A-11R-A10I-13 | (TODO) -- GDC | miR__isoformExp | |
| TCGA-E2-A14N-01A-31R-A136-13 | (TODO) -- GDC | miR__geneExp | |
| TCGA-E2-A14N-01A-31R-A136-13 | (TODO) -- GDC | miR__isoformExp | |
| TCGA-E2-A14O-01A-31R-A114-13 | (TODO) -- GDC | miR__geneExp | |
| TCGA-E2-A14O-01A-31R-A114-13 | (TODO) -- GDC | miR__isoformExp | |
| TCGA-E2-A14P-01A-31R-A12C-13 | (TODO) -- GDC | miR__geneExp | |
| TCGA-E2-A14P-01A-31R-A12C-13 | (TODO) -- GDC | miR__isoformExp | |
| TCGA-E2-A14Q-01A-11R-A12C-13 | (TODO) -- GDC | miR__geneExp | |
| TCGA-E2-A14Q-01A-11R-A12C-13 | (TODO) -- GDC | miR__isoformExp | |
| TCGA-E2-A14R-01A-11R-A114-13 | (TODO) -- GDC | miR__geneExp | |
| TCGA-E2-A14R-01A-11R-A114-13 | (TODO) -- GDC | miR__isoformExp | |
| TCGA-E2-A14S-01A-11R-A12C-13 | (TODO) -- GDC | miR__geneExp | |
| TCGA-E2-A14S-01A-11R-A12C-13 | (TODO) -- GDC | miR__isoformExp | |
| TCGA-E2-A14T-01A-11R-A114-13 | (TODO) -- GDC | miR__geneExp | |
| TCGA-E2-A14T-01A-11R-A114-13 | (TODO) -- GDC | miR__isoformExp | |
| TCGA-E2-A14U-01A-11R-A22I-13 | (TODO) -- GDC | miR__geneExp | |
| TCGA-E2-A14U-01A-11R-A22I-13 | (TODO) -- GDC | miR__isoformExp | |
| TCGA-E2-A14V-01A-11R-A12C-13 | (TODO) -- GDC | miR__geneExp | |
| TCGA-E2-A14V-01A-11R-A12C-13 | (TODO) -- GDC | miR__isoformExp | |
| TCGA-E2-A14W-01A-11R-A12C-13 | (TODO) -- GDC | miR__geneExp | |
| TCGA-E2-A14W-01A-11R-A12C-13 | (TODO) -- GDC | miR__isoformExp | |
| TCGA-E2-A14X-01A-11R-A114-13 | (TODO) -- GDC | miR__geneExp | |
| TCGA-E2-A14X-01A-11R-A114-13 | (TODO) -- GDC | miR__isoformExp | |
| TCGA-E2-A14Y-01A-21R-A12C-13 | (TODO) -- GDC | miR__geneExp | |
| TCGA-E2-A14Y-01A-21R-A12C-13 | (TODO) -- GDC | miR__isoformExp | |
| TCGA-E2-A14Z-01A-11R-A114-13 | (TODO) -- GDC | miR__geneExp | |
| TCGA-E2-A14Z-01A-11R-A114-13 | (TODO) -- GDC | miR__isoformExp | |
| TCGA-E2-A150-01A-11R-A12C-13 | (TODO) -- GDC | miR__geneExp | |
| TCGA-E2-A150-01A-11R-A12C-13 | (TODO) -- GDC | miR__isoformExp | |
| TCGA-E2-A152-01A-11R-A12C-13 | (TODO) -- GDC | miR__geneExp | |
| TCGA-E2-A152-01A-11R-A12C-13 | (TODO) -- GDC | miR__isoformExp | |
| TCGA-E2-A153-01A-12R-A12C-13 | (TODO) -- GDC | miR__geneExp | |
| TCGA-E2-A153-01A-12R-A12C-13 | (TODO) -- GDC | miR__isoformExp | |
| TCGA-E2-A154-01A-11R-A114-13 | (TODO) -- GDC | miR__geneExp | |
| TCGA-E2-A154-01A-11R-A114-13 | (TODO) -- GDC | miR__isoformExp | |
| TCGA-E2-A155-01A-11R-A12C-13 | (TODO) -- GDC | miR__geneExp | |
| TCGA-E2-A155-01A-11R-A12C-13 | (TODO) -- GDC | miR__isoformExp | |
| TCGA-E2-A156-01A-11R-A12C-13 | (TODO) -- GDC | miR__geneExp | |
| TCGA-E2-A156-01A-11R-A12C-13 | (TODO) -- GDC | miR__isoformExp | |
| TCGA-E2-A158-01A-11R-A12C-13 | (TODO) -- GDC | miR__geneExp | |
| TCGA-E2-A158-01A-11R-A12C-13 | (TODO) -- GDC | miR__isoformExp | |
| TCGA-E2-A159-01A-11R-A114-13 | (TODO) -- GDC | miR__geneExp | |
| TCGA-E2-A159-01A-11R-A114-13 | (TODO) -- GDC | miR__isoformExp | |
| TCGA-E2-A15A-01A-11R-A12C-13 | (TODO) -- GDC | miR__geneExp | |
| TCGA-E2-A15A-01A-11R-A12C-13 | (TODO) -- GDC | miR__isoformExp | |
| TCGA-E2-A15C-01A-31R-A12C-13 | (TODO) -- GDC | miR__geneExp | |
| TCGA-E2-A15C-01A-31R-A12C-13 | (TODO) -- GDC | miR__isoformExp | |
| TCGA-E2-A15D-01A-11R-A114-13 | (TODO) -- GDC | miR__geneExp | |
| TCGA-E2-A15D-01A-11R-A114-13 | (TODO) -- GDC | miR__isoformExp | |
| TCGA-E2-A15E-01A-11R-A12C-13 | (TODO) -- GDC | miR__geneExp | |
| TCGA-E2-A15E-01A-11R-A12C-13 | (TODO) -- GDC | miR__isoformExp | |
| TCGA-E2-A15F-01A-11R-A114-13 | (TODO) -- GDC | miR__geneExp | |
| TCGA-E2-A15F-01A-11R-A114-13 | (TODO) -- GDC | miR__isoformExp | |
| TCGA-E2-A15G-01A-11R-A12C-13 | (TODO) -- GDC | miR__geneExp | |
| TCGA-E2-A15G-01A-11R-A12C-13 | (TODO) -- GDC | miR__isoformExp | |
| TCGA-E2-A15H-01A-11R-A12C-13 | (TODO) -- GDC | miR__geneExp | |
| TCGA-E2-A15H-01A-11R-A12C-13 | (TODO) -- GDC | miR__isoformExp | |
| TCGA-E2-A15I-01A-21R-A136-13 | (TODO) -- GDC | miR__geneExp | |
| TCGA-E2-A15I-01A-21R-A136-13 | (TODO) -- GDC | miR__isoformExp | |
| TCGA-E2-A15J-01A-11R-A12O-13 | (TODO) -- GDC | miR__geneExp | |
| TCGA-E2-A15J-01A-11R-A12O-13 | (TODO) -- GDC | miR__isoformExp | |
| TCGA-E2-A15K-01A-11R-A12O-13 | (TODO) -- GDC | miR__geneExp | |
| TCGA-E2-A15K-01A-11R-A12O-13 | (TODO) -- GDC | miR__isoformExp | |
| TCGA-E2-A15L-01A-11R-A12C-13 | (TODO) -- GDC | miR__geneExp | |
| TCGA-E2-A15L-01A-11R-A12C-13 | (TODO) -- GDC | miR__isoformExp | |
| TCGA-E2-A15M-01A-11R-A12C-13 | (TODO) -- GDC | miR__geneExp | |
| TCGA-E2-A15M-01A-11R-A12C-13 | (TODO) -- GDC | miR__isoformExp | |
| TCGA-E2-A15O-01A-11R-A114-13 | (TODO) -- GDC | miR__geneExp | |
| TCGA-E2-A15O-01A-11R-A114-13 | (TODO) -- GDC | miR__isoformExp | |
| TCGA-E2-A15P-01A-11R-A114-13 | (TODO) -- GDC | miR__geneExp | |
| TCGA-E2-A15P-01A-11R-A114-13 | (TODO) -- GDC | miR__isoformExp | |
| TCGA-E2-A15R-01A-11R-A114-13 | (TODO) -- GDC | miR__geneExp | |
| TCGA-E2-A15R-01A-11R-A114-13 | (TODO) -- GDC | miR__isoformExp | |
| TCGA-E2-A15S-01A-11R-A114-13 | (TODO) -- GDC | miR__geneExp | |
| TCGA-E2-A15S-01A-11R-A114-13 | (TODO) -- GDC | miR__isoformExp | |
| TCGA-E2-A15T-01A-11R-A114-13 | (TODO) -- GDC | miR__geneExp | |
| TCGA-E2-A15T-01A-11R-A114-13 | (TODO) -- GDC | miR__isoformExp | |
| TCGA-E2-A1AZ-01A-11R-A12O-13 | (TODO) -- GDC | miR__geneExp | |
| TCGA-E2-A1AZ-01A-11R-A12O-13 | (TODO) -- GDC | miR__isoformExp | |
| TCGA-E2-A1B0-01A-11R-A12O-13 | (TODO) -- GDC | miR__geneExp | |
| TCGA-E2-A1B0-01A-11R-A12O-13 | (TODO) -- GDC | miR__isoformExp | |
| TCGA-E2-A1B1-01A-21R-A12O-13 | (TODO) -- GDC | miR__geneExp | |
| TCGA-E2-A1B1-01A-21R-A12O-13 | (TODO) -- GDC | miR__isoformExp | |
| TCGA-E2-A1B4-01A-11R-A12O-13 | (TODO) -- GDC | miR__geneExp | |
| TCGA-E2-A1B4-01A-11R-A12O-13 | (TODO) -- GDC | miR__isoformExp | |
| TCGA-E2-A1B5-01A-21R-A12O-13 | (TODO) -- GDC | miR__geneExp | |
| TCGA-E2-A1B5-01A-21R-A12O-13 | (TODO) -- GDC | miR__isoformExp | |
| TCGA-E2-A1B6-01A-31R-A12O-13 | (TODO) -- GDC | miR__geneExp | |
| TCGA-E2-A1B6-01A-31R-A12O-13 | (TODO) -- GDC | miR__isoformExp | |
| TCGA-E2-A1BC-01A-11R-A12O-13 | (TODO) -- GDC | miR__geneExp | |
| TCGA-E2-A1BC-01A-11R-A12O-13 | (TODO) -- GDC | miR__isoformExp | |
| TCGA-E2-A1BD-01A-11R-A12O-13 | (TODO) -- GDC | miR__geneExp | |
| TCGA-E2-A1BD-01A-11R-A12O-13 | (TODO) -- GDC | miR__isoformExp | |
| TCGA-E2-A1IE-01A-11R-A13P-13 | (TODO) -- GDC | miR__geneExp | |
| TCGA-E2-A1IE-01A-11R-A13P-13 | (TODO) -- GDC | miR__isoformExp | |
| TCGA-E2-A1IF-01A-11R-A143-13 | (TODO) -- GDC | miR__geneExp | |
| TCGA-E2-A1IF-01A-11R-A143-13 | (TODO) -- GDC | miR__isoformExp | |
| TCGA-E2-A1IG-01A-11R-A143-13 | (TODO) -- GDC | miR__geneExp | |
| TCGA-E2-A1IG-01A-11R-A143-13 | (TODO) -- GDC | miR__isoformExp | |
| TCGA-E2-A1IH-01A-11R-A13P-13 | (TODO) -- GDC | miR__geneExp | |
| TCGA-E2-A1IH-01A-11R-A13P-13 | (TODO) -- GDC | miR__isoformExp | |
| TCGA-E2-A1II-01A-11R-A143-13 | (TODO) -- GDC | miR__geneExp | |
| TCGA-E2-A1II-01A-11R-A143-13 | (TODO) -- GDC | miR__isoformExp | |
| TCGA-E2-A1IJ-01A-11R-A143-13 | (TODO) -- GDC | miR__geneExp | |
| TCGA-E2-A1IJ-01A-11R-A143-13 | (TODO) -- GDC | miR__isoformExp | |
| TCGA-E2-A1IK-01A-11R-A143-13 | (TODO) -- GDC | miR__geneExp | |
| TCGA-E2-A1IK-01A-11R-A143-13 | (TODO) -- GDC | miR__isoformExp | |
| TCGA-E2-A1IL-01A-11R-A14C-13 | (TODO) -- GDC | miR__geneExp | |
| TCGA-E2-A1IL-01A-11R-A14C-13 | (TODO) -- GDC | miR__isoformExp | |
| TCGA-E2-A1IN-01A-11R-A13P-13 | (TODO) -- GDC | miR__geneExp | |
| TCGA-E2-A1IN-01A-11R-A13P-13 | (TODO) -- GDC | miR__isoformExp | |
| TCGA-E2-A1IO-01A-11R-A143-13 | (TODO) -- GDC | miR__geneExp | |
| TCGA-E2-A1IO-01A-11R-A143-13 | (TODO) -- GDC | miR__isoformExp | |
| TCGA-E2-A1IU-01A-11R-A14C-13 | (TODO) -- GDC | miR__geneExp | |
| TCGA-E2-A1IU-01A-11R-A14C-13 | (TODO) -- GDC | miR__isoformExp | |
| TCGA-E2-A1L6-01A-11R-A13P-13 | (TODO) -- GDC | miR__geneExp | |
| TCGA-E2-A1L6-01A-11R-A13P-13 | (TODO) -- GDC | miR__isoformExp | |
| TCGA-E2-A1L7-01A-11R-A143-13 | (TODO) -- GDC | miR__geneExp | |
| TCGA-E2-A1L7-01A-11R-A143-13 | (TODO) -- GDC | miR__isoformExp | |
| TCGA-E2-A1L8-01A-11R-A13P-13 | (TODO) -- GDC | miR__geneExp | |
| TCGA-E2-A1L8-01A-11R-A13P-13 | (TODO) -- GDC | miR__isoformExp | |
| TCGA-E2-A1L9-01A-11R-A13P-13 | (TODO) -- GDC | miR__geneExp | |
| TCGA-E2-A1L9-01A-11R-A13P-13 | (TODO) -- GDC | miR__isoformExp | |
| TCGA-E2-A1LA-01A-11R-A143-13 | (TODO) -- GDC | miR__geneExp | |
| TCGA-E2-A1LA-01A-11R-A143-13 | (TODO) -- GDC | miR__isoformExp | |
| TCGA-E2-A1LB-01A-11R-A143-13 | (TODO) -- GDC | miR__geneExp | |
| TCGA-E2-A1LB-01A-11R-A143-13 | (TODO) -- GDC | miR__isoformExp | |
| TCGA-E2-A1LE-01A-12R-A19V-13 | (TODO) -- GDC | miR__geneExp | |
| TCGA-E2-A1LE-01A-12R-A19V-13 | (TODO) -- GDC | miR__isoformExp | |
| TCGA-E2-A1LG-01A-21R-A14L-13 | (TODO) -- GDC | miR__geneExp | |
| TCGA-E2-A1LG-01A-21R-A14L-13 | (TODO) -- GDC | miR__isoformExp | |
| TCGA-E2-A1LH-01A-11R-A14C-13 | (TODO) -- GDC | miR__geneExp | |
| TCGA-E2-A1LH-01A-11R-A14C-13 | (TODO) -- GDC | miR__isoformExp | |
| TCGA-E2-A1LI-01A-12R-A156-13 | (TODO) -- GDC | miR__geneExp | |
| TCGA-E2-A1LI-01A-12R-A156-13 | (TODO) -- GDC | miR__isoformExp | |
| TCGA-E2-A1LK-01A-21R-A14C-13 | (TODO) -- GDC | miR__geneExp | |
| TCGA-E2-A1LK-01A-21R-A14C-13 | (TODO) -- GDC | miR__isoformExp | |
| TCGA-E2-A1LL-01A-11R-A143-13 | (TODO) -- GDC | miR__geneExp | |
| TCGA-E2-A1LL-01A-11R-A143-13 | (TODO) -- GDC | miR__isoformExp | |
| TCGA-E2-A1LS-01A-12R-A156-13 | (TODO) -- GDC | miR__geneExp | |
| TCGA-E2-A1LS-01A-12R-A156-13 | (TODO) -- GDC | miR__isoformExp | |
| TCGA-E2-A2P5-01A-11R-A19V-13 | (TODO) -- GDC | miR__geneExp | |
| TCGA-E2-A2P5-01A-11R-A19V-13 | (TODO) -- GDC | miR__isoformExp | |
| TCGA-E2-A2P6-01A-11R-A19V-13 | (TODO) -- GDC | miR__geneExp | |
| TCGA-E2-A2P6-01A-11R-A19V-13 | (TODO) -- GDC | miR__isoformExp | |
| TCGA-E2-A3DX-01A-21R-A214-13 | (TODO) -- GDC | miR__geneExp | |
| TCGA-E2-A3DX-01A-21R-A214-13 | (TODO) -- GDC | miR__isoformExp | |
| TCGA-E2-A56Z-01A-12R-A29V-13 | (TODO) -- GDC | miR__geneExp | |
| TCGA-E2-A56Z-01A-12R-A29V-13 | (TODO) -- GDC | miR__isoformExp | |
| TCGA-E2-A570-01A-11R-A29V-13 | (TODO) -- GDC | miR__geneExp | |
| TCGA-E2-A570-01A-11R-A29V-13 | (TODO) -- GDC | miR__isoformExp | |
| TCGA-E2-A572-01A-13R-A31S-13 | (TODO) -- GDC | miR__geneExp | |
| TCGA-E2-A572-01A-13R-A31S-13 | (TODO) -- GDC | miR__isoformExp | |
| TCGA-E2-A573-01A-11R-A29V-13 | (TODO) -- GDC | miR__geneExp | |
| TCGA-E2-A573-01A-11R-A29V-13 | (TODO) -- GDC | miR__isoformExp | |
| TCGA-E2-A574-01A-11R-A29V-13 | (TODO) -- GDC | miR__geneExp | |
| TCGA-E2-A574-01A-11R-A29V-13 | (TODO) -- GDC | miR__isoformExp | |
| TCGA-E2-A576-01A-11R-A31S-13 | (TODO) -- GDC | miR__geneExp | |
| TCGA-E2-A576-01A-11R-A31S-13 | (TODO) -- GDC | miR__isoformExp | |
| TCGA-E2-A9RU-01A-11R-A41G-13 | (TODO) -- GDC | miR__geneExp | |
| TCGA-E2-A9RU-01A-11R-A41G-13 | (TODO) -- GDC | miR__isoformExp | |
| TCGA-E9-A1N3-01A-12R-A156-13 | (TODO) -- GDC | miR__geneExp | |
| TCGA-E9-A1N3-01A-12R-A156-13 | (TODO) -- GDC | miR__isoformExp | |
| TCGA-E9-A1N4-01A-11R-A14L-13 | (TODO) -- GDC | miR__geneExp | |
| TCGA-E9-A1N4-01A-11R-A14L-13 | (TODO) -- GDC | miR__isoformExp | |
| TCGA-E9-A1N5-01A-11R-A14C-13 | (TODO) -- GDC | miR__geneExp | |
| TCGA-E9-A1N5-01A-11R-A14C-13 | (TODO) -- GDC | miR__isoformExp | |
| TCGA-E9-A1N6-01A-11R-A143-13 | (TODO) -- GDC | miR__geneExp | |
| TCGA-E9-A1N6-01A-11R-A143-13 | (TODO) -- GDC | miR__isoformExp | |
| TCGA-E9-A1N8-01A-11R-A143-13 | (TODO) -- GDC | miR__geneExp | |
| TCGA-E9-A1N8-01A-11R-A143-13 | (TODO) -- GDC | miR__isoformExp | |
| TCGA-E9-A1N9-01A-11R-A14C-13 | (TODO) -- GDC | miR__geneExp | |
| TCGA-E9-A1N9-01A-11R-A14C-13 | (TODO) -- GDC | miR__isoformExp | |
| TCGA-E9-A1NA-01A-11R-A143-13 | (TODO) -- GDC | miR__geneExp | |
| TCGA-E9-A1NA-01A-11R-A143-13 | (TODO) -- GDC | miR__isoformExp | |
| TCGA-E9-A1ND-01A-11R-A143-13 | (TODO) -- GDC | miR__geneExp | |
| TCGA-E9-A1ND-01A-11R-A143-13 | (TODO) -- GDC | miR__isoformExp | |
| TCGA-E9-A1NE-01A-21R-A14L-13 | (TODO) -- GDC | miR__geneExp | |
| TCGA-E9-A1NE-01A-21R-A14L-13 | (TODO) -- GDC | miR__isoformExp | |
| TCGA-E9-A1NF-01A-11R-A14C-13 | (TODO) -- GDC | miR__geneExp | |
| TCGA-E9-A1NF-01A-11R-A14C-13 | (TODO) -- GDC | miR__isoformExp | |
| TCGA-E9-A1NG-01A-21R-A14L-13 | (TODO) -- GDC | miR__geneExp | |
| TCGA-E9-A1NG-01A-21R-A14L-13 | (TODO) -- GDC | miR__isoformExp | |
| TCGA-E9-A1NH-01A-11R-A14C-13 | (TODO) -- GDC | miR__geneExp | |
| TCGA-E9-A1NH-01A-11R-A14C-13 | (TODO) -- GDC | miR__isoformExp | |
| TCGA-E9-A1NI-01A-11R-A14C-13 | (TODO) -- GDC | miR__geneExp | |
| TCGA-E9-A1NI-01A-11R-A14C-13 | (TODO) -- GDC | miR__isoformExp | |
| TCGA-E9-A1QZ-01A-21R-A168-13 | (TODO) -- GDC | miR__geneExp | |
| TCGA-E9-A1QZ-01A-21R-A168-13 | (TODO) -- GDC | miR__isoformExp | |
| TCGA-E9-A1R0-01A-22R-A16E-13 | (TODO) -- GDC | miR__geneExp | |
| TCGA-E9-A1R0-01A-22R-A16E-13 | (TODO) -- GDC | miR__isoformExp | |
| TCGA-E9-A1R2-01A-11R-A14C-13 | (TODO) -- GDC | miR__geneExp | |
| TCGA-E9-A1R2-01A-11R-A14C-13 | (TODO) -- GDC | miR__isoformExp | |
| TCGA-E9-A1R3-01A-31R-A14L-13 | (TODO) -- GDC | miR__geneExp | |
| TCGA-E9-A1R3-01A-31R-A14L-13 | (TODO) -- GDC | miR__isoformExp | |
| TCGA-E9-A1R4-01A-21R-A14C-13 | (TODO) -- GDC | miR__geneExp | |
| TCGA-E9-A1R4-01A-21R-A14C-13 | (TODO) -- GDC | miR__isoformExp | |
| TCGA-E9-A1R5-01A-11R-A14L-13 | (TODO) -- GDC | miR__geneExp | |
| TCGA-E9-A1R5-01A-11R-A14L-13 | (TODO) -- GDC | miR__isoformExp | |
| TCGA-E9-A1R6-01A-11R-A14C-13 | (TODO) -- GDC | miR__geneExp | |
| TCGA-E9-A1R6-01A-11R-A14C-13 | (TODO) -- GDC | miR__isoformExp | |
| TCGA-E9-A1R7-01A-11R-A14L-13 | (TODO) -- GDC | miR__geneExp | |
| TCGA-E9-A1R7-01A-11R-A14L-13 | (TODO) -- GDC | miR__isoformExp | |
| TCGA-E9-A1RA-01A-11R-A14C-13 | (TODO) -- GDC | miR__geneExp | |
| TCGA-E9-A1RA-01A-11R-A14C-13 | (TODO) -- GDC | miR__isoformExp | |
| TCGA-E9-A1RB-01A-11R-A156-13 | (TODO) -- GDC | miR__geneExp | |
| TCGA-E9-A1RB-01A-11R-A156-13 | (TODO) -- GDC | miR__isoformExp | |
| TCGA-E9-A1RC-01A-11R-A156-13 | (TODO) -- GDC | miR__geneExp | |
| TCGA-E9-A1RC-01A-11R-A156-13 | (TODO) -- GDC | miR__isoformExp | |
| TCGA-E9-A1RD-01A-11R-A156-13 | (TODO) -- GDC | miR__geneExp | |
| TCGA-E9-A1RD-01A-11R-A156-13 | (TODO) -- GDC | miR__isoformExp | |
| TCGA-E9-A1RE-01A-11R-A156-13 | (TODO) -- GDC | miR__geneExp | |
| TCGA-E9-A1RE-01A-11R-A156-13 | (TODO) -- GDC | miR__isoformExp | |
| TCGA-E9-A1RF-01A-11R-A156-13 | (TODO) -- GDC | miR__geneExp | |
| TCGA-E9-A1RF-01A-11R-A156-13 | (TODO) -- GDC | miR__isoformExp | |
| TCGA-E9-A1RG-01A-11R-A14C-13 | (TODO) -- GDC | miR__geneExp | |
| TCGA-E9-A1RG-01A-11R-A14C-13 | (TODO) -- GDC | miR__isoformExp | |
| TCGA-E9-A1RH-01A-21R-A168-13 | (TODO) -- GDC | miR__geneExp | |
| TCGA-E9-A1RH-01A-21R-A168-13 | (TODO) -- GDC | miR__isoformExp | |
| TCGA-E9-A1RI-01A-11R-A168-13 | (TODO) -- GDC | miR__geneExp | |
| TCGA-E9-A1RI-01A-11R-A168-13 | (TODO) -- GDC | miR__isoformExp | |
| TCGA-E9-A226-01A-21R-A156-13 | (TODO) -- GDC | miR__geneExp | |
| TCGA-E9-A226-01A-21R-A156-13 | (TODO) -- GDC | miR__isoformExp | |
| TCGA-E9-A227-01A-11R-A156-13 | (TODO) -- GDC | miR__geneExp | |
| TCGA-E9-A227-01A-11R-A156-13 | (TODO) -- GDC | miR__isoformExp | |
| TCGA-E9-A228-01A-31R-A156-13 | (TODO) -- GDC | miR__geneExp | |
| TCGA-E9-A228-01A-31R-A156-13 | (TODO) -- GDC | miR__isoformExp | |
| TCGA-E9-A229-01A-31R-A156-13 | (TODO) -- GDC | miR__geneExp | |
| TCGA-E9-A229-01A-31R-A156-13 | (TODO) -- GDC | miR__isoformExp | |
| TCGA-E9-A22A-01A-11R-A156-13 | (TODO) -- GDC | miR__geneExp | |
| TCGA-E9-A22A-01A-11R-A156-13 | (TODO) -- GDC | miR__isoformExp | |
| TCGA-E9-A22B-01A-11R-A156-13 | (TODO) -- GDC | miR__geneExp | |
| TCGA-E9-A22B-01A-11R-A156-13 | (TODO) -- GDC | miR__isoformExp | |
| TCGA-E9-A22D-01A-11R-A156-13 | (TODO) -- GDC | miR__geneExp | |
| TCGA-E9-A22D-01A-11R-A156-13 | (TODO) -- GDC | miR__isoformExp | |
| TCGA-E9-A22E-01A-11R-A156-13 | (TODO) -- GDC | miR__geneExp | |
| TCGA-E9-A22E-01A-11R-A156-13 | (TODO) -- GDC | miR__isoformExp | |
| TCGA-E9-A22G-01A-11R-A156-13 | (TODO) -- GDC | miR__geneExp | |
| TCGA-E9-A22G-01A-11R-A156-13 | (TODO) -- GDC | miR__isoformExp | |
| TCGA-E9-A22H-01A-11R-A156-13 | (TODO) -- GDC | miR__geneExp | |
| TCGA-E9-A22H-01A-11R-A156-13 | (TODO) -- GDC | miR__isoformExp | |
| TCGA-E9-A243-01A-21R-A168-13 | (TODO) -- GDC | miR__geneExp | |
| TCGA-E9-A243-01A-21R-A168-13 | (TODO) -- GDC | miR__isoformExp | |
| TCGA-E9-A244-01A-11R-A168-13 | (TODO) -- GDC | miR__geneExp | |
| TCGA-E9-A244-01A-11R-A168-13 | (TODO) -- GDC | miR__isoformExp | |
| TCGA-E9-A245-01A-22R-A16E-13 | (TODO) -- GDC | miR__geneExp | |
| TCGA-E9-A245-01A-22R-A16E-13 | (TODO) -- GDC | miR__isoformExp | |
| TCGA-E9-A247-01A-11R-A168-13 | (TODO) -- GDC | miR__geneExp | |
| TCGA-E9-A247-01A-11R-A168-13 | (TODO) -- GDC | miR__isoformExp | |
| TCGA-E9-A248-01A-11R-A168-13 | (TODO) -- GDC | miR__geneExp | |
| TCGA-E9-A248-01A-11R-A168-13 | (TODO) -- GDC | miR__isoformExp | |
| TCGA-E9-A249-01A-11R-A168-13 | (TODO) -- GDC | miR__geneExp | |
| TCGA-E9-A249-01A-11R-A168-13 | (TODO) -- GDC | miR__isoformExp | |
| TCGA-E9-A24A-01A-11R-A168-13 | (TODO) -- GDC | miR__geneExp | |
| TCGA-E9-A24A-01A-11R-A168-13 | (TODO) -- GDC | miR__isoformExp | |
| TCGA-E9-A295-01A-11R-A16E-13 | (TODO) -- GDC | miR__geneExp | |
| TCGA-E9-A295-01A-11R-A16E-13 | (TODO) -- GDC | miR__isoformExp | |
| TCGA-E9-A2JS-01A-11R-A17X-13 | (TODO) -- GDC | miR__geneExp | |
| TCGA-E9-A2JS-01A-11R-A17X-13 | (TODO) -- GDC | miR__isoformExp | |
| TCGA-E9-A2JT-01A-22R-A18L-13 | (TODO) -- GDC | miR__geneExp | |
| TCGA-E9-A2JT-01A-22R-A18L-13 | (TODO) -- GDC | miR__isoformExp | |
| TCGA-E9-A3Q9-01A-11R-A21U-13 | (TODO) -- GDC | miR__geneExp | |
| TCGA-E9-A3Q9-01A-11R-A21U-13 | (TODO) -- GDC | miR__isoformExp | |
| TCGA-E9-A3QA-01A-61R-A22I-13 | (TODO) -- GDC | miR__geneExp | |
| TCGA-E9-A3QA-01A-61R-A22I-13 | (TODO) -- GDC | miR__isoformExp | |
| TCGA-E9-A3X8-01A-31R-A22V-13 | (TODO) -- GDC | miR__geneExp | |
| TCGA-E9-A3X8-01A-31R-A22V-13 | (TODO) -- GDC | miR__isoformExp | |
| TCGA-E9-A54X-01A-11R-A25Z-13 | (TODO) -- GDC | miR__geneExp | |
| TCGA-E9-A54X-01A-11R-A25Z-13 | (TODO) -- GDC | miR__isoformExp | |
| TCGA-E9-A54Y-01A-11R-A25Z-13 | (TODO) -- GDC | miR__geneExp | |
| TCGA-E9-A54Y-01A-11R-A25Z-13 | (TODO) -- GDC | miR__isoformExp | |
| TCGA-E9-A5FK-01A-11R-A27U-13 | (TODO) -- GDC | miR__geneExp | |
| TCGA-E9-A5FK-01A-11R-A27U-13 | (TODO) -- GDC | miR__isoformExp | |
| TCGA-E9-A5FL-01A-11R-A27U-13 | (TODO) -- GDC | miR__geneExp | |
| TCGA-E9-A5FL-01A-11R-A27U-13 | (TODO) -- GDC | miR__isoformExp | |
| TCGA-E9-A5UO-01A-11R-A28I-13 | (TODO) -- GDC | miR__geneExp | |
| TCGA-E9-A5UO-01A-11R-A28I-13 | (TODO) -- GDC | miR__isoformExp | |
| TCGA-E9-A5UP-01A-11R-A28I-13 | (TODO) -- GDC | miR__geneExp | |
| TCGA-E9-A5UP-01A-11R-A28I-13 | (TODO) -- GDC | miR__isoformExp | |
| TCGA-E9-A6HE-01A-11R-A31S-13 | (TODO) -- GDC | miR__geneExp | |
| TCGA-E9-A6HE-01A-11R-A31S-13 | (TODO) -- GDC | miR__isoformExp | |
| TCGA-EW-A1IW-01A-11R-A13P-13 | (TODO) -- GDC | miR__geneExp | |
| TCGA-EW-A1IW-01A-11R-A13P-13 | (TODO) -- GDC | miR__isoformExp | |
| TCGA-EW-A1IX-01A-12R-A143-13 | (TODO) -- GDC | miR__geneExp | |
| TCGA-EW-A1IX-01A-12R-A143-13 | (TODO) -- GDC | miR__isoformExp | |
| TCGA-EW-A1IY-01A-11R-A13P-13 | (TODO) -- GDC | miR__geneExp | |
| TCGA-EW-A1IY-01A-11R-A13P-13 | (TODO) -- GDC | miR__isoformExp | |
| TCGA-EW-A1IZ-01A-11R-A13P-13 | (TODO) -- GDC | miR__geneExp | |
| TCGA-EW-A1IZ-01A-11R-A13P-13 | (TODO) -- GDC | miR__isoformExp | |
| TCGA-EW-A1J1-01A-11R-A13P-13 | (TODO) -- GDC | miR__geneExp | |
| TCGA-EW-A1J1-01A-11R-A13P-13 | (TODO) -- GDC | miR__isoformExp | |
| TCGA-EW-A1J2-01A-21R-A13P-13 | (TODO) -- GDC | miR__geneExp | |
| TCGA-EW-A1J2-01A-21R-A13P-13 | (TODO) -- GDC | miR__isoformExp | |
| TCGA-EW-A1J3-01A-11R-A13P-13 | (TODO) -- GDC | miR__geneExp | |
| TCGA-EW-A1J3-01A-11R-A13P-13 | (TODO) -- GDC | miR__isoformExp | |
| TCGA-EW-A1J5-01A-11R-A13P-13 | (TODO) -- GDC | miR__geneExp | |
| TCGA-EW-A1J5-01A-11R-A13P-13 | (TODO) -- GDC | miR__isoformExp | |
| TCGA-EW-A1J6-01A-11R-A13P-13 | (TODO) -- GDC | miR__geneExp | |
| TCGA-EW-A1J6-01A-11R-A13P-13 | (TODO) -- GDC | miR__isoformExp | |
| TCGA-EW-A1OV-01A-11R-A143-13 | (TODO) -- GDC | miR__geneExp | |
| TCGA-EW-A1OV-01A-11R-A143-13 | (TODO) -- GDC | miR__isoformExp | |
| TCGA-EW-A1OW-01A-21R-A143-13 | (TODO) -- GDC | miR__geneExp | |
| TCGA-EW-A1OW-01A-21R-A143-13 | (TODO) -- GDC | miR__isoformExp | |
| TCGA-EW-A1OX-01A-11R-A143-13 | (TODO) -- GDC | miR__geneExp | |
| TCGA-EW-A1OX-01A-11R-A143-13 | (TODO) -- GDC | miR__isoformExp | |
| TCGA-EW-A1OY-01A-11R-A143-13 | (TODO) -- GDC | miR__geneExp | |
| TCGA-EW-A1OY-01A-11R-A143-13 | (TODO) -- GDC | miR__isoformExp | |
| TCGA-EW-A1OZ-01A-11R-A143-13 | (TODO) -- GDC | miR__geneExp | |
| TCGA-EW-A1OZ-01A-11R-A143-13 | (TODO) -- GDC | miR__isoformExp | |
| TCGA-EW-A1P0-01A-11R-A143-13 | (TODO) -- GDC | miR__geneExp | |
| TCGA-EW-A1P0-01A-11R-A143-13 | (TODO) -- GDC | miR__isoformExp | |
| TCGA-EW-A1P1-01A-31R-A14C-13 | (TODO) -- GDC | miR__geneExp | |
| TCGA-EW-A1P1-01A-31R-A14C-13 | (TODO) -- GDC | miR__isoformExp | |
| TCGA-EW-A1P3-01A-11R-A143-13 | (TODO) -- GDC | miR__geneExp | |
| TCGA-EW-A1P3-01A-11R-A143-13 | (TODO) -- GDC | miR__isoformExp | |
| TCGA-EW-A1P4-01A-21R-A143-13 | (TODO) -- GDC | miR__geneExp | |
| TCGA-EW-A1P4-01A-21R-A143-13 | (TODO) -- GDC | miR__isoformExp | |
| TCGA-EW-A1P5-01A-11R-A143-13 | (TODO) -- GDC | miR__geneExp | |
| TCGA-EW-A1P5-01A-11R-A143-13 | (TODO) -- GDC | miR__isoformExp | |
| TCGA-EW-A1P6-01A-11R-A143-13 | (TODO) -- GDC | miR__geneExp | |
| TCGA-EW-A1P6-01A-11R-A143-13 | (TODO) -- GDC | miR__isoformExp | |
| TCGA-EW-A1P7-01A-21R-A143-13 | (TODO) -- GDC | miR__geneExp | |
| TCGA-EW-A1P7-01A-21R-A143-13 | (TODO) -- GDC | miR__isoformExp | |
| TCGA-EW-A1P8-01A-11R-A143-13 | (TODO) -- GDC | miR__geneExp | |
| TCGA-EW-A1P8-01A-11R-A143-13 | (TODO) -- GDC | miR__isoformExp | |
| TCGA-EW-A1PA-01A-11R-A143-13 | (TODO) -- GDC | miR__geneExp | |
| TCGA-EW-A1PA-01A-11R-A143-13 | (TODO) -- GDC | miR__isoformExp | |
| TCGA-EW-A1PB-01A-11R-A143-13 | (TODO) -- GDC | miR__geneExp | |
| TCGA-EW-A1PB-01A-11R-A143-13 | (TODO) -- GDC | miR__isoformExp | |
| TCGA-EW-A1PC-01B-11R-A21U-13 | (TODO) -- GDC | miR__geneExp | |
| TCGA-EW-A1PC-01B-11R-A21U-13 | (TODO) -- GDC | miR__isoformExp | |
| TCGA-EW-A1PD-01A-11R-A143-13 | (TODO) -- GDC | miR__geneExp | |
| TCGA-EW-A1PD-01A-11R-A143-13 | (TODO) -- GDC | miR__isoformExp | |
| TCGA-EW-A1PE-01A-11R-A143-13 | (TODO) -- GDC | miR__geneExp | |
| TCGA-EW-A1PE-01A-11R-A143-13 | (TODO) -- GDC | miR__isoformExp | |
| TCGA-EW-A1PF-01A-11R-A143-13 | (TODO) -- GDC | miR__geneExp | |
| TCGA-EW-A1PF-01A-11R-A143-13 | (TODO) -- GDC | miR__isoformExp | |
| TCGA-EW-A1PG-01A-11R-A143-13 | (TODO) -- GDC | miR__geneExp | |
| TCGA-EW-A1PG-01A-11R-A143-13 | (TODO) -- GDC | miR__isoformExp | |
| TCGA-EW-A1PH-01A-11R-A14L-13 | (TODO) -- GDC | miR__geneExp | |
| TCGA-EW-A1PH-01A-11R-A14L-13 | (TODO) -- GDC | miR__isoformExp | |
| TCGA-EW-A2FR-01A-11R-A21U-13 | (TODO) -- GDC | miR__geneExp | |
| TCGA-EW-A2FR-01A-11R-A21U-13 | (TODO) -- GDC | miR__isoformExp | |
| TCGA-EW-A2FS-01A-11R-A17A-13 | (TODO) -- GDC | miR__geneExp | |
| TCGA-EW-A2FS-01A-11R-A17A-13 | (TODO) -- GDC | miR__isoformExp | |
| TCGA-EW-A2FV-01A-11R-A17A-13 | (TODO) -- GDC | miR__geneExp | |
| TCGA-EW-A2FV-01A-11R-A17A-13 | (TODO) -- GDC | miR__isoformExp | |
| TCGA-EW-A2FW-01A-11R-A17A-13 | (TODO) -- GDC | miR__geneExp | |
| TCGA-EW-A2FW-01A-11R-A17A-13 | (TODO) -- GDC | miR__isoformExp | |
| TCGA-EW-A3E8-01B-11R-A24J-13 | (TODO) -- GDC | miR__geneExp | |
| TCGA-EW-A3E8-01B-11R-A24J-13 | (TODO) -- GDC | miR__isoformExp | |
| TCGA-EW-A3U0-01A-11R-A22I-13 | (TODO) -- GDC | miR__geneExp | |
| TCGA-EW-A3U0-01A-11R-A22I-13 | (TODO) -- GDC | miR__isoformExp | |
| TCGA-EW-A423-01A-11R-A24J-13 | (TODO) -- GDC | miR__geneExp | |
| TCGA-EW-A423-01A-11R-A24J-13 | (TODO) -- GDC | miR__isoformExp | |
| TCGA-EW-A424-01A-11R-A24J-13 | (TODO) -- GDC | miR__geneExp | |
| TCGA-EW-A424-01A-11R-A24J-13 | (TODO) -- GDC | miR__isoformExp | |
| TCGA-EW-A6S9-01A-22R-A33A-13 | (TODO) -- GDC | miR__geneExp | |
| TCGA-EW-A6S9-01A-22R-A33A-13 | (TODO) -- GDC | miR__isoformExp | |
| TCGA-EW-A6SA-01A-21R-A32K-13 | (TODO) -- GDC | miR__geneExp | |
| TCGA-EW-A6SA-01A-21R-A32K-13 | (TODO) -- GDC | miR__isoformExp | |
| TCGA-EW-A6SB-01A-12R-A32K-13 | (TODO) -- GDC | miR__geneExp | |
| TCGA-EW-A6SB-01A-12R-A32K-13 | (TODO) -- GDC | miR__isoformExp | |
| TCGA-EW-A6SC-01A-12R-A32K-13 | (TODO) -- GDC | miR__geneExp | |
| TCGA-EW-A6SC-01A-12R-A32K-13 | (TODO) -- GDC | miR__isoformExp | |
| TCGA-EW-A6SD-01A-12R-A33A-13 | (TODO) -- GDC | miR__geneExp | |
| TCGA-EW-A6SD-01A-12R-A33A-13 | (TODO) -- GDC | miR__isoformExp | |
| TCGA-GI-A2C8-01A-11R-A16E-13 | (TODO) -- GDC | miR__geneExp | |
| TCGA-GI-A2C8-01A-11R-A16E-13 | (TODO) -- GDC | miR__isoformExp | |
| TCGA-GI-A2C9-01A-11R-A21U-13 | (TODO) -- GDC | miR__geneExp | |
| TCGA-GI-A2C9-01A-11R-A21U-13 | (TODO) -- GDC | miR__isoformExp | |
| TCGA-GM-A2D9-01A-11R-A18L-13 | (TODO) -- GDC | miR__geneExp | |
| TCGA-GM-A2D9-01A-11R-A18L-13 | (TODO) -- GDC | miR__isoformExp | |
| TCGA-GM-A2DA-01A-11R-A18L-13 | (TODO) -- GDC | miR__geneExp | |
| TCGA-GM-A2DA-01A-11R-A18L-13 | (TODO) -- GDC | miR__isoformExp | |
| TCGA-GM-A2DB-01A-31R-A18L-13 | (TODO) -- GDC | miR__geneExp | |
| TCGA-GM-A2DB-01A-31R-A18L-13 | (TODO) -- GDC | miR__isoformExp | |
| TCGA-GM-A2DC-01A-11R-A18L-13 | (TODO) -- GDC | miR__geneExp | |
| TCGA-GM-A2DC-01A-11R-A18L-13 | (TODO) -- GDC | miR__isoformExp | |
| TCGA-GM-A2DD-01A-11R-A17X-13 | (TODO) -- GDC | miR__geneExp | |
| TCGA-GM-A2DD-01A-11R-A17X-13 | (TODO) -- GDC | miR__isoformExp | |
| TCGA-GM-A2DF-01A-11R-A17X-13 | (TODO) -- GDC | miR__geneExp | |
| TCGA-GM-A2DF-01A-11R-A17X-13 | (TODO) -- GDC | miR__isoformExp | |
| TCGA-GM-A2DH-01A-11R-A17X-13 | (TODO) -- GDC | miR__geneExp | |
| TCGA-GM-A2DH-01A-11R-A17X-13 | (TODO) -- GDC | miR__isoformExp | |
| TCGA-GM-A2DI-01A-31R-A18L-13 | (TODO) -- GDC | miR__geneExp | |
| TCGA-GM-A2DI-01A-31R-A18L-13 | (TODO) -- GDC | miR__isoformExp | |
| TCGA-GM-A2DK-01A-21R-A17X-13 | (TODO) -- GDC | miR__geneExp | |
| TCGA-GM-A2DK-01A-21R-A17X-13 | (TODO) -- GDC | miR__isoformExp | |
| TCGA-GM-A2DL-01A-11R-A18L-13 | (TODO) -- GDC | miR__geneExp | |
| TCGA-GM-A2DL-01A-11R-A18L-13 | (TODO) -- GDC | miR__isoformExp | |
| TCGA-GM-A2DM-01A-11R-A17X-13 | (TODO) -- GDC | miR__geneExp | |
| TCGA-GM-A2DM-01A-11R-A17X-13 | (TODO) -- GDC | miR__isoformExp | |
| TCGA-GM-A2DN-01A-11R-A17X-13 | (TODO) -- GDC | miR__geneExp | |
| TCGA-GM-A2DN-01A-11R-A17X-13 | (TODO) -- GDC | miR__isoformExp | |
| TCGA-GM-A2DO-01A-11R-A18L-13 | (TODO) -- GDC | miR__geneExp | |
| TCGA-GM-A2DO-01A-11R-A18L-13 | (TODO) -- GDC | miR__isoformExp | |
| TCGA-GM-A3NW-01A-21R-A22I-13 | (TODO) -- GDC | miR__geneExp | |
| TCGA-GM-A3NW-01A-21R-A22I-13 | (TODO) -- GDC | miR__isoformExp | |
| TCGA-GM-A3NY-01A-11R-A21U-13 | (TODO) -- GDC | miR__geneExp | |
| TCGA-GM-A3NY-01A-11R-A21U-13 | (TODO) -- GDC | miR__isoformExp | |
| TCGA-GM-A3XG-01A-31R-A24J-13 | (TODO) -- GDC | miR__geneExp | |
| TCGA-GM-A3XG-01A-31R-A24J-13 | (TODO) -- GDC | miR__isoformExp | |
| TCGA-GM-A3XL-01A-11R-A22V-13 | (TODO) -- GDC | miR__geneExp | |
| TCGA-GM-A3XL-01A-11R-A22V-13 | (TODO) -- GDC | miR__isoformExp | |
| TCGA-GM-A3XN-01A-12R-A22V-13 | (TODO) -- GDC | miR__geneExp | |
| TCGA-GM-A3XN-01A-12R-A22V-13 | (TODO) -- GDC | miR__isoformExp | |
| TCGA-GM-A4E0-01A-12R-A25Z-13 | (TODO) -- GDC | miR__geneExp | |
| TCGA-GM-A4E0-01A-12R-A25Z-13 | (TODO) -- GDC | miR__isoformExp | |
| TCGA-GM-A5PV-01A-11R-A28I-13 | (TODO) -- GDC | miR__geneExp | |
| TCGA-GM-A5PV-01A-11R-A28I-13 | (TODO) -- GDC | miR__isoformExp | |
| TCGA-GM-A5PX-01A-12R-A28I-13 | (TODO) -- GDC | miR__geneExp | |
| TCGA-GM-A5PX-01A-12R-A28I-13 | (TODO) -- GDC | miR__isoformExp | |
| TCGA-HN-A2NL-01A-11R-A18L-13 | (TODO) -- GDC | miR__geneExp | |
| TCGA-HN-A2NL-01A-11R-A18L-13 | (TODO) -- GDC | miR__isoformExp | |
| TCGA-HN-A2OB-01A-21R-A27U-13 | (TODO) -- GDC | miR__geneExp | |
| TCGA-HN-A2OB-01A-21R-A27U-13 | (TODO) -- GDC | miR__isoformExp | |
| TCGA-JL-A3YW-01A-12R-A23A-13 | (TODO) -- GDC | miR__geneExp | |
| TCGA-JL-A3YW-01A-12R-A23A-13 | (TODO) -- GDC | miR__isoformExp | |
| TCGA-JL-A3YX-01A-11R-A22V-13 | (TODO) -- GDC | miR__geneExp | |
| TCGA-JL-A3YX-01A-11R-A22V-13 | (TODO) -- GDC | miR__isoformExp | |
| TCGA-LD-A66U-01A-11R-A31S-13 | (TODO) -- GDC | miR__geneExp | |
| TCGA-LD-A66U-01A-11R-A31S-13 | (TODO) -- GDC | miR__isoformExp | |
| TCGA-LD-A74U-01A-13R-A33A-13 | (TODO) -- GDC | miR__geneExp | |
| TCGA-LD-A74U-01A-13R-A33A-13 | (TODO) -- GDC | miR__isoformExp | |
| TCGA-LD-A7W5-01A-22R-A358-13 | (TODO) -- GDC | miR__geneExp | |
| TCGA-LD-A7W5-01A-22R-A358-13 | (TODO) -- GDC | miR__isoformExp | |
| TCGA-LD-A7W6-01A-81R-A358-13 | (TODO) -- GDC | miR__geneExp | |
| TCGA-LD-A7W6-01A-81R-A358-13 | (TODO) -- GDC | miR__isoformExp | |
| TCGA-LD-A9QF-01A-32R-A41G-13 | (TODO) -- GDC | miR__geneExp | |
| TCGA-LD-A9QF-01A-32R-A41G-13 | (TODO) -- GDC | miR__isoformExp | |
| TCGA-LL-A440-01A-11R-A24J-13 | (TODO) -- GDC | miR__geneExp | |
| TCGA-LL-A440-01A-11R-A24J-13 | (TODO) -- GDC | miR__isoformExp | |
| TCGA-LL-A441-01A-11R-A24J-13 | (TODO) -- GDC | miR__geneExp | |
| TCGA-LL-A441-01A-11R-A24J-13 | (TODO) -- GDC | miR__isoformExp | |
| TCGA-LL-A442-01A-11R-A24J-13 | (TODO) -- GDC | miR__geneExp | |
| TCGA-LL-A442-01A-11R-A24J-13 | (TODO) -- GDC | miR__isoformExp | |
| TCGA-LL-A50Y-01A-11R-A25Z-13 | (TODO) -- GDC | miR__geneExp | |
| TCGA-LL-A50Y-01A-11R-A25Z-13 | (TODO) -- GDC | miR__isoformExp | |
| TCGA-LL-A5YL-01A-12R-A29V-13 | (TODO) -- GDC | miR__geneExp | |
| TCGA-LL-A5YL-01A-12R-A29V-13 | (TODO) -- GDC | miR__isoformExp | |
| TCGA-LL-A5YM-01A-11R-A28I-13 | (TODO) -- GDC | miR__geneExp | |
| TCGA-LL-A5YM-01A-11R-A28I-13 | (TODO) -- GDC | miR__isoformExp | |
| TCGA-LL-A5YN-01A-11R-A28I-13 | (TODO) -- GDC | miR__geneExp | |
| TCGA-LL-A5YN-01A-11R-A28I-13 | (TODO) -- GDC | miR__isoformExp | |
| TCGA-LL-A5YO-01A-21R-A28I-13 | (TODO) -- GDC | miR__geneExp | |
| TCGA-LL-A5YO-01A-21R-A28I-13 | (TODO) -- GDC | miR__isoformExp | |
| TCGA-LL-A5YP-01A-21R-A28I-13 | (TODO) -- GDC | miR__geneExp | |
| TCGA-LL-A5YP-01A-21R-A28I-13 | (TODO) -- GDC | miR__isoformExp | |
| TCGA-LL-A6FP-01A-11R-A31S-13 | (TODO) -- GDC | miR__geneExp | |
| TCGA-LL-A6FP-01A-11R-A31S-13 | (TODO) -- GDC | miR__isoformExp | |
| TCGA-LL-A6FQ-01A-11R-A31S-13 | (TODO) -- GDC | miR__geneExp | |
| TCGA-LL-A6FQ-01A-11R-A31S-13 | (TODO) -- GDC | miR__isoformExp | |
| TCGA-LL-A6FR-01A-12R-A31S-13 | (TODO) -- GDC | miR__geneExp | |
| TCGA-LL-A6FR-01A-12R-A31S-13 | (TODO) -- GDC | miR__isoformExp | |
| TCGA-LL-A73Y-01A-11R-A33A-13 | (TODO) -- GDC | miR__geneExp | |
| TCGA-LL-A73Y-01A-11R-A33A-13 | (TODO) -- GDC | miR__isoformExp | |
| TCGA-LL-A73Z-01A-11R-A32K-13 | (TODO) -- GDC | miR__geneExp | |
| TCGA-LL-A73Z-01A-11R-A32K-13 | (TODO) -- GDC | miR__isoformExp | |
| TCGA-LL-A740-01A-21R-A32K-13 | (TODO) -- GDC | miR__geneExp | |
| TCGA-LL-A740-01A-21R-A32K-13 | (TODO) -- GDC | miR__isoformExp | |
| TCGA-LL-A7SZ-01A-32R-A358-13 | (TODO) -- GDC | miR__geneExp | |
| TCGA-LL-A7SZ-01A-32R-A358-13 | (TODO) -- GDC | miR__isoformExp | |
| TCGA-LL-A7T0-01A-31R-A358-13 | (TODO) -- GDC | miR__geneExp | |
| TCGA-LL-A7T0-01A-31R-A358-13 | (TODO) -- GDC | miR__isoformExp | |
| TCGA-LL-A8F5-01A-11R-A36A-13 | (TODO) -- GDC | miR__geneExp | |
| TCGA-LL-A8F5-01A-11R-A36A-13 | (TODO) -- GDC | miR__isoformExp | |
| TCGA-LL-A9Q3-01A-11R-A41G-13 | (TODO) -- GDC | miR__geneExp | |
| TCGA-LL-A9Q3-01A-11R-A41G-13 | (TODO) -- GDC | miR__isoformExp | |
| TCGA-LQ-A4E4-01A-11R-A25Z-13 | (TODO) -- GDC | miR__geneExp | |
| TCGA-LQ-A4E4-01A-11R-A25Z-13 | (TODO) -- GDC | miR__isoformExp | |
| TCGA-MS-A51U-01A-31R-A25Z-13 | (TODO) -- GDC | miR__geneExp | |
| TCGA-MS-A51U-01A-31R-A25Z-13 | (TODO) -- GDC | miR__isoformExp | |
| TCGA-OK-A5Q2-01A-11R-A27U-13 | (TODO) -- GDC | miR__geneExp | |
| TCGA-OK-A5Q2-01A-11R-A27U-13 | (TODO) -- GDC | miR__isoformExp | |
| TCGA-OL-A5D6-01A-21R-A27U-13 | (TODO) -- GDC | miR__geneExp | |
| TCGA-OL-A5D6-01A-21R-A27U-13 | (TODO) -- GDC | miR__isoformExp | |
| TCGA-OL-A5D7-01A-11R-A27U-13 | (TODO) -- GDC | miR__geneExp | |
| TCGA-OL-A5D7-01A-11R-A27U-13 | (TODO) -- GDC | miR__isoformExp | |
| TCGA-OL-A5D8-01A-11R-A27U-13 | (TODO) -- GDC | miR__geneExp | |
| TCGA-OL-A5D8-01A-11R-A27U-13 | (TODO) -- GDC | miR__isoformExp | |
| TCGA-OL-A5DA-01A-11R-A27U-13 | (TODO) -- GDC | miR__geneExp | |
| TCGA-OL-A5DA-01A-11R-A27U-13 | (TODO) -- GDC | miR__isoformExp | |
| TCGA-OL-A5RU-01A-11R-A28I-13 | (TODO) -- GDC | miR__geneExp | |
| TCGA-OL-A5RU-01A-11R-A28I-13 | (TODO) -- GDC | miR__isoformExp | |
| TCGA-OL-A5RV-01A-12R-A28I-13 | (TODO) -- GDC | miR__geneExp | |
| TCGA-OL-A5RV-01A-12R-A28I-13 | (TODO) -- GDC | miR__isoformExp | |
| TCGA-OL-A5RW-01A-11R-A28I-13 | (TODO) -- GDC | miR__geneExp | |
| TCGA-OL-A5RW-01A-11R-A28I-13 | (TODO) -- GDC | miR__isoformExp | |
| TCGA-OL-A5RX-01A-11R-A28I-13 | (TODO) -- GDC | miR__geneExp | |
| TCGA-OL-A5RX-01A-11R-A28I-13 | (TODO) -- GDC | miR__isoformExp | |
| TCGA-OL-A5RY-01A-21R-A28I-13 | (TODO) -- GDC | miR__geneExp | |
| TCGA-OL-A5RY-01A-21R-A28I-13 | (TODO) -- GDC | miR__isoformExp | |
| TCGA-OL-A5RZ-01A-11R-A28I-13 | (TODO) -- GDC | miR__geneExp | |
| TCGA-OL-A5RZ-01A-11R-A28I-13 | (TODO) -- GDC | miR__isoformExp | |
| TCGA-OL-A5S0-01A-11R-A28I-13 | (TODO) -- GDC | miR__geneExp | |
| TCGA-OL-A5S0-01A-11R-A28I-13 | (TODO) -- GDC | miR__isoformExp | |
| TCGA-OL-A66H-01A-11R-A29V-13 | (TODO) -- GDC | miR__geneExp | |
| TCGA-OL-A66H-01A-11R-A29V-13 | (TODO) -- GDC | miR__isoformExp | |
| TCGA-OL-A66I-01A-21R-A29V-13 | (TODO) -- GDC | miR__geneExp | |
| TCGA-OL-A66I-01A-21R-A29V-13 | (TODO) -- GDC | miR__isoformExp | |
| TCGA-OL-A66J-01A-11R-A29V-13 | (TODO) -- GDC | miR__geneExp | |
| TCGA-OL-A66J-01A-11R-A29V-13 | (TODO) -- GDC | miR__isoformExp | |
| TCGA-OL-A66K-01A-11R-A29V-13 | (TODO) -- GDC | miR__geneExp | |
| TCGA-OL-A66K-01A-11R-A29V-13 | (TODO) -- GDC | miR__isoformExp | |
| TCGA-OL-A66L-01A-12R-A31S-13 | (TODO) -- GDC | miR__geneExp | |
| TCGA-OL-A66L-01A-12R-A31S-13 | (TODO) -- GDC | miR__isoformExp | |
| TCGA-OL-A66N-01A-12R-A31S-13 | (TODO) -- GDC | miR__geneExp | |
| TCGA-OL-A66N-01A-12R-A31S-13 | (TODO) -- GDC | miR__isoformExp | |
| TCGA-OL-A66O-01A-11R-A31S-13 | (TODO) -- GDC | miR__geneExp | |
| TCGA-OL-A66O-01A-11R-A31S-13 | (TODO) -- GDC | miR__isoformExp | |
| TCGA-OL-A66P-01A-11R-A31S-13 | (TODO) -- GDC | miR__geneExp | |
| TCGA-OL-A66P-01A-11R-A31S-13 | (TODO) -- GDC | miR__isoformExp | |
| TCGA-OL-A6VO-01A-12R-A33A-13 | (TODO) -- GDC | miR__geneExp | |
| TCGA-OL-A6VO-01A-12R-A33A-13 | (TODO) -- GDC | miR__isoformExp | |
| TCGA-OL-A6VQ-01A-12R-A41G-13 | (TODO) -- GDC | miR__geneExp | |
| TCGA-OL-A6VQ-01A-12R-A41G-13 | (TODO) -- GDC | miR__isoformExp | |
| TCGA-OL-A6VR-01A-32R-A33A-13 | (TODO) -- GDC | miR__geneExp | |
| TCGA-OL-A6VR-01A-32R-A33A-13 | (TODO) -- GDC | miR__isoformExp | |
| TCGA-OL-A97C-01A-32R-A41G-13 | (TODO) -- GDC | miR__geneExp | |
| TCGA-OL-A97C-01A-32R-A41G-13 | (TODO) -- GDC | miR__isoformExp | |
| TCGA-PE-A5DC-01A-12R-A27U-13 | (TODO) -- GDC | miR__geneExp | |
| TCGA-PE-A5DC-01A-12R-A27U-13 | (TODO) -- GDC | miR__isoformExp | |
| TCGA-PE-A5DD-01A-12R-A27U-13 | (TODO) -- GDC | miR__geneExp | |
| TCGA-PE-A5DD-01A-12R-A27U-13 | (TODO) -- GDC | miR__isoformExp | |
| TCGA-PE-A5DE-01A-11R-A27U-13 | (TODO) -- GDC | miR__geneExp | |
| TCGA-PE-A5DE-01A-11R-A27U-13 | (TODO) -- GDC | miR__isoformExp | |
| TCGA-S3-A6ZF-01A-32R-A32K-13 | (TODO) -- GDC | miR__geneExp | |
| TCGA-S3-A6ZF-01A-32R-A32K-13 | (TODO) -- GDC | miR__isoformExp | |
| TCGA-S3-A6ZG-01A-22R-A32K-13 | (TODO) -- GDC | miR__geneExp | |
| TCGA-S3-A6ZG-01A-22R-A32K-13 | (TODO) -- GDC | miR__isoformExp | |
| TCGA-S3-A6ZH-01A-22R-A32K-13 | (TODO) -- GDC | miR__geneExp | |
| TCGA-S3-A6ZH-01A-22R-A32K-13 | (TODO) -- GDC | miR__isoformExp | |
| TCGA-S3-AA0Z-01A-11R-A41G-13 | (TODO) -- GDC | miR__geneExp | |
| TCGA-S3-AA0Z-01A-11R-A41G-13 | (TODO) -- GDC | miR__isoformExp | |
| TCGA-S3-AA10-01A-21R-A41G-13 | (TODO) -- GDC | miR__geneExp | |
| TCGA-S3-AA10-01A-21R-A41G-13 | (TODO) -- GDC | miR__isoformExp | |
| TCGA-S3-AA11-01A-31R-A41G-13 | (TODO) -- GDC | miR__geneExp | |
| TCGA-S3-AA11-01A-31R-A41G-13 | (TODO) -- GDC | miR__isoformExp | |
| TCGA-S3-AA12-01A-11R-A41G-13 | (TODO) -- GDC | miR__geneExp | |
| TCGA-S3-AA12-01A-11R-A41G-13 | (TODO) -- GDC | miR__isoformExp | |
| TCGA-S3-AA14-01A-11R-A41G-13 | (TODO) -- GDC | miR__geneExp | |
| TCGA-S3-AA14-01A-11R-A41G-13 | (TODO) -- GDC | miR__isoformExp | |
| TCGA-S3-AA15-01A-11R-A41G-13 | (TODO) -- GDC | miR__geneExp | |
| TCGA-S3-AA15-01A-11R-A41G-13 | (TODO) -- GDC | miR__isoformExp | |
| TCGA-S3-AA17-01A-11R-A41G-13 | (TODO) -- GDC | miR__geneExp | |
| TCGA-S3-AA17-01A-11R-A41G-13 | (TODO) -- GDC | miR__isoformExp | |
| TCGA-UL-AAZ6-01A-11R-A41G-13 | (TODO) -- GDC | miR__geneExp | |
| TCGA-UL-AAZ6-01A-11R-A41G-13 | (TODO) -- GDC | miR__isoformExp | |
| TCGA-UU-A93S-01A-21R-A41G-13 | (TODO) -- GDC | miR__geneExp | |
| TCGA-UU-A93S-01A-21R-A41G-13 | (TODO) -- GDC | miR__isoformExp | |
| TCGA-V7-A7HQ-01A-11R-A33A-13 | (TODO) -- GDC | miR__geneExp | |
| TCGA-V7-A7HQ-01A-11R-A33A-13 | (TODO) -- GDC | miR__isoformExp | |
| TCGA-W8-A86G-01A-21R-A36A-13 | (TODO) -- GDC | miR__geneExp | |
| TCGA-W8-A86G-01A-21R-A36A-13 | (TODO) -- GDC | miR__isoformExp | |
| TCGA-WT-AB41-01A-11R-A41G-13 | (TODO) -- GDC | miR__geneExp | |
| TCGA-WT-AB41-01A-11R-A41G-13 | (TODO) -- GDC | miR__isoformExp | |
| TCGA-WT-AB44-01A-11R-A41G-13 | (TODO) -- GDC | miR__geneExp | |
| TCGA-WT-AB44-01A-11R-A41G-13 | (TODO) -- GDC | miR__isoformExp | |
| TCGA-XX-A899-01A-11R-A36A-13 | (TODO) -- GDC | miR__geneExp | |
| TCGA-XX-A899-01A-11R-A36A-13 | (TODO) -- GDC | miR__isoformExp | |
| TCGA-XX-A89A-01A-11R-A36A-13 | (TODO) -- GDC | miR__geneExp | |
| TCGA-XX-A89A-01A-11R-A36A-13 | (TODO) -- GDC | miR__isoformExp | |
| TCGA-Z7-A8R5-01A-42R-A41G-13 | (TODO) -- GDC | miR__geneExp | |
| TCGA-Z7-A8R5-01A-42R-A41G-13 | (TODO) -- GDC | miR__isoformExp | |
| TCGA-Z7-A8R6-01A-11R-A41G-13 | (TODO) -- GDC | miR__geneExp | |
| TCGA-Z7-A8R6-01A-11R-A41G-13 | (TODO) -- GDC | miR__isoformExp |
Table S29.
| TCGA Barcode | Platform | Center | Annotation |
|---|---|---|---|
| TCGA-3C-AAAU-01A-11D-A41F-09 | (TODO) -- GDC | SNV__mutect | |
| TCGA-3C-AALI-01A-11D-A41F-09 | (TODO) -- GDC | SNV__mutect | |
| TCGA-3C-AALJ-01A-31D-A41F-09 | (TODO) -- GDC | SNV__mutect | |
| TCGA-3C-AALK-01A-11D-A41F-09 | (TODO) -- GDC | SNV__mutect | |
| TCGA-4H-AAAK-01A-12D-A41F-09 | (TODO) -- GDC | SNV__mutect | |
| TCGA-5L-AAT0-01A-12D-A41F-09 | (TODO) -- GDC | SNV__mutect | |
| TCGA-5L-AAT1-01A-12D-A41F-09 | (TODO) -- GDC | SNV__mutect | |
| TCGA-5T-A9QA-01A-11D-A41F-09 | (TODO) -- GDC | SNV__mutect | |
| TCGA-A1-A0SD-01A-11D-A10Y-09 | (TODO) -- GDC | SNV__mutect | |
| TCGA-A1-A0SE-01A-11D-A099-09 | (TODO) -- GDC | SNV__mutect | |
| TCGA-A1-A0SF-01A-11D-A142-09 | (TODO) -- GDC | SNV__mutect | |
| TCGA-A1-A0SG-01A-11D-A142-09 | (TODO) -- GDC | SNV__mutect | |
| TCGA-A1-A0SH-01A-11D-A099-09 | (TODO) -- GDC | SNV__mutect | |
| TCGA-A1-A0SI-01A-11D-A142-09 | (TODO) -- GDC | SNV__mutect | |
| TCGA-A1-A0SJ-01A-11D-A099-09 | (TODO) -- GDC | SNV__mutect | |
| TCGA-A1-A0SK-01A-12D-A099-09 | (TODO) -- GDC | SNV__mutect | |
| TCGA-A1-A0SM-01A-11D-A099-09 | (TODO) -- GDC | SNV__mutect | |
| TCGA-A1-A0SN-01A-11D-A142-09 | (TODO) -- GDC | SNV__mutect | |
| TCGA-A1-A0SO-01A-22D-A099-09 | (TODO) -- GDC | SNV__mutect | |
| TCGA-A1-A0SP-01A-11D-A099-09 | (TODO) -- GDC | SNV__mutect | |
| TCGA-A1-A0SQ-01A-21D-A142-09 | (TODO) -- GDC | SNV__mutect | |
| TCGA-A2-A04N-01A-11D-A10Y-09 | (TODO) -- GDC | SNV__mutect | |
| TCGA-A2-A04P-01A-31D-A128-09 | (TODO) -- GDC | SNV__mutect | |
| TCGA-A2-A04Q-01A-21W-A050-09 | (TODO) -- GDC | SNV__mutect | |
| TCGA-A2-A04R-01A-41D-A117-09 | (TODO) -- GDC | SNV__mutect | |
| TCGA-A2-A04T-01A-21W-A050-09 | (TODO) -- GDC | SNV__mutect | |
| TCGA-A2-A04U-01A-11D-A10Y-09 | (TODO) -- GDC | SNV__mutect | |
| TCGA-A2-A04V-01A-21W-A050-09 | (TODO) -- GDC | SNV__mutect | |
| TCGA-A2-A04W-01A-31D-A10Y-09 | (TODO) -- GDC | SNV__mutect | |
| TCGA-A2-A04X-01A-21W-A050-09 | (TODO) -- GDC | SNV__mutect | |
| TCGA-A2-A04Y-01A-21W-A050-09 | (TODO) -- GDC | SNV__mutect | |
| TCGA-A2-A0CK-01A-11D-A228-09 | (TODO) -- GDC | SNV__mutect | |
| TCGA-A2-A0CL-01A-11D-A10Y-09 | (TODO) -- GDC | SNV__mutect | |
| TCGA-A2-A0CM-01A-31W-A050-09 | (TODO) -- GDC | SNV__mutect | |
| TCGA-A2-A0CO-01A-13D-A228-09 | (TODO) -- GDC | SNV__mutect | |
| TCGA-A2-A0CP-01A-11W-A050-09 | (TODO) -- GDC | SNV__mutect | |
| TCGA-A2-A0CQ-01A-21W-A050-09 | (TODO) -- GDC | SNV__mutect | |
| TCGA-A2-A0CR-01A-11D-A228-09 | (TODO) -- GDC | SNV__mutect | |
| TCGA-A2-A0CS-01A-11D-A10Y-09 | (TODO) -- GDC | SNV__mutect | |
| TCGA-A2-A0CT-01A-31W-A071-09 | (TODO) -- GDC | SNV__mutect | |
| TCGA-A2-A0CU-01A-12W-A050-09 | (TODO) -- GDC | SNV__mutect | |
| TCGA-A2-A0CV-01A-31D-A10Y-09 | (TODO) -- GDC | SNV__mutect | |
| TCGA-A2-A0CW-01A-21D-A10Y-09 | (TODO) -- GDC | SNV__mutect | |
| TCGA-A2-A0CX-01A-21W-A019-09 | (TODO) -- GDC | SNV__mutect | |
| TCGA-A2-A0D0-01A-11W-A019-09 | (TODO) -- GDC | SNV__mutect | |
| TCGA-A2-A0D1-01A-11W-A050-09 | (TODO) -- GDC | SNV__mutect | |
| TCGA-A2-A0D2-01A-21W-A050-09 | (TODO) -- GDC | SNV__mutect | |
| TCGA-A2-A0D3-01A-11D-A10Y-09 | (TODO) -- GDC | SNV__mutect | |
| TCGA-A2-A0D4-01A-11W-A019-09 | (TODO) -- GDC | SNV__mutect | |
| TCGA-A2-A0EM-01A-11W-A050-09 | (TODO) -- GDC | SNV__mutect | |
| TCGA-A2-A0EN-01A-13D-A099-09 | (TODO) -- GDC | SNV__mutect | |
| TCGA-A2-A0EO-01A-11W-A050-09 | (TODO) -- GDC | SNV__mutect | |
| TCGA-A2-A0EP-01A-52D-A22X-09 | (TODO) -- GDC | SNV__mutect | |
| TCGA-A2-A0EQ-01A-11W-A050-09 | (TODO) -- GDC | SNV__mutect | |
| TCGA-A2-A0ER-01A-21W-A050-09 | (TODO) -- GDC | SNV__mutect | |
| TCGA-A2-A0ES-01A-11D-A10Y-09 | (TODO) -- GDC | SNV__mutect | |
| TCGA-A2-A0ET-01A-31D-A045-09 | (TODO) -- GDC | SNV__mutect | |
| TCGA-A2-A0EU-01A-22W-A071-09 | (TODO) -- GDC | SNV__mutect | |
| TCGA-A2-A0EV-01A-11W-A050-09 | (TODO) -- GDC | SNV__mutect | |
| TCGA-A2-A0EW-01A-21D-A10Y-09 | (TODO) -- GDC | SNV__mutect | |
| TCGA-A2-A0EX-01A-21W-A050-09 | (TODO) -- GDC | SNV__mutect | |
| TCGA-A2-A0EY-01A-11W-A050-09 | (TODO) -- GDC | SNV__mutect | |
| TCGA-A2-A0ST-01A-12D-A099-09 | (TODO) -- GDC | SNV__mutect | |
| TCGA-A2-A0SU-01A-11D-A099-09 | (TODO) -- GDC | SNV__mutect | |
| TCGA-A2-A0SV-01A-11D-A099-09 | (TODO) -- GDC | SNV__mutect | |
| TCGA-A2-A0SW-01A-11D-A099-09 | (TODO) -- GDC | SNV__mutect | |
| TCGA-A2-A0SX-01A-12D-A099-09 | (TODO) -- GDC | SNV__mutect | |
| TCGA-A2-A0SY-01A-31D-A099-09 | (TODO) -- GDC | SNV__mutect | |
| TCGA-A2-A0T0-01A-22D-A099-09 | (TODO) -- GDC | SNV__mutect | |
| TCGA-A2-A0T1-01A-21D-A099-09 | (TODO) -- GDC | SNV__mutect | |
| TCGA-A2-A0T2-01A-11W-A097-09 | (TODO) -- GDC | SNV__mutect | |
| TCGA-A2-A0T3-01A-21D-A10Y-09 | (TODO) -- GDC | SNV__mutect | |
| TCGA-A2-A0T4-01A-31D-A099-09 | (TODO) -- GDC | SNV__mutect | |
| TCGA-A2-A0T5-01A-21D-A099-09 | (TODO) -- GDC | SNV__mutect | |
| TCGA-A2-A0T6-01A-11D-A099-09 | (TODO) -- GDC | SNV__mutect | |
| TCGA-A2-A0T7-01A-21D-A099-09 | (TODO) -- GDC | SNV__mutect | |
| TCGA-A2-A0YC-01A-11D-A117-09 | (TODO) -- GDC | SNV__mutect | |
| TCGA-A2-A0YD-01A-11D-A10G-09 | (TODO) -- GDC | SNV__mutect | |
| TCGA-A2-A0YE-01A-11D-A10G-09 | (TODO) -- GDC | SNV__mutect | |
| TCGA-A2-A0YF-01A-21D-A10G-09 | (TODO) -- GDC | SNV__mutect | |
| TCGA-A2-A0YG-01A-21D-A10G-09 | (TODO) -- GDC | SNV__mutect | |
| TCGA-A2-A0YH-01A-11D-A10G-09 | (TODO) -- GDC | SNV__mutect | |
| TCGA-A2-A0YI-01A-31D-A10M-09 | (TODO) -- GDC | SNV__mutect | |
| TCGA-A2-A0YJ-01A-11D-A10G-09 | (TODO) -- GDC | SNV__mutect | |
| TCGA-A2-A0YK-01A-22D-A117-09 | (TODO) -- GDC | SNV__mutect | |
| TCGA-A2-A0YL-01A-21D-A10G-09 | (TODO) -- GDC | SNV__mutect | |
| TCGA-A2-A0YM-01A-11D-A10G-09 | (TODO) -- GDC | SNV__mutect | |
| TCGA-A2-A0YT-01A-11D-A10G-09 | (TODO) -- GDC | SNV__mutect | |
| TCGA-A2-A1FV-01A-11D-A13L-09 | (TODO) -- GDC | SNV__mutect | |
| TCGA-A2-A1FW-01A-11D-A13L-09 | (TODO) -- GDC | SNV__mutect | |
| TCGA-A2-A1FX-01A-11D-A13L-09 | (TODO) -- GDC | SNV__mutect | |
| TCGA-A2-A1FZ-01A-51D-A17G-09 | (TODO) -- GDC | SNV__mutect | |
| TCGA-A2-A1G0-01A-11D-A13L-09 | (TODO) -- GDC | SNV__mutect | |
| TCGA-A2-A1G1-01A-21D-A13L-09 | (TODO) -- GDC | SNV__mutect | |
| TCGA-A2-A1G4-01A-11D-A13L-09 | (TODO) -- GDC | SNV__mutect | |
| TCGA-A2-A1G6-01A-11D-A13L-09 | (TODO) -- GDC | SNV__mutect | |
| TCGA-A2-A259-01A-11D-A16D-09 | (TODO) -- GDC | SNV__mutect | |
| TCGA-A2-A25A-01A-12D-A16D-09 | (TODO) -- GDC | SNV__mutect | |
| TCGA-A2-A25B-01A-11D-A167-09 | (TODO) -- GDC | SNV__mutect | |
| TCGA-A2-A25C-01A-11D-A167-09 | (TODO) -- GDC | SNV__mutect | |
| TCGA-A2-A25D-01A-12D-A16D-09 | (TODO) -- GDC | SNV__mutect | |
| TCGA-A2-A25E-01A-11D-A167-09 | (TODO) -- GDC | SNV__mutect | |
| TCGA-A2-A25F-01A-11D-A167-09 | (TODO) -- GDC | SNV__mutect | |
| TCGA-A2-A3KC-01A-11D-A20S-09 | (TODO) -- GDC | SNV__mutect | |
| TCGA-A2-A3KD-01A-12D-A20S-09 | (TODO) -- GDC | SNV__mutect | |
| TCGA-A2-A3XS-01A-11D-A22X-09 | (TODO) -- GDC | SNV__mutect | |
| TCGA-A2-A3XT-01A-11D-A22X-09 | (TODO) -- GDC | SNV__mutect | |
| TCGA-A2-A3XU-01A-12D-A22X-09 | (TODO) -- GDC | SNV__mutect | |
| TCGA-A2-A3XV-01A-21D-A23C-09 | (TODO) -- GDC | SNV__mutect | |
| TCGA-A2-A3XW-01A-11D-A23C-09 | (TODO) -- GDC | SNV__mutect | |
| TCGA-A2-A3XX-01A-21D-A23C-09 | (TODO) -- GDC | SNV__mutect | |
| TCGA-A2-A3XY-01A-11D-A23C-09 | (TODO) -- GDC | SNV__mutect | |
| TCGA-A2-A3XZ-01A-42D-A23C-09 | (TODO) -- GDC | SNV__mutect | |
| TCGA-A2-A3Y0-01A-11D-A23C-09 | (TODO) -- GDC | SNV__mutect | |
| TCGA-A2-A4RW-01A-21D-A25Q-09 | (TODO) -- GDC | SNV__mutect | |
| TCGA-A2-A4RX-01A-11D-A25Q-09 | (TODO) -- GDC | SNV__mutect | |
| TCGA-A2-A4RY-01A-31D-A25Q-09 | (TODO) -- GDC | SNV__mutect | |
| TCGA-A2-A4S0-01A-21D-A25Q-09 | (TODO) -- GDC | SNV__mutect | |
| TCGA-A2-A4S1-01A-21D-A25Q-09 | (TODO) -- GDC | SNV__mutect | |
| TCGA-A2-A4S2-01A-12D-A25Q-09 | (TODO) -- GDC | SNV__mutect | |
| TCGA-A2-A4S3-01A-21D-A25Q-09 | (TODO) -- GDC | SNV__mutect | |
| TCGA-A7-A0CD-01A-11W-A019-09 | (TODO) -- GDC | SNV__mutect | |
| TCGA-A7-A0CE-01A-11W-A019-09 | (TODO) -- GDC | SNV__mutect | |
| TCGA-A7-A0CG-01A-11W-A019-09 | (TODO) -- GDC | SNV__mutect | |
| TCGA-A7-A0CJ-01A-21W-A019-09 | (TODO) -- GDC | SNV__mutect | |
| TCGA-A7-A0D9-01A-31W-A071-09 | (TODO) -- GDC | SNV__mutect | |
| TCGA-A7-A0DA-01A-31D-A10Y-09 | (TODO) -- GDC | SNV__mutect | |
| TCGA-A7-A0DB-01A-11D-A272-09 | (TODO) -- GDC | SNV__mutect | |
| TCGA-A7-A0DB-01A-11W-A019-09 | (TODO) -- GDC | SNV__mutect | |
| TCGA-A7-A13D-01A-13D-A12Q-09 | (TODO) -- GDC | SNV__mutect | |
| TCGA-A7-A13D-01A-13D-A272-09 | (TODO) -- GDC | SNV__mutect | |
| TCGA-A7-A13E-01A-11D-A12Q-09 | (TODO) -- GDC | SNV__mutect | |
| TCGA-A7-A13E-01A-11D-A272-09 | (TODO) -- GDC | SNV__mutect | |
| TCGA-A7-A13F-01A-11D-A12Q-09 | (TODO) -- GDC | SNV__mutect | |
| TCGA-A7-A13G-01A-11D-A13L-09 | (TODO) -- GDC | SNV__mutect | |
| TCGA-A7-A13H-01A-11D-A228-09 | (TODO) -- GDC | SNV__mutect | |
| TCGA-A7-A26E-01A-11D-A167-09 | (TODO) -- GDC | SNV__mutect | |
| TCGA-A7-A26E-01A-11D-A272-09 | (TODO) -- GDC | SNV__mutect | |
| TCGA-A7-A26F-01A-21D-A167-09 | (TODO) -- GDC | SNV__mutect | |
| TCGA-A7-A26G-01A-21D-A167-09 | (TODO) -- GDC | SNV__mutect | |
| TCGA-A7-A26H-01A-11D-A167-09 | (TODO) -- GDC | SNV__mutect | |
| TCGA-A7-A26I-01A-11D-A167-09 | (TODO) -- GDC | SNV__mutect | |
| TCGA-A7-A26J-01A-11D-A167-09 | (TODO) -- GDC | SNV__mutect | |
| TCGA-A7-A26J-01A-11D-A272-09 | (TODO) -- GDC | SNV__mutect | |
| TCGA-A7-A2KD-01A-31D-A21Q-09 | (TODO) -- GDC | SNV__mutect | |
| TCGA-A7-A3IY-01A-21D-A21Q-09 | (TODO) -- GDC | SNV__mutect | |
| TCGA-A7-A3IZ-01A-11D-A20S-09 | (TODO) -- GDC | SNV__mutect | |
| TCGA-A7-A3J0-01A-11D-A20S-09 | (TODO) -- GDC | SNV__mutect | |
| TCGA-A7-A3J1-01A-11D-A20S-09 | (TODO) -- GDC | SNV__mutect | |
| TCGA-A7-A3RF-01A-11D-A228-09 | (TODO) -- GDC | SNV__mutect | |
| TCGA-A7-A425-01A-11D-A243-09 | (TODO) -- GDC | SNV__mutect | |
| TCGA-A7-A426-01A-22D-A243-09 | (TODO) -- GDC | SNV__mutect | |
| TCGA-A7-A4SA-01A-11D-A25Q-09 | (TODO) -- GDC | SNV__mutect | |
| TCGA-A7-A4SB-01A-21D-A25Q-09 | (TODO) -- GDC | SNV__mutect | |
| TCGA-A7-A4SC-01A-12D-A25Q-09 | (TODO) -- GDC | SNV__mutect | |
| TCGA-A7-A4SD-01A-11D-A25Q-09 | (TODO) -- GDC | SNV__mutect | |
| TCGA-A7-A4SE-01A-11D-A25Q-09 | (TODO) -- GDC | SNV__mutect | |
| TCGA-A7-A4SF-01A-11D-A25Q-09 | (TODO) -- GDC | SNV__mutect | |
| TCGA-A7-A56D-01A-11D-A27P-09 | (TODO) -- GDC | SNV__mutect | |
| TCGA-A7-A5ZW-01A-12D-A29N-09 | (TODO) -- GDC | SNV__mutect | |
| TCGA-A7-A5ZX-01A-12D-A29N-09 | (TODO) -- GDC | SNV__mutect | |
| TCGA-A7-A6VV-01A-22D-A33E-09 | (TODO) -- GDC | SNV__mutect | |
| TCGA-A7-A6VW-01A-21D-A33E-09 | (TODO) -- GDC | SNV__mutect | |
| TCGA-A7-A6VX-01A-12D-A33E-09 | (TODO) -- GDC | SNV__mutect | |
| TCGA-A7-A6VY-01A-12D-A33E-09 | (TODO) -- GDC | SNV__mutect | |
| TCGA-A8-A06O-01A-11W-A019-09 | (TODO) -- GDC | SNV__mutect | |
| TCGA-A8-A06P-01A-11W-A019-09 | (TODO) -- GDC | SNV__mutect | |
| TCGA-A8-A06Q-01A-11W-A050-09 | (TODO) -- GDC | SNV__mutect | |
| TCGA-A8-A06R-01A-11D-A015-09 | (TODO) -- GDC | SNV__mutect | |
| TCGA-A8-A06T-01A-11W-A019-09 | (TODO) -- GDC | SNV__mutect | |
| TCGA-A8-A06U-01A-11W-A019-09 | (TODO) -- GDC | SNV__mutect | |
| TCGA-A8-A06X-01A-21W-A019-09 | (TODO) -- GDC | SNV__mutect | |
| TCGA-A8-A06Y-01A-21W-A019-09 | (TODO) -- GDC | SNV__mutect | |
| TCGA-A8-A06Z-01A-11W-A019-09 | (TODO) -- GDC | SNV__mutect | |
| TCGA-A8-A075-01A-11D-A099-09 | (TODO) -- GDC | SNV__mutect | |
| TCGA-A8-A076-01A-21W-A019-09 | (TODO) -- GDC | SNV__mutect | |
| TCGA-A8-A079-01A-21W-A019-09 | (TODO) -- GDC | SNV__mutect | |
| TCGA-A8-A07B-01A-11W-A019-09 | (TODO) -- GDC | SNV__mutect | |
| TCGA-A8-A07F-01A-11W-A019-09 | (TODO) -- GDC | SNV__mutect | |
| TCGA-A8-A07G-01A-11W-A050-09 | (TODO) -- GDC | SNV__mutect | |
| TCGA-A8-A07I-01A-11W-A019-09 | (TODO) -- GDC | SNV__mutect | |
| TCGA-A8-A07J-01A-11W-A019-09 | (TODO) -- GDC | SNV__mutect | |
| TCGA-A8-A07L-01A-11W-A019-09 | (TODO) -- GDC | SNV__mutect | |
| TCGA-A8-A07O-01A-11W-A019-09 | (TODO) -- GDC | SNV__mutect | |
| TCGA-A8-A07P-01A-11W-A019-09 | (TODO) -- GDC | SNV__mutect | |
| TCGA-A8-A07R-01A-21W-A050-09 | (TODO) -- GDC | SNV__mutect | |
| TCGA-A8-A07U-01A-11W-A050-09 | (TODO) -- GDC | SNV__mutect | |
| TCGA-A8-A07W-01A-11W-A019-09 | (TODO) -- GDC | SNV__mutect | |
| TCGA-A8-A07Z-01A-11W-A019-09 | (TODO) -- GDC | SNV__mutect | |
| TCGA-A8-A081-01A-11W-A019-09 | (TODO) -- GDC | SNV__mutect | |
| TCGA-A8-A082-01A-11W-A019-09 | (TODO) -- GDC | SNV__mutect | |
| TCGA-A8-A083-01A-21W-A019-09 | (TODO) -- GDC | SNV__mutect | |
| TCGA-A8-A085-01A-11W-A019-09 | (TODO) -- GDC | SNV__mutect | |
| TCGA-A8-A08B-01A-11W-A019-09 | (TODO) -- GDC | SNV__mutect | |
| TCGA-A8-A08C-01A-11W-A019-09 | (TODO) -- GDC | SNV__mutect | |
| TCGA-A8-A08F-01A-11W-A019-09 | (TODO) -- GDC | SNV__mutect | |
| TCGA-A8-A08G-01A-11W-A019-09 | (TODO) -- GDC | SNV__mutect | |
| TCGA-A8-A08H-01A-21W-A019-09 | (TODO) -- GDC | SNV__mutect | |
| TCGA-A8-A08J-01A-11W-A019-09 | (TODO) -- GDC | SNV__mutect | |
| TCGA-A8-A08L-01A-11W-A019-09 | (TODO) -- GDC | SNV__mutect | |
| TCGA-A8-A08O-01A-21W-A071-09 | (TODO) -- GDC | SNV__mutect | |
| TCGA-A8-A08P-01A-11W-A019-09 | (TODO) -- GDC | SNV__mutect | |
| TCGA-A8-A08R-01A-11W-A050-09 | (TODO) -- GDC | SNV__mutect | |
| TCGA-A8-A08S-01A-11W-A050-09 | (TODO) -- GDC | SNV__mutect | |
| TCGA-A8-A08T-01A-21W-A019-09 | (TODO) -- GDC | SNV__mutect | |
| TCGA-A8-A08X-01A-21W-A019-09 | (TODO) -- GDC | SNV__mutect | |
| TCGA-A8-A08Z-01A-21W-A019-09 | (TODO) -- GDC | SNV__mutect | |
| TCGA-A8-A090-01A-11W-A019-09 | (TODO) -- GDC | SNV__mutect | |
| TCGA-A8-A091-01A-11W-A019-09 | (TODO) -- GDC | SNV__mutect | |
| TCGA-A8-A092-01A-11W-A019-09 | (TODO) -- GDC | SNV__mutect | |
| TCGA-A8-A093-01A-11W-A019-09 | (TODO) -- GDC | SNV__mutect | |
| TCGA-A8-A094-01A-11W-A019-09 | (TODO) -- GDC | SNV__mutect | |
| TCGA-A8-A095-01A-11W-A019-09 | (TODO) -- GDC | SNV__mutect | |
| TCGA-A8-A096-01A-11W-A019-09 | (TODO) -- GDC | SNV__mutect | |
| TCGA-A8-A097-01A-11W-A050-09 | (TODO) -- GDC | SNV__mutect | |
| TCGA-A8-A099-01A-11W-A019-09 | (TODO) -- GDC | SNV__mutect | |
| TCGA-A8-A09A-01A-11W-A019-09 | (TODO) -- GDC | SNV__mutect | |
| TCGA-A8-A09B-01A-11W-A019-09 | (TODO) -- GDC | SNV__mutect | |
| TCGA-A8-A09C-01A-11W-A019-09 | (TODO) -- GDC | SNV__mutect | |
| TCGA-A8-A09D-01A-11W-A019-09 | (TODO) -- GDC | SNV__mutect | |
| TCGA-A8-A09E-01A-11W-A019-09 | (TODO) -- GDC | SNV__mutect | |
| TCGA-A8-A09G-01A-21W-A019-09 | (TODO) -- GDC | SNV__mutect | |
| TCGA-A8-A09I-01A-22W-A050-09 | (TODO) -- GDC | SNV__mutect | |
| TCGA-A8-A09K-01A-11W-A019-09 | (TODO) -- GDC | SNV__mutect | |
| TCGA-A8-A09M-01A-11W-A019-09 | (TODO) -- GDC | SNV__mutect | |
| TCGA-A8-A09N-01A-11W-A019-09 | (TODO) -- GDC | SNV__mutect | |
| TCGA-A8-A09Q-01A-11W-A019-09 | (TODO) -- GDC | SNV__mutect | |
| TCGA-A8-A09T-01A-11W-A019-09 | (TODO) -- GDC | SNV__mutect | |
| TCGA-A8-A09V-01A-11D-A045-09 | (TODO) -- GDC | SNV__mutect | |
| TCGA-A8-A09W-01A-11W-A019-09 | (TODO) -- GDC | SNV__mutect | |
| TCGA-A8-A09X-01A-11W-A019-09 | (TODO) -- GDC | SNV__mutect | |
| TCGA-A8-A09Z-01A-11W-A019-09 | (TODO) -- GDC | SNV__mutect | |
| TCGA-A8-A0A1-01A-11W-A019-09 | (TODO) -- GDC | SNV__mutect | |
| TCGA-A8-A0A2-01A-11W-A050-09 | (TODO) -- GDC | SNV__mutect | |
| TCGA-A8-A0A4-01A-11W-A019-09 | (TODO) -- GDC | SNV__mutect | |
| TCGA-A8-A0A6-01A-12W-A071-09 | (TODO) -- GDC | SNV__mutect | |
| TCGA-A8-A0A7-01A-11W-A019-09 | (TODO) -- GDC | SNV__mutect | |
| TCGA-A8-A0A9-01A-11W-A019-09 | (TODO) -- GDC | SNV__mutect | |
| TCGA-A8-A0AB-01A-11W-A050-09 | (TODO) -- GDC | SNV__mutect | |
| TCGA-A8-A0AD-01A-11W-A071-09 | (TODO) -- GDC | SNV__mutect | |
| TCGA-AC-A23C-01A-12D-A167-09 | (TODO) -- GDC | SNV__mutect | |
| TCGA-AC-A23E-01A-11D-A159-09 | (TODO) -- GDC | SNV__mutect | |
| TCGA-AC-A23G-01A-11D-A20S-09 | (TODO) -- GDC | SNV__mutect | |
| TCGA-AC-A23H-01A-11D-A159-09 | (TODO) -- GDC | SNV__mutect | |
| TCGA-AC-A2B8-01A-11D-A17D-09 | (TODO) -- GDC | SNV__mutect | |
| TCGA-AC-A2BK-01A-11D-A21Q-09 | (TODO) -- GDC | SNV__mutect | |
| TCGA-AC-A2BM-01A-11D-A21Q-09 | (TODO) -- GDC | SNV__mutect | |
| TCGA-AC-A2FB-01A-11D-A17D-09 | (TODO) -- GDC | SNV__mutect | |
| TCGA-AC-A2FE-01A-11D-A19Y-09 | (TODO) -- GDC | SNV__mutect | |
| TCGA-AC-A2FF-01A-11D-A17D-09 | (TODO) -- GDC | SNV__mutect | |
| TCGA-AC-A2FG-01A-11D-A17D-09 | (TODO) -- GDC | SNV__mutect | |
| TCGA-AC-A2FK-01A-12D-A17W-09 | (TODO) -- GDC | SNV__mutect | |
| TCGA-AC-A2FM-01A-11D-A19Y-09 | (TODO) -- GDC | SNV__mutect | |
| TCGA-AC-A2FO-01A-11D-A17W-09 | (TODO) -- GDC | SNV__mutect | |
| TCGA-AC-A2QH-01A-11D-A18P-09 | (TODO) -- GDC | SNV__mutect | |
| TCGA-AC-A2QI-01A-12D-A19Y-09 | (TODO) -- GDC | SNV__mutect | |
| TCGA-AC-A2QJ-01A-12D-A19Y-09 | (TODO) -- GDC | SNV__mutect | |
| TCGA-AC-A3BB-01A-21D-A19Y-09 | (TODO) -- GDC | SNV__mutect | |
| TCGA-AC-A3EH-01A-22D-A228-09 | (TODO) -- GDC | SNV__mutect | |
| TCGA-AC-A3HN-01A-11D-A20S-09 | (TODO) -- GDC | SNV__mutect | |
| TCGA-AC-A3OD-01A-11D-A21Q-09 | (TODO) -- GDC | SNV__mutect | |
| TCGA-AC-A3QP-01A-11D-A22X-09 | (TODO) -- GDC | SNV__mutect | |
| TCGA-AC-A3QQ-01A-11D-A228-09 | (TODO) -- GDC | SNV__mutect | |
| TCGA-AC-A3TM-01A-11D-A228-09 | (TODO) -- GDC | SNV__mutect | |
| TCGA-AC-A3TN-01A-11D-A228-09 | (TODO) -- GDC | SNV__mutect | |
| TCGA-AC-A3W5-01A-11D-A228-09 | (TODO) -- GDC | SNV__mutect | |
| TCGA-AC-A3W6-01A-12D-A228-09 | (TODO) -- GDC | SNV__mutect | |
| TCGA-AC-A3W7-01A-11D-A228-09 | (TODO) -- GDC | SNV__mutect | |
| TCGA-AC-A3YI-01A-21D-A23C-09 | (TODO) -- GDC | SNV__mutect | |
| TCGA-AC-A3YJ-01A-11D-A22X-09 | (TODO) -- GDC | SNV__mutect | |
| TCGA-AC-A4ZE-01A-11D-A41F-09 | (TODO) -- GDC | SNV__mutect | |
| TCGA-AC-A5EH-01A-11D-A28B-09 | (TODO) -- GDC | SNV__mutect | |
| TCGA-AC-A5EI-01A-11D-A27P-09 | (TODO) -- GDC | SNV__mutect | |
| TCGA-AC-A5XS-01A-11D-A29N-09 | (TODO) -- GDC | SNV__mutect | |
| TCGA-AC-A5XU-01A-11D-A28B-09 | (TODO) -- GDC | SNV__mutect | |
| TCGA-AC-A62V-01A-11D-A31U-09 | (TODO) -- GDC | SNV__mutect | |
| TCGA-AC-A62X-01A-11D-A29N-09 | (TODO) -- GDC | SNV__mutect | |
| TCGA-AC-A62Y-01A-11D-A29N-09 | (TODO) -- GDC | SNV__mutect | |
| TCGA-AC-A6IV-01A-12D-A33E-09 | (TODO) -- GDC | SNV__mutect | |
| TCGA-AC-A6IW-01A-12D-A33E-09 | (TODO) -- GDC | SNV__mutect | |
| TCGA-AC-A6IX-01A-12D-A32I-09 | (TODO) -- GDC | SNV__mutect | |
| TCGA-AC-A6NO-01A-12D-A33E-09 | (TODO) -- GDC | SNV__mutect | |
| TCGA-AC-A7VB-01A-11D-A351-09 | (TODO) -- GDC | SNV__mutect | |
| TCGA-AC-A7VC-01A-11D-A351-09 | (TODO) -- GDC | SNV__mutect | |
| TCGA-AC-A8OP-01A-11D-A36J-09 | (TODO) -- GDC | SNV__mutect | |
| TCGA-AC-A8OQ-01A-11D-A41F-09 | (TODO) -- GDC | SNV__mutect | |
| TCGA-AC-A8OR-01A-21D-A41F-09 | (TODO) -- GDC | SNV__mutect | |
| TCGA-AC-A8OS-01A-12D-A41F-09 | (TODO) -- GDC | SNV__mutect | |
| TCGA-AN-A03X-01A-21W-A019-09 | (TODO) -- GDC | SNV__mutect | |
| TCGA-AN-A03Y-01A-21W-A019-09 | (TODO) -- GDC | SNV__mutect | |
| TCGA-AN-A041-01A-11W-A050-09 | (TODO) -- GDC | SNV__mutect | |
| TCGA-AN-A046-01A-21W-A050-09 | (TODO) -- GDC | SNV__mutect | |
| TCGA-AN-A049-01A-21W-A019-09 | (TODO) -- GDC | SNV__mutect | |
| TCGA-AN-A04A-01A-21W-A050-09 | (TODO) -- GDC | SNV__mutect | |
| TCGA-AN-A04C-01A-21W-A050-09 | (TODO) -- GDC | SNV__mutect | |
| TCGA-AN-A04D-01A-21W-A050-09 | (TODO) -- GDC | SNV__mutect | |
| TCGA-AN-A0AJ-01A-11W-A019-09 | (TODO) -- GDC | SNV__mutect | |
| TCGA-AN-A0AK-01A-21W-A019-09 | (TODO) -- GDC | SNV__mutect | |
| TCGA-AN-A0AL-01A-11W-A019-09 | (TODO) -- GDC | SNV__mutect | |
| TCGA-AN-A0AM-01A-11W-A050-09 | (TODO) -- GDC | SNV__mutect | |
| TCGA-AN-A0AR-01A-11W-A019-09 | (TODO) -- GDC | SNV__mutect | |
| TCGA-AN-A0AS-01A-11W-A019-09 | (TODO) -- GDC | SNV__mutect | |
| TCGA-AN-A0AT-01A-11D-A045-09 | (TODO) -- GDC | SNV__mutect | |
| TCGA-AN-A0FD-01A-11W-A050-09 | (TODO) -- GDC | SNV__mutect | |
| TCGA-AN-A0FF-01A-11W-A050-09 | (TODO) -- GDC | SNV__mutect | |
| TCGA-AN-A0FJ-01A-11W-A019-09 | (TODO) -- GDC | SNV__mutect | |
| TCGA-AN-A0FK-01A-11W-A050-09 | (TODO) -- GDC | SNV__mutect | |
| TCGA-AN-A0FL-01A-11W-A050-09 | (TODO) -- GDC | SNV__mutect | |
| TCGA-AN-A0FN-01A-11W-A050-09 | (TODO) -- GDC | SNV__mutect | |
| TCGA-AN-A0FS-01A-11W-A050-09 | (TODO) -- GDC | SNV__mutect | |
| TCGA-AN-A0FT-01A-11W-A050-09 | (TODO) -- GDC | SNV__mutect | |
| TCGA-AN-A0FV-01A-11W-A019-09 | (TODO) -- GDC | SNV__mutect | |
| TCGA-AN-A0FW-01A-11W-A050-09 | (TODO) -- GDC | SNV__mutect | |
| TCGA-AN-A0FX-01A-11W-A050-09 | (TODO) -- GDC | SNV__mutect | |
| TCGA-AN-A0FY-01A-11W-A050-09 | (TODO) -- GDC | SNV__mutect | |
| TCGA-AN-A0FZ-01A-11W-A050-09 | (TODO) -- GDC | SNV__mutect | |
| TCGA-AN-A0G0-01A-11W-A050-09 | (TODO) -- GDC | SNV__mutect | |
| TCGA-AN-A0XN-01A-21D-A10G-09 | (TODO) -- GDC | SNV__mutect | |
| TCGA-AN-A0XO-01A-11D-A10G-09 | (TODO) -- GDC | SNV__mutect | |
| TCGA-AN-A0XP-01A-11D-A117-09 | (TODO) -- GDC | SNV__mutect | |
| TCGA-AN-A0XR-01A-11D-A10G-09 | (TODO) -- GDC | SNV__mutect | |
| TCGA-AN-A0XS-01A-22D-A10G-09 | (TODO) -- GDC | SNV__mutect | |
| TCGA-AN-A0XT-01A-11D-A10G-09 | (TODO) -- GDC | SNV__mutect | |
| TCGA-AN-A0XU-01A-11D-A10G-09 | (TODO) -- GDC | SNV__mutect | |
| TCGA-AN-A0XV-01A-11D-A10G-09 | (TODO) -- GDC | SNV__mutect | |
| TCGA-AN-A0XW-01A-11D-A10G-09 | (TODO) -- GDC | SNV__mutect | |
| TCGA-AO-A03L-01A-41W-A071-09 | (TODO) -- GDC | SNV__mutect | |
| TCGA-AO-A03O-01A-11W-A019-09 | (TODO) -- GDC | SNV__mutect | |
| TCGA-AO-A03P-01A-11W-A019-09 | (TODO) -- GDC | SNV__mutect | |
| TCGA-AO-A03R-01A-21W-A050-09 | (TODO) -- GDC | SNV__mutect | |
| TCGA-AO-A03T-01A-21W-A050-09 | (TODO) -- GDC | SNV__mutect | |
| TCGA-AO-A03V-01A-11D-A10Y-09 | (TODO) -- GDC | SNV__mutect | |
| TCGA-AO-A0J2-01A-11W-A050-09 | (TODO) -- GDC | SNV__mutect | |
| TCGA-AO-A0J3-01A-11W-A050-09 | (TODO) -- GDC | SNV__mutect | |
| TCGA-AO-A0J4-01A-11W-A050-09 | (TODO) -- GDC | SNV__mutect | |
| TCGA-AO-A0J5-01A-11W-A050-09 | (TODO) -- GDC | SNV__mutect | |
| TCGA-AO-A0J6-01A-11W-A050-09 | (TODO) -- GDC | SNV__mutect | |
| TCGA-AO-A0J7-01A-11W-A050-09 | (TODO) -- GDC | SNV__mutect | |
| TCGA-AO-A0J8-01A-21D-A045-09 | (TODO) -- GDC | SNV__mutect | |
| TCGA-AO-A0J9-01A-11W-A050-09 | (TODO) -- GDC | SNV__mutect | |
| TCGA-AO-A0JA-01A-11W-A071-09 | (TODO) -- GDC | SNV__mutect | |
| TCGA-AO-A0JB-01A-11W-A071-09 | (TODO) -- GDC | SNV__mutect | |
| TCGA-AO-A0JC-01A-11W-A071-09 | (TODO) -- GDC | SNV__mutect | |
| TCGA-AO-A0JD-01A-11W-A071-09 | (TODO) -- GDC | SNV__mutect | |
| TCGA-AO-A0JE-01A-11W-A071-09 | (TODO) -- GDC | SNV__mutect | |
| TCGA-AO-A0JF-01A-11W-A071-09 | (TODO) -- GDC | SNV__mutect | |
| TCGA-AO-A0JG-01A-31D-A099-09 | (TODO) -- GDC | SNV__mutect | |
| TCGA-AO-A0JI-01A-21W-A100-09 | (TODO) -- GDC | SNV__mutect | |
| TCGA-AO-A0JJ-01A-11W-A071-09 | (TODO) -- GDC | SNV__mutect | |
| TCGA-AO-A0JM-01A-21W-A071-09 | (TODO) -- GDC | SNV__mutect | |
| TCGA-AO-A124-01A-11D-A10M-09 | (TODO) -- GDC | SNV__mutect | |
| TCGA-AO-A128-01A-11D-A10M-09 | (TODO) -- GDC | SNV__mutect | |
| TCGA-AO-A12A-01A-21D-A10Y-09 | (TODO) -- GDC | SNV__mutect | |
| TCGA-AO-A12D-01A-11D-A10Y-09 | (TODO) -- GDC | SNV__mutect | |
| TCGA-AO-A12F-01A-11D-A10Y-09 | (TODO) -- GDC | SNV__mutect | |
| TCGA-AO-A12H-01A-11D-A10Y-09 | (TODO) -- GDC | SNV__mutect | |
| TCGA-AO-A1KO-01A-31D-A188-09 | (TODO) -- GDC | SNV__mutect | |
| TCGA-AO-A1KP-01A-11D-A13L-09 | (TODO) -- GDC | SNV__mutect | |
| TCGA-AO-A1KR-01A-12D-A142-09 | (TODO) -- GDC | SNV__mutect | |
| TCGA-AO-A1KS-01A-11D-A13L-09 | (TODO) -- GDC | SNV__mutect | |
| TCGA-AO-A1KT-01A-11D-A13L-09 | (TODO) -- GDC | SNV__mutect | |
| TCGA-AQ-A04H-01B-11D-A10M-09 | (TODO) -- GDC | SNV__mutect | |
| TCGA-AQ-A04J-01A-02W-A050-09 | (TODO) -- GDC | SNV__mutect | |
| TCGA-AQ-A0Y5-01A-11D-A14K-09 | (TODO) -- GDC | SNV__mutect | |
| TCGA-AQ-A1H2-01A-11D-A13L-09 | (TODO) -- GDC | SNV__mutect | |
| TCGA-AQ-A1H3-01A-31D-A13L-09 | (TODO) -- GDC | SNV__mutect | |
| TCGA-AQ-A54N-01A-11D-A25Q-09 | (TODO) -- GDC | SNV__mutect | |
| TCGA-AQ-A54O-01A-11D-A25Q-09 | (TODO) -- GDC | SNV__mutect | |
| TCGA-AQ-A7U7-01A-22D-A351-09 | (TODO) -- GDC | SNV__mutect | |
| TCGA-AR-A0TP-01A-11D-A099-09 | (TODO) -- GDC | SNV__mutect | |
| TCGA-AR-A0TQ-01A-11D-A099-09 | (TODO) -- GDC | SNV__mutect | |
| TCGA-AR-A0TR-01A-11D-A099-09 | (TODO) -- GDC | SNV__mutect | |
| TCGA-AR-A0TS-01A-11D-A10Y-09 | (TODO) -- GDC | SNV__mutect | |
| TCGA-AR-A0TT-01A-31D-A099-09 | (TODO) -- GDC | SNV__mutect | |
| TCGA-AR-A0TU-01A-31D-A10G-09 | (TODO) -- GDC | SNV__mutect | |
| TCGA-AR-A0TV-01A-21D-A099-09 | (TODO) -- GDC | SNV__mutect | |
| TCGA-AR-A0TW-01A-11D-A099-09 | (TODO) -- GDC | SNV__mutect | |
| TCGA-AR-A0TX-01A-11D-A099-09 | (TODO) -- GDC | SNV__mutect | |
| TCGA-AR-A0TY-01A-12W-A12T-09 | (TODO) -- GDC | SNV__mutect | |
| TCGA-AR-A0TZ-01A-12D-A099-09 | (TODO) -- GDC | SNV__mutect | |
| TCGA-AR-A0U0-01A-11D-A10G-09 | (TODO) -- GDC | SNV__mutect | |
| TCGA-AR-A0U1-01A-11D-A10Y-09 | (TODO) -- GDC | SNV__mutect | |
| TCGA-AR-A0U2-01A-11D-A10G-09 | (TODO) -- GDC | SNV__mutect | |
| TCGA-AR-A0U3-01A-11D-A10G-09 | (TODO) -- GDC | SNV__mutect | |
| TCGA-AR-A1AH-01A-11D-A12B-09 | (TODO) -- GDC | SNV__mutect | |
| TCGA-AR-A1AI-01A-11D-A12Q-09 | (TODO) -- GDC | SNV__mutect | |
| TCGA-AR-A1AJ-01A-21D-A12Q-09 | (TODO) -- GDC | SNV__mutect | |
| TCGA-AR-A1AK-01A-21D-A12Q-09 | (TODO) -- GDC | SNV__mutect | |
| TCGA-AR-A1AL-01A-21D-A12Q-09 | (TODO) -- GDC | SNV__mutect | |
| TCGA-AR-A1AM-01A-41D-A228-09 | (TODO) -- GDC | SNV__mutect | |
| TCGA-AR-A1AN-01A-11D-A12Q-09 | (TODO) -- GDC | SNV__mutect | |
| TCGA-AR-A1AO-01A-11D-A12Q-09 | (TODO) -- GDC | SNV__mutect | |
| TCGA-AR-A1AP-01A-11D-A12Q-09 | (TODO) -- GDC | SNV__mutect | |
| TCGA-AR-A1AQ-01A-11D-A12Q-09 | (TODO) -- GDC | SNV__mutect | |
| TCGA-AR-A1AR-01A-31D-A135-09 | (TODO) -- GDC | SNV__mutect | |
| TCGA-AR-A1AS-01A-11D-A12Q-09 | (TODO) -- GDC | SNV__mutect | |
| TCGA-AR-A1AT-01A-11D-A12Q-09 | (TODO) -- GDC | SNV__mutect | |
| TCGA-AR-A1AU-01A-11D-A12Q-09 | (TODO) -- GDC | SNV__mutect | |
| TCGA-AR-A1AV-01A-21D-A12Q-09 | (TODO) -- GDC | SNV__mutect | |
| TCGA-AR-A1AW-01A-21D-A12Q-09 | (TODO) -- GDC | SNV__mutect | |
| TCGA-AR-A1AX-01A-11D-A12Q-09 | (TODO) -- GDC | SNV__mutect | |
| TCGA-AR-A1AY-01A-21D-A12Q-09 | (TODO) -- GDC | SNV__mutect | |
| TCGA-AR-A24H-01A-11D-A167-09 | (TODO) -- GDC | SNV__mutect | |
| TCGA-AR-A24K-01A-11D-A167-09 | (TODO) -- GDC | SNV__mutect | |
| TCGA-AR-A24L-01A-11D-A167-09 | (TODO) -- GDC | SNV__mutect | |
| TCGA-AR-A24M-01A-11D-A167-09 | (TODO) -- GDC | SNV__mutect | |
| TCGA-AR-A24N-01A-11D-A167-09 | (TODO) -- GDC | SNV__mutect | |
| TCGA-AR-A24O-01A-11D-A167-09 | (TODO) -- GDC | SNV__mutect | |
| TCGA-AR-A24P-01A-11D-A167-09 | (TODO) -- GDC | SNV__mutect | |
| TCGA-AR-A24Q-01A-12D-A167-09 | (TODO) -- GDC | SNV__mutect | |
| TCGA-AR-A24R-01A-11D-A167-09 | (TODO) -- GDC | SNV__mutect | |
| TCGA-AR-A24S-01A-11D-A167-09 | (TODO) -- GDC | SNV__mutect | |
| TCGA-AR-A24T-01A-11D-A167-09 | (TODO) -- GDC | SNV__mutect | |
| TCGA-AR-A24U-01A-11D-A167-09 | (TODO) -- GDC | SNV__mutect | |
| TCGA-AR-A24V-01A-21D-A167-09 | (TODO) -- GDC | SNV__mutect | |
| TCGA-AR-A24W-01A-11D-A17G-09 | (TODO) -- GDC | SNV__mutect | |
| TCGA-AR-A24X-01A-11D-A167-09 | (TODO) -- GDC | SNV__mutect | |
| TCGA-AR-A24Z-01A-11D-A167-09 | (TODO) -- GDC | SNV__mutect | |
| TCGA-AR-A250-01A-31D-A167-09 | (TODO) -- GDC | SNV__mutect | |
| TCGA-AR-A251-01A-12D-A167-09 | (TODO) -- GDC | SNV__mutect | |
| TCGA-AR-A252-01A-11D-A167-09 | (TODO) -- GDC | SNV__mutect | |
| TCGA-AR-A254-01A-21D-A167-09 | (TODO) -- GDC | SNV__mutect | |
| TCGA-AR-A255-01A-11D-A167-09 | (TODO) -- GDC | SNV__mutect | |
| TCGA-AR-A256-01A-11D-A167-09 | (TODO) -- GDC | SNV__mutect | |
| TCGA-AR-A2LE-01A-11D-A17W-09 | (TODO) -- GDC | SNV__mutect | |
| TCGA-AR-A2LH-01A-31D-A18P-09 | (TODO) -- GDC | SNV__mutect | |
| TCGA-AR-A2LJ-01A-12D-A19Y-09 | (TODO) -- GDC | SNV__mutect | |
| TCGA-AR-A2LK-01A-11D-A17W-09 | (TODO) -- GDC | SNV__mutect | |
| TCGA-AR-A2LL-01A-11D-A17W-09 | (TODO) -- GDC | SNV__mutect | |
| TCGA-AR-A2LM-01A-11D-A17W-09 | (TODO) -- GDC | SNV__mutect | |
| TCGA-AR-A2LN-01A-21D-A18P-09 | (TODO) -- GDC | SNV__mutect | |
| TCGA-AR-A2LO-01A-31D-A18P-09 | (TODO) -- GDC | SNV__mutect | |
| TCGA-AR-A2LQ-01A-22D-A18P-09 | (TODO) -- GDC | SNV__mutect | |
| TCGA-AR-A2LR-01A-12D-A18P-09 | (TODO) -- GDC | SNV__mutect | |
| TCGA-AR-A5QM-01A-11D-A27P-09 | (TODO) -- GDC | SNV__mutect | |
| TCGA-AR-A5QN-01A-12D-A28B-09 | (TODO) -- GDC | SNV__mutect | |
| TCGA-AR-A5QP-01A-11D-A28B-09 | (TODO) -- GDC | SNV__mutect | |
| TCGA-AR-A5QQ-01A-11D-A28B-09 | (TODO) -- GDC | SNV__mutect | |
| TCGA-B6-A0I1-01A-11D-A21Q-09 | (TODO) -- GDC | SNV__mutect | |
| TCGA-B6-A0I2-01A-11W-A050-09 | (TODO) -- GDC | SNV__mutect | |
| TCGA-B6-A0I5-01A-11W-A100-09 | (TODO) -- GDC | SNV__mutect | |
| TCGA-B6-A0I6-01A-11D-A128-09 | (TODO) -- GDC | SNV__mutect | |
| TCGA-B6-A0I6-01A-11W-A100-09 | (TODO) -- GDC | SNV__mutect | |
| TCGA-B6-A0I8-01A-11W-A050-09 | (TODO) -- GDC | SNV__mutect | |
| TCGA-B6-A0I9-01A-11W-A050-09 | (TODO) -- GDC | SNV__mutect | |
| TCGA-B6-A0IA-01A-11W-A050-09 | (TODO) -- GDC | SNV__mutect | |
| TCGA-B6-A0IB-01A-11W-A050-09 | (TODO) -- GDC | SNV__mutect | |
| TCGA-B6-A0IC-01A-11W-A050-09 | (TODO) -- GDC | SNV__mutect | |
| TCGA-B6-A0IE-01A-11W-A050-09 | (TODO) -- GDC | SNV__mutect | |
| TCGA-B6-A0IH-01A-11D-A10Y-09 | (TODO) -- GDC | SNV__mutect | |
| TCGA-B6-A0IJ-01A-11W-A050-09 | (TODO) -- GDC | SNV__mutect | |
| TCGA-B6-A0IK-01A-12W-A071-09 | (TODO) -- GDC | SNV__mutect | |
| TCGA-B6-A0IM-01A-11W-A050-09 | (TODO) -- GDC | SNV__mutect | |
| TCGA-B6-A0IN-01A-11W-A050-09 | (TODO) -- GDC | SNV__mutect | |
| TCGA-B6-A0RE-01A-11W-A071-09 | (TODO) -- GDC | SNV__mutect | |
| TCGA-B6-A0RG-01A-11W-A071-09 | (TODO) -- GDC | SNV__mutect | |
| TCGA-B6-A0RH-01A-21D-A10Y-09 | (TODO) -- GDC | SNV__mutect | |
| TCGA-B6-A0RI-01A-11W-A071-09 | (TODO) -- GDC | SNV__mutect | |
| TCGA-B6-A0RL-01A-11D-A099-09 | (TODO) -- GDC | SNV__mutect | |
| TCGA-B6-A0RM-01A-11D-A099-09 | (TODO) -- GDC | SNV__mutect | |
| TCGA-B6-A0RN-01A-12D-A099-09 | (TODO) -- GDC | SNV__mutect | |
| TCGA-B6-A0RO-01A-22D-A099-09 | (TODO) -- GDC | SNV__mutect | |
| TCGA-B6-A0RP-01A-21D-A099-09 | (TODO) -- GDC | SNV__mutect | |
| TCGA-B6-A0RQ-01A-11D-A10Y-09 | (TODO) -- GDC | SNV__mutect | |
| TCGA-B6-A0RS-01A-11D-A099-09 | (TODO) -- GDC | SNV__mutect | |
| TCGA-B6-A0RT-01A-21D-A099-09 | (TODO) -- GDC | SNV__mutect | |
| TCGA-B6-A0RU-01A-11D-A099-09 | (TODO) -- GDC | SNV__mutect | |
| TCGA-B6-A0RV-01A-11D-A099-09 | (TODO) -- GDC | SNV__mutect | |
| TCGA-B6-A0WS-01A-11D-A10Y-09 | (TODO) -- GDC | SNV__mutect | |
| TCGA-B6-A0WT-01A-11D-A10G-09 | (TODO) -- GDC | SNV__mutect | |
| TCGA-B6-A0WV-01A-11D-A10G-09 | (TODO) -- GDC | SNV__mutect | |
| TCGA-B6-A0WW-01A-11D-A10G-09 | (TODO) -- GDC | SNV__mutect | |
| TCGA-B6-A0WX-01A-11D-A10G-09 | (TODO) -- GDC | SNV__mutect | |
| TCGA-B6-A0WY-01A-11D-A10G-09 | (TODO) -- GDC | SNV__mutect | |
| TCGA-B6-A0WZ-01A-11D-A10G-09 | (TODO) -- GDC | SNV__mutect | |
| TCGA-B6-A0X0-01A-21D-A10Y-09 | (TODO) -- GDC | SNV__mutect | |
| TCGA-B6-A0X1-01A-11D-A10G-09 | (TODO) -- GDC | SNV__mutect | |
| TCGA-B6-A0X4-01A-11D-A10G-09 | (TODO) -- GDC | SNV__mutect | |
| TCGA-B6-A0X5-01A-21D-A10G-09 | (TODO) -- GDC | SNV__mutect | |
| TCGA-B6-A1KC-01B-11D-A159-09 | (TODO) -- GDC | SNV__mutect | |
| TCGA-B6-A1KF-01A-11D-A13L-09 | (TODO) -- GDC | SNV__mutect | |
| TCGA-B6-A1KI-01A-11D-A14K-09 | (TODO) -- GDC | SNV__mutect | |
| TCGA-B6-A1KN-01A-11D-A13L-09 | (TODO) -- GDC | SNV__mutect | |
| TCGA-B6-A2IU-01A-32D-A19T-09 | (TODO) -- GDC | SNV__mutect | |
| TCGA-B6-A3ZX-01A-11D-A23C-09 | (TODO) -- GDC | SNV__mutect | |
| TCGA-B6-A400-01A-11D-A23C-09 | (TODO) -- GDC | SNV__mutect | |
| TCGA-B6-A401-01A-11D-A23C-09 | (TODO) -- GDC | SNV__mutect | |
| TCGA-B6-A402-01A-11D-A23C-09 | (TODO) -- GDC | SNV__mutect | |
| TCGA-B6-A408-01A-12D-A243-09 | (TODO) -- GDC | SNV__mutect | |
| TCGA-B6-A409-01A-11D-A243-09 | (TODO) -- GDC | SNV__mutect | |
| TCGA-B6-A40B-01A-11D-A23C-09 | (TODO) -- GDC | SNV__mutect | |
| TCGA-B6-A40C-01A-11D-A23C-09 | (TODO) -- GDC | SNV__mutect | |
| TCGA-BH-A0AU-01A-11D-A12Q-09 | (TODO) -- GDC | SNV__mutect | |
| TCGA-BH-A0AV-01A-31D-A10Y-09 | (TODO) -- GDC | SNV__mutect | |
| TCGA-BH-A0AW-01A-11W-A071-09 | (TODO) -- GDC | SNV__mutect | |
| TCGA-BH-A0AY-01A-21W-A019-09 | (TODO) -- GDC | SNV__mutect | |
| TCGA-BH-A0AZ-01A-21D-A12Q-09 | (TODO) -- GDC | SNV__mutect | |
| TCGA-BH-A0B0-01A-21D-A10Y-09 | (TODO) -- GDC | SNV__mutect | |
| TCGA-BH-A0B1-01A-12W-A071-09 | (TODO) -- GDC | SNV__mutect | |
| TCGA-BH-A0B3-01A-11W-A071-09 | (TODO) -- GDC | SNV__mutect | |
| TCGA-BH-A0B4-01A-11W-A019-09 | (TODO) -- GDC | SNV__mutect | |
| TCGA-BH-A0B5-01A-11D-A12Q-09 | (TODO) -- GDC | SNV__mutect | |
| TCGA-BH-A0B6-01A-11D-A19Y-09 | (TODO) -- GDC | SNV__mutect | |
| TCGA-BH-A0B7-01A-12D-A10Y-09 | (TODO) -- GDC | SNV__mutect | |
| TCGA-BH-A0B8-01A-21W-A071-09 | (TODO) -- GDC | SNV__mutect | |
| TCGA-BH-A0B9-01A-11W-A071-09 | (TODO) -- GDC | SNV__mutect | |
| TCGA-BH-A0BA-01A-11W-A071-09 | (TODO) -- GDC | SNV__mutect | |
| TCGA-BH-A0BC-01A-22D-A099-09 | (TODO) -- GDC | SNV__mutect | |
| TCGA-BH-A0BD-01A-11W-A050-09 | (TODO) -- GDC | SNV__mutect | |
| TCGA-BH-A0BF-01A-21D-A12Q-09 | (TODO) -- GDC | SNV__mutect | |
| TCGA-BH-A0BG-01A-11D-A10Y-09 | (TODO) -- GDC | SNV__mutect | |
| TCGA-BH-A0BJ-01A-11W-A071-09 | (TODO) -- GDC | SNV__mutect | |
| TCGA-BH-A0BL-01A-11D-A10Y-09 | (TODO) -- GDC | SNV__mutect | |
| TCGA-BH-A0BM-01A-11W-A071-09 | (TODO) -- GDC | SNV__mutect | |
| TCGA-BH-A0BO-01A-23D-A12B-09 | (TODO) -- GDC | SNV__mutect | |
| TCGA-BH-A0BP-01A-11D-A10Y-09 | (TODO) -- GDC | SNV__mutect | |
| TCGA-BH-A0BQ-01A-21D-A10Y-09 | (TODO) -- GDC | SNV__mutect | |
| TCGA-BH-A0BR-01A-21W-A12T-09 | (TODO) -- GDC | SNV__mutect | |
| TCGA-BH-A0BS-01A-11D-A12Q-09 | (TODO) -- GDC | SNV__mutect | |
| TCGA-BH-A0BT-01A-11D-A12Q-09 | (TODO) -- GDC | SNV__mutect | |
| TCGA-BH-A0BV-01A-11W-A019-09 | (TODO) -- GDC | SNV__mutect | |
| TCGA-BH-A0BW-01A-11D-A10Y-09 | (TODO) -- GDC | SNV__mutect | |
| TCGA-BH-A0BZ-01A-31D-A12Q-09 | (TODO) -- GDC | SNV__mutect | |
| TCGA-BH-A0C0-01A-21W-A071-09 | (TODO) -- GDC | SNV__mutect | |
| TCGA-BH-A0C1-01B-11D-A12B-09 | (TODO) -- GDC | SNV__mutect | |
| TCGA-BH-A0C3-01A-21D-A12Q-09 | (TODO) -- GDC | SNV__mutect | |
| TCGA-BH-A0C7-01B-11D-A10Y-09 | (TODO) -- GDC | SNV__mutect | |
| TCGA-BH-A0DD-01A-31D-A12Q-09 | (TODO) -- GDC | SNV__mutect | |
| TCGA-BH-A0DE-01A-11D-A10Y-09 | (TODO) -- GDC | SNV__mutect | |
| TCGA-BH-A0DG-01A-21D-A12Q-09 | (TODO) -- GDC | SNV__mutect | |
| TCGA-BH-A0DH-01A-11D-A099-09 | (TODO) -- GDC | SNV__mutect | |
| TCGA-BH-A0DI-01A-21D-A12Q-09 | (TODO) -- GDC | SNV__mutect | |
| TCGA-BH-A0DK-01A-21W-A071-09 | (TODO) -- GDC | SNV__mutect | |
| TCGA-BH-A0DL-01A-11D-A10Y-09 | (TODO) -- GDC | SNV__mutect | |
| TCGA-BH-A0DO-01B-11D-A12B-09 | (TODO) -- GDC | SNV__mutect | |
| TCGA-BH-A0DP-01A-21W-A071-09 | (TODO) -- GDC | SNV__mutect | |
| TCGA-BH-A0DQ-01A-11D-A099-09 | (TODO) -- GDC | SNV__mutect | |
| TCGA-BH-A0DS-01A-11W-A071-09 | (TODO) -- GDC | SNV__mutect | |
| TCGA-BH-A0DT-01A-21D-A12B-09 | (TODO) -- GDC | SNV__mutect | |
| TCGA-BH-A0DV-01A-21D-A12Q-09 | (TODO) -- GDC | SNV__mutect | |
| TCGA-BH-A0DX-01A-11D-A10Y-09 | (TODO) -- GDC | SNV__mutect | |
| TCGA-BH-A0DZ-01A-11W-A019-09 | (TODO) -- GDC | SNV__mutect | |
| TCGA-BH-A0E0-01A-11W-A071-09 | (TODO) -- GDC | SNV__mutect | |
| TCGA-BH-A0E1-01A-11W-A071-09 | (TODO) -- GDC | SNV__mutect | |
| TCGA-BH-A0E2-01A-11W-A071-09 | (TODO) -- GDC | SNV__mutect | |
| TCGA-BH-A0E7-01A-11W-A050-09 | (TODO) -- GDC | SNV__mutect | |
| TCGA-BH-A0E9-01B-11D-A10Y-09 | (TODO) -- GDC | SNV__mutect | |
| TCGA-BH-A0EA-01A-11D-A10Y-09 | (TODO) -- GDC | SNV__mutect | |
| TCGA-BH-A0EB-01A-11W-A050-09 | (TODO) -- GDC | SNV__mutect | |
| TCGA-BH-A0EE-01A-11W-A050-09 | (TODO) -- GDC | SNV__mutect | |
| TCGA-BH-A0EI-01A-11D-A10Y-09 | (TODO) -- GDC | SNV__mutect | |
| TCGA-BH-A0GY-01A-11W-A071-09 | (TODO) -- GDC | SNV__mutect | |
| TCGA-BH-A0GZ-01A-11W-A071-09 | (TODO) -- GDC | SNV__mutect | |
| TCGA-BH-A0H0-01A-11W-A071-09 | (TODO) -- GDC | SNV__mutect | |
| TCGA-BH-A0H3-01A-11D-A12Q-09 | (TODO) -- GDC | SNV__mutect | |
| TCGA-BH-A0H5-01A-21D-A10Y-09 | (TODO) -- GDC | SNV__mutect | |
| TCGA-BH-A0H6-01A-21W-A071-09 | (TODO) -- GDC | SNV__mutect | |
| TCGA-BH-A0H7-01A-13W-A071-09 | (TODO) -- GDC | SNV__mutect | |
| TCGA-BH-A0H9-01A-11W-A071-09 | (TODO) -- GDC | SNV__mutect | |
| TCGA-BH-A0HA-01A-11D-A12Q-09 | (TODO) -- GDC | SNV__mutect | |
| TCGA-BH-A0HB-01A-11W-A071-09 | (TODO) -- GDC | SNV__mutect | |
| TCGA-BH-A0HF-01A-11W-A071-09 | (TODO) -- GDC | SNV__mutect | |
| TCGA-BH-A0HI-01A-11D-A099-09 | (TODO) -- GDC | SNV__mutect | |
| TCGA-BH-A0HK-01A-11W-A071-09 | (TODO) -- GDC | SNV__mutect | |
| TCGA-BH-A0HL-01A-11W-A050-09 | (TODO) -- GDC | SNV__mutect | |
| TCGA-BH-A0HN-01A-11D-A099-09 | (TODO) -- GDC | SNV__mutect | |
| TCGA-BH-A0HO-01A-11W-A050-09 | (TODO) -- GDC | SNV__mutect | |
| TCGA-BH-A0HP-01A-12D-A099-09 | (TODO) -- GDC | SNV__mutect | |
| TCGA-BH-A0HQ-01A-11W-A050-09 | (TODO) -- GDC | SNV__mutect | |
| TCGA-BH-A0HU-01A-11W-A050-09 | (TODO) -- GDC | SNV__mutect | |
| TCGA-BH-A0HW-01A-11W-A050-09 | (TODO) -- GDC | SNV__mutect | |
| TCGA-BH-A0HX-01A-21W-A071-09 | (TODO) -- GDC | SNV__mutect | |
| TCGA-BH-A0HY-01A-11W-A071-09 | (TODO) -- GDC | SNV__mutect | |
| TCGA-BH-A0RX-01A-21D-A099-09 | (TODO) -- GDC | SNV__mutect | |
| TCGA-BH-A0W3-01A-11D-A10G-09 | (TODO) -- GDC | SNV__mutect | |
| TCGA-BH-A0W4-01A-11D-A10G-09 | (TODO) -- GDC | SNV__mutect | |
| TCGA-BH-A0W5-01A-11D-A10G-09 | (TODO) -- GDC | SNV__mutect | |
| TCGA-BH-A0W7-01A-11D-A10Y-09 | (TODO) -- GDC | SNV__mutect | |
| TCGA-BH-A0WA-01A-11D-A10G-09 | (TODO) -- GDC | SNV__mutect | |
| TCGA-BH-A18F-01A-11D-A12B-09 | (TODO) -- GDC | SNV__mutect | |
| TCGA-BH-A18G-01A-11D-A12B-09 | (TODO) -- GDC | SNV__mutect | |
| TCGA-BH-A18H-01A-11D-A12B-09 | (TODO) -- GDC | SNV__mutect | |
| TCGA-BH-A18I-01A-11D-A12B-09 | (TODO) -- GDC | SNV__mutect | |
| TCGA-BH-A18J-01A-11D-A12B-09 | (TODO) -- GDC | SNV__mutect | |
| TCGA-BH-A18K-01A-11D-A12B-09 | (TODO) -- GDC | SNV__mutect | |
| TCGA-BH-A18L-01A-32D-A12B-09 | (TODO) -- GDC | SNV__mutect | |
| TCGA-BH-A18M-01A-11D-A12B-09 | (TODO) -- GDC | SNV__mutect | |
| TCGA-BH-A18N-01A-11D-A12B-09 | (TODO) -- GDC | SNV__mutect | |
| TCGA-BH-A18P-01A-11D-A12B-09 | (TODO) -- GDC | SNV__mutect | |
| TCGA-BH-A18Q-01A-12D-A12B-09 | (TODO) -- GDC | SNV__mutect | |
| TCGA-BH-A18R-01A-11D-A12B-09 | (TODO) -- GDC | SNV__mutect | |
| TCGA-BH-A18S-01A-11D-A12B-09 | (TODO) -- GDC | SNV__mutect | |
| TCGA-BH-A18T-01A-11D-A12B-09 | (TODO) -- GDC | SNV__mutect | |
| TCGA-BH-A18U-01A-21D-A12B-09 | (TODO) -- GDC | SNV__mutect | |
| TCGA-BH-A18V-01A-11D-A12B-09 | (TODO) -- GDC | SNV__mutect | |
| TCGA-BH-A1EN-01A-11D-A17G-09 | (TODO) -- GDC | SNV__mutect | |
| TCGA-BH-A1EO-01A-11D-A135-09 | (TODO) -- GDC | SNV__mutect | |
| TCGA-BH-A1ES-01A-11D-A135-09 | (TODO) -- GDC | SNV__mutect | |
| TCGA-BH-A1ET-01A-11D-A135-09 | (TODO) -- GDC | SNV__mutect | |
| TCGA-BH-A1EU-01A-11D-A135-09 | (TODO) -- GDC | SNV__mutect | |
| TCGA-BH-A1EV-01A-11D-A135-09 | (TODO) -- GDC | SNV__mutect | |
| TCGA-BH-A1EW-01A-11D-A135-09 | (TODO) -- GDC | SNV__mutect | |
| TCGA-BH-A1EX-01A-11D-A13L-09 | (TODO) -- GDC | SNV__mutect | |
| TCGA-BH-A1EY-01A-11D-A13L-09 | (TODO) -- GDC | SNV__mutect | |
| TCGA-BH-A1F0-01A-11D-A135-09 | (TODO) -- GDC | SNV__mutect | |
| TCGA-BH-A1F2-01A-31D-A13L-09 | (TODO) -- GDC | SNV__mutect | |
| TCGA-BH-A1F5-01A-12D-A13L-09 | (TODO) -- GDC | SNV__mutect | |
| TCGA-BH-A1F6-01A-11D-A13L-09 | (TODO) -- GDC | SNV__mutect | |
| TCGA-BH-A1F8-01A-11D-A13L-09 | (TODO) -- GDC | SNV__mutect | |
| TCGA-BH-A1FC-01A-11D-A13L-09 | (TODO) -- GDC | SNV__mutect | |
| TCGA-BH-A1FD-01A-11W-A14Q-09 | (TODO) -- GDC | SNV__mutect | |
| TCGA-BH-A1FE-01A-11D-A13L-09 | (TODO) -- GDC | SNV__mutect | |
| TCGA-BH-A1FG-01A-11D-A13L-09 | (TODO) -- GDC | SNV__mutect | |
| TCGA-BH-A1FH-01A-12D-A13L-09 | (TODO) -- GDC | SNV__mutect | |
| TCGA-BH-A1FJ-01A-11D-A13L-09 | (TODO) -- GDC | SNV__mutect | |
| TCGA-BH-A1FL-01A-11D-A13L-09 | (TODO) -- GDC | SNV__mutect | |
| TCGA-BH-A1FM-01A-11D-A13L-09 | (TODO) -- GDC | SNV__mutect | |
| TCGA-BH-A1FN-01A-11D-A13L-09 | (TODO) -- GDC | SNV__mutect | |
| TCGA-BH-A1FR-01A-11D-A13L-09 | (TODO) -- GDC | SNV__mutect | |
| TCGA-BH-A1FU-01A-11D-A14G-09 | (TODO) -- GDC | SNV__mutect | |
| TCGA-BH-A201-01A-11D-A14K-09 | (TODO) -- GDC | SNV__mutect | |
| TCGA-BH-A202-01A-11D-A14K-09 | (TODO) -- GDC | SNV__mutect | |
| TCGA-BH-A203-01A-12D-A167-09 | (TODO) -- GDC | SNV__mutect | |
| TCGA-BH-A204-01A-11D-A159-09 | (TODO) -- GDC | SNV__mutect | |
| TCGA-BH-A208-01A-11D-A159-09 | (TODO) -- GDC | SNV__mutect | |
| TCGA-BH-A209-01A-11D-A17G-09 | (TODO) -- GDC | SNV__mutect | |
| TCGA-BH-A28O-01A-11D-A228-09 | (TODO) -- GDC | SNV__mutect | |
| TCGA-BH-A28Q-01A-11D-A16D-09 | (TODO) -- GDC | SNV__mutect | |
| TCGA-BH-A2L8-01A-11D-A18P-09 | (TODO) -- GDC | SNV__mutect | |
| TCGA-BH-A42T-01A-11D-A243-09 | (TODO) -- GDC | SNV__mutect | |
| TCGA-BH-A42U-01A-12D-A243-09 | (TODO) -- GDC | SNV__mutect | |
| TCGA-BH-A42V-01A-11D-A243-09 | (TODO) -- GDC | SNV__mutect | |
| TCGA-BH-A5IZ-01A-11D-A27P-09 | (TODO) -- GDC | SNV__mutect | |
| TCGA-BH-A5J0-01A-11D-A27P-09 | (TODO) -- GDC | SNV__mutect | |
| TCGA-BH-A6R8-01A-21D-A33E-09 | (TODO) -- GDC | SNV__mutect | |
| TCGA-BH-A6R9-01A-21D-A32I-09 | (TODO) -- GDC | SNV__mutect | |
| TCGA-BH-A8FY-01A-11D-A36J-09 | (TODO) -- GDC | SNV__mutect | |
| TCGA-BH-A8FZ-01A-11D-A351-09 | (TODO) -- GDC | SNV__mutect | |
| TCGA-BH-A8G0-01A-11D-A351-09 | (TODO) -- GDC | SNV__mutect | |
| TCGA-BH-AB28-01A-31D-A41F-09 | (TODO) -- GDC | SNV__mutect | |
| TCGA-C8-A12K-01A-21D-A10Y-09 | (TODO) -- GDC | SNV__mutect | |
| TCGA-C8-A12L-01A-11D-A10Y-09 | (TODO) -- GDC | SNV__mutect | |
| TCGA-C8-A12M-01A-11D-A135-09 | (TODO) -- GDC | SNV__mutect | |
| TCGA-C8-A12N-01A-11D-A10Y-09 | (TODO) -- GDC | SNV__mutect | |
| TCGA-C8-A12O-01A-11D-A10Y-09 | (TODO) -- GDC | SNV__mutect | |
| TCGA-C8-A12P-01A-11D-A10Y-09 | (TODO) -- GDC | SNV__mutect | |
| TCGA-C8-A12Q-01A-11D-A10Y-09 | (TODO) -- GDC | SNV__mutect | |
| TCGA-C8-A12T-01A-11D-A10Y-09 | (TODO) -- GDC | SNV__mutect | |
| TCGA-C8-A12U-01A-11D-A10Y-09 | (TODO) -- GDC | SNV__mutect | |
| TCGA-C8-A12V-01A-11D-A10Y-09 | (TODO) -- GDC | SNV__mutect | |
| TCGA-C8-A12W-01A-11D-A10Y-09 | (TODO) -- GDC | SNV__mutect | |
| TCGA-C8-A12X-01A-11D-A10Y-09 | (TODO) -- GDC | SNV__mutect | |
| TCGA-C8-A12Y-01A-11D-A12B-09 | (TODO) -- GDC | SNV__mutect | |
| TCGA-C8-A12Z-01A-11D-A10Y-09 | (TODO) -- GDC | SNV__mutect | |
| TCGA-C8-A130-01A-31D-A10Y-09 | (TODO) -- GDC | SNV__mutect | |
| TCGA-C8-A131-01A-11D-A10Y-09 | (TODO) -- GDC | SNV__mutect | |
| TCGA-C8-A132-01A-31D-A10Y-09 | (TODO) -- GDC | SNV__mutect | |
| TCGA-C8-A133-01A-32D-A12B-09 | (TODO) -- GDC | SNV__mutect | |
| TCGA-C8-A134-01A-11D-A10Y-09 | (TODO) -- GDC | SNV__mutect | |
| TCGA-C8-A135-01A-11D-A10Y-09 | (TODO) -- GDC | SNV__mutect | |
| TCGA-C8-A137-01A-11D-A10Y-09 | (TODO) -- GDC | SNV__mutect | |
| TCGA-C8-A138-01A-11D-A10Y-09 | (TODO) -- GDC | SNV__mutect | |
| TCGA-C8-A1HE-01A-11D-A188-09 | (TODO) -- GDC | SNV__mutect | |
| TCGA-C8-A1HF-01A-11D-A135-09 | (TODO) -- GDC | SNV__mutect | |
| TCGA-C8-A1HG-01A-11D-A135-09 | (TODO) -- GDC | SNV__mutect | |
| TCGA-C8-A1HI-01A-11D-A135-09 | (TODO) -- GDC | SNV__mutect | |
| TCGA-C8-A1HJ-01A-11D-A13L-09 | (TODO) -- GDC | SNV__mutect | |
| TCGA-C8-A1HK-01A-21D-A13L-09 | (TODO) -- GDC | SNV__mutect | |
| TCGA-C8-A1HL-01A-11D-A135-09 | (TODO) -- GDC | SNV__mutect | |
| TCGA-C8-A1HM-01A-12D-A135-09 | (TODO) -- GDC | SNV__mutect | |
| TCGA-C8-A1HN-01A-11D-A135-09 | (TODO) -- GDC | SNV__mutect | |
| TCGA-C8-A1HO-01A-11D-A13L-09 | (TODO) -- GDC | SNV__mutect | |
| TCGA-C8-A26V-01A-11D-A16D-09 | (TODO) -- GDC | SNV__mutect | |
| TCGA-C8-A26W-01A-11D-A16D-09 | (TODO) -- GDC | SNV__mutect | |
| TCGA-C8-A26X-01A-31D-A16D-09 | (TODO) -- GDC | SNV__mutect | |
| TCGA-C8-A26Y-01A-11D-A16D-09 | (TODO) -- GDC | SNV__mutect | |
| TCGA-C8-A26Z-01A-11D-A16D-09 | (TODO) -- GDC | SNV__mutect | |
| TCGA-C8-A273-01A-11D-A16D-09 | (TODO) -- GDC | SNV__mutect | |
| TCGA-C8-A274-01A-11D-A16D-09 | (TODO) -- GDC | SNV__mutect | |
| TCGA-C8-A275-01A-21D-A16D-09 | (TODO) -- GDC | SNV__mutect | |
| TCGA-C8-A278-01A-11D-A167-09 | (TODO) -- GDC | SNV__mutect | |
| TCGA-C8-A27A-01A-11D-A167-09 | (TODO) -- GDC | SNV__mutect | |
| TCGA-C8-A27B-01A-11D-A167-09 | (TODO) -- GDC | SNV__mutect | |
| TCGA-C8-A3M7-01A-12D-A21Q-09 | (TODO) -- GDC | SNV__mutect | |
| TCGA-C8-A3M8-01A-11D-A20S-09 | (TODO) -- GDC | SNV__mutect | |
| TCGA-C8-A8HP-01A-11D-A36J-09 | (TODO) -- GDC | SNV__mutect | |
| TCGA-C8-A8HQ-01A-11D-A36J-09 | (TODO) -- GDC | SNV__mutect | |
| TCGA-C8-A8HR-01A-11D-A36J-09 | (TODO) -- GDC | SNV__mutect | |
| TCGA-C8-A9FZ-01A-11D-A41F-09 | (TODO) -- GDC | SNV__mutect | |
| TCGA-D8-A13Y-01A-11D-A10Y-09 | (TODO) -- GDC | SNV__mutect | |
| TCGA-D8-A13Z-01A-11D-A10Y-09 | (TODO) -- GDC | SNV__mutect | |
| TCGA-D8-A140-01A-11D-A10Y-09 | (TODO) -- GDC | SNV__mutect | |
| TCGA-D8-A141-01A-11D-A10Y-09 | (TODO) -- GDC | SNV__mutect | |
| TCGA-D8-A142-01A-11D-A10Y-09 | (TODO) -- GDC | SNV__mutect | |
| TCGA-D8-A143-01A-11D-A10Y-09 | (TODO) -- GDC | SNV__mutect | |
| TCGA-D8-A145-01A-11D-A10Y-09 | (TODO) -- GDC | SNV__mutect | |
| TCGA-D8-A146-01A-31D-A10Y-09 | (TODO) -- GDC | SNV__mutect | |
| TCGA-D8-A147-01A-11D-A10Y-09 | (TODO) -- GDC | SNV__mutect | |
| TCGA-D8-A1J8-01A-11D-A13L-09 | (TODO) -- GDC | SNV__mutect | |
| TCGA-D8-A1J9-01A-11D-A13L-09 | (TODO) -- GDC | SNV__mutect | |
| TCGA-D8-A1JA-01A-11D-A13L-09 | (TODO) -- GDC | SNV__mutect | |
| TCGA-D8-A1JB-01A-11D-A13L-09 | (TODO) -- GDC | SNV__mutect | |
| TCGA-D8-A1JC-01A-11D-A13L-09 | (TODO) -- GDC | SNV__mutect | |
| TCGA-D8-A1JD-01A-11D-A13L-09 | (TODO) -- GDC | SNV__mutect | |
| TCGA-D8-A1JE-01A-11D-A13L-09 | (TODO) -- GDC | SNV__mutect | |
| TCGA-D8-A1JF-01A-11D-A13L-09 | (TODO) -- GDC | SNV__mutect | |
| TCGA-D8-A1JG-01B-11D-A13L-09 | (TODO) -- GDC | SNV__mutect | |
| TCGA-D8-A1JH-01A-11D-A188-09 | (TODO) -- GDC | SNV__mutect | |
| TCGA-D8-A1JI-01A-11D-A13L-09 | (TODO) -- GDC | SNV__mutect | |
| TCGA-D8-A1JJ-01A-31D-A14K-09 | (TODO) -- GDC | SNV__mutect | |
| TCGA-D8-A1JK-01A-11D-A13L-09 | (TODO) -- GDC | SNV__mutect | |
| TCGA-D8-A1JL-01A-11D-A13L-09 | (TODO) -- GDC | SNV__mutect | |
| TCGA-D8-A1JM-01A-11D-A13L-09 | (TODO) -- GDC | SNV__mutect | |
| TCGA-D8-A1JN-01A-11D-A13L-09 | (TODO) -- GDC | SNV__mutect | |
| TCGA-D8-A1JP-01A-11D-A13L-09 | (TODO) -- GDC | SNV__mutect | |
| TCGA-D8-A1JS-01A-11D-A13L-09 | (TODO) -- GDC | SNV__mutect | |
| TCGA-D8-A1JT-01A-31D-A13L-09 | (TODO) -- GDC | SNV__mutect | |
| TCGA-D8-A1JU-01A-11D-A13L-09 | (TODO) -- GDC | SNV__mutect | |
| TCGA-D8-A1X5-01A-11D-A14G-09 | (TODO) -- GDC | SNV__mutect | |
| TCGA-D8-A1X6-01A-11D-A14K-09 | (TODO) -- GDC | SNV__mutect | |
| TCGA-D8-A1X7-01A-11D-A14K-09 | (TODO) -- GDC | SNV__mutect | |
| TCGA-D8-A1X8-01A-11D-A14K-09 | (TODO) -- GDC | SNV__mutect | |
| TCGA-D8-A1X9-01A-12D-A159-09 | (TODO) -- GDC | SNV__mutect | |
| TCGA-D8-A1XA-01A-11D-A14G-09 | (TODO) -- GDC | SNV__mutect | |
| TCGA-D8-A1XB-01A-11D-A14G-09 | (TODO) -- GDC | SNV__mutect | |
| TCGA-D8-A1XC-01A-11D-A14G-09 | (TODO) -- GDC | SNV__mutect | |
| TCGA-D8-A1XF-01A-11D-A14G-09 | (TODO) -- GDC | SNV__mutect | |
| TCGA-D8-A1XG-01A-11D-A14G-09 | (TODO) -- GDC | SNV__mutect | |
| TCGA-D8-A1XJ-01A-11D-A14K-09 | (TODO) -- GDC | SNV__mutect | |
| TCGA-D8-A1XK-01A-21D-A14K-09 | (TODO) -- GDC | SNV__mutect | |
| TCGA-D8-A1XL-01A-11D-A14K-09 | (TODO) -- GDC | SNV__mutect | |
| TCGA-D8-A1XM-01A-21D-A14K-09 | (TODO) -- GDC | SNV__mutect | |
| TCGA-D8-A1XO-01A-11D-A14K-09 | (TODO) -- GDC | SNV__mutect | |
| TCGA-D8-A1XQ-01A-11D-A14K-09 | (TODO) -- GDC | SNV__mutect | |
| TCGA-D8-A1XR-01A-11D-A14K-09 | (TODO) -- GDC | SNV__mutect | |
| TCGA-D8-A1XS-01A-11D-A14K-09 | (TODO) -- GDC | SNV__mutect | |
| TCGA-D8-A1XT-01A-11D-A14K-09 | (TODO) -- GDC | SNV__mutect | |
| TCGA-D8-A1XU-01A-11D-A14K-09 | (TODO) -- GDC | SNV__mutect | |
| TCGA-D8-A1XV-01A-11D-A14K-09 | (TODO) -- GDC | SNV__mutect | |
| TCGA-D8-A1XW-01A-11D-A14K-09 | (TODO) -- GDC | SNV__mutect | |
| TCGA-D8-A1XY-01A-11D-A14K-09 | (TODO) -- GDC | SNV__mutect | |
| TCGA-D8-A1XZ-01A-11D-A14K-09 | (TODO) -- GDC | SNV__mutect | |
| TCGA-D8-A1Y0-01A-11D-A14K-09 | (TODO) -- GDC | SNV__mutect | |
| TCGA-D8-A1Y1-01A-21D-A14K-09 | (TODO) -- GDC | SNV__mutect | |
| TCGA-D8-A1Y2-01A-11D-A159-09 | (TODO) -- GDC | SNV__mutect | |
| TCGA-D8-A1Y3-01A-11D-A159-09 | (TODO) -- GDC | SNV__mutect | |
| TCGA-D8-A27E-01A-11D-A16D-09 | (TODO) -- GDC | SNV__mutect | |
| TCGA-D8-A27F-01A-11D-A16D-09 | (TODO) -- GDC | SNV__mutect | |
| TCGA-D8-A27G-01A-11D-A16D-09 | (TODO) -- GDC | SNV__mutect | |
| TCGA-D8-A27I-01A-11D-A16D-09 | (TODO) -- GDC | SNV__mutect | |
| TCGA-D8-A27K-01A-11D-A16D-09 | (TODO) -- GDC | SNV__mutect | |
| TCGA-D8-A27L-01A-11D-A16D-09 | (TODO) -- GDC | SNV__mutect | |
| TCGA-D8-A27M-01A-11D-A16D-09 | (TODO) -- GDC | SNV__mutect | |
| TCGA-D8-A27N-01A-11D-A16D-09 | (TODO) -- GDC | SNV__mutect | |
| TCGA-D8-A27P-01A-11D-A16D-09 | (TODO) -- GDC | SNV__mutect | |
| TCGA-D8-A27R-01A-11D-A16D-09 | (TODO) -- GDC | SNV__mutect | |
| TCGA-D8-A27T-01A-11D-A16D-09 | (TODO) -- GDC | SNV__mutect | |
| TCGA-D8-A27V-01A-12D-A17D-09 | (TODO) -- GDC | SNV__mutect | |
| TCGA-D8-A27W-01A-11D-A16D-09 | (TODO) -- GDC | SNV__mutect | |
| TCGA-D8-A3Z5-01A-41D-A243-09 | (TODO) -- GDC | SNV__mutect | |
| TCGA-D8-A3Z6-01A-11D-A23C-09 | (TODO) -- GDC | SNV__mutect | |
| TCGA-D8-A4Z1-01A-21D-A25Q-09 | (TODO) -- GDC | SNV__mutect | |
| TCGA-D8-A73U-01A-11D-A33E-09 | (TODO) -- GDC | SNV__mutect | |
| TCGA-D8-A73W-01A-22D-A351-09 | (TODO) -- GDC | SNV__mutect | |
| TCGA-D8-A73X-01A-11D-A32I-09 | (TODO) -- GDC | SNV__mutect | |
| TCGA-E2-A10A-01A-21D-A10Y-09 | (TODO) -- GDC | SNV__mutect | |
| TCGA-E2-A10C-01A-21D-A10M-09 | (TODO) -- GDC | SNV__mutect | |
| TCGA-E2-A14N-01A-31D-A135-09 | (TODO) -- GDC | SNV__mutect | |
| TCGA-E2-A14O-01A-31D-A10Y-09 | (TODO) -- GDC | SNV__mutect | |
| TCGA-E2-A14P-01A-31D-A12B-09 | (TODO) -- GDC | SNV__mutect | |
| TCGA-E2-A14Q-01A-11D-A12B-09 | (TODO) -- GDC | SNV__mutect | |
| TCGA-E2-A14R-01A-11D-A10Y-09 | (TODO) -- GDC | SNV__mutect | |
| TCGA-E2-A14S-01A-11D-A12B-09 | (TODO) -- GDC | SNV__mutect | |
| TCGA-E2-A14T-01A-11D-A10Y-09 | (TODO) -- GDC | SNV__mutect | |
| TCGA-E2-A14U-01A-11D-A228-09 | (TODO) -- GDC | SNV__mutect | |
| TCGA-E2-A14V-01A-11D-A12B-09 | (TODO) -- GDC | SNV__mutect | |
| TCGA-E2-A14W-01A-11D-A12B-09 | (TODO) -- GDC | SNV__mutect | |
| TCGA-E2-A14X-01A-11D-A10Y-09 | (TODO) -- GDC | SNV__mutect | |
| TCGA-E2-A14Y-01A-21D-A12B-09 | (TODO) -- GDC | SNV__mutect | |
| TCGA-E2-A14Z-01A-11D-A10Y-09 | (TODO) -- GDC | SNV__mutect | |
| TCGA-E2-A150-01A-11D-A12B-09 | (TODO) -- GDC | SNV__mutect | |
| TCGA-E2-A152-01A-11D-A12B-09 | (TODO) -- GDC | SNV__mutect | |
| TCGA-E2-A153-01A-12D-A12B-09 | (TODO) -- GDC | SNV__mutect | |
| TCGA-E2-A154-01A-11D-A10Y-09 | (TODO) -- GDC | SNV__mutect | |
| TCGA-E2-A155-01A-11D-A12B-09 | (TODO) -- GDC | SNV__mutect | |
| TCGA-E2-A156-01A-11D-A12B-09 | (TODO) -- GDC | SNV__mutect | |
| TCGA-E2-A158-01A-11D-A12B-09 | (TODO) -- GDC | SNV__mutect | |
| TCGA-E2-A159-01A-11D-A10Y-09 | (TODO) -- GDC | SNV__mutect | |
| TCGA-E2-A15A-01A-11D-A12B-09 | (TODO) -- GDC | SNV__mutect | |
| TCGA-E2-A15C-01A-31D-A12B-09 | (TODO) -- GDC | SNV__mutect | |
| TCGA-E2-A15D-01A-11D-A10Y-09 | (TODO) -- GDC | SNV__mutect | |
| TCGA-E2-A15E-01A-11D-A12B-09 | (TODO) -- GDC | SNV__mutect | |
| TCGA-E2-A15G-01A-11D-A12B-09 | (TODO) -- GDC | SNV__mutect | |
| TCGA-E2-A15H-01A-11D-A12B-09 | (TODO) -- GDC | SNV__mutect | |
| TCGA-E2-A15I-01A-21D-A135-09 | (TODO) -- GDC | SNV__mutect | |
| TCGA-E2-A15J-01A-11D-A12Q-09 | (TODO) -- GDC | SNV__mutect | |
| TCGA-E2-A15K-01A-11D-A12Q-09 | (TODO) -- GDC | SNV__mutect | |
| TCGA-E2-A15L-01A-11D-A12B-09 | (TODO) -- GDC | SNV__mutect | |
| TCGA-E2-A15M-01A-11D-A12B-09 | (TODO) -- GDC | SNV__mutect | |
| TCGA-E2-A15O-01A-11D-A10Y-09 | (TODO) -- GDC | SNV__mutect | |
| TCGA-E2-A15P-01A-11D-A10Y-09 | (TODO) -- GDC | SNV__mutect | |
| TCGA-E2-A15R-01A-11D-A10Y-09 | (TODO) -- GDC | SNV__mutect | |
| TCGA-E2-A15S-01A-11D-A10Y-09 | (TODO) -- GDC | SNV__mutect | |
| TCGA-E2-A15T-01A-11D-A10Y-09 | (TODO) -- GDC | SNV__mutect | |
| TCGA-E2-A1AZ-01A-11D-A12Q-09 | (TODO) -- GDC | SNV__mutect | |
| TCGA-E2-A1B0-01A-11D-A12Q-09 | (TODO) -- GDC | SNV__mutect | |
| TCGA-E2-A1B1-01A-21D-A12Q-09 | (TODO) -- GDC | SNV__mutect | |
| TCGA-E2-A1B4-01A-11D-A12Q-09 | (TODO) -- GDC | SNV__mutect | |
| TCGA-E2-A1B5-01A-21D-A12Q-09 | (TODO) -- GDC | SNV__mutect | |
| TCGA-E2-A1B6-01A-31D-A12Q-09 | (TODO) -- GDC | SNV__mutect | |
| TCGA-E2-A1BC-01A-11D-A14G-09 | (TODO) -- GDC | SNV__mutect | |
| TCGA-E2-A1BD-01A-11D-A12Q-09 | (TODO) -- GDC | SNV__mutect | |
| TCGA-E2-A1IE-01A-11D-A188-09 | (TODO) -- GDC | SNV__mutect | |
| TCGA-E2-A1IF-01A-11D-A142-09 | (TODO) -- GDC | SNV__mutect | |
| TCGA-E2-A1IG-01A-11D-A142-09 | (TODO) -- GDC | SNV__mutect | |
| TCGA-E2-A1IH-01A-11D-A188-09 | (TODO) -- GDC | SNV__mutect | |
| TCGA-E2-A1II-01A-11D-A142-09 | (TODO) -- GDC | SNV__mutect | |
| TCGA-E2-A1IJ-01A-11D-A142-09 | (TODO) -- GDC | SNV__mutect | |
| TCGA-E2-A1IK-01A-11D-A17G-09 | (TODO) -- GDC | SNV__mutect | |
| TCGA-E2-A1IL-01A-11D-A14G-09 | (TODO) -- GDC | SNV__mutect | |
| TCGA-E2-A1IN-01A-11D-A13L-09 | (TODO) -- GDC | SNV__mutect | |
| TCGA-E2-A1IO-01A-11D-A142-09 | (TODO) -- GDC | SNV__mutect | |
| TCGA-E2-A1IU-01A-11D-A14G-09 | (TODO) -- GDC | SNV__mutect | |
| TCGA-E2-A1L6-01A-11D-A13L-09 | (TODO) -- GDC | SNV__mutect | |
| TCGA-E2-A1L7-01A-11D-A142-09 | (TODO) -- GDC | SNV__mutect | |
| TCGA-E2-A1L8-01A-11D-A13L-09 | (TODO) -- GDC | SNV__mutect | |
| TCGA-E2-A1L9-01A-11D-A13L-09 | (TODO) -- GDC | SNV__mutect | |
| TCGA-E2-A1LA-01A-11D-A142-09 | (TODO) -- GDC | SNV__mutect | |
| TCGA-E2-A1LB-01A-11D-A142-09 | (TODO) -- GDC | SNV__mutect | |
| TCGA-E2-A1LE-01A-12D-A19Y-09 | (TODO) -- GDC | SNV__mutect | |
| TCGA-E2-A1LG-01A-21D-A14K-09 | (TODO) -- GDC | SNV__mutect | |
| TCGA-E2-A1LH-01A-11D-A14G-09 | (TODO) -- GDC | SNV__mutect | |
| TCGA-E2-A1LI-01A-12D-A159-09 | (TODO) -- GDC | SNV__mutect | |
| TCGA-E2-A1LK-01A-21D-A14G-09 | (TODO) -- GDC | SNV__mutect | |
| TCGA-E2-A1LL-01A-11D-A142-09 | (TODO) -- GDC | SNV__mutect | |
| TCGA-E2-A1LS-01A-12D-A159-09 | (TODO) -- GDC | SNV__mutect | |
| TCGA-E2-A2P5-01A-11D-A19Y-09 | (TODO) -- GDC | SNV__mutect | |
| TCGA-E2-A2P6-01A-11D-A19Y-09 | (TODO) -- GDC | SNV__mutect | |
| TCGA-E2-A3DX-01A-21D-A20S-09 | (TODO) -- GDC | SNV__mutect | |
| TCGA-E2-A56Z-01A-12D-A29N-09 | (TODO) -- GDC | SNV__mutect | |
| TCGA-E2-A570-01A-11D-A29N-09 | (TODO) -- GDC | SNV__mutect | |
| TCGA-E2-A572-01A-13D-A31U-09 | (TODO) -- GDC | SNV__mutect | |
| TCGA-E2-A573-01A-11D-A29N-09 | (TODO) -- GDC | SNV__mutect | |
| TCGA-E2-A574-01A-11D-A29N-09 | (TODO) -- GDC | SNV__mutect | |
| TCGA-E2-A576-01A-11D-A31U-09 | (TODO) -- GDC | SNV__mutect | |
| TCGA-E2-A9RU-01A-11D-A41F-09 | (TODO) -- GDC | SNV__mutect | |
| TCGA-E9-A1N3-01A-12D-A159-09 | (TODO) -- GDC | SNV__mutect | |
| TCGA-E9-A1N4-01A-11D-A14K-09 | (TODO) -- GDC | SNV__mutect | |
| TCGA-E9-A1N5-01A-11D-A14G-09 | (TODO) -- GDC | SNV__mutect | |
| TCGA-E9-A1N8-01A-11D-A142-09 | (TODO) -- GDC | SNV__mutect | |
| TCGA-E9-A1N9-01A-11D-A14G-09 | (TODO) -- GDC | SNV__mutect | |
| TCGA-E9-A1NA-01A-11D-A142-09 | (TODO) -- GDC | SNV__mutect | |
| TCGA-E9-A1NC-01A-12W-A16L-09 | (TODO) -- GDC | SNV__mutect | |
| TCGA-E9-A1ND-01A-11D-A142-09 | (TODO) -- GDC | SNV__mutect | |
| TCGA-E9-A1NE-01A-21D-A14K-09 | (TODO) -- GDC | SNV__mutect | |
| TCGA-E9-A1NF-01A-11D-A14G-09 | (TODO) -- GDC | SNV__mutect | |
| TCGA-E9-A1NG-01A-21D-A14K-09 | (TODO) -- GDC | SNV__mutect | |
| TCGA-E9-A1NH-01A-11D-A14G-09 | (TODO) -- GDC | SNV__mutect | |
| TCGA-E9-A1NI-01A-11W-A16H-09 | (TODO) -- GDC | SNV__mutect | |
| TCGA-E9-A1QZ-01A-21D-A167-09 | (TODO) -- GDC | SNV__mutect | |
| TCGA-E9-A1R0-01A-22D-A16D-09 | (TODO) -- GDC | SNV__mutect | |
| TCGA-E9-A1R2-01A-11D-A14G-09 | (TODO) -- GDC | SNV__mutect | |
| TCGA-E9-A1R3-01A-31D-A14K-09 | (TODO) -- GDC | SNV__mutect | |
| TCGA-E9-A1R4-01A-21D-A14G-09 | (TODO) -- GDC | SNV__mutect | |
| TCGA-E9-A1R5-01A-11D-A14K-09 | (TODO) -- GDC | SNV__mutect | |
| TCGA-E9-A1R6-01A-11D-A14G-09 | (TODO) -- GDC | SNV__mutect | |
| TCGA-E9-A1R7-01A-11D-A14K-09 | (TODO) -- GDC | SNV__mutect | |
| TCGA-E9-A1RA-01A-11D-A14G-09 | (TODO) -- GDC | SNV__mutect | |
| TCGA-E9-A1RB-01A-11D-A17G-09 | (TODO) -- GDC | SNV__mutect | |
| TCGA-E9-A1RC-01A-11D-A159-09 | (TODO) -- GDC | SNV__mutect | |
| TCGA-E9-A1RD-01A-11D-A159-09 | (TODO) -- GDC | SNV__mutect | |
| TCGA-E9-A1RE-01A-11D-A159-09 | (TODO) -- GDC | SNV__mutect | |
| TCGA-E9-A1RF-01A-11D-A159-09 | (TODO) -- GDC | SNV__mutect | |
| TCGA-E9-A1RG-01A-11D-A14G-09 | (TODO) -- GDC | SNV__mutect | |
| TCGA-E9-A1RH-01A-21D-A167-09 | (TODO) -- GDC | SNV__mutect | |
| TCGA-E9-A1RI-01A-11D-A167-09 | (TODO) -- GDC | SNV__mutect | |
| TCGA-E9-A226-01A-21D-A159-09 | (TODO) -- GDC | SNV__mutect | |
| TCGA-E9-A227-01A-11D-A159-09 | (TODO) -- GDC | SNV__mutect | |
| TCGA-E9-A228-01A-31D-A159-09 | (TODO) -- GDC | SNV__mutect | |
| TCGA-E9-A229-01A-31D-A17G-09 | (TODO) -- GDC | SNV__mutect | |
| TCGA-E9-A22A-01A-11D-A159-09 | (TODO) -- GDC | SNV__mutect | |
| TCGA-E9-A22B-01A-11D-A159-09 | (TODO) -- GDC | SNV__mutect | |
| TCGA-E9-A22D-01A-11D-A159-09 | (TODO) -- GDC | SNV__mutect | |
| TCGA-E9-A22E-01A-11D-A159-09 | (TODO) -- GDC | SNV__mutect | |
| TCGA-E9-A22G-01A-11D-A159-09 | (TODO) -- GDC | SNV__mutect | |
| TCGA-E9-A22H-01A-11D-A159-09 | (TODO) -- GDC | SNV__mutect | |
| TCGA-E9-A243-01A-21D-A167-09 | (TODO) -- GDC | SNV__mutect | |
| TCGA-E9-A244-01A-11D-A167-09 | (TODO) -- GDC | SNV__mutect | |
| TCGA-E9-A245-01A-22D-A16D-09 | (TODO) -- GDC | SNV__mutect | |
| TCGA-E9-A247-01A-11D-A167-09 | (TODO) -- GDC | SNV__mutect | |
| TCGA-E9-A248-01A-11D-A167-09 | (TODO) -- GDC | SNV__mutect | |
| TCGA-E9-A249-01A-11D-A167-09 | (TODO) -- GDC | SNV__mutect | |
| TCGA-E9-A24A-01A-11D-A167-09 | (TODO) -- GDC | SNV__mutect | |
| TCGA-E9-A295-01A-11D-A16D-09 | (TODO) -- GDC | SNV__mutect | |
| TCGA-E9-A2JS-01A-11D-A17W-09 | (TODO) -- GDC | SNV__mutect | |
| TCGA-E9-A2JT-01A-22D-A18P-09 | (TODO) -- GDC | SNV__mutect | |
| TCGA-E9-A3HO-01A-11D-A20S-09 | (TODO) -- GDC | SNV__mutect | |
| TCGA-E9-A3Q9-01A-11D-A21Q-09 | (TODO) -- GDC | SNV__mutect | |
| TCGA-E9-A3QA-01A-61D-A228-09 | (TODO) -- GDC | SNV__mutect | |
| TCGA-E9-A3X8-01A-31D-A22X-09 | (TODO) -- GDC | SNV__mutect | |
| TCGA-E9-A54X-01A-11D-A25Q-09 | (TODO) -- GDC | SNV__mutect | |
| TCGA-E9-A54Y-01A-11D-A25Q-09 | (TODO) -- GDC | SNV__mutect | |
| TCGA-E9-A5FK-01A-11D-A27P-09 | (TODO) -- GDC | SNV__mutect | |
| TCGA-E9-A5FL-01A-11D-A27P-09 | (TODO) -- GDC | SNV__mutect | |
| TCGA-E9-A5UO-01A-11D-A28B-09 | (TODO) -- GDC | SNV__mutect | |
| TCGA-E9-A5UP-01A-11D-A28B-09 | (TODO) -- GDC | SNV__mutect | |
| TCGA-E9-A6HE-01A-11D-A31U-09 | (TODO) -- GDC | SNV__mutect | |
| TCGA-EW-A1IW-01A-11D-A13L-09 | (TODO) -- GDC | SNV__mutect | |
| TCGA-EW-A1IX-01A-12D-A142-09 | (TODO) -- GDC | SNV__mutect | |
| TCGA-EW-A1IY-01A-11D-A188-09 | (TODO) -- GDC | SNV__mutect | |
| TCGA-EW-A1IZ-01A-11D-A188-09 | (TODO) -- GDC | SNV__mutect | |
| TCGA-EW-A1J1-01A-11D-A188-09 | (TODO) -- GDC | SNV__mutect | |
| TCGA-EW-A1J2-01A-21D-A13L-09 | (TODO) -- GDC | SNV__mutect | |
| TCGA-EW-A1J3-01A-11D-A13L-09 | (TODO) -- GDC | SNV__mutect | |
| TCGA-EW-A1J5-01A-11D-A13L-09 | (TODO) -- GDC | SNV__mutect | |
| TCGA-EW-A1J6-01A-11D-A188-09 | (TODO) -- GDC | SNV__mutect | |
| TCGA-EW-A1OV-01A-11D-A142-09 | (TODO) -- GDC | SNV__mutect | |
| TCGA-EW-A1OX-01A-11D-A142-09 | (TODO) -- GDC | SNV__mutect | |
| TCGA-EW-A1OY-01A-11D-A142-09 | (TODO) -- GDC | SNV__mutect | |
| TCGA-EW-A1OZ-01A-11D-A142-09 | (TODO) -- GDC | SNV__mutect | |
| TCGA-EW-A1P0-01A-11D-A142-09 | (TODO) -- GDC | SNV__mutect | |
| TCGA-EW-A1P1-01A-31D-A14G-09 | (TODO) -- GDC | SNV__mutect | |
| TCGA-EW-A1P3-01A-11D-A142-09 | (TODO) -- GDC | SNV__mutect | |
| TCGA-EW-A1P4-01A-21D-A142-09 | (TODO) -- GDC | SNV__mutect | |
| TCGA-EW-A1P5-01A-11D-A142-09 | (TODO) -- GDC | SNV__mutect | |
| TCGA-EW-A1P6-01A-11D-A142-09 | (TODO) -- GDC | SNV__mutect | |
| TCGA-EW-A1P7-01A-21D-A142-09 | (TODO) -- GDC | SNV__mutect | |
| TCGA-EW-A1P8-01A-11D-A142-09 | (TODO) -- GDC | SNV__mutect | |
| TCGA-EW-A1PA-01A-11D-A142-09 | (TODO) -- GDC | SNV__mutect | |
| TCGA-EW-A1PB-01A-11D-A142-09 | (TODO) -- GDC | SNV__mutect | |
| TCGA-EW-A1PC-01B-11D-A21Q-09 | (TODO) -- GDC | SNV__mutect | |
| TCGA-EW-A1PD-01A-11D-A142-09 | (TODO) -- GDC | SNV__mutect | |
| TCGA-EW-A1PE-01A-11D-A142-09 | (TODO) -- GDC | SNV__mutect | |
| TCGA-EW-A1PG-01A-11D-A142-09 | (TODO) -- GDC | SNV__mutect | |
| TCGA-EW-A1PH-01A-11D-A14K-09 | (TODO) -- GDC | SNV__mutect | |
| TCGA-EW-A2FR-01A-11D-A21Q-09 | (TODO) -- GDC | SNV__mutect | |
| TCGA-EW-A2FS-01A-11D-A17D-09 | (TODO) -- GDC | SNV__mutect | |
| TCGA-EW-A2FV-01A-11D-A17D-09 | (TODO) -- GDC | SNV__mutect | |
| TCGA-EW-A2FW-01A-11D-A17D-09 | (TODO) -- GDC | SNV__mutect | |
| TCGA-EW-A3E8-01B-11D-A243-09 | (TODO) -- GDC | SNV__mutect | |
| TCGA-EW-A3U0-01A-11D-A228-09 | (TODO) -- GDC | SNV__mutect | |
| TCGA-EW-A423-01A-11D-A243-09 | (TODO) -- GDC | SNV__mutect | |
| TCGA-EW-A6S9-01A-22D-A33E-09 | (TODO) -- GDC | SNV__mutect | |
| TCGA-EW-A6SA-01A-21D-A32I-09 | (TODO) -- GDC | SNV__mutect | |
| TCGA-EW-A6SB-01A-12D-A32I-09 | (TODO) -- GDC | SNV__mutect | |
| TCGA-EW-A6SC-01A-12D-A32I-09 | (TODO) -- GDC | SNV__mutect | |
| TCGA-EW-A6SD-01A-12D-A33E-09 | (TODO) -- GDC | SNV__mutect | |
| TCGA-GI-A2C8-01A-11D-A16D-09 | (TODO) -- GDC | SNV__mutect | |
| TCGA-GI-A2C9-01A-11D-A21Q-09 | (TODO) -- GDC | SNV__mutect | |
| TCGA-GM-A2D9-01A-11D-A18P-09 | (TODO) -- GDC | SNV__mutect | |
| TCGA-GM-A2DA-01A-11D-A18P-09 | (TODO) -- GDC | SNV__mutect | |
| TCGA-GM-A2DB-01A-31D-A19Y-09 | (TODO) -- GDC | SNV__mutect | |
| TCGA-GM-A2DC-01A-11D-A18P-09 | (TODO) -- GDC | SNV__mutect | |
| TCGA-GM-A2DD-01A-11D-A17W-09 | (TODO) -- GDC | SNV__mutect | |
| TCGA-GM-A2DF-01A-11D-A17W-09 | (TODO) -- GDC | SNV__mutect | |
| TCGA-GM-A2DH-01A-11D-A17W-09 | (TODO) -- GDC | SNV__mutect | |
| TCGA-GM-A2DI-01A-31D-A18P-09 | (TODO) -- GDC | SNV__mutect | |
| TCGA-GM-A2DK-01A-21D-A17W-09 | (TODO) -- GDC | SNV__mutect | |
| TCGA-GM-A2DL-01A-11D-A18P-09 | (TODO) -- GDC | SNV__mutect | |
| TCGA-GM-A2DM-01A-11D-A17W-09 | (TODO) -- GDC | SNV__mutect | |
| TCGA-GM-A2DN-01A-11D-A17W-09 | (TODO) -- GDC | SNV__mutect | |
| TCGA-GM-A2DO-01A-11D-A19Y-09 | (TODO) -- GDC | SNV__mutect | |
| TCGA-GM-A3NW-01A-21D-A228-09 | (TODO) -- GDC | SNV__mutect | |
| TCGA-GM-A3NY-01A-11D-A21Q-09 | (TODO) -- GDC | SNV__mutect | |
| TCGA-GM-A3XG-01A-31D-A243-09 | (TODO) -- GDC | SNV__mutect | |
| TCGA-GM-A3XL-01A-11D-A22X-09 | (TODO) -- GDC | SNV__mutect | |
| TCGA-GM-A3XN-01A-12D-A22X-09 | (TODO) -- GDC | SNV__mutect | |
| TCGA-GM-A4E0-01A-12D-A25Q-09 | (TODO) -- GDC | SNV__mutect | |
| TCGA-GM-A5PV-01A-11D-A28B-09 | (TODO) -- GDC | SNV__mutect | |
| TCGA-GM-A5PX-01A-12D-A28B-09 | (TODO) -- GDC | SNV__mutect | |
| TCGA-HN-A2NL-01A-11D-A18P-09 | (TODO) -- GDC | SNV__mutect | |
| TCGA-HN-A2OB-01A-21D-A27P-09 | (TODO) -- GDC | SNV__mutect | |
| TCGA-JL-A3YW-01A-12D-A23C-09 | (TODO) -- GDC | SNV__mutect | |
| TCGA-JL-A3YX-01A-11D-A22X-09 | (TODO) -- GDC | SNV__mutect | |
| TCGA-LD-A66U-01A-11D-A31U-09 | (TODO) -- GDC | SNV__mutect | |
| TCGA-LD-A74U-01A-13D-A33E-09 | (TODO) -- GDC | SNV__mutect | |
| TCGA-LD-A7W5-01A-22D-A351-09 | (TODO) -- GDC | SNV__mutect | |
| TCGA-LD-A7W6-01A-81D-A351-09 | (TODO) -- GDC | SNV__mutect | |
| TCGA-LD-A9QF-01A-32D-A41F-09 | (TODO) -- GDC | SNV__mutect | |
| TCGA-LL-A440-01A-11D-A243-09 | (TODO) -- GDC | SNV__mutect | |
| TCGA-LL-A441-01A-11D-A243-09 | (TODO) -- GDC | SNV__mutect | |
| TCGA-LL-A50Y-01A-11D-A25Q-09 | (TODO) -- GDC | SNV__mutect | |
| TCGA-LL-A5YL-01A-12D-A29N-09 | (TODO) -- GDC | SNV__mutect | |
| TCGA-LL-A5YM-01A-11D-A28B-09 | (TODO) -- GDC | SNV__mutect | |
| TCGA-LL-A5YN-01A-11D-A28B-09 | (TODO) -- GDC | SNV__mutect | |
| TCGA-LL-A5YO-01A-21D-A28B-09 | (TODO) -- GDC | SNV__mutect | |
| TCGA-LL-A5YP-01A-21D-A28B-09 | (TODO) -- GDC | SNV__mutect | |
| TCGA-LL-A6FP-01A-11D-A31U-09 | (TODO) -- GDC | SNV__mutect | |
| TCGA-LL-A6FQ-01A-11D-A31U-09 | (TODO) -- GDC | SNV__mutect | |
| TCGA-LL-A6FR-01A-12D-A31U-09 | (TODO) -- GDC | SNV__mutect | |
| TCGA-LL-A73Y-01A-11D-A33E-09 | (TODO) -- GDC | SNV__mutect | |
| TCGA-LL-A73Z-01A-11D-A32I-09 | (TODO) -- GDC | SNV__mutect | |
| TCGA-LL-A740-01A-21D-A32I-09 | (TODO) -- GDC | SNV__mutect | |
| TCGA-LL-A7SZ-01A-32D-A351-09 | (TODO) -- GDC | SNV__mutect | |
| TCGA-LL-A7T0-01A-31D-A351-09 | (TODO) -- GDC | SNV__mutect | |
| TCGA-LL-A8F5-01A-11D-A36J-09 | (TODO) -- GDC | SNV__mutect | |
| TCGA-LL-A9Q3-01A-11D-A41F-09 | (TODO) -- GDC | SNV__mutect | |
| TCGA-LQ-A4E4-01A-11D-A25Q-09 | (TODO) -- GDC | SNV__mutect | |
| TCGA-MS-A51U-01A-31D-A25Q-09 | (TODO) -- GDC | SNV__mutect | |
| TCGA-OK-A5Q2-01A-11D-A27P-09 | (TODO) -- GDC | SNV__mutect | |
| TCGA-OL-A5D6-01A-21D-A27P-09 | (TODO) -- GDC | SNV__mutect | |
| TCGA-OL-A5D7-01A-11D-A27P-09 | (TODO) -- GDC | SNV__mutect | |
| TCGA-OL-A5D8-01A-11D-A27P-09 | (TODO) -- GDC | SNV__mutect | |
| TCGA-OL-A5DA-01A-11D-A27P-09 | (TODO) -- GDC | SNV__mutect | |
| TCGA-OL-A5RU-01A-11D-A28B-09 | (TODO) -- GDC | SNV__mutect | |
| TCGA-OL-A5RV-01A-12D-A28B-09 | (TODO) -- GDC | SNV__mutect | |
| TCGA-OL-A5RW-01A-11D-A28B-09 | (TODO) -- GDC | SNV__mutect | |
| TCGA-OL-A5RX-01A-11D-A28B-09 | (TODO) -- GDC | SNV__mutect | |
| TCGA-OL-A5RY-01A-21D-A28B-09 | (TODO) -- GDC | SNV__mutect | |
| TCGA-OL-A5RZ-01A-11D-A28B-09 | (TODO) -- GDC | SNV__mutect | |
| TCGA-OL-A5S0-01A-11D-A28B-09 | (TODO) -- GDC | SNV__mutect | |
| TCGA-OL-A66H-01A-11D-A29N-09 | (TODO) -- GDC | SNV__mutect | |
| TCGA-OL-A66I-01A-21D-A29N-09 | (TODO) -- GDC | SNV__mutect | |
| TCGA-OL-A66J-01A-11D-A29N-09 | (TODO) -- GDC | SNV__mutect | |
| TCGA-OL-A66K-01A-11D-A29N-09 | (TODO) -- GDC | SNV__mutect | |
| TCGA-OL-A66L-01A-12D-A31U-09 | (TODO) -- GDC | SNV__mutect | |
| TCGA-OL-A66N-01A-12D-A31U-09 | (TODO) -- GDC | SNV__mutect | |
| TCGA-OL-A66O-01A-11D-A31U-09 | (TODO) -- GDC | SNV__mutect | |
| TCGA-OL-A66P-01A-11D-A31U-09 | (TODO) -- GDC | SNV__mutect | |
| TCGA-OL-A6VO-01A-12D-A33E-09 | (TODO) -- GDC | SNV__mutect | |
| TCGA-OL-A6VQ-01A-12D-A41F-09 | (TODO) -- GDC | SNV__mutect | |
| TCGA-OL-A6VR-01A-32D-A33E-09 | (TODO) -- GDC | SNV__mutect | |
| TCGA-OL-A97C-01A-32D-A41F-09 | (TODO) -- GDC | SNV__mutect | |
| TCGA-PE-A5DC-01A-12D-A27P-09 | (TODO) -- GDC | SNV__mutect | |
| TCGA-PE-A5DD-01A-12D-A27P-09 | (TODO) -- GDC | SNV__mutect | |
| TCGA-PE-A5DE-01A-11D-A27P-09 | (TODO) -- GDC | SNV__mutect | |
| TCGA-S3-A6ZF-01A-32D-A32I-09 | (TODO) -- GDC | SNV__mutect | |
| TCGA-S3-A6ZG-01A-22D-A32I-09 | (TODO) -- GDC | SNV__mutect | |
| TCGA-S3-A6ZH-01A-22D-A32I-09 | (TODO) -- GDC | SNV__mutect | |
| TCGA-S3-AA0Z-01A-11D-A41F-09 | (TODO) -- GDC | SNV__mutect | |
| TCGA-S3-AA10-01A-21D-A41F-09 | (TODO) -- GDC | SNV__mutect | |
| TCGA-S3-AA11-01A-31D-A41F-09 | (TODO) -- GDC | SNV__mutect | |
| TCGA-S3-AA12-01A-11D-A41F-09 | (TODO) -- GDC | SNV__mutect | |
| TCGA-S3-AA14-01A-11D-A41F-09 | (TODO) -- GDC | SNV__mutect | |
| TCGA-S3-AA15-01A-11D-A41F-09 | (TODO) -- GDC | SNV__mutect | |
| TCGA-S3-AA17-01A-11D-A41F-09 | (TODO) -- GDC | SNV__mutect | |
| TCGA-UL-AAZ6-01A-11D-A41F-09 | (TODO) -- GDC | SNV__mutect | |
| TCGA-UU-A93S-01A-21D-A41F-09 | (TODO) -- GDC | SNV__mutect | |
| TCGA-V7-A7HQ-01A-11D-A33E-09 | (TODO) -- GDC | SNV__mutect | |
| TCGA-W8-A86G-01A-21D-A36J-09 | (TODO) -- GDC | SNV__mutect | |
| TCGA-WT-AB41-01A-11D-A41F-09 | (TODO) -- GDC | SNV__mutect | |
| TCGA-WT-AB44-01A-11D-A41F-09 | (TODO) -- GDC | SNV__mutect | |
| TCGA-XX-A899-01A-11D-A36J-09 | (TODO) -- GDC | SNV__mutect | |
| TCGA-XX-A89A-01A-11D-A36J-09 | (TODO) -- GDC | SNV__mutect | |
| TCGA-Z7-A8R5-01A-42D-A41F-09 | (TODO) -- GDC | SNV__mutect | |
| TCGA-Z7-A8R6-01A-11D-A41F-09 | (TODO) -- GDC | SNV__mutect |
Table S30.
| TCGA Barcode | Platform | Center | Annotation |
|---|---|---|---|
| TCGA-3C-AAAU-01A-11D-A41Q-05 | Illumina Human Methylation 450 | (TODO) -- GDC | methylation__HM450 |
| TCGA-3C-AALI-01A-11D-A41Q-05 | Illumina Human Methylation 450 | (TODO) -- GDC | methylation__HM450 |
| TCGA-3C-AALJ-01A-31D-A41Q-05 | Illumina Human Methylation 450 | (TODO) -- GDC | methylation__HM450 |
| TCGA-3C-AALK-01A-11D-A41Q-05 | Illumina Human Methylation 450 | (TODO) -- GDC | methylation__HM450 |
| TCGA-4H-AAAK-01A-12D-A41Q-05 | Illumina Human Methylation 450 | (TODO) -- GDC | methylation__HM450 |
| TCGA-5L-AAT0-01A-12D-A41Q-05 | Illumina Human Methylation 450 | (TODO) -- GDC | methylation__HM450 |
| TCGA-5L-AAT1-01A-12D-A41Q-05 | Illumina Human Methylation 450 | (TODO) -- GDC | methylation__HM450 |
| TCGA-5T-A9QA-01A-11D-A41Q-05 | Illumina Human Methylation 450 | (TODO) -- GDC | methylation__HM450 |
| TCGA-A1-A0SB-01A-11D-A145-05 | Illumina Human Methylation 450 | (TODO) -- GDC | methylation__HM450 |
| TCGA-A1-A0SD-01A-11D-A112-05 | Illumina Human Methylation 27 | (TODO) -- GDC | methylation__HM27 |
| TCGA-A1-A0SE-01A-11D-A10P-05 | Illumina Human Methylation 450 | (TODO) -- GDC | methylation__HM450 |
| TCGA-A1-A0SF-01A-11D-A145-05 | Illumina Human Methylation 450 | (TODO) -- GDC | methylation__HM450 |
| TCGA-A1-A0SG-01A-11D-A145-05 | Illumina Human Methylation 450 | (TODO) -- GDC | methylation__HM450 |
| TCGA-A1-A0SH-01A-11D-A10P-05 | Illumina Human Methylation 450 | (TODO) -- GDC | methylation__HM450 |
| TCGA-A1-A0SI-01A-11D-A145-05 | Illumina Human Methylation 450 | (TODO) -- GDC | methylation__HM450 |
| TCGA-A1-A0SJ-01A-11D-A10P-05 | Illumina Human Methylation 450 | (TODO) -- GDC | methylation__HM450 |
| TCGA-A1-A0SK-01A-12D-A10P-05 | Illumina Human Methylation 450 | (TODO) -- GDC | methylation__HM450 |
| TCGA-A1-A0SM-01A-11D-A10P-05 | Illumina Human Methylation 450 | (TODO) -- GDC | methylation__HM450 |
| TCGA-A1-A0SN-01A-11D-A145-05 | Illumina Human Methylation 450 | (TODO) -- GDC | methylation__HM450 |
| TCGA-A1-A0SO-01A-22D-A10P-05 | Illumina Human Methylation 450 | (TODO) -- GDC | methylation__HM450 |
| TCGA-A1-A0SP-01A-11D-A10P-05 | Illumina Human Methylation 450 | (TODO) -- GDC | methylation__HM450 |
| TCGA-A1-A0SQ-01A-21D-A145-05 | Illumina Human Methylation 450 | (TODO) -- GDC | methylation__HM450 |
| TCGA-A2-A04N-01A-11D-A112-05 | Illumina Human Methylation 27 | (TODO) -- GDC | methylation__HM27 |
| TCGA-A2-A04P-01A-31D-A032-05 | Illumina Human Methylation 27 | (TODO) -- GDC | methylation__HM27 |
| TCGA-A2-A04Q-01A-21D-A032-05 | Illumina Human Methylation 27 | (TODO) -- GDC | methylation__HM27 |
| TCGA-A2-A04R-01A-41D-A10A-05 | Illumina Human Methylation 450 | (TODO) -- GDC | methylation__HM450 |
| TCGA-A2-A04T-01A-21D-A032-05 | Illumina Human Methylation 27 | (TODO) -- GDC | methylation__HM27 |
| TCGA-A2-A04U-01A-11D-A112-05 | Illumina Human Methylation 27 | (TODO) -- GDC | methylation__HM27 |
| TCGA-A2-A04V-01A-21D-A032-05 | Illumina Human Methylation 27 | (TODO) -- GDC | methylation__HM27 |
| TCGA-A2-A04W-01A-31D-A112-05 | Illumina Human Methylation 27 | (TODO) -- GDC | methylation__HM27 |
| TCGA-A2-A04X-01A-21D-A032-05 | Illumina Human Methylation 27 | (TODO) -- GDC | methylation__HM27 |
| TCGA-A2-A04Y-01A-21D-A032-05 | Illumina Human Methylation 27 | (TODO) -- GDC | methylation__HM27 |
| TCGA-A2-A0CK-01A-11D-A22B-05 | Illumina Human Methylation 450 | (TODO) -- GDC | methylation__HM450 |
| TCGA-A2-A0CL-01A-11D-A112-05 | Illumina Human Methylation 27 | (TODO) -- GDC | methylation__HM27 |
| TCGA-A2-A0CM-01A-31D-A032-05 | Illumina Human Methylation 27 | (TODO) -- GDC | methylation__HM27 |
| TCGA-A2-A0CO-01A-13D-A22B-05 | Illumina Human Methylation 450 | (TODO) -- GDC | methylation__HM450 |
| TCGA-A2-A0CP-01A-11D-A032-05 | Illumina Human Methylation 27 | (TODO) -- GDC | methylation__HM27 |
| TCGA-A2-A0CQ-01A-21D-A032-05 | Illumina Human Methylation 27 | (TODO) -- GDC | methylation__HM27 |
| TCGA-A2-A0CR-01A-11D-A22B-05 | Illumina Human Methylation 450 | (TODO) -- GDC | methylation__HM450 |
| TCGA-A2-A0CS-01A-11D-A112-05 | Illumina Human Methylation 27 | (TODO) -- GDC | methylation__HM27 |
| TCGA-A2-A0CT-01A-31D-A10P-05 | Illumina Human Methylation 450 | (TODO) -- GDC | methylation__HM450 |
| TCGA-A2-A0CU-01A-12D-A032-05 | Illumina Human Methylation 27 | (TODO) -- GDC | methylation__HM27 |
| TCGA-A2-A0CV-01A-31D-A112-05 | Illumina Human Methylation 27 | (TODO) -- GDC | methylation__HM27 |
| TCGA-A2-A0CW-01A-21D-A112-05 | Illumina Human Methylation 27 | (TODO) -- GDC | methylation__HM27 |
| TCGA-A2-A0CX-01A-21D-A00Y-05 | Illumina Human Methylation 27 | (TODO) -- GDC | methylation__HM27 |
| TCGA-A2-A0CY-01A-12D-A032-05 | Illumina Human Methylation 27 | (TODO) -- GDC | methylation__HM27 |
| TCGA-A2-A0CZ-01A-11D-A032-05 | Illumina Human Methylation 27 | (TODO) -- GDC | methylation__HM27 |
| TCGA-A2-A0D0-01A-11D-A00Y-05 | Illumina Human Methylation 27 | (TODO) -- GDC | methylation__HM27 |
| TCGA-A2-A0D1-01A-11D-A032-05 | Illumina Human Methylation 27 | (TODO) -- GDC | methylation__HM27 |
| TCGA-A2-A0D2-01A-21D-A032-05 | Illumina Human Methylation 27 | (TODO) -- GDC | methylation__HM27 |
| TCGA-A2-A0D3-01A-11D-A112-05 | Illumina Human Methylation 27 | (TODO) -- GDC | methylation__HM27 |
| TCGA-A2-A0D4-01A-11D-A00Y-05 | Illumina Human Methylation 27 | (TODO) -- GDC | methylation__HM27 |
| TCGA-A2-A0EM-01A-11D-A032-05 | Illumina Human Methylation 27 | (TODO) -- GDC | methylation__HM27 |
| TCGA-A2-A0EN-01A-13D-A10P-05 | Illumina Human Methylation 450 | (TODO) -- GDC | methylation__HM450 |
| TCGA-A2-A0EO-01A-11D-A032-05 | Illumina Human Methylation 27 | (TODO) -- GDC | methylation__HM27 |
| TCGA-A2-A0EP-01A-52D-A230-05 | Illumina Human Methylation 450 | (TODO) -- GDC | methylation__HM450 |
| TCGA-A2-A0EQ-01A-11D-A032-05 | Illumina Human Methylation 27 | (TODO) -- GDC | methylation__HM27 |
| TCGA-A2-A0ER-01A-21D-A032-05 | Illumina Human Methylation 27 | (TODO) -- GDC | methylation__HM27 |
| TCGA-A2-A0ES-01A-11D-A112-05 | Illumina Human Methylation 27 | (TODO) -- GDC | methylation__HM27 |
| TCGA-A2-A0ET-01A-31D-A032-05 | Illumina Human Methylation 27 | (TODO) -- GDC | methylation__HM27 |
| TCGA-A2-A0EU-01A-22D-A10P-05 | Illumina Human Methylation 450 | (TODO) -- GDC | methylation__HM450 |
| TCGA-A2-A0EV-01A-11D-A032-05 | Illumina Human Methylation 27 | (TODO) -- GDC | methylation__HM27 |
| TCGA-A2-A0EW-01A-21D-A112-05 | Illumina Human Methylation 27 | (TODO) -- GDC | methylation__HM27 |
| TCGA-A2-A0EX-01A-21D-A032-05 | Illumina Human Methylation 27 | (TODO) -- GDC | methylation__HM27 |
| TCGA-A2-A0EY-01A-11D-A032-05 | Illumina Human Methylation 27 | (TODO) -- GDC | methylation__HM27 |
| TCGA-A2-A0ST-01A-12D-A10P-05 | Illumina Human Methylation 450 | (TODO) -- GDC | methylation__HM450 |
| TCGA-A2-A0SU-01A-11D-A10P-05 | Illumina Human Methylation 450 | (TODO) -- GDC | methylation__HM450 |
| TCGA-A2-A0SV-01A-11D-A10P-05 | Illumina Human Methylation 450 | (TODO) -- GDC | methylation__HM450 |
| TCGA-A2-A0SW-01A-11D-A10P-05 | Illumina Human Methylation 450 | (TODO) -- GDC | methylation__HM450 |
| TCGA-A2-A0SX-01A-12D-A10P-05 | Illumina Human Methylation 450 | (TODO) -- GDC | methylation__HM450 |
| TCGA-A2-A0SY-01A-31D-A10P-05 | Illumina Human Methylation 450 | (TODO) -- GDC | methylation__HM450 |
| TCGA-A2-A0T0-01A-22D-A10P-05 | Illumina Human Methylation 450 | (TODO) -- GDC | methylation__HM450 |
| TCGA-A2-A0T1-01A-21D-A10P-05 | Illumina Human Methylation 450 | (TODO) -- GDC | methylation__HM450 |
| TCGA-A2-A0T2-01A-11D-A10P-05 | Illumina Human Methylation 450 | (TODO) -- GDC | methylation__HM450 |
| TCGA-A2-A0T3-01A-21D-A112-05 | Illumina Human Methylation 27 | (TODO) -- GDC | methylation__HM27 |
| TCGA-A2-A0T4-01A-31D-A10P-05 | Illumina Human Methylation 450 | (TODO) -- GDC | methylation__HM450 |
| TCGA-A2-A0T5-01A-21D-A10P-05 | Illumina Human Methylation 450 | (TODO) -- GDC | methylation__HM450 |
| TCGA-A2-A0T6-01A-11D-A10P-05 | Illumina Human Methylation 450 | (TODO) -- GDC | methylation__HM450 |
| TCGA-A2-A0T7-01A-21D-A10P-05 | Illumina Human Methylation 450 | (TODO) -- GDC | methylation__HM450 |
| TCGA-A2-A0YC-01A-11D-A10A-05 | Illumina Human Methylation 450 | (TODO) -- GDC | methylation__HM450 |
| TCGA-A2-A0YD-01A-11D-A10A-05 | Illumina Human Methylation 450 | (TODO) -- GDC | methylation__HM450 |
| TCGA-A2-A0YE-01A-11D-A10A-05 | Illumina Human Methylation 450 | (TODO) -- GDC | methylation__HM450 |
| TCGA-A2-A0YF-01A-21D-A10A-05 | Illumina Human Methylation 450 | (TODO) -- GDC | methylation__HM450 |
| TCGA-A2-A0YG-01A-21D-A10A-05 | Illumina Human Methylation 450 | (TODO) -- GDC | methylation__HM450 |
| TCGA-A2-A0YH-01A-11D-A10A-05 | Illumina Human Methylation 450 | (TODO) -- GDC | methylation__HM450 |
| TCGA-A2-A0YI-01A-31D-A10N-05 | Illumina Human Methylation 450 | (TODO) -- GDC | methylation__HM450 |
| TCGA-A2-A0YJ-01A-11D-A10A-05 | Illumina Human Methylation 450 | (TODO) -- GDC | methylation__HM450 |
| TCGA-A2-A0YK-01A-22D-A10A-05 | Illumina Human Methylation 450 | (TODO) -- GDC | methylation__HM450 |
| TCGA-A2-A0YL-01A-21D-A10A-05 | Illumina Human Methylation 450 | (TODO) -- GDC | methylation__HM450 |
| TCGA-A2-A0YM-01A-11D-A10A-05 | Illumina Human Methylation 450 | (TODO) -- GDC | methylation__HM450 |
| TCGA-A2-A0YT-01A-11D-A10A-05 | Illumina Human Methylation 450 | (TODO) -- GDC | methylation__HM450 |
| TCGA-A2-A1FV-01A-11D-A13K-05 | Illumina Human Methylation 450 | (TODO) -- GDC | methylation__HM450 |
| TCGA-A2-A1FW-01A-11D-A13K-05 | Illumina Human Methylation 450 | (TODO) -- GDC | methylation__HM450 |
| TCGA-A2-A1FX-01A-11D-A13K-05 | Illumina Human Methylation 450 | (TODO) -- GDC | methylation__HM450 |
| TCGA-A2-A1FZ-01A-51D-A14H-05 | Illumina Human Methylation 450 | (TODO) -- GDC | methylation__HM450 |
| TCGA-A2-A1G0-01A-11D-A13K-05 | Illumina Human Methylation 450 | (TODO) -- GDC | methylation__HM450 |
| TCGA-A2-A1G1-01A-21D-A13K-05 | Illumina Human Methylation 450 | (TODO) -- GDC | methylation__HM450 |
| TCGA-A2-A1G4-01A-11D-A13K-05 | Illumina Human Methylation 450 | (TODO) -- GDC | methylation__HM450 |
| TCGA-A2-A1G6-01A-11D-A13K-05 | Illumina Human Methylation 450 | (TODO) -- GDC | methylation__HM450 |
| TCGA-A2-A259-01A-11D-A16G-05 | Illumina Human Methylation 450 | (TODO) -- GDC | methylation__HM450 |
| TCGA-A2-A25A-01A-12D-A16G-05 | Illumina Human Methylation 450 | (TODO) -- GDC | methylation__HM450 |
| TCGA-A2-A25B-01A-11D-A16A-05 | Illumina Human Methylation 450 | (TODO) -- GDC | methylation__HM450 |
| TCGA-A2-A25C-01A-11D-A16A-05 | Illumina Human Methylation 450 | (TODO) -- GDC | methylation__HM450 |
| TCGA-A2-A25D-01A-12D-A16G-05 | Illumina Human Methylation 450 | (TODO) -- GDC | methylation__HM450 |
| TCGA-A2-A25E-01A-11D-A16A-05 | Illumina Human Methylation 450 | (TODO) -- GDC | methylation__HM450 |
| TCGA-A2-A25F-01A-11D-A16A-05 | Illumina Human Methylation 450 | (TODO) -- GDC | methylation__HM450 |
| TCGA-A2-A3KC-01A-11D-A212-05 | Illumina Human Methylation 450 | (TODO) -- GDC | methylation__HM450 |
| TCGA-A2-A3KD-01A-12D-A212-05 | Illumina Human Methylation 450 | (TODO) -- GDC | methylation__HM450 |
| TCGA-A2-A3XS-01A-11D-A230-05 | Illumina Human Methylation 450 | (TODO) -- GDC | methylation__HM450 |
| TCGA-A2-A3XT-01A-11D-A230-05 | Illumina Human Methylation 450 | (TODO) -- GDC | methylation__HM450 |
| TCGA-A2-A3XU-01A-12D-A230-05 | Illumina Human Methylation 450 | (TODO) -- GDC | methylation__HM450 |
| TCGA-A2-A3XV-01A-21D-A23D-05 | Illumina Human Methylation 450 | (TODO) -- GDC | methylation__HM450 |
| TCGA-A2-A3XW-01A-11D-A23D-05 | Illumina Human Methylation 450 | (TODO) -- GDC | methylation__HM450 |
| TCGA-A2-A3XX-01A-21D-A23D-05 | Illumina Human Methylation 450 | (TODO) -- GDC | methylation__HM450 |
| TCGA-A2-A3XY-01A-11D-A23D-05 | Illumina Human Methylation 450 | (TODO) -- GDC | methylation__HM450 |
| TCGA-A2-A3XZ-01A-42D-A23D-05 | Illumina Human Methylation 450 | (TODO) -- GDC | methylation__HM450 |
| TCGA-A2-A3Y0-01A-11D-A23D-05 | Illumina Human Methylation 450 | (TODO) -- GDC | methylation__HM450 |
| TCGA-A2-A4RW-01A-21D-A268-05 | Illumina Human Methylation 450 | (TODO) -- GDC | methylation__HM450 |
| TCGA-A2-A4RX-01A-11D-A268-05 | Illumina Human Methylation 450 | (TODO) -- GDC | methylation__HM450 |
| TCGA-A2-A4RY-01A-31D-A268-05 | Illumina Human Methylation 450 | (TODO) -- GDC | methylation__HM450 |
| TCGA-A2-A4S0-01A-21D-A268-05 | Illumina Human Methylation 450 | (TODO) -- GDC | methylation__HM450 |
| TCGA-A2-A4S1-01A-21D-A268-05 | Illumina Human Methylation 450 | (TODO) -- GDC | methylation__HM450 |
| TCGA-A2-A4S2-01A-12D-A268-05 | Illumina Human Methylation 450 | (TODO) -- GDC | methylation__HM450 |
| TCGA-A2-A4S3-01A-21D-A268-05 | Illumina Human Methylation 450 | (TODO) -- GDC | methylation__HM450 |
| TCGA-A7-A0CD-01A-11D-A00Y-05 | Illumina Human Methylation 27 | (TODO) -- GDC | methylation__HM27 |
| TCGA-A7-A0CE-01A-11D-A00Y-05 | Illumina Human Methylation 27 | (TODO) -- GDC | methylation__HM27 |
| TCGA-A7-A0CG-01A-11D-A00Y-05 | Illumina Human Methylation 27 | (TODO) -- GDC | methylation__HM27 |
| TCGA-A7-A0CH-01A-21D-A00Y-05 | Illumina Human Methylation 27 | (TODO) -- GDC | methylation__HM27 |
| TCGA-A7-A0CJ-01A-21D-A00Y-05 | Illumina Human Methylation 27 | (TODO) -- GDC | methylation__HM27 |
| TCGA-A7-A0D9-01A-31D-A10P-05 | Illumina Human Methylation 450 | (TODO) -- GDC | methylation__HM450 |
| TCGA-A7-A0DA-01A-31D-A112-05 | Illumina Human Methylation 27 | (TODO) -- GDC | methylation__HM27 |
| TCGA-A7-A0DB-01A-11D-A00Y-05 | Illumina Human Methylation 27 | (TODO) -- GDC | methylation__HM27 |
| TCGA-A7-A13D-01A-13D-A12R-05 | Illumina Human Methylation 450 | (TODO) -- GDC | methylation__HM450 |
| TCGA-A7-A13E-01A-11D-A12R-05 | Illumina Human Methylation 450 | (TODO) -- GDC | methylation__HM450 |
| TCGA-A7-A13F-01A-11D-A12R-05 | Illumina Human Methylation 450 | (TODO) -- GDC | methylation__HM450 |
| TCGA-A7-A13G-01A-11D-A13K-05 | Illumina Human Methylation 450 | (TODO) -- GDC | methylation__HM450 |
| TCGA-A7-A13H-01A-11D-A22B-05 | Illumina Human Methylation 450 | (TODO) -- GDC | methylation__HM450 |
| TCGA-A7-A26E-01A-11D-A16A-05 | Illumina Human Methylation 450 | (TODO) -- GDC | methylation__HM450 |
| TCGA-A7-A26E-01A-11D-A27B-05 | Illumina Human Methylation 450 | (TODO) -- GDC | methylation__HM450 |
| TCGA-A7-A26F-01A-21D-A16A-05 | Illumina Human Methylation 450 | (TODO) -- GDC | methylation__HM450 |
| TCGA-A7-A26G-01A-21D-A16A-05 | Illumina Human Methylation 450 | (TODO) -- GDC | methylation__HM450 |
| TCGA-A7-A26H-01A-11D-A16A-05 | Illumina Human Methylation 450 | (TODO) -- GDC | methylation__HM450 |
| TCGA-A7-A26I-01A-11D-A16A-05 | Illumina Human Methylation 450 | (TODO) -- GDC | methylation__HM450 |
| TCGA-A7-A26J-01A-11D-A16A-05 | Illumina Human Methylation 450 | (TODO) -- GDC | methylation__HM450 |
| TCGA-A7-A26J-01A-11D-A27B-05 | Illumina Human Methylation 450 | (TODO) -- GDC | methylation__HM450 |
| TCGA-A7-A2KD-01A-31D-A21R-05 | Illumina Human Methylation 450 | (TODO) -- GDC | methylation__HM450 |
| TCGA-A7-A3IY-01A-21D-A21R-05 | Illumina Human Methylation 450 | (TODO) -- GDC | methylation__HM450 |
| TCGA-A7-A3IZ-01A-11D-A212-05 | Illumina Human Methylation 450 | (TODO) -- GDC | methylation__HM450 |
| TCGA-A7-A3J0-01A-11D-A212-05 | Illumina Human Methylation 450 | (TODO) -- GDC | methylation__HM450 |
| TCGA-A7-A3J1-01A-11D-A212-05 | Illumina Human Methylation 450 | (TODO) -- GDC | methylation__HM450 |
| TCGA-A7-A3RF-01A-11D-A22B-05 | Illumina Human Methylation 450 | (TODO) -- GDC | methylation__HM450 |
| TCGA-A7-A425-01A-11D-A244-05 | Illumina Human Methylation 450 | (TODO) -- GDC | methylation__HM450 |
| TCGA-A7-A426-01A-22D-A244-05 | Illumina Human Methylation 450 | (TODO) -- GDC | methylation__HM450 |
| TCGA-A7-A4SA-01A-11D-A268-05 | Illumina Human Methylation 450 | (TODO) -- GDC | methylation__HM450 |
| TCGA-A7-A4SB-01A-21D-A268-05 | Illumina Human Methylation 450 | (TODO) -- GDC | methylation__HM450 |
| TCGA-A7-A4SC-01A-12D-A268-05 | Illumina Human Methylation 450 | (TODO) -- GDC | methylation__HM450 |
| TCGA-A7-A4SD-01A-11D-A268-05 | Illumina Human Methylation 450 | (TODO) -- GDC | methylation__HM450 |
| TCGA-A7-A4SE-01A-11D-A268-05 | Illumina Human Methylation 450 | (TODO) -- GDC | methylation__HM450 |
| TCGA-A7-A4SF-01A-11D-A268-05 | Illumina Human Methylation 450 | (TODO) -- GDC | methylation__HM450 |
| TCGA-A7-A56D-01A-11D-A27Y-05 | Illumina Human Methylation 450 | (TODO) -- GDC | methylation__HM450 |
| TCGA-A7-A5ZV-01A-11D-A28C-05 | Illumina Human Methylation 450 | (TODO) -- GDC | methylation__HM450 |
| TCGA-A7-A5ZW-01A-12D-A29O-05 | Illumina Human Methylation 450 | (TODO) -- GDC | methylation__HM450 |
| TCGA-A7-A5ZX-01A-12D-A29O-05 | Illumina Human Methylation 450 | (TODO) -- GDC | methylation__HM450 |
| TCGA-A7-A6VV-01A-22D-A33F-05 | Illumina Human Methylation 450 | (TODO) -- GDC | methylation__HM450 |
| TCGA-A7-A6VW-01A-21D-A33F-05 | Illumina Human Methylation 450 | (TODO) -- GDC | methylation__HM450 |
| TCGA-A7-A6VX-01A-12D-A33F-05 | Illumina Human Methylation 450 | (TODO) -- GDC | methylation__HM450 |
| TCGA-A7-A6VY-01A-12D-A33F-05 | Illumina Human Methylation 450 | (TODO) -- GDC | methylation__HM450 |
| TCGA-A8-A06N-01A-11D-A00Y-05 | Illumina Human Methylation 27 | (TODO) -- GDC | methylation__HM27 |
| TCGA-A8-A06O-01A-11D-A00Y-05 | Illumina Human Methylation 27 | (TODO) -- GDC | methylation__HM27 |
| TCGA-A8-A06P-01A-11D-A00Y-05 | Illumina Human Methylation 27 | (TODO) -- GDC | methylation__HM27 |
| TCGA-A8-A06Q-01A-11D-A032-05 | Illumina Human Methylation 27 | (TODO) -- GDC | methylation__HM27 |
| TCGA-A8-A06R-01A-11D-A00Y-05 | Illumina Human Methylation 27 | (TODO) -- GDC | methylation__HM27 |
| TCGA-A8-A06T-01A-11D-A00Y-05 | Illumina Human Methylation 27 | (TODO) -- GDC | methylation__HM27 |
| TCGA-A8-A06U-01A-11D-A00Y-05 | Illumina Human Methylation 27 | (TODO) -- GDC | methylation__HM27 |
| TCGA-A8-A06X-01A-21D-A00Y-05 | Illumina Human Methylation 27 | (TODO) -- GDC | methylation__HM27 |
| TCGA-A8-A06Y-01A-21D-A00Y-05 | Illumina Human Methylation 27 | (TODO) -- GDC | methylation__HM27 |
| TCGA-A8-A06Z-01A-11D-A00Y-05 | Illumina Human Methylation 27 | (TODO) -- GDC | methylation__HM27 |
| TCGA-A8-A075-01A-11D-A10P-05 | Illumina Human Methylation 450 | (TODO) -- GDC | methylation__HM450 |
| TCGA-A8-A076-01A-21D-A00Y-05 | Illumina Human Methylation 27 | (TODO) -- GDC | methylation__HM27 |
| TCGA-A8-A079-01A-21D-A00Y-05 | Illumina Human Methylation 27 | (TODO) -- GDC | methylation__HM27 |
| TCGA-A8-A07B-01A-11D-A00Y-05 | Illumina Human Methylation 27 | (TODO) -- GDC | methylation__HM27 |
| TCGA-A8-A07C-01A-11D-A032-05 | Illumina Human Methylation 27 | (TODO) -- GDC | methylation__HM27 |
| TCGA-A8-A07E-01A-11D-A032-05 | Illumina Human Methylation 27 | (TODO) -- GDC | methylation__HM27 |
| TCGA-A8-A07F-01A-11D-A00Y-05 | Illumina Human Methylation 27 | (TODO) -- GDC | methylation__HM27 |
| TCGA-A8-A07G-01A-11D-A032-05 | Illumina Human Methylation 27 | (TODO) -- GDC | methylation__HM27 |
| TCGA-A8-A07I-01A-11D-A00Y-05 | Illumina Human Methylation 27 | (TODO) -- GDC | methylation__HM27 |
| TCGA-A8-A07J-01A-11D-A00Y-05 | Illumina Human Methylation 27 | (TODO) -- GDC | methylation__HM27 |
| TCGA-A8-A07L-01A-11D-A00Y-05 | Illumina Human Methylation 27 | (TODO) -- GDC | methylation__HM27 |
| TCGA-A8-A07O-01A-11D-A00Y-05 | Illumina Human Methylation 27 | (TODO) -- GDC | methylation__HM27 |
| TCGA-A8-A07P-01A-11D-A00Y-05 | Illumina Human Methylation 27 | (TODO) -- GDC | methylation__HM27 |
| TCGA-A8-A07R-01A-21D-A032-05 | Illumina Human Methylation 27 | (TODO) -- GDC | methylation__HM27 |
| TCGA-A8-A07S-01A-11D-A032-05 | Illumina Human Methylation 27 | (TODO) -- GDC | methylation__HM27 |
| TCGA-A8-A07U-01A-11D-A032-05 | Illumina Human Methylation 27 | (TODO) -- GDC | methylation__HM27 |
| TCGA-A8-A07W-01A-11D-A00Y-05 | Illumina Human Methylation 27 | (TODO) -- GDC | methylation__HM27 |
| TCGA-A8-A07Z-01A-11D-A00Y-05 | Illumina Human Methylation 27 | (TODO) -- GDC | methylation__HM27 |
| TCGA-A8-A081-01A-11D-A00Y-05 | Illumina Human Methylation 27 | (TODO) -- GDC | methylation__HM27 |
| TCGA-A8-A082-01A-11D-A00Y-05 | Illumina Human Methylation 27 | (TODO) -- GDC | methylation__HM27 |
| TCGA-A8-A083-01A-21D-A00Y-05 | Illumina Human Methylation 27 | (TODO) -- GDC | methylation__HM27 |
| TCGA-A8-A084-01A-21D-A00Y-05 | Illumina Human Methylation 27 | (TODO) -- GDC | methylation__HM27 |
| TCGA-A8-A085-01A-11D-A00Y-05 | Illumina Human Methylation 27 | (TODO) -- GDC | methylation__HM27 |
| TCGA-A8-A086-01A-11D-A00Y-05 | Illumina Human Methylation 27 | (TODO) -- GDC | methylation__HM27 |
| TCGA-A8-A08A-01A-11D-A00Y-05 | Illumina Human Methylation 27 | (TODO) -- GDC | methylation__HM27 |
| TCGA-A8-A08B-01A-11D-A00Y-05 | Illumina Human Methylation 27 | (TODO) -- GDC | methylation__HM27 |
| TCGA-A8-A08C-01A-11D-A00Y-05 | Illumina Human Methylation 27 | (TODO) -- GDC | methylation__HM27 |
| TCGA-A8-A08F-01A-11D-A00Y-05 | Illumina Human Methylation 27 | (TODO) -- GDC | methylation__HM27 |
| TCGA-A8-A08G-01A-11D-A00Y-05 | Illumina Human Methylation 27 | (TODO) -- GDC | methylation__HM27 |
| TCGA-A8-A08H-01A-21D-A00Y-05 | Illumina Human Methylation 27 | (TODO) -- GDC | methylation__HM27 |
| TCGA-A8-A08I-01A-11D-A00Y-05 | Illumina Human Methylation 27 | (TODO) -- GDC | methylation__HM27 |
| TCGA-A8-A08J-01A-11D-A00Y-05 | Illumina Human Methylation 27 | (TODO) -- GDC | methylation__HM27 |
| TCGA-A8-A08L-01A-11D-A00Y-05 | Illumina Human Methylation 27 | (TODO) -- GDC | methylation__HM27 |
| TCGA-A8-A08O-01A-21D-A10P-05 | Illumina Human Methylation 450 | (TODO) -- GDC | methylation__HM450 |
| TCGA-A8-A08P-01A-11D-A00Y-05 | Illumina Human Methylation 27 | (TODO) -- GDC | methylation__HM27 |
| TCGA-A8-A08R-01A-11D-A032-05 | Illumina Human Methylation 27 | (TODO) -- GDC | methylation__HM27 |
| TCGA-A8-A08S-01A-11D-A032-05 | Illumina Human Methylation 27 | (TODO) -- GDC | methylation__HM27 |
| TCGA-A8-A08T-01A-21D-A00Y-05 | Illumina Human Methylation 27 | (TODO) -- GDC | methylation__HM27 |
| TCGA-A8-A08X-01A-21D-A00Y-05 | Illumina Human Methylation 27 | (TODO) -- GDC | methylation__HM27 |
| TCGA-A8-A08Z-01A-21D-A00Y-05 | Illumina Human Methylation 27 | (TODO) -- GDC | methylation__HM27 |
| TCGA-A8-A090-01A-11D-A00Y-05 | Illumina Human Methylation 27 | (TODO) -- GDC | methylation__HM27 |
| TCGA-A8-A091-01A-11D-A00Y-05 | Illumina Human Methylation 27 | (TODO) -- GDC | methylation__HM27 |
| TCGA-A8-A092-01A-11D-A00Y-05 | Illumina Human Methylation 27 | (TODO) -- GDC | methylation__HM27 |
| TCGA-A8-A093-01A-11D-A00Y-05 | Illumina Human Methylation 27 | (TODO) -- GDC | methylation__HM27 |
| TCGA-A8-A094-01A-11D-A00Y-05 | Illumina Human Methylation 27 | (TODO) -- GDC | methylation__HM27 |
| TCGA-A8-A095-01A-11D-A00Y-05 | Illumina Human Methylation 27 | (TODO) -- GDC | methylation__HM27 |
| TCGA-A8-A096-01A-11D-A00Y-05 | Illumina Human Methylation 27 | (TODO) -- GDC | methylation__HM27 |
| TCGA-A8-A097-01A-11D-A032-05 | Illumina Human Methylation 27 | (TODO) -- GDC | methylation__HM27 |
| TCGA-A8-A099-01A-11D-A00Y-05 | Illumina Human Methylation 27 | (TODO) -- GDC | methylation__HM27 |
| TCGA-A8-A09A-01A-11D-A00Y-05 | Illumina Human Methylation 27 | (TODO) -- GDC | methylation__HM27 |
| TCGA-A8-A09B-01A-11D-A00Y-05 | Illumina Human Methylation 27 | (TODO) -- GDC | methylation__HM27 |
| TCGA-A8-A09C-01A-11D-A00Y-05 | Illumina Human Methylation 27 | (TODO) -- GDC | methylation__HM27 |
| TCGA-A8-A09D-01A-11D-A00Y-05 | Illumina Human Methylation 27 | (TODO) -- GDC | methylation__HM27 |
| TCGA-A8-A09E-01A-11D-A00Y-05 | Illumina Human Methylation 27 | (TODO) -- GDC | methylation__HM27 |
| TCGA-A8-A09G-01A-21D-A00Y-05 | Illumina Human Methylation 27 | (TODO) -- GDC | methylation__HM27 |
| TCGA-A8-A09I-01A-22D-A032-05 | Illumina Human Methylation 27 | (TODO) -- GDC | methylation__HM27 |
| TCGA-A8-A09K-01A-11D-A00Y-05 | Illumina Human Methylation 27 | (TODO) -- GDC | methylation__HM27 |
| TCGA-A8-A09M-01A-11D-A00Y-05 | Illumina Human Methylation 27 | (TODO) -- GDC | methylation__HM27 |
| TCGA-A8-A09N-01A-11D-A00Y-05 | Illumina Human Methylation 27 | (TODO) -- GDC | methylation__HM27 |
| TCGA-A8-A09Q-01A-11D-A00Y-05 | Illumina Human Methylation 27 | (TODO) -- GDC | methylation__HM27 |
| TCGA-A8-A09R-01A-11D-A00Y-05 | Illumina Human Methylation 27 | (TODO) -- GDC | methylation__HM27 |
| TCGA-A8-A09T-01A-11D-A00Y-05 | Illumina Human Methylation 27 | (TODO) -- GDC | methylation__HM27 |
| TCGA-A8-A09V-01A-11D-A032-05 | Illumina Human Methylation 27 | (TODO) -- GDC | methylation__HM27 |
| TCGA-A8-A09W-01A-11D-A00Y-05 | Illumina Human Methylation 27 | (TODO) -- GDC | methylation__HM27 |
| TCGA-A8-A09X-01A-11D-A00Y-05 | Illumina Human Methylation 27 | (TODO) -- GDC | methylation__HM27 |
| TCGA-A8-A09Z-01A-11D-A00Y-05 | Illumina Human Methylation 27 | (TODO) -- GDC | methylation__HM27 |
| TCGA-A8-A0A1-01A-11D-A00Y-05 | Illumina Human Methylation 27 | (TODO) -- GDC | methylation__HM27 |
| TCGA-A8-A0A2-01A-11D-A032-05 | Illumina Human Methylation 27 | (TODO) -- GDC | methylation__HM27 |
| TCGA-A8-A0A4-01A-11D-A00Y-05 | Illumina Human Methylation 27 | (TODO) -- GDC | methylation__HM27 |
| TCGA-A8-A0A6-01A-12D-A10P-05 | Illumina Human Methylation 450 | (TODO) -- GDC | methylation__HM450 |
| TCGA-A8-A0A7-01A-11D-A00Y-05 | Illumina Human Methylation 27 | (TODO) -- GDC | methylation__HM27 |
| TCGA-A8-A0A9-01A-11D-A00Y-05 | Illumina Human Methylation 27 | (TODO) -- GDC | methylation__HM27 |
| TCGA-A8-A0AB-01A-11D-A032-05 | Illumina Human Methylation 27 | (TODO) -- GDC | methylation__HM27 |
| TCGA-A8-A0AD-01A-11D-A10P-05 | Illumina Human Methylation 450 | (TODO) -- GDC | methylation__HM450 |
| TCGA-AC-A23C-01A-12D-A16A-05 | Illumina Human Methylation 450 | (TODO) -- GDC | methylation__HM450 |
| TCGA-AC-A23E-01A-11D-A161-05 | Illumina Human Methylation 450 | (TODO) -- GDC | methylation__HM450 |
| TCGA-AC-A23G-01A-11D-A212-05 | Illumina Human Methylation 450 | (TODO) -- GDC | methylation__HM450 |
| TCGA-AC-A23H-01A-11D-A161-05 | Illumina Human Methylation 450 | (TODO) -- GDC | methylation__HM450 |
| TCGA-AC-A2B8-01A-11D-A17F-05 | Illumina Human Methylation 450 | (TODO) -- GDC | methylation__HM450 |
| TCGA-AC-A2BK-01A-11D-A21R-05 | Illumina Human Methylation 450 | (TODO) -- GDC | methylation__HM450 |
| TCGA-AC-A2BM-01A-11D-A21R-05 | Illumina Human Methylation 450 | (TODO) -- GDC | methylation__HM450 |
| TCGA-AC-A2FB-01A-11D-A17F-05 | Illumina Human Methylation 450 | (TODO) -- GDC | methylation__HM450 |
| TCGA-AC-A2FE-01A-11D-A19Z-05 | Illumina Human Methylation 450 | (TODO) -- GDC | methylation__HM450 |
| TCGA-AC-A2FF-01A-11D-A17F-05 | Illumina Human Methylation 450 | (TODO) -- GDC | methylation__HM450 |
| TCGA-AC-A2FG-01A-11D-A17F-05 | Illumina Human Methylation 450 | (TODO) -- GDC | methylation__HM450 |
| TCGA-AC-A2FK-01A-12D-A17Z-05 | Illumina Human Methylation 450 | (TODO) -- GDC | methylation__HM450 |
| TCGA-AC-A2FM-01A-11D-A19Z-05 | Illumina Human Methylation 450 | (TODO) -- GDC | methylation__HM450 |
| TCGA-AC-A2FO-01A-11D-A17Z-05 | Illumina Human Methylation 450 | (TODO) -- GDC | methylation__HM450 |
| TCGA-AC-A2QH-01A-11D-A18O-05 | Illumina Human Methylation 450 | (TODO) -- GDC | methylation__HM450 |
| TCGA-AC-A2QI-01A-12D-A19Z-05 | Illumina Human Methylation 450 | (TODO) -- GDC | methylation__HM450 |
| TCGA-AC-A2QJ-01A-12D-A19Z-05 | Illumina Human Methylation 450 | (TODO) -- GDC | methylation__HM450 |
| TCGA-AC-A3BB-01A-21D-A19Z-05 | Illumina Human Methylation 450 | (TODO) -- GDC | methylation__HM450 |
| TCGA-AC-A3EH-01A-22D-A22B-05 | Illumina Human Methylation 450 | (TODO) -- GDC | methylation__HM450 |
| TCGA-AC-A3HN-01A-11D-A212-05 | Illumina Human Methylation 450 | (TODO) -- GDC | methylation__HM450 |
| TCGA-AC-A3OD-01A-11D-A21R-05 | Illumina Human Methylation 450 | (TODO) -- GDC | methylation__HM450 |
| TCGA-AC-A3QP-01A-11D-A230-05 | Illumina Human Methylation 450 | (TODO) -- GDC | methylation__HM450 |
| TCGA-AC-A3QQ-01A-11D-A22B-05 | Illumina Human Methylation 450 | (TODO) -- GDC | methylation__HM450 |
| TCGA-AC-A3TM-01A-11D-A22B-05 | Illumina Human Methylation 450 | (TODO) -- GDC | methylation__HM450 |
| TCGA-AC-A3TN-01A-11D-A22B-05 | Illumina Human Methylation 450 | (TODO) -- GDC | methylation__HM450 |
| TCGA-AC-A3W5-01A-11D-A22B-05 | Illumina Human Methylation 450 | (TODO) -- GDC | methylation__HM450 |
| TCGA-AC-A3W6-01A-12D-A22B-05 | Illumina Human Methylation 450 | (TODO) -- GDC | methylation__HM450 |
| TCGA-AC-A3W7-01A-11D-A22B-05 | Illumina Human Methylation 450 | (TODO) -- GDC | methylation__HM450 |
| TCGA-AC-A3YI-01A-21D-A23D-05 | Illumina Human Methylation 450 | (TODO) -- GDC | methylation__HM450 |
| TCGA-AC-A3YJ-01A-11D-A230-05 | Illumina Human Methylation 450 | (TODO) -- GDC | methylation__HM450 |
| TCGA-AC-A4ZE-01A-11D-A41Q-05 | Illumina Human Methylation 450 | (TODO) -- GDC | methylation__HM450 |
| TCGA-AC-A5EH-01A-11D-A28C-05 | Illumina Human Methylation 450 | (TODO) -- GDC | methylation__HM450 |
| TCGA-AC-A5EI-01A-11D-A27Y-05 | Illumina Human Methylation 450 | (TODO) -- GDC | methylation__HM450 |
| TCGA-AC-A5XS-01A-11D-A29O-05 | Illumina Human Methylation 450 | (TODO) -- GDC | methylation__HM450 |
| TCGA-AC-A5XU-01A-11D-A28C-05 | Illumina Human Methylation 450 | (TODO) -- GDC | methylation__HM450 |
| TCGA-AC-A62V-01A-11D-A31V-05 | Illumina Human Methylation 450 | (TODO) -- GDC | methylation__HM450 |
| TCGA-AC-A62X-01A-11D-A29O-05 | Illumina Human Methylation 450 | (TODO) -- GDC | methylation__HM450 |
| TCGA-AC-A62Y-01A-11D-A29O-05 | Illumina Human Methylation 450 | (TODO) -- GDC | methylation__HM450 |
| TCGA-AC-A6IV-01A-12D-A33F-05 | Illumina Human Methylation 450 | (TODO) -- GDC | methylation__HM450 |
| TCGA-AC-A6IW-01A-12D-A33F-05 | Illumina Human Methylation 450 | (TODO) -- GDC | methylation__HM450 |
| TCGA-AC-A6IX-01A-12D-A32T-05 | Illumina Human Methylation 450 | (TODO) -- GDC | methylation__HM450 |
| TCGA-AC-A6NO-01A-12D-A33F-05 | Illumina Human Methylation 450 | (TODO) -- GDC | methylation__HM450 |
| TCGA-AC-A7VB-01A-11D-A357-05 | Illumina Human Methylation 450 | (TODO) -- GDC | methylation__HM450 |
| TCGA-AC-A7VC-01A-11D-A357-05 | Illumina Human Methylation 450 | (TODO) -- GDC | methylation__HM450 |
| TCGA-AC-A8OP-01A-11D-A36K-05 | Illumina Human Methylation 450 | (TODO) -- GDC | methylation__HM450 |
| TCGA-AC-A8OQ-01A-11D-A41Q-05 | Illumina Human Methylation 450 | (TODO) -- GDC | methylation__HM450 |
| TCGA-AC-A8OR-01A-21D-A41Q-05 | Illumina Human Methylation 450 | (TODO) -- GDC | methylation__HM450 |
| TCGA-AC-A8OS-01A-12D-A41Q-05 | Illumina Human Methylation 450 | (TODO) -- GDC | methylation__HM450 |
| TCGA-AN-A03X-01A-21D-A00Y-05 | Illumina Human Methylation 27 | (TODO) -- GDC | methylation__HM27 |
| TCGA-AN-A03Y-01A-21D-A00Y-05 | Illumina Human Methylation 27 | (TODO) -- GDC | methylation__HM27 |
| TCGA-AN-A041-01A-11D-A032-05 | Illumina Human Methylation 27 | (TODO) -- GDC | methylation__HM27 |
| TCGA-AN-A046-01A-21D-A032-05 | Illumina Human Methylation 27 | (TODO) -- GDC | methylation__HM27 |
| TCGA-AN-A049-01A-21D-A00Y-05 | Illumina Human Methylation 27 | (TODO) -- GDC | methylation__HM27 |
| TCGA-AN-A04A-01A-21D-A032-05 | Illumina Human Methylation 27 | (TODO) -- GDC | methylation__HM27 |
| TCGA-AN-A04C-01A-21D-A032-05 | Illumina Human Methylation 27 | (TODO) -- GDC | methylation__HM27 |
| TCGA-AN-A04D-01A-21D-A032-05 | Illumina Human Methylation 27 | (TODO) -- GDC | methylation__HM27 |
| TCGA-AN-A0AJ-01A-11D-A00Y-05 | Illumina Human Methylation 27 | (TODO) -- GDC | methylation__HM27 |
| TCGA-AN-A0AK-01A-21D-A00Y-05 | Illumina Human Methylation 27 | (TODO) -- GDC | methylation__HM27 |
| TCGA-AN-A0AL-01A-11D-A00Y-05 | Illumina Human Methylation 27 | (TODO) -- GDC | methylation__HM27 |
| TCGA-AN-A0AM-01A-11D-A032-05 | Illumina Human Methylation 27 | (TODO) -- GDC | methylation__HM27 |
| TCGA-AN-A0AR-01A-11D-A00Y-05 | Illumina Human Methylation 27 | (TODO) -- GDC | methylation__HM27 |
| TCGA-AN-A0AS-01A-11D-A00Y-05 | Illumina Human Methylation 27 | (TODO) -- GDC | methylation__HM27 |
| TCGA-AN-A0AT-01A-11D-A032-05 | Illumina Human Methylation 27 | (TODO) -- GDC | methylation__HM27 |
| TCGA-AN-A0FD-01A-11D-A032-05 | Illumina Human Methylation 27 | (TODO) -- GDC | methylation__HM27 |
| TCGA-AN-A0FF-01A-11D-A032-05 | Illumina Human Methylation 27 | (TODO) -- GDC | methylation__HM27 |
| TCGA-AN-A0FJ-01A-11D-A00Y-05 | Illumina Human Methylation 27 | (TODO) -- GDC | methylation__HM27 |
| TCGA-AN-A0FK-01A-11D-A032-05 | Illumina Human Methylation 27 | (TODO) -- GDC | methylation__HM27 |
| TCGA-AN-A0FL-01A-11D-A032-05 | Illumina Human Methylation 27 | (TODO) -- GDC | methylation__HM27 |
| TCGA-AN-A0FN-01A-11D-A032-05 | Illumina Human Methylation 27 | (TODO) -- GDC | methylation__HM27 |
| TCGA-AN-A0FS-01A-11D-A032-05 | Illumina Human Methylation 27 | (TODO) -- GDC | methylation__HM27 |
| TCGA-AN-A0FT-01A-11D-A032-05 | Illumina Human Methylation 27 | (TODO) -- GDC | methylation__HM27 |
| TCGA-AN-A0FV-01A-11D-A00Y-05 | Illumina Human Methylation 27 | (TODO) -- GDC | methylation__HM27 |
| TCGA-AN-A0FW-01A-11D-A032-05 | Illumina Human Methylation 27 | (TODO) -- GDC | methylation__HM27 |
| TCGA-AN-A0FX-01A-11D-A032-05 | Illumina Human Methylation 27 | (TODO) -- GDC | methylation__HM27 |
| TCGA-AN-A0FY-01A-11D-A032-05 | Illumina Human Methylation 27 | (TODO) -- GDC | methylation__HM27 |
| TCGA-AN-A0FZ-01A-11D-A032-05 | Illumina Human Methylation 27 | (TODO) -- GDC | methylation__HM27 |
| TCGA-AN-A0G0-01A-11D-A032-05 | Illumina Human Methylation 27 | (TODO) -- GDC | methylation__HM27 |
| TCGA-AN-A0XL-01A-11D-A10N-05 | Illumina Human Methylation 450 | (TODO) -- GDC | methylation__HM450 |
| TCGA-AN-A0XN-01A-21D-A10A-05 | Illumina Human Methylation 450 | (TODO) -- GDC | methylation__HM450 |
| TCGA-AN-A0XO-01A-11D-A10A-05 | Illumina Human Methylation 450 | (TODO) -- GDC | methylation__HM450 |
| TCGA-AN-A0XP-01A-11D-A10A-05 | Illumina Human Methylation 450 | (TODO) -- GDC | methylation__HM450 |
| TCGA-AN-A0XR-01A-11D-A10A-05 | Illumina Human Methylation 450 | (TODO) -- GDC | methylation__HM450 |
| TCGA-AN-A0XS-01A-22D-A10A-05 | Illumina Human Methylation 450 | (TODO) -- GDC | methylation__HM450 |
| TCGA-AN-A0XT-01A-11D-A10A-05 | Illumina Human Methylation 450 | (TODO) -- GDC | methylation__HM450 |
| TCGA-AN-A0XU-01A-11D-A10A-05 | Illumina Human Methylation 450 | (TODO) -- GDC | methylation__HM450 |
| TCGA-AN-A0XV-01A-11D-A10A-05 | Illumina Human Methylation 450 | (TODO) -- GDC | methylation__HM450 |
| TCGA-AN-A0XW-01A-11D-A10A-05 | Illumina Human Methylation 450 | (TODO) -- GDC | methylation__HM450 |
| TCGA-AO-A03L-01A-41D-A10P-05 | Illumina Human Methylation 450 | (TODO) -- GDC | methylation__HM450 |
| TCGA-AO-A03M-01B-11D-A10N-05 | Illumina Human Methylation 450 | (TODO) -- GDC | methylation__HM450 |
| TCGA-AO-A03N-01B-11D-A10N-05 | Illumina Human Methylation 450 | (TODO) -- GDC | methylation__HM450 |
| TCGA-AO-A03O-01A-11D-A00Y-05 | Illumina Human Methylation 27 | (TODO) -- GDC | methylation__HM27 |
| TCGA-AO-A03P-01A-11D-A00Y-05 | Illumina Human Methylation 27 | (TODO) -- GDC | methylation__HM27 |
| TCGA-AO-A03R-01A-21D-A032-05 | Illumina Human Methylation 27 | (TODO) -- GDC | methylation__HM27 |
| TCGA-AO-A03T-01A-21D-A032-05 | Illumina Human Methylation 27 | (TODO) -- GDC | methylation__HM27 |
| TCGA-AO-A03U-01B-21D-A10N-05 | Illumina Human Methylation 450 | (TODO) -- GDC | methylation__HM450 |
| TCGA-AO-A03V-01A-11D-A112-05 | Illumina Human Methylation 27 | (TODO) -- GDC | methylation__HM27 |
| TCGA-AO-A0J2-01A-11D-A032-05 | Illumina Human Methylation 27 | (TODO) -- GDC | methylation__HM27 |
| TCGA-AO-A0J3-01A-11D-A032-05 | Illumina Human Methylation 27 | (TODO) -- GDC | methylation__HM27 |
| TCGA-AO-A0J4-01A-11D-A032-05 | Illumina Human Methylation 27 | (TODO) -- GDC | methylation__HM27 |
| TCGA-AO-A0J5-01A-11D-A032-05 | Illumina Human Methylation 27 | (TODO) -- GDC | methylation__HM27 |
| TCGA-AO-A0J6-01A-11D-A032-05 | Illumina Human Methylation 27 | (TODO) -- GDC | methylation__HM27 |
| TCGA-AO-A0J7-01A-11D-A032-05 | Illumina Human Methylation 27 | (TODO) -- GDC | methylation__HM27 |
| TCGA-AO-A0J8-01A-21D-A032-05 | Illumina Human Methylation 27 | (TODO) -- GDC | methylation__HM27 |
| TCGA-AO-A0J9-01A-11D-A032-05 | Illumina Human Methylation 27 | (TODO) -- GDC | methylation__HM27 |
| TCGA-AO-A0JA-01A-11D-A10P-05 | Illumina Human Methylation 450 | (TODO) -- GDC | methylation__HM450 |
| TCGA-AO-A0JB-01A-11D-A10P-05 | Illumina Human Methylation 450 | (TODO) -- GDC | methylation__HM450 |
| TCGA-AO-A0JC-01A-11D-A10P-05 | Illumina Human Methylation 450 | (TODO) -- GDC | methylation__HM450 |
| TCGA-AO-A0JD-01A-11D-A10P-05 | Illumina Human Methylation 450 | (TODO) -- GDC | methylation__HM450 |
| TCGA-AO-A0JE-01A-11D-A10P-05 | Illumina Human Methylation 450 | (TODO) -- GDC | methylation__HM450 |
| TCGA-AO-A0JF-01A-11D-A10P-05 | Illumina Human Methylation 450 | (TODO) -- GDC | methylation__HM450 |
| TCGA-AO-A0JG-01A-31D-A10P-05 | Illumina Human Methylation 450 | (TODO) -- GDC | methylation__HM450 |
| TCGA-AO-A0JI-01A-21D-A10P-05 | Illumina Human Methylation 450 | (TODO) -- GDC | methylation__HM450 |
| TCGA-AO-A0JJ-01A-11D-A10P-05 | Illumina Human Methylation 450 | (TODO) -- GDC | methylation__HM450 |
| TCGA-AO-A0JL-01A-11D-A10P-05 | Illumina Human Methylation 450 | (TODO) -- GDC | methylation__HM450 |
| TCGA-AO-A0JM-01A-21D-A10P-05 | Illumina Human Methylation 450 | (TODO) -- GDC | methylation__HM450 |
| TCGA-AO-A124-01A-11D-A10N-05 | Illumina Human Methylation 450 | (TODO) -- GDC | methylation__HM450 |
| TCGA-AO-A125-01A-11D-A10N-05 | Illumina Human Methylation 450 | (TODO) -- GDC | methylation__HM450 |
| TCGA-AO-A126-01A-11D-A10N-05 | Illumina Human Methylation 450 | (TODO) -- GDC | methylation__HM450 |
| TCGA-AO-A128-01A-11D-A10N-05 | Illumina Human Methylation 450 | (TODO) -- GDC | methylation__HM450 |
| TCGA-AO-A129-01A-21D-A10N-05 | Illumina Human Methylation 450 | (TODO) -- GDC | methylation__HM450 |
| TCGA-AO-A12A-01A-21D-A112-05 | Illumina Human Methylation 27 | (TODO) -- GDC | methylation__HM27 |
| TCGA-AO-A12B-01A-11D-A10N-05 | Illumina Human Methylation 450 | (TODO) -- GDC | methylation__HM450 |
| TCGA-AO-A12C-01A-11D-A10N-05 | Illumina Human Methylation 450 | (TODO) -- GDC | methylation__HM450 |
| TCGA-AO-A12D-01A-11D-A112-05 | Illumina Human Methylation 27 | (TODO) -- GDC | methylation__HM27 |
| TCGA-AO-A12E-01A-11D-A10N-05 | Illumina Human Methylation 450 | (TODO) -- GDC | methylation__HM450 |
| TCGA-AO-A12F-01A-11D-A112-05 | Illumina Human Methylation 27 | (TODO) -- GDC | methylation__HM27 |
| TCGA-AO-A12G-01A-11D-A10N-05 | Illumina Human Methylation 450 | (TODO) -- GDC | methylation__HM450 |
| TCGA-AO-A12H-01A-11D-A112-05 | Illumina Human Methylation 27 | (TODO) -- GDC | methylation__HM27 |
| TCGA-AO-A1KO-01A-31D-A13K-05 | Illumina Human Methylation 450 | (TODO) -- GDC | methylation__HM450 |
| TCGA-AO-A1KP-01A-11D-A13K-05 | Illumina Human Methylation 450 | (TODO) -- GDC | methylation__HM450 |
| TCGA-AO-A1KQ-01A-11D-A13K-05 | Illumina Human Methylation 450 | (TODO) -- GDC | methylation__HM450 |
| TCGA-AO-A1KR-01A-12D-A145-05 | Illumina Human Methylation 450 | (TODO) -- GDC | methylation__HM450 |
| TCGA-AO-A1KS-01A-11D-A13K-05 | Illumina Human Methylation 450 | (TODO) -- GDC | methylation__HM450 |
| TCGA-AO-A1KT-01A-11D-A13K-05 | Illumina Human Methylation 450 | (TODO) -- GDC | methylation__HM450 |
| TCGA-AQ-A04H-01B-11D-A10N-05 | Illumina Human Methylation 450 | (TODO) -- GDC | methylation__HM450 |
| TCGA-AQ-A04J-01A-02D-A032-05 | Illumina Human Methylation 27 | (TODO) -- GDC | methylation__HM27 |
| TCGA-AQ-A04L-01B-21D-A10N-05 | Illumina Human Methylation 450 | (TODO) -- GDC | methylation__HM450 |
| TCGA-AQ-A0Y5-01A-11D-A14N-05 | Illumina Human Methylation 450 | (TODO) -- GDC | methylation__HM450 |
| TCGA-AQ-A1H2-01A-11D-A13K-05 | Illumina Human Methylation 450 | (TODO) -- GDC | methylation__HM450 |
| TCGA-AQ-A1H3-01A-31D-A13K-05 | Illumina Human Methylation 450 | (TODO) -- GDC | methylation__HM450 |
| TCGA-AQ-A54N-01A-11D-A268-05 | Illumina Human Methylation 450 | (TODO) -- GDC | methylation__HM450 |
| TCGA-AQ-A54O-01A-11D-A268-05 | Illumina Human Methylation 450 | (TODO) -- GDC | methylation__HM450 |
| TCGA-AQ-A7U7-01A-22D-A357-05 | Illumina Human Methylation 450 | (TODO) -- GDC | methylation__HM450 |
| TCGA-AR-A0TP-01A-11D-A10P-05 | Illumina Human Methylation 450 | (TODO) -- GDC | methylation__HM450 |
| TCGA-AR-A0TQ-01A-11D-A10P-05 | Illumina Human Methylation 450 | (TODO) -- GDC | methylation__HM450 |
| TCGA-AR-A0TR-01A-11D-A10P-05 | Illumina Human Methylation 450 | (TODO) -- GDC | methylation__HM450 |
| TCGA-AR-A0TS-01A-11D-A112-05 | Illumina Human Methylation 27 | (TODO) -- GDC | methylation__HM27 |
| TCGA-AR-A0TT-01A-31D-A10P-05 | Illumina Human Methylation 450 | (TODO) -- GDC | methylation__HM450 |
| TCGA-AR-A0TU-01A-31D-A10A-05 | Illumina Human Methylation 450 | (TODO) -- GDC | methylation__HM450 |
| TCGA-AR-A0TV-01A-21D-A10P-05 | Illumina Human Methylation 450 | (TODO) -- GDC | methylation__HM450 |
| TCGA-AR-A0TW-01A-11D-A10P-05 | Illumina Human Methylation 450 | (TODO) -- GDC | methylation__HM450 |
| TCGA-AR-A0TX-01A-11D-A10P-05 | Illumina Human Methylation 450 | (TODO) -- GDC | methylation__HM450 |
| TCGA-AR-A0TY-01A-12D-A112-05 | Illumina Human Methylation 27 | (TODO) -- GDC | methylation__HM27 |
| TCGA-AR-A0TZ-01A-12D-A10P-05 | Illumina Human Methylation 450 | (TODO) -- GDC | methylation__HM450 |
| TCGA-AR-A0U0-01A-11D-A10A-05 | Illumina Human Methylation 450 | (TODO) -- GDC | methylation__HM450 |
| TCGA-AR-A0U1-01A-11D-A112-05 | Illumina Human Methylation 27 | (TODO) -- GDC | methylation__HM27 |
| TCGA-AR-A0U2-01A-11D-A10A-05 | Illumina Human Methylation 450 | (TODO) -- GDC | methylation__HM450 |
| TCGA-AR-A0U3-01A-11D-A10A-05 | Illumina Human Methylation 450 | (TODO) -- GDC | methylation__HM450 |
| TCGA-AR-A0U4-01A-11D-A10A-05 | Illumina Human Methylation 450 | (TODO) -- GDC | methylation__HM450 |
| TCGA-AR-A1AH-01A-11D-A12E-05 | Illumina Human Methylation 27 | (TODO) -- GDC | methylation__HM27 |
| TCGA-AR-A1AI-01A-11D-A12R-05 | Illumina Human Methylation 450 | (TODO) -- GDC | methylation__HM450 |
| TCGA-AR-A1AJ-01A-21D-A12R-05 | Illumina Human Methylation 450 | (TODO) -- GDC | methylation__HM450 |
| TCGA-AR-A1AK-01A-21D-A12R-05 | Illumina Human Methylation 450 | (TODO) -- GDC | methylation__HM450 |
| TCGA-AR-A1AL-01A-21D-A12R-05 | Illumina Human Methylation 450 | (TODO) -- GDC | methylation__HM450 |
| TCGA-AR-A1AM-01A-41D-A22B-05 | Illumina Human Methylation 450 | (TODO) -- GDC | methylation__HM450 |
| TCGA-AR-A1AN-01A-11D-A12R-05 | Illumina Human Methylation 450 | (TODO) -- GDC | methylation__HM450 |
| TCGA-AR-A1AO-01A-11D-A12R-05 | Illumina Human Methylation 450 | (TODO) -- GDC | methylation__HM450 |
| TCGA-AR-A1AP-01A-11D-A12R-05 | Illumina Human Methylation 450 | (TODO) -- GDC | methylation__HM450 |
| TCGA-AR-A1AQ-01A-11D-A12R-05 | Illumina Human Methylation 450 | (TODO) -- GDC | methylation__HM450 |
| TCGA-AR-A1AR-01A-31D-A138-05 | Illumina Human Methylation 450 | (TODO) -- GDC | methylation__HM450 |
| TCGA-AR-A1AS-01A-11D-A12R-05 | Illumina Human Methylation 450 | (TODO) -- GDC | methylation__HM450 |
| TCGA-AR-A1AT-01A-11D-A12R-05 | Illumina Human Methylation 450 | (TODO) -- GDC | methylation__HM450 |
| TCGA-AR-A1AU-01A-11D-A12R-05 | Illumina Human Methylation 450 | (TODO) -- GDC | methylation__HM450 |
| TCGA-AR-A1AV-01A-21D-A12R-05 | Illumina Human Methylation 450 | (TODO) -- GDC | methylation__HM450 |
| TCGA-AR-A1AW-01A-21D-A12R-05 | Illumina Human Methylation 450 | (TODO) -- GDC | methylation__HM450 |
| TCGA-AR-A1AX-01A-11D-A12R-05 | Illumina Human Methylation 450 | (TODO) -- GDC | methylation__HM450 |
| TCGA-AR-A1AY-01A-21D-A12R-05 | Illumina Human Methylation 450 | (TODO) -- GDC | methylation__HM450 |
| TCGA-AR-A24H-01A-11D-A16A-05 | Illumina Human Methylation 450 | (TODO) -- GDC | methylation__HM450 |
| TCGA-AR-A24K-01A-11D-A16A-05 | Illumina Human Methylation 450 | (TODO) -- GDC | methylation__HM450 |
| TCGA-AR-A24L-01A-11D-A16A-05 | Illumina Human Methylation 450 | (TODO) -- GDC | methylation__HM450 |
| TCGA-AR-A24M-01A-11D-A16A-05 | Illumina Human Methylation 450 | (TODO) -- GDC | methylation__HM450 |
| TCGA-AR-A24N-01A-11D-A16A-05 | Illumina Human Methylation 450 | (TODO) -- GDC | methylation__HM450 |
| TCGA-AR-A24O-01A-11D-A16A-05 | Illumina Human Methylation 450 | (TODO) -- GDC | methylation__HM450 |
| TCGA-AR-A24P-01A-11D-A16A-05 | Illumina Human Methylation 450 | (TODO) -- GDC | methylation__HM450 |
| TCGA-AR-A24Q-01A-12D-A16A-05 | Illumina Human Methylation 450 | (TODO) -- GDC | methylation__HM450 |
| TCGA-AR-A24R-01A-11D-A16A-05 | Illumina Human Methylation 450 | (TODO) -- GDC | methylation__HM450 |
| TCGA-AR-A24S-01A-11D-A16A-05 | Illumina Human Methylation 450 | (TODO) -- GDC | methylation__HM450 |
| TCGA-AR-A24T-01A-11D-A16A-05 | Illumina Human Methylation 450 | (TODO) -- GDC | methylation__HM450 |
| TCGA-AR-A24U-01A-11D-A16A-05 | Illumina Human Methylation 450 | (TODO) -- GDC | methylation__HM450 |
| TCGA-AR-A24V-01A-21D-A16A-05 | Illumina Human Methylation 450 | (TODO) -- GDC | methylation__HM450 |
| TCGA-AR-A24W-01A-11D-A16A-05 | Illumina Human Methylation 450 | (TODO) -- GDC | methylation__HM450 |
| TCGA-AR-A24X-01A-11D-A16A-05 | Illumina Human Methylation 450 | (TODO) -- GDC | methylation__HM450 |
| TCGA-AR-A24Z-01A-11D-A16A-05 | Illumina Human Methylation 450 | (TODO) -- GDC | methylation__HM450 |
| TCGA-AR-A250-01A-31D-A16A-05 | Illumina Human Methylation 450 | (TODO) -- GDC | methylation__HM450 |
| TCGA-AR-A251-01A-12D-A16A-05 | Illumina Human Methylation 450 | (TODO) -- GDC | methylation__HM450 |
| TCGA-AR-A252-01A-11D-A16A-05 | Illumina Human Methylation 450 | (TODO) -- GDC | methylation__HM450 |
| TCGA-AR-A254-01A-21D-A16A-05 | Illumina Human Methylation 450 | (TODO) -- GDC | methylation__HM450 |
| TCGA-AR-A255-01A-11D-A16A-05 | Illumina Human Methylation 450 | (TODO) -- GDC | methylation__HM450 |
| TCGA-AR-A256-01A-11D-A16A-05 | Illumina Human Methylation 450 | (TODO) -- GDC | methylation__HM450 |
| TCGA-AR-A2LE-01A-11D-A17Z-05 | Illumina Human Methylation 450 | (TODO) -- GDC | methylation__HM450 |
| TCGA-AR-A2LH-01A-31D-A18O-05 | Illumina Human Methylation 450 | (TODO) -- GDC | methylation__HM450 |
| TCGA-AR-A2LJ-01A-12D-A19Z-05 | Illumina Human Methylation 450 | (TODO) -- GDC | methylation__HM450 |
| TCGA-AR-A2LK-01A-11D-A17Z-05 | Illumina Human Methylation 450 | (TODO) -- GDC | methylation__HM450 |
| TCGA-AR-A2LL-01A-11D-A17Z-05 | Illumina Human Methylation 450 | (TODO) -- GDC | methylation__HM450 |
| TCGA-AR-A2LM-01A-11D-A17Z-05 | Illumina Human Methylation 450 | (TODO) -- GDC | methylation__HM450 |
| TCGA-AR-A2LN-01A-21D-A18O-05 | Illumina Human Methylation 450 | (TODO) -- GDC | methylation__HM450 |
| TCGA-AR-A2LO-01A-31D-A18O-05 | Illumina Human Methylation 450 | (TODO) -- GDC | methylation__HM450 |
| TCGA-AR-A2LQ-01A-22D-A18O-05 | Illumina Human Methylation 450 | (TODO) -- GDC | methylation__HM450 |
| TCGA-AR-A2LR-01A-12D-A18O-05 | Illumina Human Methylation 450 | (TODO) -- GDC | methylation__HM450 |
| TCGA-AR-A5QM-01A-11D-A27Y-05 | Illumina Human Methylation 450 | (TODO) -- GDC | methylation__HM450 |
| TCGA-AR-A5QN-01A-12D-A28C-05 | Illumina Human Methylation 450 | (TODO) -- GDC | methylation__HM450 |
| TCGA-AR-A5QP-01A-11D-A28C-05 | Illumina Human Methylation 450 | (TODO) -- GDC | methylation__HM450 |
| TCGA-AR-A5QQ-01A-11D-A28C-05 | Illumina Human Methylation 450 | (TODO) -- GDC | methylation__HM450 |
| TCGA-B6-A0I1-01A-11D-A21R-05 | Illumina Human Methylation 450 | (TODO) -- GDC | methylation__HM450 |
| TCGA-B6-A0I2-01A-11D-A032-05 | Illumina Human Methylation 27 | (TODO) -- GDC | methylation__HM27 |
| TCGA-B6-A0I5-01A-11D-A032-05 | Illumina Human Methylation 27 | (TODO) -- GDC | methylation__HM27 |
| TCGA-B6-A0I6-01A-11D-A032-05 | Illumina Human Methylation 27 | (TODO) -- GDC | methylation__HM27 |
| TCGA-B6-A0I8-01A-11D-A032-05 | Illumina Human Methylation 27 | (TODO) -- GDC | methylation__HM27 |
| TCGA-B6-A0I9-01A-11D-A032-05 | Illumina Human Methylation 27 | (TODO) -- GDC | methylation__HM27 |
| TCGA-B6-A0IA-01A-11D-A032-05 | Illumina Human Methylation 27 | (TODO) -- GDC | methylation__HM27 |
| TCGA-B6-A0IB-01A-11D-A032-05 | Illumina Human Methylation 27 | (TODO) -- GDC | methylation__HM27 |
| TCGA-B6-A0IC-01A-11D-A032-05 | Illumina Human Methylation 27 | (TODO) -- GDC | methylation__HM27 |
| TCGA-B6-A0IE-01A-11D-A032-05 | Illumina Human Methylation 27 | (TODO) -- GDC | methylation__HM27 |
| TCGA-B6-A0IG-01A-11D-A032-05 | Illumina Human Methylation 27 | (TODO) -- GDC | methylation__HM27 |
| TCGA-B6-A0IH-01A-11D-A112-05 | Illumina Human Methylation 27 | (TODO) -- GDC | methylation__HM27 |
| TCGA-B6-A0IJ-01A-11D-A032-05 | Illumina Human Methylation 27 | (TODO) -- GDC | methylation__HM27 |
| TCGA-B6-A0IK-01A-12D-A10P-05 | Illumina Human Methylation 450 | (TODO) -- GDC | methylation__HM450 |
| TCGA-B6-A0IM-01A-11D-A032-05 | Illumina Human Methylation 27 | (TODO) -- GDC | methylation__HM27 |
| TCGA-B6-A0IN-01A-11D-A032-05 | Illumina Human Methylation 27 | (TODO) -- GDC | methylation__HM27 |
| TCGA-B6-A0IO-01A-11D-A032-05 | Illumina Human Methylation 27 | (TODO) -- GDC | methylation__HM27 |
| TCGA-B6-A0IP-01A-11D-A032-05 | Illumina Human Methylation 27 | (TODO) -- GDC | methylation__HM27 |
| TCGA-B6-A0IQ-01A-11D-A032-05 | Illumina Human Methylation 27 | (TODO) -- GDC | methylation__HM27 |
| TCGA-B6-A0RE-01A-11D-A10P-05 | Illumina Human Methylation 450 | (TODO) -- GDC | methylation__HM450 |
| TCGA-B6-A0RG-01A-11D-A10P-05 | Illumina Human Methylation 450 | (TODO) -- GDC | methylation__HM450 |
| TCGA-B6-A0RH-01A-21D-A112-05 | Illumina Human Methylation 27 | (TODO) -- GDC | methylation__HM27 |
| TCGA-B6-A0RI-01A-11D-A10P-05 | Illumina Human Methylation 450 | (TODO) -- GDC | methylation__HM450 |
| TCGA-B6-A0RL-01A-11D-A10P-05 | Illumina Human Methylation 450 | (TODO) -- GDC | methylation__HM450 |
| TCGA-B6-A0RM-01A-11D-A10P-05 | Illumina Human Methylation 450 | (TODO) -- GDC | methylation__HM450 |
| TCGA-B6-A0RN-01A-12D-A10P-05 | Illumina Human Methylation 450 | (TODO) -- GDC | methylation__HM450 |
| TCGA-B6-A0RO-01A-22D-A10P-05 | Illumina Human Methylation 450 | (TODO) -- GDC | methylation__HM450 |
| TCGA-B6-A0RP-01A-21D-A10P-05 | Illumina Human Methylation 450 | (TODO) -- GDC | methylation__HM450 |
| TCGA-B6-A0RQ-01A-11D-A112-05 | Illumina Human Methylation 27 | (TODO) -- GDC | methylation__HM27 |
| TCGA-B6-A0RS-01A-11D-A10P-05 | Illumina Human Methylation 450 | (TODO) -- GDC | methylation__HM450 |
| TCGA-B6-A0RT-01A-21D-A10P-05 | Illumina Human Methylation 450 | (TODO) -- GDC | methylation__HM450 |
| TCGA-B6-A0RU-01A-11D-A10P-05 | Illumina Human Methylation 450 | (TODO) -- GDC | methylation__HM450 |
| TCGA-B6-A0RV-01A-11D-A10P-05 | Illumina Human Methylation 450 | (TODO) -- GDC | methylation__HM450 |
| TCGA-B6-A0WS-01A-11D-A112-05 | Illumina Human Methylation 27 | (TODO) -- GDC | methylation__HM27 |
| TCGA-B6-A0WT-01A-11D-A10A-05 | Illumina Human Methylation 450 | (TODO) -- GDC | methylation__HM450 |
| TCGA-B6-A0WV-01A-11D-A10A-05 | Illumina Human Methylation 450 | (TODO) -- GDC | methylation__HM450 |
| TCGA-B6-A0WW-01A-11D-A10A-05 | Illumina Human Methylation 450 | (TODO) -- GDC | methylation__HM450 |
| TCGA-B6-A0WX-01A-11D-A10A-05 | Illumina Human Methylation 450 | (TODO) -- GDC | methylation__HM450 |
| TCGA-B6-A0WY-01A-11D-A10A-05 | Illumina Human Methylation 450 | (TODO) -- GDC | methylation__HM450 |
| TCGA-B6-A0WZ-01A-11D-A10A-05 | Illumina Human Methylation 450 | (TODO) -- GDC | methylation__HM450 |
| TCGA-B6-A0X0-01A-21D-A112-05 | Illumina Human Methylation 27 | (TODO) -- GDC | methylation__HM27 |
| TCGA-B6-A0X1-01A-11D-A10A-05 | Illumina Human Methylation 450 | (TODO) -- GDC | methylation__HM450 |
| TCGA-B6-A0X4-01A-11D-A10A-05 | Illumina Human Methylation 450 | (TODO) -- GDC | methylation__HM450 |
| TCGA-B6-A0X5-01A-21D-A10A-05 | Illumina Human Methylation 450 | (TODO) -- GDC | methylation__HM450 |
| TCGA-B6-A0X7-01A-11D-A10N-05 | Illumina Human Methylation 450 | (TODO) -- GDC | methylation__HM450 |
| TCGA-B6-A1KC-01A-11D-A13K-05 | Illumina Human Methylation 450 | (TODO) -- GDC | methylation__HM450 |
| TCGA-B6-A1KC-01B-11D-A161-05 | Illumina Human Methylation 450 | (TODO) -- GDC | methylation__HM450 |
| TCGA-B6-A1KF-01A-11D-A13K-05 | Illumina Human Methylation 450 | (TODO) -- GDC | methylation__HM450 |
| TCGA-B6-A1KI-01A-11D-A14N-05 | Illumina Human Methylation 450 | (TODO) -- GDC | methylation__HM450 |
| TCGA-B6-A1KN-01A-11D-A13K-05 | Illumina Human Methylation 450 | (TODO) -- GDC | methylation__HM450 |
| TCGA-B6-A2IU-01A-32D-A18O-05 | Illumina Human Methylation 450 | (TODO) -- GDC | methylation__HM450 |
| TCGA-B6-A3ZX-01A-11D-A23D-05 | Illumina Human Methylation 450 | (TODO) -- GDC | methylation__HM450 |
| TCGA-B6-A400-01A-11D-A23D-05 | Illumina Human Methylation 450 | (TODO) -- GDC | methylation__HM450 |
| TCGA-B6-A401-01A-11D-A23D-05 | Illumina Human Methylation 450 | (TODO) -- GDC | methylation__HM450 |
| TCGA-B6-A402-01A-11D-A23D-05 | Illumina Human Methylation 450 | (TODO) -- GDC | methylation__HM450 |
| TCGA-B6-A408-01A-12D-A244-05 | Illumina Human Methylation 450 | (TODO) -- GDC | methylation__HM450 |
| TCGA-B6-A409-01A-11D-A244-05 | Illumina Human Methylation 450 | (TODO) -- GDC | methylation__HM450 |
| TCGA-B6-A40B-01A-11D-A23D-05 | Illumina Human Methylation 450 | (TODO) -- GDC | methylation__HM450 |
| TCGA-B6-A40C-01A-11D-A23D-05 | Illumina Human Methylation 450 | (TODO) -- GDC | methylation__HM450 |
| TCGA-BH-A0AU-01A-11D-A12R-05 | Illumina Human Methylation 450 | (TODO) -- GDC | methylation__HM450 |
| TCGA-BH-A0AV-01A-31D-A112-05 | Illumina Human Methylation 27 | (TODO) -- GDC | methylation__HM27 |
| TCGA-BH-A0AW-01A-11D-A10P-05 | Illumina Human Methylation 450 | (TODO) -- GDC | methylation__HM450 |
| TCGA-BH-A0AY-01A-21D-A00Y-05 | Illumina Human Methylation 27 | (TODO) -- GDC | methylation__HM27 |
| TCGA-BH-A0AZ-01A-21D-A12R-05 | Illumina Human Methylation 450 | (TODO) -- GDC | methylation__HM450 |
| TCGA-BH-A0B0-01A-21D-A112-05 | Illumina Human Methylation 27 | (TODO) -- GDC | methylation__HM27 |
| TCGA-BH-A0B3-01A-11D-A10P-05 | Illumina Human Methylation 450 | (TODO) -- GDC | methylation__HM450 |
| TCGA-BH-A0B4-01A-11D-A00Y-05 | Illumina Human Methylation 27 | (TODO) -- GDC | methylation__HM27 |
| TCGA-BH-A0B5-01A-11D-A12R-05 | Illumina Human Methylation 450 | (TODO) -- GDC | methylation__HM450 |
| TCGA-BH-A0B6-01A-11D-A19Z-05 | Illumina Human Methylation 450 | (TODO) -- GDC | methylation__HM450 |
| TCGA-BH-A0B7-01A-12D-A112-05 | Illumina Human Methylation 27 | (TODO) -- GDC | methylation__HM27 |
| TCGA-BH-A0B8-01A-21D-A10P-05 | Illumina Human Methylation 450 | (TODO) -- GDC | methylation__HM450 |
| TCGA-BH-A0B9-01A-11D-A10P-05 | Illumina Human Methylation 450 | (TODO) -- GDC | methylation__HM450 |
| TCGA-BH-A0BA-01A-11D-A10P-05 | Illumina Human Methylation 450 | (TODO) -- GDC | methylation__HM450 |
| TCGA-BH-A0BC-01A-22D-A10P-05 | Illumina Human Methylation 450 | (TODO) -- GDC | methylation__HM450 |
| TCGA-BH-A0BD-01A-11D-A032-05 | Illumina Human Methylation 27 | (TODO) -- GDC | methylation__HM27 |
| TCGA-BH-A0BF-01A-21D-A12R-05 | Illumina Human Methylation 450 | (TODO) -- GDC | methylation__HM450 |
| TCGA-BH-A0BG-01A-11D-A112-05 | Illumina Human Methylation 27 | (TODO) -- GDC | methylation__HM27 |
| TCGA-BH-A0BJ-01A-11D-A10P-05 | Illumina Human Methylation 450 | (TODO) -- GDC | methylation__HM450 |
| TCGA-BH-A0BL-01A-11D-A112-05 | Illumina Human Methylation 27 | (TODO) -- GDC | methylation__HM27 |
| TCGA-BH-A0BM-01A-11D-A10P-05 | Illumina Human Methylation 450 | (TODO) -- GDC | methylation__HM450 |
| TCGA-BH-A0BO-01A-23D-A12E-05 | Illumina Human Methylation 27 | (TODO) -- GDC | methylation__HM27 |
| TCGA-BH-A0BP-01A-11D-A112-05 | Illumina Human Methylation 27 | (TODO) -- GDC | methylation__HM27 |
| TCGA-BH-A0BQ-01A-21D-A112-05 | Illumina Human Methylation 27 | (TODO) -- GDC | methylation__HM27 |
| TCGA-BH-A0BR-01A-21D-A112-05 | Illumina Human Methylation 27 | (TODO) -- GDC | methylation__HM27 |
| TCGA-BH-A0BS-01A-11D-A12R-05 | Illumina Human Methylation 450 | (TODO) -- GDC | methylation__HM450 |
| TCGA-BH-A0BT-01A-11D-A12R-05 | Illumina Human Methylation 450 | (TODO) -- GDC | methylation__HM450 |
| TCGA-BH-A0BV-01A-11D-A00Y-05 | Illumina Human Methylation 27 | (TODO) -- GDC | methylation__HM27 |
| TCGA-BH-A0BW-01A-11D-A112-05 | Illumina Human Methylation 27 | (TODO) -- GDC | methylation__HM27 |
| TCGA-BH-A0BZ-01A-31D-A12R-05 | Illumina Human Methylation 450 | (TODO) -- GDC | methylation__HM450 |
| TCGA-BH-A0C0-01A-21D-A10P-05 | Illumina Human Methylation 450 | (TODO) -- GDC | methylation__HM450 |
| TCGA-BH-A0C1-01B-11D-A12E-05 | Illumina Human Methylation 27 | (TODO) -- GDC | methylation__HM27 |
| TCGA-BH-A0C3-01A-21D-A12R-05 | Illumina Human Methylation 450 | (TODO) -- GDC | methylation__HM450 |
| TCGA-BH-A0C7-01B-11D-A112-05 | Illumina Human Methylation 27 | (TODO) -- GDC | methylation__HM27 |
| TCGA-BH-A0DD-01A-31D-A12R-05 | Illumina Human Methylation 450 | (TODO) -- GDC | methylation__HM450 |
| TCGA-BH-A0DE-01A-11D-A112-05 | Illumina Human Methylation 27 | (TODO) -- GDC | methylation__HM27 |
| TCGA-BH-A0DG-01A-21D-A12R-05 | Illumina Human Methylation 450 | (TODO) -- GDC | methylation__HM450 |
| TCGA-BH-A0DH-01A-11D-A10P-05 | Illumina Human Methylation 450 | (TODO) -- GDC | methylation__HM450 |
| TCGA-BH-A0DI-01A-21D-A12R-05 | Illumina Human Methylation 450 | (TODO) -- GDC | methylation__HM450 |
| TCGA-BH-A0DK-01A-21D-A10P-05 | Illumina Human Methylation 450 | (TODO) -- GDC | methylation__HM450 |
| TCGA-BH-A0DL-01A-11D-A112-05 | Illumina Human Methylation 27 | (TODO) -- GDC | methylation__HM27 |
| TCGA-BH-A0DO-01B-11D-A12E-05 | Illumina Human Methylation 27 | (TODO) -- GDC | methylation__HM27 |
| TCGA-BH-A0DP-01A-21D-A10P-05 | Illumina Human Methylation 450 | (TODO) -- GDC | methylation__HM450 |
| TCGA-BH-A0DQ-01A-11D-A10P-05 | Illumina Human Methylation 450 | (TODO) -- GDC | methylation__HM450 |
| TCGA-BH-A0DS-01A-11D-A10P-05 | Illumina Human Methylation 450 | (TODO) -- GDC | methylation__HM450 |
| TCGA-BH-A0DT-01A-21D-A12E-05 | Illumina Human Methylation 27 | (TODO) -- GDC | methylation__HM27 |
| TCGA-BH-A0DV-01A-21D-A12R-05 | Illumina Human Methylation 450 | (TODO) -- GDC | methylation__HM450 |
| TCGA-BH-A0DX-01A-11D-A112-05 | Illumina Human Methylation 27 | (TODO) -- GDC | methylation__HM27 |
| TCGA-BH-A0DZ-01A-11D-A00Y-05 | Illumina Human Methylation 27 | (TODO) -- GDC | methylation__HM27 |
| TCGA-BH-A0E0-01A-11D-A10P-05 | Illumina Human Methylation 450 | (TODO) -- GDC | methylation__HM450 |
| TCGA-BH-A0E1-01A-11D-A10P-05 | Illumina Human Methylation 450 | (TODO) -- GDC | methylation__HM450 |
| TCGA-BH-A0E2-01A-11D-A10P-05 | Illumina Human Methylation 450 | (TODO) -- GDC | methylation__HM450 |
| TCGA-BH-A0E6-01A-11D-A032-05 | Illumina Human Methylation 27 | (TODO) -- GDC | methylation__HM27 |
| TCGA-BH-A0E7-01A-11D-A032-05 | Illumina Human Methylation 27 | (TODO) -- GDC | methylation__HM27 |
| TCGA-BH-A0E9-01B-11D-A112-05 | Illumina Human Methylation 27 | (TODO) -- GDC | methylation__HM27 |
| TCGA-BH-A0EA-01A-11D-A112-05 | Illumina Human Methylation 27 | (TODO) -- GDC | methylation__HM27 |
| TCGA-BH-A0EB-01A-11D-A032-05 | Illumina Human Methylation 27 | (TODO) -- GDC | methylation__HM27 |
| TCGA-BH-A0EE-01A-11D-A032-05 | Illumina Human Methylation 27 | (TODO) -- GDC | methylation__HM27 |
| TCGA-BH-A0EI-01A-11D-A112-05 | Illumina Human Methylation 27 | (TODO) -- GDC | methylation__HM27 |
| TCGA-BH-A0GY-01A-11D-A10P-05 | Illumina Human Methylation 450 | (TODO) -- GDC | methylation__HM450 |
| TCGA-BH-A0GZ-01A-11D-A10P-05 | Illumina Human Methylation 450 | (TODO) -- GDC | methylation__HM450 |
| TCGA-BH-A0H0-01A-11D-A10P-05 | Illumina Human Methylation 450 | (TODO) -- GDC | methylation__HM450 |
| TCGA-BH-A0H3-01A-11D-A12R-05 | Illumina Human Methylation 450 | (TODO) -- GDC | methylation__HM450 |
| TCGA-BH-A0H5-01A-21D-A112-05 | Illumina Human Methylation 27 | (TODO) -- GDC | methylation__HM27 |
| TCGA-BH-A0H6-01A-21D-A10P-05 | Illumina Human Methylation 450 | (TODO) -- GDC | methylation__HM450 |
| TCGA-BH-A0H7-01A-13D-A10P-05 | Illumina Human Methylation 450 | (TODO) -- GDC | methylation__HM450 |
| TCGA-BH-A0H9-01A-11D-A10P-05 | Illumina Human Methylation 450 | (TODO) -- GDC | methylation__HM450 |
| TCGA-BH-A0HA-01A-11D-A12R-05 | Illumina Human Methylation 450 | (TODO) -- GDC | methylation__HM450 |
| TCGA-BH-A0HB-01A-11D-A10P-05 | Illumina Human Methylation 450 | (TODO) -- GDC | methylation__HM450 |
| TCGA-BH-A0HF-01A-11D-A10P-05 | Illumina Human Methylation 450 | (TODO) -- GDC | methylation__HM450 |
| TCGA-BH-A0HI-01A-11D-A10P-05 | Illumina Human Methylation 450 | (TODO) -- GDC | methylation__HM450 |
| TCGA-BH-A0HK-01A-11D-A10P-05 | Illumina Human Methylation 450 | (TODO) -- GDC | methylation__HM450 |
| TCGA-BH-A0HL-01A-11D-A032-05 | Illumina Human Methylation 27 | (TODO) -- GDC | methylation__HM27 |
| TCGA-BH-A0HN-01A-11D-A10P-05 | Illumina Human Methylation 450 | (TODO) -- GDC | methylation__HM450 |
| TCGA-BH-A0HO-01A-11D-A032-05 | Illumina Human Methylation 27 | (TODO) -- GDC | methylation__HM27 |
| TCGA-BH-A0HP-01A-12D-A10P-05 | Illumina Human Methylation 450 | (TODO) -- GDC | methylation__HM450 |
| TCGA-BH-A0HQ-01A-11D-A032-05 | Illumina Human Methylation 27 | (TODO) -- GDC | methylation__HM27 |
| TCGA-BH-A0HU-01A-11D-A032-05 | Illumina Human Methylation 27 | (TODO) -- GDC | methylation__HM27 |
| TCGA-BH-A0HW-01A-11D-A032-05 | Illumina Human Methylation 27 | (TODO) -- GDC | methylation__HM27 |
| TCGA-BH-A0HX-01A-21D-A10P-05 | Illumina Human Methylation 450 | (TODO) -- GDC | methylation__HM450 |
| TCGA-BH-A0HY-01A-11D-A10P-05 | Illumina Human Methylation 450 | (TODO) -- GDC | methylation__HM450 |
| TCGA-BH-A0RX-01A-21D-A10P-05 | Illumina Human Methylation 450 | (TODO) -- GDC | methylation__HM450 |
| TCGA-BH-A0W3-01A-11D-A10A-05 | Illumina Human Methylation 450 | (TODO) -- GDC | methylation__HM450 |
| TCGA-BH-A0W4-01A-11D-A10A-05 | Illumina Human Methylation 450 | (TODO) -- GDC | methylation__HM450 |
| TCGA-BH-A0W5-01A-11D-A10A-05 | Illumina Human Methylation 450 | (TODO) -- GDC | methylation__HM450 |
| TCGA-BH-A0W7-01A-11D-A112-05 | Illumina Human Methylation 27 | (TODO) -- GDC | methylation__HM27 |
| TCGA-BH-A0WA-01A-11D-A10A-05 | Illumina Human Methylation 450 | (TODO) -- GDC | methylation__HM450 |
| TCGA-BH-A18F-01A-11D-A12E-05 | Illumina Human Methylation 27 | (TODO) -- GDC | methylation__HM27 |
| TCGA-BH-A18G-01A-11D-A12E-05 | Illumina Human Methylation 27 | (TODO) -- GDC | methylation__HM27 |
| TCGA-BH-A18H-01A-11D-A12E-05 | Illumina Human Methylation 27 | (TODO) -- GDC | methylation__HM27 |
| TCGA-BH-A18I-01A-11D-A12E-05 | Illumina Human Methylation 27 | (TODO) -- GDC | methylation__HM27 |
| TCGA-BH-A18J-01A-11D-A12E-05 | Illumina Human Methylation 27 | (TODO) -- GDC | methylation__HM27 |
| TCGA-BH-A18K-01A-11D-A12E-05 | Illumina Human Methylation 27 | (TODO) -- GDC | methylation__HM27 |
| TCGA-BH-A18L-01A-32D-A12E-05 | Illumina Human Methylation 27 | (TODO) -- GDC | methylation__HM27 |
| TCGA-BH-A18M-01A-11D-A12E-05 | Illumina Human Methylation 27 | (TODO) -- GDC | methylation__HM27 |
| TCGA-BH-A18N-01A-11D-A12E-05 | Illumina Human Methylation 27 | (TODO) -- GDC | methylation__HM27 |
| TCGA-BH-A18P-01A-11D-A12E-05 | Illumina Human Methylation 27 | (TODO) -- GDC | methylation__HM27 |
| TCGA-BH-A18Q-01A-12D-A12E-05 | Illumina Human Methylation 27 | (TODO) -- GDC | methylation__HM27 |
| TCGA-BH-A18R-01A-11D-A12E-05 | Illumina Human Methylation 27 | (TODO) -- GDC | methylation__HM27 |
| TCGA-BH-A18S-01A-11D-A12E-05 | Illumina Human Methylation 27 | (TODO) -- GDC | methylation__HM27 |
| TCGA-BH-A18T-01A-11D-A12E-05 | Illumina Human Methylation 27 | (TODO) -- GDC | methylation__HM27 |
| TCGA-BH-A18U-01A-21D-A12E-05 | Illumina Human Methylation 27 | (TODO) -- GDC | methylation__HM27 |
| TCGA-BH-A18V-01A-11D-A12E-05 | Illumina Human Methylation 27 | (TODO) -- GDC | methylation__HM27 |
| TCGA-BH-A1EN-01A-11D-A13K-05 | Illumina Human Methylation 450 | (TODO) -- GDC | methylation__HM450 |
| TCGA-BH-A1EO-01A-11D-A138-05 | Illumina Human Methylation 450 | (TODO) -- GDC | methylation__HM450 |
| TCGA-BH-A1ES-01A-11D-A138-05 | Illumina Human Methylation 450 | (TODO) -- GDC | methylation__HM450 |
| TCGA-BH-A1ET-01A-11D-A138-05 | Illumina Human Methylation 450 | (TODO) -- GDC | methylation__HM450 |
| TCGA-BH-A1EU-01A-11D-A138-05 | Illumina Human Methylation 450 | (TODO) -- GDC | methylation__HM450 |
| TCGA-BH-A1EV-01A-11D-A138-05 | Illumina Human Methylation 450 | (TODO) -- GDC | methylation__HM450 |
| TCGA-BH-A1EW-01A-11D-A138-05 | Illumina Human Methylation 450 | (TODO) -- GDC | methylation__HM450 |
| TCGA-BH-A1EX-01A-11D-A13K-05 | Illumina Human Methylation 450 | (TODO) -- GDC | methylation__HM450 |
| TCGA-BH-A1EY-01A-11D-A13K-05 | Illumina Human Methylation 450 | (TODO) -- GDC | methylation__HM450 |
| TCGA-BH-A1F0-01A-11D-A138-05 | Illumina Human Methylation 450 | (TODO) -- GDC | methylation__HM450 |
| TCGA-BH-A1F2-01A-31D-A13K-05 | Illumina Human Methylation 450 | (TODO) -- GDC | methylation__HM450 |
| TCGA-BH-A1F5-01A-12D-A13K-05 | Illumina Human Methylation 450 | (TODO) -- GDC | methylation__HM450 |
| TCGA-BH-A1F6-01A-11D-A13K-05 | Illumina Human Methylation 450 | (TODO) -- GDC | methylation__HM450 |
| TCGA-BH-A1F8-01A-11D-A13K-05 | Illumina Human Methylation 450 | (TODO) -- GDC | methylation__HM450 |
| TCGA-BH-A1FB-01A-11D-A13K-05 | Illumina Human Methylation 450 | (TODO) -- GDC | methylation__HM450 |
| TCGA-BH-A1FC-01A-11D-A13K-05 | Illumina Human Methylation 450 | (TODO) -- GDC | methylation__HM450 |
| TCGA-BH-A1FD-01A-11D-A13K-05 | Illumina Human Methylation 450 | (TODO) -- GDC | methylation__HM450 |
| TCGA-BH-A1FE-01A-11D-A13K-05 | Illumina Human Methylation 450 | (TODO) -- GDC | methylation__HM450 |
| TCGA-BH-A1FG-01A-11D-A13K-05 | Illumina Human Methylation 450 | (TODO) -- GDC | methylation__HM450 |
| TCGA-BH-A1FH-01A-12D-A13K-05 | Illumina Human Methylation 450 | (TODO) -- GDC | methylation__HM450 |
| TCGA-BH-A1FJ-01A-11D-A13K-05 | Illumina Human Methylation 450 | (TODO) -- GDC | methylation__HM450 |
| TCGA-BH-A1FL-01A-11D-A13K-05 | Illumina Human Methylation 450 | (TODO) -- GDC | methylation__HM450 |
| TCGA-BH-A1FM-01A-11D-A13K-05 | Illumina Human Methylation 450 | (TODO) -- GDC | methylation__HM450 |
| TCGA-BH-A1FN-01A-11D-A13K-05 | Illumina Human Methylation 450 | (TODO) -- GDC | methylation__HM450 |
| TCGA-BH-A1FR-01A-11D-A13K-05 | Illumina Human Methylation 450 | (TODO) -- GDC | methylation__HM450 |
| TCGA-BH-A1FU-01A-11D-A14H-05 | Illumina Human Methylation 450 | (TODO) -- GDC | methylation__HM450 |
| TCGA-BH-A201-01A-11D-A14N-05 | Illumina Human Methylation 450 | (TODO) -- GDC | methylation__HM450 |
| TCGA-BH-A202-01A-11D-A14N-05 | Illumina Human Methylation 450 | (TODO) -- GDC | methylation__HM450 |
| TCGA-BH-A203-01A-12D-A16A-05 | Illumina Human Methylation 450 | (TODO) -- GDC | methylation__HM450 |
| TCGA-BH-A204-01A-11D-A161-05 | Illumina Human Methylation 450 | (TODO) -- GDC | methylation__HM450 |
| TCGA-BH-A208-01A-11D-A161-05 | Illumina Human Methylation 450 | (TODO) -- GDC | methylation__HM450 |
| TCGA-BH-A209-01A-11D-A161-05 | Illumina Human Methylation 450 | (TODO) -- GDC | methylation__HM450 |
| TCGA-BH-A28O-01A-11D-A22B-05 | Illumina Human Methylation 450 | (TODO) -- GDC | methylation__HM450 |
| TCGA-BH-A28Q-01A-11D-A16G-05 | Illumina Human Methylation 450 | (TODO) -- GDC | methylation__HM450 |
| TCGA-BH-A2L8-01A-11D-A18O-05 | Illumina Human Methylation 450 | (TODO) -- GDC | methylation__HM450 |
| TCGA-BH-A42T-01A-11D-A244-05 | Illumina Human Methylation 450 | (TODO) -- GDC | methylation__HM450 |
| TCGA-BH-A42U-01A-12D-A244-05 | Illumina Human Methylation 450 | (TODO) -- GDC | methylation__HM450 |
| TCGA-BH-A42V-01A-11D-A244-05 | Illumina Human Methylation 450 | (TODO) -- GDC | methylation__HM450 |
| TCGA-BH-A5IZ-01A-11D-A27Y-05 | Illumina Human Methylation 450 | (TODO) -- GDC | methylation__HM450 |
| TCGA-BH-A5J0-01A-11D-A27Y-05 | Illumina Human Methylation 450 | (TODO) -- GDC | methylation__HM450 |
| TCGA-BH-A6R8-01A-21D-A33F-05 | Illumina Human Methylation 450 | (TODO) -- GDC | methylation__HM450 |
| TCGA-BH-A6R9-01A-21D-A32T-05 | Illumina Human Methylation 450 | (TODO) -- GDC | methylation__HM450 |
| TCGA-BH-A8FY-01A-11D-A36K-05 | Illumina Human Methylation 450 | (TODO) -- GDC | methylation__HM450 |
| TCGA-BH-A8FZ-01A-11D-A357-05 | Illumina Human Methylation 450 | (TODO) -- GDC | methylation__HM450 |
| TCGA-BH-A8G0-01A-11D-A357-05 | Illumina Human Methylation 450 | (TODO) -- GDC | methylation__HM450 |
| TCGA-BH-AB28-01A-31D-A41Q-05 | Illumina Human Methylation 450 | (TODO) -- GDC | methylation__HM450 |
| TCGA-C8-A12K-01A-21D-A112-05 | Illumina Human Methylation 27 | (TODO) -- GDC | methylation__HM27 |
| TCGA-C8-A12L-01A-11D-A112-05 | Illumina Human Methylation 27 | (TODO) -- GDC | methylation__HM27 |
| TCGA-C8-A12M-01A-11D-A112-05 | Illumina Human Methylation 27 | (TODO) -- GDC | methylation__HM27 |
| TCGA-C8-A12N-01A-11D-A112-05 | Illumina Human Methylation 27 | (TODO) -- GDC | methylation__HM27 |
| TCGA-C8-A12O-01A-11D-A112-05 | Illumina Human Methylation 27 | (TODO) -- GDC | methylation__HM27 |
| TCGA-C8-A12P-01A-11D-A112-05 | Illumina Human Methylation 27 | (TODO) -- GDC | methylation__HM27 |
| TCGA-C8-A12Q-01A-11D-A112-05 | Illumina Human Methylation 27 | (TODO) -- GDC | methylation__HM27 |
| TCGA-C8-A12T-01A-11D-A112-05 | Illumina Human Methylation 27 | (TODO) -- GDC | methylation__HM27 |
| TCGA-C8-A12U-01A-11D-A112-05 | Illumina Human Methylation 27 | (TODO) -- GDC | methylation__HM27 |
| TCGA-C8-A12V-01A-11D-A112-05 | Illumina Human Methylation 27 | (TODO) -- GDC | methylation__HM27 |
| TCGA-C8-A12W-01A-11D-A112-05 | Illumina Human Methylation 27 | (TODO) -- GDC | methylation__HM27 |
| TCGA-C8-A12X-01A-11D-A112-05 | Illumina Human Methylation 27 | (TODO) -- GDC | methylation__HM27 |
| TCGA-C8-A12Y-01A-11D-A12E-05 | Illumina Human Methylation 27 | (TODO) -- GDC | methylation__HM27 |
| TCGA-C8-A12Z-01A-11D-A112-05 | Illumina Human Methylation 27 | (TODO) -- GDC | methylation__HM27 |
| TCGA-C8-A130-01A-31D-A112-05 | Illumina Human Methylation 27 | (TODO) -- GDC | methylation__HM27 |
| TCGA-C8-A131-01A-11D-A112-05 | Illumina Human Methylation 27 | (TODO) -- GDC | methylation__HM27 |
| TCGA-C8-A132-01A-31D-A112-05 | Illumina Human Methylation 27 | (TODO) -- GDC | methylation__HM27 |
| TCGA-C8-A133-01A-32D-A12E-05 | Illumina Human Methylation 27 | (TODO) -- GDC | methylation__HM27 |
| TCGA-C8-A134-01A-11D-A112-05 | Illumina Human Methylation 27 | (TODO) -- GDC | methylation__HM27 |
| TCGA-C8-A135-01A-11D-A112-05 | Illumina Human Methylation 27 | (TODO) -- GDC | methylation__HM27 |
| TCGA-C8-A137-01A-11D-A112-05 | Illumina Human Methylation 27 | (TODO) -- GDC | methylation__HM27 |
| TCGA-C8-A138-01A-11D-A112-05 | Illumina Human Methylation 27 | (TODO) -- GDC | methylation__HM27 |
| TCGA-C8-A1HE-01A-11D-A13K-05 | Illumina Human Methylation 450 | (TODO) -- GDC | methylation__HM450 |
| TCGA-C8-A1HF-01A-11D-A138-05 | Illumina Human Methylation 450 | (TODO) -- GDC | methylation__HM450 |
| TCGA-C8-A1HG-01A-11D-A138-05 | Illumina Human Methylation 450 | (TODO) -- GDC | methylation__HM450 |
| TCGA-C8-A1HI-01A-11D-A138-05 | Illumina Human Methylation 450 | (TODO) -- GDC | methylation__HM450 |
| TCGA-C8-A1HJ-01A-11D-A13K-05 | Illumina Human Methylation 450 | (TODO) -- GDC | methylation__HM450 |
| TCGA-C8-A1HK-01A-21D-A13K-05 | Illumina Human Methylation 450 | (TODO) -- GDC | methylation__HM450 |
| TCGA-C8-A1HL-01A-11D-A138-05 | Illumina Human Methylation 450 | (TODO) -- GDC | methylation__HM450 |
| TCGA-C8-A1HM-01A-12D-A138-05 | Illumina Human Methylation 450 | (TODO) -- GDC | methylation__HM450 |
| TCGA-C8-A1HN-01A-11D-A138-05 | Illumina Human Methylation 450 | (TODO) -- GDC | methylation__HM450 |
| TCGA-C8-A1HO-01A-11D-A13K-05 | Illumina Human Methylation 450 | (TODO) -- GDC | methylation__HM450 |
| TCGA-C8-A26V-01A-11D-A16G-05 | Illumina Human Methylation 450 | (TODO) -- GDC | methylation__HM450 |
| TCGA-C8-A26W-01A-11D-A16G-05 | Illumina Human Methylation 450 | (TODO) -- GDC | methylation__HM450 |
| TCGA-C8-A26X-01A-31D-A16G-05 | Illumina Human Methylation 450 | (TODO) -- GDC | methylation__HM450 |
| TCGA-C8-A26Y-01A-11D-A16G-05 | Illumina Human Methylation 450 | (TODO) -- GDC | methylation__HM450 |
| TCGA-C8-A26Z-01A-11D-A16G-05 | Illumina Human Methylation 450 | (TODO) -- GDC | methylation__HM450 |
| TCGA-C8-A273-01A-11D-A16G-05 | Illumina Human Methylation 450 | (TODO) -- GDC | methylation__HM450 |
| TCGA-C8-A274-01A-11D-A16G-05 | Illumina Human Methylation 450 | (TODO) -- GDC | methylation__HM450 |
| TCGA-C8-A275-01A-21D-A16G-05 | Illumina Human Methylation 450 | (TODO) -- GDC | methylation__HM450 |
| TCGA-C8-A278-01A-11D-A16A-05 | Illumina Human Methylation 450 | (TODO) -- GDC | methylation__HM450 |
| TCGA-C8-A27A-01A-11D-A16A-05 | Illumina Human Methylation 450 | (TODO) -- GDC | methylation__HM450 |
| TCGA-C8-A27B-01A-11D-A16A-05 | Illumina Human Methylation 450 | (TODO) -- GDC | methylation__HM450 |
| TCGA-C8-A3M7-01A-12D-A21R-05 | Illumina Human Methylation 450 | (TODO) -- GDC | methylation__HM450 |
| TCGA-C8-A3M8-01A-11D-A212-05 | Illumina Human Methylation 450 | (TODO) -- GDC | methylation__HM450 |
| TCGA-C8-A8HP-01A-11D-A36K-05 | Illumina Human Methylation 450 | (TODO) -- GDC | methylation__HM450 |
| TCGA-C8-A8HQ-01A-11D-A36K-05 | Illumina Human Methylation 450 | (TODO) -- GDC | methylation__HM450 |
| TCGA-C8-A8HR-01A-11D-A36K-05 | Illumina Human Methylation 450 | (TODO) -- GDC | methylation__HM450 |
| TCGA-C8-A9FZ-01A-11D-A41Q-05 | Illumina Human Methylation 450 | (TODO) -- GDC | methylation__HM450 |
| TCGA-D8-A13Y-01A-11D-A112-05 | Illumina Human Methylation 27 | (TODO) -- GDC | methylation__HM27 |
| TCGA-D8-A13Z-01A-11D-A112-05 | Illumina Human Methylation 27 | (TODO) -- GDC | methylation__HM27 |
| TCGA-D8-A140-01A-11D-A112-05 | Illumina Human Methylation 27 | (TODO) -- GDC | methylation__HM27 |
| TCGA-D8-A141-01A-11D-A112-05 | Illumina Human Methylation 27 | (TODO) -- GDC | methylation__HM27 |
| TCGA-D8-A142-01A-11D-A112-05 | Illumina Human Methylation 27 | (TODO) -- GDC | methylation__HM27 |
| TCGA-D8-A143-01A-11D-A112-05 | Illumina Human Methylation 27 | (TODO) -- GDC | methylation__HM27 |
| TCGA-D8-A145-01A-11D-A112-05 | Illumina Human Methylation 27 | (TODO) -- GDC | methylation__HM27 |
| TCGA-D8-A146-01A-31D-A112-05 | Illumina Human Methylation 27 | (TODO) -- GDC | methylation__HM27 |
| TCGA-D8-A147-01A-11D-A112-05 | Illumina Human Methylation 27 | (TODO) -- GDC | methylation__HM27 |
| TCGA-D8-A1J8-01A-11D-A13K-05 | Illumina Human Methylation 450 | (TODO) -- GDC | methylation__HM450 |
| TCGA-D8-A1J9-01A-11D-A13K-05 | Illumina Human Methylation 450 | (TODO) -- GDC | methylation__HM450 |
| TCGA-D8-A1JA-01A-11D-A13K-05 | Illumina Human Methylation 450 | (TODO) -- GDC | methylation__HM450 |
| TCGA-D8-A1JB-01A-11D-A13K-05 | Illumina Human Methylation 450 | (TODO) -- GDC | methylation__HM450 |
| TCGA-D8-A1JC-01A-11D-A13K-05 | Illumina Human Methylation 450 | (TODO) -- GDC | methylation__HM450 |
| TCGA-D8-A1JD-01A-11D-A13K-05 | Illumina Human Methylation 450 | (TODO) -- GDC | methylation__HM450 |
| TCGA-D8-A1JE-01A-11D-A13K-05 | Illumina Human Methylation 450 | (TODO) -- GDC | methylation__HM450 |
| TCGA-D8-A1JF-01A-11D-A13K-05 | Illumina Human Methylation 450 | (TODO) -- GDC | methylation__HM450 |
| TCGA-D8-A1JG-01B-11D-A13K-05 | Illumina Human Methylation 450 | (TODO) -- GDC | methylation__HM450 |
| TCGA-D8-A1JH-01A-11D-A13K-05 | Illumina Human Methylation 450 | (TODO) -- GDC | methylation__HM450 |
| TCGA-D8-A1JI-01A-11D-A13K-05 | Illumina Human Methylation 450 | (TODO) -- GDC | methylation__HM450 |
| TCGA-D8-A1JJ-01A-31D-A14N-05 | Illumina Human Methylation 450 | (TODO) -- GDC | methylation__HM450 |
| TCGA-D8-A1JK-01A-11D-A13K-05 | Illumina Human Methylation 450 | (TODO) -- GDC | methylation__HM450 |
| TCGA-D8-A1JL-01A-11D-A13K-05 | Illumina Human Methylation 450 | (TODO) -- GDC | methylation__HM450 |
| TCGA-D8-A1JM-01A-11D-A13K-05 | Illumina Human Methylation 450 | (TODO) -- GDC | methylation__HM450 |
| TCGA-D8-A1JP-01A-11D-A13K-05 | Illumina Human Methylation 450 | (TODO) -- GDC | methylation__HM450 |
| TCGA-D8-A1JS-01A-11D-A13K-05 | Illumina Human Methylation 450 | (TODO) -- GDC | methylation__HM450 |
| TCGA-D8-A1JT-01A-31D-A13K-05 | Illumina Human Methylation 450 | (TODO) -- GDC | methylation__HM450 |
| TCGA-D8-A1JU-01A-11D-A13K-05 | Illumina Human Methylation 450 | (TODO) -- GDC | methylation__HM450 |
| TCGA-D8-A1X5-01A-11D-A14H-05 | Illumina Human Methylation 450 | (TODO) -- GDC | methylation__HM450 |
| TCGA-D8-A1X6-01A-11D-A14N-05 | Illumina Human Methylation 450 | (TODO) -- GDC | methylation__HM450 |
| TCGA-D8-A1X7-01A-11D-A14N-05 | Illumina Human Methylation 450 | (TODO) -- GDC | methylation__HM450 |
| TCGA-D8-A1X8-01A-11D-A14N-05 | Illumina Human Methylation 450 | (TODO) -- GDC | methylation__HM450 |
| TCGA-D8-A1X9-01A-12D-A161-05 | Illumina Human Methylation 450 | (TODO) -- GDC | methylation__HM450 |
| TCGA-D8-A1XA-01A-11D-A14H-05 | Illumina Human Methylation 450 | (TODO) -- GDC | methylation__HM450 |
| TCGA-D8-A1XB-01A-11D-A14H-05 | Illumina Human Methylation 450 | (TODO) -- GDC | methylation__HM450 |
| TCGA-D8-A1XC-01A-11D-A14H-05 | Illumina Human Methylation 450 | (TODO) -- GDC | methylation__HM450 |
| TCGA-D8-A1XD-01A-11D-A14H-05 | Illumina Human Methylation 450 | (TODO) -- GDC | methylation__HM450 |
| TCGA-D8-A1XF-01A-11D-A14H-05 | Illumina Human Methylation 450 | (TODO) -- GDC | methylation__HM450 |
| TCGA-D8-A1XG-01A-11D-A14H-05 | Illumina Human Methylation 450 | (TODO) -- GDC | methylation__HM450 |
| TCGA-D8-A1XJ-01A-11D-A14N-05 | Illumina Human Methylation 450 | (TODO) -- GDC | methylation__HM450 |
| TCGA-D8-A1XK-01A-21D-A14N-05 | Illumina Human Methylation 450 | (TODO) -- GDC | methylation__HM450 |
| TCGA-D8-A1XL-01A-11D-A14N-05 | Illumina Human Methylation 450 | (TODO) -- GDC | methylation__HM450 |
| TCGA-D8-A1XM-01A-21D-A14N-05 | Illumina Human Methylation 450 | (TODO) -- GDC | methylation__HM450 |
| TCGA-D8-A1XO-01A-11D-A14N-05 | Illumina Human Methylation 450 | (TODO) -- GDC | methylation__HM450 |
| TCGA-D8-A1XQ-01A-11D-A14N-05 | Illumina Human Methylation 450 | (TODO) -- GDC | methylation__HM450 |
| TCGA-D8-A1XR-01A-11D-A14N-05 | Illumina Human Methylation 450 | (TODO) -- GDC | methylation__HM450 |
| TCGA-D8-A1XS-01A-11D-A14N-05 | Illumina Human Methylation 450 | (TODO) -- GDC | methylation__HM450 |
| TCGA-D8-A1XT-01A-11D-A14N-05 | Illumina Human Methylation 450 | (TODO) -- GDC | methylation__HM450 |
| TCGA-D8-A1XU-01A-11D-A14N-05 | Illumina Human Methylation 450 | (TODO) -- GDC | methylation__HM450 |
| TCGA-D8-A1XV-01A-11D-A14N-05 | Illumina Human Methylation 450 | (TODO) -- GDC | methylation__HM450 |
| TCGA-D8-A1XW-01A-11D-A14N-05 | Illumina Human Methylation 450 | (TODO) -- GDC | methylation__HM450 |
| TCGA-D8-A1XY-01A-11D-A14N-05 | Illumina Human Methylation 450 | (TODO) -- GDC | methylation__HM450 |
| TCGA-D8-A1XZ-01A-11D-A14N-05 | Illumina Human Methylation 450 | (TODO) -- GDC | methylation__HM450 |
| TCGA-D8-A1Y0-01A-11D-A14N-05 | Illumina Human Methylation 450 | (TODO) -- GDC | methylation__HM450 |
| TCGA-D8-A1Y1-01A-21D-A14N-05 | Illumina Human Methylation 450 | (TODO) -- GDC | methylation__HM450 |
| TCGA-D8-A1Y2-01A-11D-A161-05 | Illumina Human Methylation 450 | (TODO) -- GDC | methylation__HM450 |
| TCGA-D8-A1Y3-01A-11D-A161-05 | Illumina Human Methylation 450 | (TODO) -- GDC | methylation__HM450 |
| TCGA-D8-A27E-01A-11D-A16G-05 | Illumina Human Methylation 450 | (TODO) -- GDC | methylation__HM450 |
| TCGA-D8-A27F-01A-11D-A16G-05 | Illumina Human Methylation 450 | (TODO) -- GDC | methylation__HM450 |
| TCGA-D8-A27G-01A-11D-A16G-05 | Illumina Human Methylation 450 | (TODO) -- GDC | methylation__HM450 |
| TCGA-D8-A27H-01A-11D-A16G-05 | Illumina Human Methylation 450 | (TODO) -- GDC | methylation__HM450 |
| TCGA-D8-A27I-01A-11D-A16G-05 | Illumina Human Methylation 450 | (TODO) -- GDC | methylation__HM450 |
| TCGA-D8-A27K-01A-11D-A16G-05 | Illumina Human Methylation 450 | (TODO) -- GDC | methylation__HM450 |
| TCGA-D8-A27L-01A-11D-A16G-05 | Illumina Human Methylation 450 | (TODO) -- GDC | methylation__HM450 |
| TCGA-D8-A27M-01A-11D-A16G-05 | Illumina Human Methylation 450 | (TODO) -- GDC | methylation__HM450 |
| TCGA-D8-A27N-01A-11D-A16G-05 | Illumina Human Methylation 450 | (TODO) -- GDC | methylation__HM450 |
| TCGA-D8-A27P-01A-11D-A16G-05 | Illumina Human Methylation 450 | (TODO) -- GDC | methylation__HM450 |
| TCGA-D8-A27R-01A-11D-A16G-05 | Illumina Human Methylation 450 | (TODO) -- GDC | methylation__HM450 |
| TCGA-D8-A27T-01A-11D-A16G-05 | Illumina Human Methylation 450 | (TODO) -- GDC | methylation__HM450 |
| TCGA-D8-A27V-01A-12D-A17F-05 | Illumina Human Methylation 450 | (TODO) -- GDC | methylation__HM450 |
| TCGA-D8-A27W-01A-11D-A16G-05 | Illumina Human Methylation 450 | (TODO) -- GDC | methylation__HM450 |
| TCGA-D8-A3Z5-01A-41D-A244-05 | Illumina Human Methylation 450 | (TODO) -- GDC | methylation__HM450 |
| TCGA-D8-A3Z6-01A-11D-A23D-05 | Illumina Human Methylation 450 | (TODO) -- GDC | methylation__HM450 |
| TCGA-D8-A4Z1-01A-21D-A268-05 | Illumina Human Methylation 450 | (TODO) -- GDC | methylation__HM450 |
| TCGA-D8-A73U-01A-11D-A33F-05 | Illumina Human Methylation 450 | (TODO) -- GDC | methylation__HM450 |
| TCGA-D8-A73W-01A-22D-A357-05 | Illumina Human Methylation 450 | (TODO) -- GDC | methylation__HM450 |
| TCGA-D8-A73X-01A-11D-A32T-05 | Illumina Human Methylation 450 | (TODO) -- GDC | methylation__HM450 |
| TCGA-E2-A105-01A-11D-A10N-05 | Illumina Human Methylation 450 | (TODO) -- GDC | methylation__HM450 |
| TCGA-E2-A106-01A-11D-A10N-05 | Illumina Human Methylation 450 | (TODO) -- GDC | methylation__HM450 |
| TCGA-E2-A107-01A-11D-A10N-05 | Illumina Human Methylation 450 | (TODO) -- GDC | methylation__HM450 |
| TCGA-E2-A108-01A-13D-A10N-05 | Illumina Human Methylation 450 | (TODO) -- GDC | methylation__HM450 |
| TCGA-E2-A109-01A-11D-A10N-05 | Illumina Human Methylation 450 | (TODO) -- GDC | methylation__HM450 |
| TCGA-E2-A10A-01A-21D-A112-05 | Illumina Human Methylation 27 | (TODO) -- GDC | methylation__HM27 |
| TCGA-E2-A10B-01A-11D-A10N-05 | Illumina Human Methylation 450 | (TODO) -- GDC | methylation__HM450 |
| TCGA-E2-A10C-01A-21D-A10N-05 | Illumina Human Methylation 450 | (TODO) -- GDC | methylation__HM450 |
| TCGA-E2-A10E-01A-21D-A10N-05 | Illumina Human Methylation 450 | (TODO) -- GDC | methylation__HM450 |
| TCGA-E2-A10F-01A-11D-A10N-05 | Illumina Human Methylation 450 | (TODO) -- GDC | methylation__HM450 |
| TCGA-E2-A14N-01A-31D-A138-05 | Illumina Human Methylation 450 | (TODO) -- GDC | methylation__HM450 |
| TCGA-E2-A14O-01A-31D-A112-05 | Illumina Human Methylation 27 | (TODO) -- GDC | methylation__HM27 |
| TCGA-E2-A14P-01A-31D-A12E-05 | Illumina Human Methylation 27 | (TODO) -- GDC | methylation__HM27 |
| TCGA-E2-A14Q-01A-11D-A12E-05 | Illumina Human Methylation 27 | (TODO) -- GDC | methylation__HM27 |
| TCGA-E2-A14R-01A-11D-A112-05 | Illumina Human Methylation 27 | (TODO) -- GDC | methylation__HM27 |
| TCGA-E2-A14S-01A-11D-A12E-05 | Illumina Human Methylation 27 | (TODO) -- GDC | methylation__HM27 |
| TCGA-E2-A14T-01A-11D-A112-05 | Illumina Human Methylation 27 | (TODO) -- GDC | methylation__HM27 |
| TCGA-E2-A14U-01A-11D-A22B-05 | Illumina Human Methylation 450 | (TODO) -- GDC | methylation__HM450 |
| TCGA-E2-A14V-01A-11D-A12E-05 | Illumina Human Methylation 27 | (TODO) -- GDC | methylation__HM27 |
| TCGA-E2-A14W-01A-11D-A12E-05 | Illumina Human Methylation 27 | (TODO) -- GDC | methylation__HM27 |
| TCGA-E2-A14X-01A-11D-A112-05 | Illumina Human Methylation 27 | (TODO) -- GDC | methylation__HM27 |
| TCGA-E2-A14Y-01A-21D-A12E-05 | Illumina Human Methylation 27 | (TODO) -- GDC | methylation__HM27 |
| TCGA-E2-A14Z-01A-11D-A112-05 | Illumina Human Methylation 27 | (TODO) -- GDC | methylation__HM27 |
| TCGA-E2-A150-01A-11D-A12E-05 | Illumina Human Methylation 27 | (TODO) -- GDC | methylation__HM27 |
| TCGA-E2-A152-01A-11D-A12E-05 | Illumina Human Methylation 27 | (TODO) -- GDC | methylation__HM27 |
| TCGA-E2-A153-01A-12D-A12E-05 | Illumina Human Methylation 27 | (TODO) -- GDC | methylation__HM27 |
| TCGA-E2-A154-01A-11D-A112-05 | Illumina Human Methylation 27 | (TODO) -- GDC | methylation__HM27 |
| TCGA-E2-A155-01A-11D-A12E-05 | Illumina Human Methylation 27 | (TODO) -- GDC | methylation__HM27 |
| TCGA-E2-A156-01A-11D-A12E-05 | Illumina Human Methylation 27 | (TODO) -- GDC | methylation__HM27 |
| TCGA-E2-A158-01A-11D-A12E-05 | Illumina Human Methylation 27 | (TODO) -- GDC | methylation__HM27 |
| TCGA-E2-A159-01A-11D-A112-05 | Illumina Human Methylation 27 | (TODO) -- GDC | methylation__HM27 |
| TCGA-E2-A15A-01A-11D-A12E-05 | Illumina Human Methylation 27 | (TODO) -- GDC | methylation__HM27 |
| TCGA-E2-A15C-01A-31D-A12E-05 | Illumina Human Methylation 27 | (TODO) -- GDC | methylation__HM27 |
| TCGA-E2-A15D-01A-11D-A112-05 | Illumina Human Methylation 27 | (TODO) -- GDC | methylation__HM27 |
| TCGA-E2-A15E-01A-11D-A12E-05 | Illumina Human Methylation 27 | (TODO) -- GDC | methylation__HM27 |
| TCGA-E2-A15F-01A-11D-A112-05 | Illumina Human Methylation 27 | (TODO) -- GDC | methylation__HM27 |
| TCGA-E2-A15G-01A-11D-A12E-05 | Illumina Human Methylation 27 | (TODO) -- GDC | methylation__HM27 |
| TCGA-E2-A15H-01A-11D-A12E-05 | Illumina Human Methylation 27 | (TODO) -- GDC | methylation__HM27 |
| TCGA-E2-A15I-01A-21D-A138-05 | Illumina Human Methylation 450 | (TODO) -- GDC | methylation__HM450 |
| TCGA-E2-A15J-01A-11D-A12R-05 | Illumina Human Methylation 450 | (TODO) -- GDC | methylation__HM450 |
| TCGA-E2-A15K-01A-11D-A12R-05 | Illumina Human Methylation 450 | (TODO) -- GDC | methylation__HM450 |
| TCGA-E2-A15L-01A-11D-A12E-05 | Illumina Human Methylation 27 | (TODO) -- GDC | methylation__HM27 |
| TCGA-E2-A15M-01A-11D-A12E-05 | Illumina Human Methylation 27 | (TODO) -- GDC | methylation__HM27 |
| TCGA-E2-A15O-01A-11D-A112-05 | Illumina Human Methylation 27 | (TODO) -- GDC | methylation__HM27 |
| TCGA-E2-A15P-01A-11D-A112-05 | Illumina Human Methylation 27 | (TODO) -- GDC | methylation__HM27 |
| TCGA-E2-A15R-01A-11D-A112-05 | Illumina Human Methylation 27 | (TODO) -- GDC | methylation__HM27 |
| TCGA-E2-A15S-01A-11D-A112-05 | Illumina Human Methylation 27 | (TODO) -- GDC | methylation__HM27 |
| TCGA-E2-A15T-01A-11D-A112-05 | Illumina Human Methylation 27 | (TODO) -- GDC | methylation__HM27 |
| TCGA-E2-A1AZ-01A-11D-A12R-05 | Illumina Human Methylation 450 | (TODO) -- GDC | methylation__HM450 |
| TCGA-E2-A1B0-01A-11D-A12R-05 | Illumina Human Methylation 450 | (TODO) -- GDC | methylation__HM450 |
| TCGA-E2-A1B1-01A-21D-A12R-05 | Illumina Human Methylation 450 | (TODO) -- GDC | methylation__HM450 |
| TCGA-E2-A1B4-01A-11D-A12R-05 | Illumina Human Methylation 450 | (TODO) -- GDC | methylation__HM450 |
| TCGA-E2-A1B5-01A-21D-A12R-05 | Illumina Human Methylation 450 | (TODO) -- GDC | methylation__HM450 |
| TCGA-E2-A1B6-01A-31D-A12R-05 | Illumina Human Methylation 450 | (TODO) -- GDC | methylation__HM450 |
| TCGA-E2-A1BC-01A-11D-A12R-05 | Illumina Human Methylation 450 | (TODO) -- GDC | methylation__HM450 |
| TCGA-E2-A1BD-01A-11D-A12R-05 | Illumina Human Methylation 450 | (TODO) -- GDC | methylation__HM450 |
| TCGA-E2-A1IE-01A-11D-A13K-05 | Illumina Human Methylation 450 | (TODO) -- GDC | methylation__HM450 |
| TCGA-E2-A1IF-01A-11D-A145-05 | Illumina Human Methylation 450 | (TODO) -- GDC | methylation__HM450 |
| TCGA-E2-A1IG-01A-11D-A145-05 | Illumina Human Methylation 450 | (TODO) -- GDC | methylation__HM450 |
| TCGA-E2-A1IH-01A-11D-A13K-05 | Illumina Human Methylation 450 | (TODO) -- GDC | methylation__HM450 |
| TCGA-E2-A1II-01A-11D-A145-05 | Illumina Human Methylation 450 | (TODO) -- GDC | methylation__HM450 |
| TCGA-E2-A1IJ-01A-11D-A145-05 | Illumina Human Methylation 450 | (TODO) -- GDC | methylation__HM450 |
| TCGA-E2-A1IK-01A-11D-A145-05 | Illumina Human Methylation 450 | (TODO) -- GDC | methylation__HM450 |
| TCGA-E2-A1IL-01A-11D-A14H-05 | Illumina Human Methylation 450 | (TODO) -- GDC | methylation__HM450 |
| TCGA-E2-A1IN-01A-11D-A13K-05 | Illumina Human Methylation 450 | (TODO) -- GDC | methylation__HM450 |
| TCGA-E2-A1IO-01A-11D-A145-05 | Illumina Human Methylation 450 | (TODO) -- GDC | methylation__HM450 |
| TCGA-E2-A1IU-01A-11D-A14H-05 | Illumina Human Methylation 450 | (TODO) -- GDC | methylation__HM450 |
| TCGA-E2-A1L6-01A-11D-A13K-05 | Illumina Human Methylation 450 | (TODO) -- GDC | methylation__HM450 |
| TCGA-E2-A1L7-01A-11D-A145-05 | Illumina Human Methylation 450 | (TODO) -- GDC | methylation__HM450 |
| TCGA-E2-A1L8-01A-11D-A13K-05 | Illumina Human Methylation 450 | (TODO) -- GDC | methylation__HM450 |
| TCGA-E2-A1L9-01A-11D-A13K-05 | Illumina Human Methylation 450 | (TODO) -- GDC | methylation__HM450 |
| TCGA-E2-A1LA-01A-11D-A145-05 | Illumina Human Methylation 450 | (TODO) -- GDC | methylation__HM450 |
| TCGA-E2-A1LB-01A-11D-A145-05 | Illumina Human Methylation 450 | (TODO) -- GDC | methylation__HM450 |
| TCGA-E2-A1LE-01A-12D-A19Z-05 | Illumina Human Methylation 450 | (TODO) -- GDC | methylation__HM450 |
| TCGA-E2-A1LG-01A-21D-A14N-05 | Illumina Human Methylation 450 | (TODO) -- GDC | methylation__HM450 |
| TCGA-E2-A1LH-01A-11D-A14H-05 | Illumina Human Methylation 450 | (TODO) -- GDC | methylation__HM450 |
| TCGA-E2-A1LI-01A-12D-A161-05 | Illumina Human Methylation 450 | (TODO) -- GDC | methylation__HM450 |
| TCGA-E2-A1LK-01A-21D-A14H-05 | Illumina Human Methylation 450 | (TODO) -- GDC | methylation__HM450 |
| TCGA-E2-A1LL-01A-11D-A145-05 | Illumina Human Methylation 450 | (TODO) -- GDC | methylation__HM450 |
| TCGA-E2-A1LS-01A-12D-A161-05 | Illumina Human Methylation 450 | (TODO) -- GDC | methylation__HM450 |
| TCGA-E2-A2P5-01A-11D-A19Z-05 | Illumina Human Methylation 450 | (TODO) -- GDC | methylation__HM450 |
| TCGA-E2-A2P6-01A-11D-A19Z-05 | Illumina Human Methylation 450 | (TODO) -- GDC | methylation__HM450 |
| TCGA-E2-A3DX-01A-21D-A212-05 | Illumina Human Methylation 450 | (TODO) -- GDC | methylation__HM450 |
| TCGA-E2-A56Z-01A-12D-A29O-05 | Illumina Human Methylation 450 | (TODO) -- GDC | methylation__HM450 |
| TCGA-E2-A570-01A-11D-A29O-05 | Illumina Human Methylation 450 | (TODO) -- GDC | methylation__HM450 |
| TCGA-E2-A572-01A-13D-A31V-05 | Illumina Human Methylation 450 | (TODO) -- GDC | methylation__HM450 |
| TCGA-E2-A573-01A-11D-A29O-05 | Illumina Human Methylation 450 | (TODO) -- GDC | methylation__HM450 |
| TCGA-E2-A574-01A-11D-A29O-05 | Illumina Human Methylation 450 | (TODO) -- GDC | methylation__HM450 |
| TCGA-E2-A576-01A-11D-A31V-05 | Illumina Human Methylation 450 | (TODO) -- GDC | methylation__HM450 |
| TCGA-E2-A9RU-01A-11D-A41Q-05 | Illumina Human Methylation 450 | (TODO) -- GDC | methylation__HM450 |
| TCGA-E9-A1N3-01A-12D-A161-05 | Illumina Human Methylation 450 | (TODO) -- GDC | methylation__HM450 |
| TCGA-E9-A1N4-01A-11D-A14N-05 | Illumina Human Methylation 450 | (TODO) -- GDC | methylation__HM450 |
| TCGA-E9-A1N5-01A-11D-A14H-05 | Illumina Human Methylation 450 | (TODO) -- GDC | methylation__HM450 |
| TCGA-E9-A1N6-01A-11D-A145-05 | Illumina Human Methylation 450 | (TODO) -- GDC | methylation__HM450 |
| TCGA-E9-A1N8-01A-11D-A145-05 | Illumina Human Methylation 450 | (TODO) -- GDC | methylation__HM450 |
| TCGA-E9-A1N9-01A-11D-A14H-05 | Illumina Human Methylation 450 | (TODO) -- GDC | methylation__HM450 |
| TCGA-E9-A1NA-01A-11D-A145-05 | Illumina Human Methylation 450 | (TODO) -- GDC | methylation__HM450 |
| TCGA-E9-A1NC-01A-12D-A161-05 | Illumina Human Methylation 450 | (TODO) -- GDC | methylation__HM450 |
| TCGA-E9-A1ND-01A-11D-A145-05 | Illumina Human Methylation 450 | (TODO) -- GDC | methylation__HM450 |
| TCGA-E9-A1NE-01A-21D-A14N-05 | Illumina Human Methylation 450 | (TODO) -- GDC | methylation__HM450 |
| TCGA-E9-A1NF-01A-11D-A14H-05 | Illumina Human Methylation 450 | (TODO) -- GDC | methylation__HM450 |
| TCGA-E9-A1NG-01A-21D-A14N-05 | Illumina Human Methylation 450 | (TODO) -- GDC | methylation__HM450 |
| TCGA-E9-A1NH-01A-11D-A14H-05 | Illumina Human Methylation 450 | (TODO) -- GDC | methylation__HM450 |
| TCGA-E9-A1NI-01A-11D-A14H-05 | Illumina Human Methylation 450 | (TODO) -- GDC | methylation__HM450 |
| TCGA-E9-A1QZ-01A-21D-A16A-05 | Illumina Human Methylation 450 | (TODO) -- GDC | methylation__HM450 |
| TCGA-E9-A1R0-01A-22D-A16G-05 | Illumina Human Methylation 450 | (TODO) -- GDC | methylation__HM450 |
| TCGA-E9-A1R2-01A-11D-A14H-05 | Illumina Human Methylation 450 | (TODO) -- GDC | methylation__HM450 |
| TCGA-E9-A1R3-01A-31D-A14N-05 | Illumina Human Methylation 450 | (TODO) -- GDC | methylation__HM450 |
| TCGA-E9-A1R4-01A-21D-A14H-05 | Illumina Human Methylation 450 | (TODO) -- GDC | methylation__HM450 |
| TCGA-E9-A1R5-01A-11D-A14N-05 | Illumina Human Methylation 450 | (TODO) -- GDC | methylation__HM450 |
| TCGA-E9-A1R6-01A-11D-A14H-05 | Illumina Human Methylation 450 | (TODO) -- GDC | methylation__HM450 |
| TCGA-E9-A1R7-01A-11D-A14N-05 | Illumina Human Methylation 450 | (TODO) -- GDC | methylation__HM450 |
| TCGA-E9-A1RA-01A-11D-A14H-05 | Illumina Human Methylation 450 | (TODO) -- GDC | methylation__HM450 |
| TCGA-E9-A1RB-01A-11D-A161-05 | Illumina Human Methylation 450 | (TODO) -- GDC | methylation__HM450 |
| TCGA-E9-A1RC-01A-11D-A161-05 | Illumina Human Methylation 450 | (TODO) -- GDC | methylation__HM450 |
| TCGA-E9-A1RD-01A-11D-A161-05 | Illumina Human Methylation 450 | (TODO) -- GDC | methylation__HM450 |
| TCGA-E9-A1RE-01A-11D-A161-05 | Illumina Human Methylation 450 | (TODO) -- GDC | methylation__HM450 |
| TCGA-E9-A1RF-01A-11D-A161-05 | Illumina Human Methylation 450 | (TODO) -- GDC | methylation__HM450 |
| TCGA-E9-A1RG-01A-11D-A14H-05 | Illumina Human Methylation 450 | (TODO) -- GDC | methylation__HM450 |
| TCGA-E9-A1RH-01A-21D-A16A-05 | Illumina Human Methylation 450 | (TODO) -- GDC | methylation__HM450 |
| TCGA-E9-A1RI-01A-11D-A16A-05 | Illumina Human Methylation 450 | (TODO) -- GDC | methylation__HM450 |
| TCGA-E9-A226-01A-21D-A161-05 | Illumina Human Methylation 450 | (TODO) -- GDC | methylation__HM450 |
| TCGA-E9-A227-01A-11D-A161-05 | Illumina Human Methylation 450 | (TODO) -- GDC | methylation__HM450 |
| TCGA-E9-A228-01A-31D-A161-05 | Illumina Human Methylation 450 | (TODO) -- GDC | methylation__HM450 |
| TCGA-E9-A229-01A-31D-A161-05 | Illumina Human Methylation 450 | (TODO) -- GDC | methylation__HM450 |
| TCGA-E9-A22A-01A-11D-A161-05 | Illumina Human Methylation 450 | (TODO) -- GDC | methylation__HM450 |
| TCGA-E9-A22B-01A-11D-A161-05 | Illumina Human Methylation 450 | (TODO) -- GDC | methylation__HM450 |
| TCGA-E9-A22D-01A-11D-A161-05 | Illumina Human Methylation 450 | (TODO) -- GDC | methylation__HM450 |
| TCGA-E9-A22E-01A-11D-A161-05 | Illumina Human Methylation 450 | (TODO) -- GDC | methylation__HM450 |
| TCGA-E9-A22G-01A-11D-A161-05 | Illumina Human Methylation 450 | (TODO) -- GDC | methylation__HM450 |
| TCGA-E9-A22H-01A-11D-A161-05 | Illumina Human Methylation 450 | (TODO) -- GDC | methylation__HM450 |
| TCGA-E9-A243-01A-21D-A16A-05 | Illumina Human Methylation 450 | (TODO) -- GDC | methylation__HM450 |
| TCGA-E9-A244-01A-11D-A16A-05 | Illumina Human Methylation 450 | (TODO) -- GDC | methylation__HM450 |
| TCGA-E9-A245-01A-22D-A16G-05 | Illumina Human Methylation 450 | (TODO) -- GDC | methylation__HM450 |
| TCGA-E9-A247-01A-11D-A16A-05 | Illumina Human Methylation 450 | (TODO) -- GDC | methylation__HM450 |
| TCGA-E9-A248-01A-11D-A16A-05 | Illumina Human Methylation 450 | (TODO) -- GDC | methylation__HM450 |
| TCGA-E9-A249-01A-11D-A16A-05 | Illumina Human Methylation 450 | (TODO) -- GDC | methylation__HM450 |
| TCGA-E9-A24A-01A-11D-A16A-05 | Illumina Human Methylation 450 | (TODO) -- GDC | methylation__HM450 |
| TCGA-E9-A295-01A-11D-A16G-05 | Illumina Human Methylation 450 | (TODO) -- GDC | methylation__HM450 |
| TCGA-E9-A2JS-01A-11D-A17Z-05 | Illumina Human Methylation 450 | (TODO) -- GDC | methylation__HM450 |
| TCGA-E9-A2JT-01A-22D-A18O-05 | Illumina Human Methylation 450 | (TODO) -- GDC | methylation__HM450 |
| TCGA-E9-A3HO-01A-11D-A212-05 | Illumina Human Methylation 450 | (TODO) -- GDC | methylation__HM450 |
| TCGA-E9-A3Q9-01A-11D-A21R-05 | Illumina Human Methylation 450 | (TODO) -- GDC | methylation__HM450 |
| TCGA-E9-A3QA-01A-61D-A22B-05 | Illumina Human Methylation 450 | (TODO) -- GDC | methylation__HM450 |
| TCGA-E9-A3X8-01A-31D-A230-05 | Illumina Human Methylation 450 | (TODO) -- GDC | methylation__HM450 |
| TCGA-E9-A54X-01A-11D-A268-05 | Illumina Human Methylation 450 | (TODO) -- GDC | methylation__HM450 |
| TCGA-E9-A54Y-01A-11D-A268-05 | Illumina Human Methylation 450 | (TODO) -- GDC | methylation__HM450 |
| TCGA-E9-A5FK-01A-11D-A27Y-05 | Illumina Human Methylation 450 | (TODO) -- GDC | methylation__HM450 |
| TCGA-E9-A5FL-01A-11D-A27Y-05 | Illumina Human Methylation 450 | (TODO) -- GDC | methylation__HM450 |
| TCGA-E9-A5UO-01A-11D-A28C-05 | Illumina Human Methylation 450 | (TODO) -- GDC | methylation__HM450 |
| TCGA-E9-A5UP-01A-11D-A28C-05 | Illumina Human Methylation 450 | (TODO) -- GDC | methylation__HM450 |
| TCGA-E9-A6HE-01A-11D-A31V-05 | Illumina Human Methylation 450 | (TODO) -- GDC | methylation__HM450 |
| TCGA-EW-A1IW-01A-11D-A13K-05 | Illumina Human Methylation 450 | (TODO) -- GDC | methylation__HM450 |
| TCGA-EW-A1IX-01A-12D-A145-05 | Illumina Human Methylation 450 | (TODO) -- GDC | methylation__HM450 |
| TCGA-EW-A1IY-01A-11D-A13K-05 | Illumina Human Methylation 450 | (TODO) -- GDC | methylation__HM450 |
| TCGA-EW-A1IZ-01A-11D-A13K-05 | Illumina Human Methylation 450 | (TODO) -- GDC | methylation__HM450 |
| TCGA-EW-A1J1-01A-11D-A13K-05 | Illumina Human Methylation 450 | (TODO) -- GDC | methylation__HM450 |
| TCGA-EW-A1J2-01A-21D-A13K-05 | Illumina Human Methylation 450 | (TODO) -- GDC | methylation__HM450 |
| TCGA-EW-A1J3-01A-11D-A13K-05 | Illumina Human Methylation 450 | (TODO) -- GDC | methylation__HM450 |
| TCGA-EW-A1J5-01A-11D-A13K-05 | Illumina Human Methylation 450 | (TODO) -- GDC | methylation__HM450 |
| TCGA-EW-A1J6-01A-11D-A13K-05 | Illumina Human Methylation 450 | (TODO) -- GDC | methylation__HM450 |
| TCGA-EW-A1OV-01A-11D-A145-05 | Illumina Human Methylation 450 | (TODO) -- GDC | methylation__HM450 |
| TCGA-EW-A1OW-01A-21D-A145-05 | Illumina Human Methylation 450 | (TODO) -- GDC | methylation__HM450 |
| TCGA-EW-A1OX-01A-11D-A145-05 | Illumina Human Methylation 450 | (TODO) -- GDC | methylation__HM450 |
| TCGA-EW-A1OY-01A-11D-A145-05 | Illumina Human Methylation 450 | (TODO) -- GDC | methylation__HM450 |
| TCGA-EW-A1OZ-01A-11D-A145-05 | Illumina Human Methylation 450 | (TODO) -- GDC | methylation__HM450 |
| TCGA-EW-A1P0-01A-11D-A145-05 | Illumina Human Methylation 450 | (TODO) -- GDC | methylation__HM450 |
| TCGA-EW-A1P1-01A-31D-A14H-05 | Illumina Human Methylation 450 | (TODO) -- GDC | methylation__HM450 |
| TCGA-EW-A1P3-01A-11D-A145-05 | Illumina Human Methylation 450 | (TODO) -- GDC | methylation__HM450 |
| TCGA-EW-A1P4-01A-21D-A145-05 | Illumina Human Methylation 450 | (TODO) -- GDC | methylation__HM450 |
| TCGA-EW-A1P5-01A-11D-A145-05 | Illumina Human Methylation 450 | (TODO) -- GDC | methylation__HM450 |
| TCGA-EW-A1P6-01A-11D-A145-05 | Illumina Human Methylation 450 | (TODO) -- GDC | methylation__HM450 |
| TCGA-EW-A1P7-01A-21D-A145-05 | Illumina Human Methylation 450 | (TODO) -- GDC | methylation__HM450 |
| TCGA-EW-A1P8-01A-11D-A145-05 | Illumina Human Methylation 450 | (TODO) -- GDC | methylation__HM450 |
| TCGA-EW-A1PA-01A-11D-A145-05 | Illumina Human Methylation 450 | (TODO) -- GDC | methylation__HM450 |
| TCGA-EW-A1PB-01A-11D-A145-05 | Illumina Human Methylation 450 | (TODO) -- GDC | methylation__HM450 |
| TCGA-EW-A1PC-01B-11D-A21R-05 | Illumina Human Methylation 450 | (TODO) -- GDC | methylation__HM450 |
| TCGA-EW-A1PD-01A-11D-A145-05 | Illumina Human Methylation 450 | (TODO) -- GDC | methylation__HM450 |
| TCGA-EW-A1PE-01A-11D-A145-05 | Illumina Human Methylation 450 | (TODO) -- GDC | methylation__HM450 |
| TCGA-EW-A1PF-01A-11D-A145-05 | Illumina Human Methylation 450 | (TODO) -- GDC | methylation__HM450 |
| TCGA-EW-A1PG-01A-11D-A145-05 | Illumina Human Methylation 450 | (TODO) -- GDC | methylation__HM450 |
| TCGA-EW-A1PH-01A-11D-A14N-05 | Illumina Human Methylation 450 | (TODO) -- GDC | methylation__HM450 |
| TCGA-EW-A2FR-01A-11D-A21R-05 | Illumina Human Methylation 450 | (TODO) -- GDC | methylation__HM450 |
| TCGA-EW-A2FS-01A-11D-A17F-05 | Illumina Human Methylation 450 | (TODO) -- GDC | methylation__HM450 |
| TCGA-EW-A2FV-01A-11D-A17F-05 | Illumina Human Methylation 450 | (TODO) -- GDC | methylation__HM450 |
| TCGA-EW-A2FW-01A-11D-A17F-05 | Illumina Human Methylation 450 | (TODO) -- GDC | methylation__HM450 |
| TCGA-EW-A3E8-01B-11D-A244-05 | Illumina Human Methylation 450 | (TODO) -- GDC | methylation__HM450 |
| TCGA-EW-A3U0-01A-11D-A22B-05 | Illumina Human Methylation 450 | (TODO) -- GDC | methylation__HM450 |
| TCGA-EW-A423-01A-11D-A244-05 | Illumina Human Methylation 450 | (TODO) -- GDC | methylation__HM450 |
| TCGA-EW-A424-01A-11D-A244-05 | Illumina Human Methylation 450 | (TODO) -- GDC | methylation__HM450 |
| TCGA-EW-A6S9-01A-22D-A33F-05 | Illumina Human Methylation 450 | (TODO) -- GDC | methylation__HM450 |
| TCGA-EW-A6SA-01A-21D-A32T-05 | Illumina Human Methylation 450 | (TODO) -- GDC | methylation__HM450 |
| TCGA-EW-A6SB-01A-12D-A32T-05 | Illumina Human Methylation 450 | (TODO) -- GDC | methylation__HM450 |
| TCGA-EW-A6SC-01A-12D-A32T-05 | Illumina Human Methylation 450 | (TODO) -- GDC | methylation__HM450 |
| TCGA-EW-A6SD-01A-12D-A33F-05 | Illumina Human Methylation 450 | (TODO) -- GDC | methylation__HM450 |
| TCGA-GI-A2C8-01A-11D-A16G-05 | Illumina Human Methylation 450 | (TODO) -- GDC | methylation__HM450 |
| TCGA-GI-A2C9-01A-11D-A21R-05 | Illumina Human Methylation 450 | (TODO) -- GDC | methylation__HM450 |
| TCGA-GM-A2D9-01A-11D-A18O-05 | Illumina Human Methylation 450 | (TODO) -- GDC | methylation__HM450 |
| TCGA-GM-A2DA-01A-11D-A18O-05 | Illumina Human Methylation 450 | (TODO) -- GDC | methylation__HM450 |
| TCGA-GM-A2DB-01A-31D-A18O-05 | Illumina Human Methylation 450 | (TODO) -- GDC | methylation__HM450 |
| TCGA-GM-A2DC-01A-11D-A18O-05 | Illumina Human Methylation 450 | (TODO) -- GDC | methylation__HM450 |
| TCGA-GM-A2DD-01A-11D-A17Z-05 | Illumina Human Methylation 450 | (TODO) -- GDC | methylation__HM450 |
| TCGA-GM-A2DF-01A-11D-A17Z-05 | Illumina Human Methylation 450 | (TODO) -- GDC | methylation__HM450 |
| TCGA-GM-A2DH-01A-11D-A17Z-05 | Illumina Human Methylation 450 | (TODO) -- GDC | methylation__HM450 |
| TCGA-GM-A2DI-01A-31D-A18O-05 | Illumina Human Methylation 450 | (TODO) -- GDC | methylation__HM450 |
| TCGA-GM-A2DK-01A-21D-A17Z-05 | Illumina Human Methylation 450 | (TODO) -- GDC | methylation__HM450 |
| TCGA-GM-A2DL-01A-11D-A18O-05 | Illumina Human Methylation 450 | (TODO) -- GDC | methylation__HM450 |
| TCGA-GM-A2DM-01A-11D-A17Z-05 | Illumina Human Methylation 450 | (TODO) -- GDC | methylation__HM450 |
| TCGA-GM-A2DN-01A-11D-A17Z-05 | Illumina Human Methylation 450 | (TODO) -- GDC | methylation__HM450 |
| TCGA-GM-A2DO-01A-11D-A18O-05 | Illumina Human Methylation 450 | (TODO) -- GDC | methylation__HM450 |
| TCGA-GM-A3NW-01A-21D-A22B-05 | Illumina Human Methylation 450 | (TODO) -- GDC | methylation__HM450 |
| TCGA-GM-A3NY-01A-11D-A21R-05 | Illumina Human Methylation 450 | (TODO) -- GDC | methylation__HM450 |
| TCGA-GM-A3XG-01A-31D-A244-05 | Illumina Human Methylation 450 | (TODO) -- GDC | methylation__HM450 |
| TCGA-GM-A3XL-01A-11D-A230-05 | Illumina Human Methylation 450 | (TODO) -- GDC | methylation__HM450 |
| TCGA-GM-A3XN-01A-12D-A230-05 | Illumina Human Methylation 450 | (TODO) -- GDC | methylation__HM450 |
| TCGA-GM-A4E0-01A-12D-A268-05 | Illumina Human Methylation 450 | (TODO) -- GDC | methylation__HM450 |
| TCGA-GM-A5PV-01A-11D-A28C-05 | Illumina Human Methylation 450 | (TODO) -- GDC | methylation__HM450 |
| TCGA-GM-A5PX-01A-12D-A28C-05 | Illumina Human Methylation 450 | (TODO) -- GDC | methylation__HM450 |
| TCGA-HN-A2NL-01A-11D-A18O-05 | Illumina Human Methylation 450 | (TODO) -- GDC | methylation__HM450 |
| TCGA-HN-A2OB-01A-21D-A27Y-05 | Illumina Human Methylation 450 | (TODO) -- GDC | methylation__HM450 |
| TCGA-JL-A3YW-01A-12D-A23D-05 | Illumina Human Methylation 450 | (TODO) -- GDC | methylation__HM450 |
| TCGA-JL-A3YX-01A-11D-A230-05 | Illumina Human Methylation 450 | (TODO) -- GDC | methylation__HM450 |
| TCGA-LD-A66U-01A-11D-A31V-05 | Illumina Human Methylation 450 | (TODO) -- GDC | methylation__HM450 |
| TCGA-LD-A74U-01A-13D-A33F-05 | Illumina Human Methylation 450 | (TODO) -- GDC | methylation__HM450 |
| TCGA-LD-A7W5-01A-22D-A357-05 | Illumina Human Methylation 450 | (TODO) -- GDC | methylation__HM450 |
| TCGA-LD-A7W6-01A-81D-A357-05 | Illumina Human Methylation 450 | (TODO) -- GDC | methylation__HM450 |
| TCGA-LD-A9QF-01A-32D-A41Q-05 | Illumina Human Methylation 450 | (TODO) -- GDC | methylation__HM450 |
| TCGA-LL-A440-01A-11D-A244-05 | Illumina Human Methylation 450 | (TODO) -- GDC | methylation__HM450 |
| TCGA-LL-A441-01A-11D-A244-05 | Illumina Human Methylation 450 | (TODO) -- GDC | methylation__HM450 |
| TCGA-LL-A442-01A-11D-A244-05 | Illumina Human Methylation 450 | (TODO) -- GDC | methylation__HM450 |
| TCGA-LL-A50Y-01A-11D-A268-05 | Illumina Human Methylation 450 | (TODO) -- GDC | methylation__HM450 |
| TCGA-LL-A5YL-01A-12D-A29O-05 | Illumina Human Methylation 450 | (TODO) -- GDC | methylation__HM450 |
| TCGA-LL-A5YM-01A-11D-A28C-05 | Illumina Human Methylation 450 | (TODO) -- GDC | methylation__HM450 |
| TCGA-LL-A5YN-01A-11D-A28C-05 | Illumina Human Methylation 450 | (TODO) -- GDC | methylation__HM450 |
| TCGA-LL-A5YO-01A-21D-A28C-05 | Illumina Human Methylation 450 | (TODO) -- GDC | methylation__HM450 |
| TCGA-LL-A5YP-01A-21D-A28C-05 | Illumina Human Methylation 450 | (TODO) -- GDC | methylation__HM450 |
| TCGA-LL-A6FP-01A-11D-A31V-05 | Illumina Human Methylation 450 | (TODO) -- GDC | methylation__HM450 |
| TCGA-LL-A6FQ-01A-11D-A31V-05 | Illumina Human Methylation 450 | (TODO) -- GDC | methylation__HM450 |
| TCGA-LL-A6FR-01A-12D-A31V-05 | Illumina Human Methylation 450 | (TODO) -- GDC | methylation__HM450 |
| TCGA-LL-A73Y-01A-11D-A33F-05 | Illumina Human Methylation 450 | (TODO) -- GDC | methylation__HM450 |
| TCGA-LL-A73Z-01A-11D-A32T-05 | Illumina Human Methylation 450 | (TODO) -- GDC | methylation__HM450 |
| TCGA-LL-A740-01A-21D-A32T-05 | Illumina Human Methylation 450 | (TODO) -- GDC | methylation__HM450 |
| TCGA-LL-A7SZ-01A-32D-A357-05 | Illumina Human Methylation 450 | (TODO) -- GDC | methylation__HM450 |
| TCGA-LL-A7T0-01A-31D-A357-05 | Illumina Human Methylation 450 | (TODO) -- GDC | methylation__HM450 |
| TCGA-LL-A8F5-01A-11D-A36K-05 | Illumina Human Methylation 450 | (TODO) -- GDC | methylation__HM450 |
| TCGA-LL-A9Q3-01A-11D-A41Q-05 | Illumina Human Methylation 450 | (TODO) -- GDC | methylation__HM450 |
| TCGA-LQ-A4E4-01A-11D-A268-05 | Illumina Human Methylation 450 | (TODO) -- GDC | methylation__HM450 |
| TCGA-MS-A51U-01A-31D-A268-05 | Illumina Human Methylation 450 | (TODO) -- GDC | methylation__HM450 |
| TCGA-OK-A5Q2-01A-11D-A27Y-05 | Illumina Human Methylation 450 | (TODO) -- GDC | methylation__HM450 |
| TCGA-OL-A5D6-01A-21D-A27Y-05 | Illumina Human Methylation 450 | (TODO) -- GDC | methylation__HM450 |
| TCGA-OL-A5D7-01A-11D-A27Y-05 | Illumina Human Methylation 450 | (TODO) -- GDC | methylation__HM450 |
| TCGA-OL-A5D8-01A-11D-A27Y-05 | Illumina Human Methylation 450 | (TODO) -- GDC | methylation__HM450 |
| TCGA-OL-A5DA-01A-11D-A27Y-05 | Illumina Human Methylation 450 | (TODO) -- GDC | methylation__HM450 |
| TCGA-OL-A5RU-01A-11D-A28C-05 | Illumina Human Methylation 450 | (TODO) -- GDC | methylation__HM450 |
| TCGA-OL-A5RV-01A-12D-A28C-05 | Illumina Human Methylation 450 | (TODO) -- GDC | methylation__HM450 |
| TCGA-OL-A5RW-01A-11D-A28C-05 | Illumina Human Methylation 450 | (TODO) -- GDC | methylation__HM450 |
| TCGA-OL-A5RX-01A-11D-A28C-05 | Illumina Human Methylation 450 | (TODO) -- GDC | methylation__HM450 |
| TCGA-OL-A5RY-01A-21D-A28C-05 | Illumina Human Methylation 450 | (TODO) -- GDC | methylation__HM450 |
| TCGA-OL-A5RZ-01A-11D-A28C-05 | Illumina Human Methylation 450 | (TODO) -- GDC | methylation__HM450 |
| TCGA-OL-A5S0-01A-11D-A28C-05 | Illumina Human Methylation 450 | (TODO) -- GDC | methylation__HM450 |
| TCGA-OL-A66H-01A-11D-A29O-05 | Illumina Human Methylation 450 | (TODO) -- GDC | methylation__HM450 |
| TCGA-OL-A66I-01A-21D-A29O-05 | Illumina Human Methylation 450 | (TODO) -- GDC | methylation__HM450 |
| TCGA-OL-A66J-01A-11D-A29O-05 | Illumina Human Methylation 450 | (TODO) -- GDC | methylation__HM450 |
| TCGA-OL-A66K-01A-11D-A29O-05 | Illumina Human Methylation 450 | (TODO) -- GDC | methylation__HM450 |
| TCGA-OL-A66L-01A-12D-A31V-05 | Illumina Human Methylation 450 | (TODO) -- GDC | methylation__HM450 |
| TCGA-OL-A66N-01A-12D-A31V-05 | Illumina Human Methylation 450 | (TODO) -- GDC | methylation__HM450 |
| TCGA-OL-A66O-01A-11D-A31V-05 | Illumina Human Methylation 450 | (TODO) -- GDC | methylation__HM450 |
| TCGA-OL-A66P-01A-11D-A31V-05 | Illumina Human Methylation 450 | (TODO) -- GDC | methylation__HM450 |
| TCGA-OL-A6VO-01A-12D-A33F-05 | Illumina Human Methylation 450 | (TODO) -- GDC | methylation__HM450 |
| TCGA-OL-A6VQ-01A-12D-A41Q-05 | Illumina Human Methylation 450 | (TODO) -- GDC | methylation__HM450 |
| TCGA-OL-A6VR-01A-32D-A33F-05 | Illumina Human Methylation 450 | (TODO) -- GDC | methylation__HM450 |
| TCGA-OL-A97C-01A-32D-A41Q-05 | Illumina Human Methylation 450 | (TODO) -- GDC | methylation__HM450 |
| TCGA-PE-A5DC-01A-12D-A27Y-05 | Illumina Human Methylation 450 | (TODO) -- GDC | methylation__HM450 |
| TCGA-PE-A5DD-01A-12D-A27Y-05 | Illumina Human Methylation 450 | (TODO) -- GDC | methylation__HM450 |
| TCGA-PE-A5DE-01A-11D-A27Y-05 | Illumina Human Methylation 450 | (TODO) -- GDC | methylation__HM450 |
| TCGA-S3-A6ZF-01A-32D-A32T-05 | Illumina Human Methylation 450 | (TODO) -- GDC | methylation__HM450 |
| TCGA-S3-A6ZG-01A-22D-A32T-05 | Illumina Human Methylation 450 | (TODO) -- GDC | methylation__HM450 |
| TCGA-S3-A6ZH-01A-22D-A32T-05 | Illumina Human Methylation 450 | (TODO) -- GDC | methylation__HM450 |
| TCGA-S3-AA0Z-01A-11D-A41Q-05 | Illumina Human Methylation 450 | (TODO) -- GDC | methylation__HM450 |
| TCGA-S3-AA10-01A-21D-A41Q-05 | Illumina Human Methylation 450 | (TODO) -- GDC | methylation__HM450 |
| TCGA-S3-AA11-01A-31D-A41Q-05 | Illumina Human Methylation 450 | (TODO) -- GDC | methylation__HM450 |
| TCGA-S3-AA12-01A-11D-A41Q-05 | Illumina Human Methylation 450 | (TODO) -- GDC | methylation__HM450 |
| TCGA-S3-AA14-01A-11D-A41Q-05 | Illumina Human Methylation 450 | (TODO) -- GDC | methylation__HM450 |
| TCGA-S3-AA15-01A-11D-A41Q-05 | Illumina Human Methylation 450 | (TODO) -- GDC | methylation__HM450 |
| TCGA-S3-AA17-01A-11D-A41Q-05 | Illumina Human Methylation 450 | (TODO) -- GDC | methylation__HM450 |
| TCGA-UL-AAZ6-01A-11D-A41Q-05 | Illumina Human Methylation 450 | (TODO) -- GDC | methylation__HM450 |
| TCGA-UU-A93S-01A-21D-A41Q-05 | Illumina Human Methylation 450 | (TODO) -- GDC | methylation__HM450 |
| TCGA-V7-A7HQ-01A-11D-A33F-05 | Illumina Human Methylation 450 | (TODO) -- GDC | methylation__HM450 |
| TCGA-W8-A86G-01A-21D-A36K-05 | Illumina Human Methylation 450 | (TODO) -- GDC | methylation__HM450 |
| TCGA-WT-AB41-01A-11D-A41Q-05 | Illumina Human Methylation 450 | (TODO) -- GDC | methylation__HM450 |
| TCGA-WT-AB44-01A-11D-A41Q-05 | Illumina Human Methylation 450 | (TODO) -- GDC | methylation__HM450 |
| TCGA-XX-A899-01A-11D-A36K-05 | Illumina Human Methylation 450 | (TODO) -- GDC | methylation__HM450 |
| TCGA-XX-A89A-01A-11D-A36K-05 | Illumina Human Methylation 450 | (TODO) -- GDC | methylation__HM450 |
| TCGA-Z7-A8R5-01A-42D-A41Q-05 | Illumina Human Methylation 450 | (TODO) -- GDC | methylation__HM450 |
| TCGA-Z7-A8R6-01A-11D-A41Q-05 | Illumina Human Methylation 450 | (TODO) -- GDC | methylation__HM450 |
The sample type short letter codes in the table above are defined in the following list.
-
TP: Primary Tumor
-
TR: Recurrent Tumor
-
TB: Primary Blood Derived Cancer - Peripheral Blood
-
TRBM: Recurrent Blood Derived Cancer - Bone Marrow
-
TAP: Additional - New Primary
-
TM: Metastatic
-
TAM: Additional Metastatic
-
THOC: Human Tumor Original Cells
-
TBM: Primary Blood Derived Cancer - Bone Marrow
-
NB: Blood Derived Normal
-
NT: Solid Tissue Normal
-
NBC: Buccal Cell Normal
-
NEBV: EBV Immortalized Normal
-
NBM: Bone Marrow Normal
-
CELLC: Control Analyte
-
TRB: Recurrent Blood Derived Cancer - Peripheral Blood
-
CELL: Cell Lines
-
XP: Primary Xenograft Tissue
-
XCL: Cell Line Derived Xenograft Tissue
Figure 1. Get High-res Image This figure depicts the distribution of available data on a per participant basis.
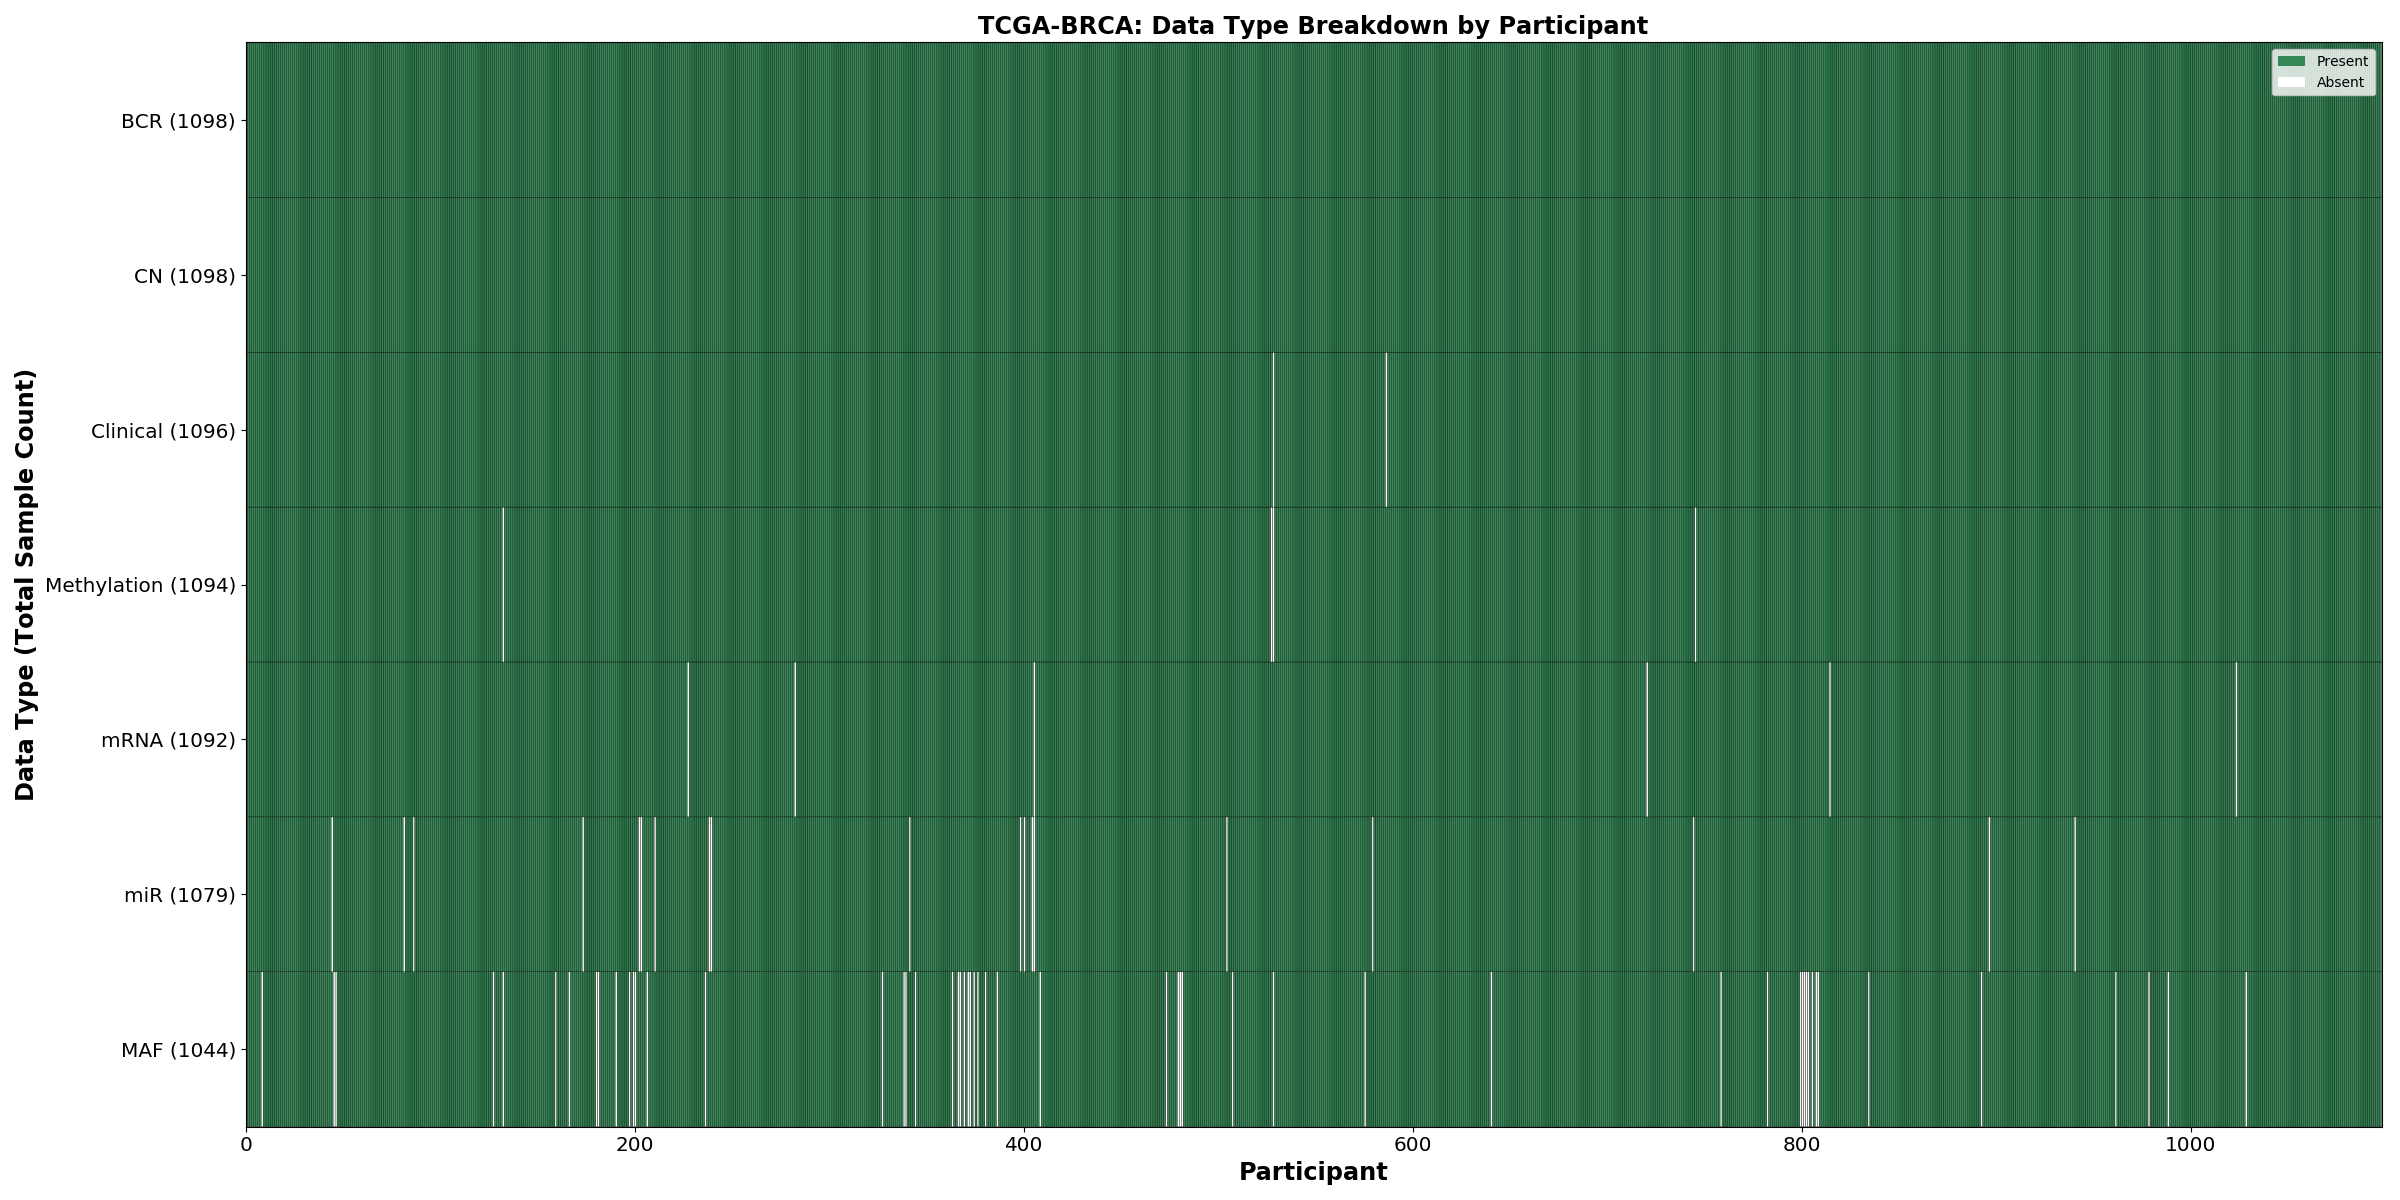