The role of general epigenetic mechanisms in carcinogenesis and tumor aggressiveness is well documented: CpG island hyper-methylation silences tumor suppressor genes, whereas hypo-methylation promotes the transcriptional activation of oncogenes and induces chromosomal instability.
This pipeline calculates and identifies correlations between DNA methylation and gene expression profiles using the available array technologies. Tumor-specific methylation changes are identified between the possible available platforms.
The top 25 and bottom 25 methylation probe/gene pairs are displayed.
Figure 1. Histogram of correlation values. n is the number of matched samples between Level 3 CpG site methylation and Level 3 gene expression arrays.
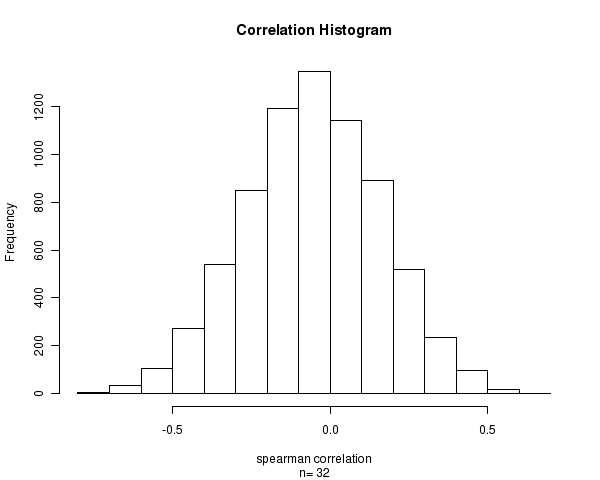
Table 1. Get Full Table Top 25 most negatively correlated methylation probe/gene pairs. Correlation Coefficient: See Methods & Data below. Expression Mean and Expression Variance: median and variance of gene expression levels of gene expression probes associated with the gene. Methylation Mean and Methylation Variance: median and variance of methylation levels of CpG methylation probes associated with the gene.
| Meth_Probe | Gene | Chromosome | Position | Correlation_Spearman | Pvalue_Spearman | Correlation_Pearson | Pvalue_Pearson | Expression_Mean | Methylation_Mean | Expression_Var | Methylation_Var |
| cg00916635 | PTPN22 | 1 | 114215835 | -0.7719941 | 1.267e-06 | -0.6963275 | 9.599e-06 | 7.241e-01 | 0.43829 | 0.94692 | 2.772e-02 |
| cg14385738 | PTPN22 | 1 | 114215863 | -0.7716276 | 1.278e-06 | -0.7057917 | 6.412e-06 | 7.241e-01 | 0.38224 | 0.94692 | 3.173e-02 |
| cg09643186 | GPX2 | 14 | 64479205 | -0.7536657 | 2.069e-06 | -0.7632233 | 3.78e-07 | -9.504e-01 | 0.74549 | 9.17721 | 3.453e-02 |
| cg03699566 | FOLR1 | 11 | 71578300 | -0.7456012 | 2.682e-06 | -0.7699809 | 2.573e-07 | 5.310e-01 | 0.49274 | 2.83223 | 2.354e-02 |
| cg18846362 | CA12 | 15 | 61461212 | -0.7379032 | 3.501e-06 | -0.4062126 | 0.02106 | -1.411e+00 | 0.06550 | 1.94318 | 1.668e-03 |
| cg22387994 | NAPA | 19 | 52710012 | -0.707478 | 1.091e-05 | -0.7544907 | 6.104e-07 | -1.482e-01 | 0.06683 | 0.28601 | 1.441e-04 |
| cg02659086 | GSTP1 | 11 | 67107552 | -0.6880499 | 2.249e-05 | -0.6618126 | 3.708e-05 | 6.158e-01 | 0.07756 | 0.58559 | 3.399e-04 |
| cg22266967 | S100P | 4 | 6746599 | -0.6865836 | 2.372e-05 | -0.7245699 | 2.745e-06 | -9.451e-02 | 0.59329 | 8.54109 | 3.503e-02 |
| cg11070419 | C4BPA | 1 | 205343833 | -0.6818182 | 2.816e-05 | -0.6831679 | 1.641e-05 | 3.988e+00 | 0.47692 | 3.75931 | 2.031e-02 |
| cg16907075 | UBQLN4 | 1 | 154289499 | -0.6682551 | 4.532e-05 | -0.6040266 | 0.0002516 | -4.940e-01 | 0.12659 | 0.30378 | 1.188e-03 |
| cg05508084 | ZNF667 | 19 | 61680210 | -0.6609238 | 5.813e-05 | -0.6735985 | 2.384e-05 | -1.280e+00 | 0.39223 | 1.02828 | 2.472e-02 |
| cg07717632 | C9orf167 | 9 | 139292452 | -0.6605572 | 5.885e-05 | -0.6555634 | 4.65e-05 | -8.044e-01 | 0.20680 | 0.82887 | 2.879e-02 |
| cg08209133 | SLC10A4 | 4 | 48180381 | -0.6590909 | 6.181e-05 | -0.6339264 | 9.803e-05 | -1.119e+00 | 0.31600 | 2.92918 | 1.421e-02 |
| cg17188169 | DDX43 | 6 | 74161109 | -0.6535924 | 7.413e-05 | -0.7163664 | 4.009e-06 | -4.442e-01 | 0.74468 | 4.72021 | 1.867e-02 |
| cg02599225 | C10orf57 | 10 | 81828453 | -0.6502933 | 8.253e-05 | -0.6027011 | 0.0002618 | 6.082e-01 | 0.04212 | 0.32766 | 9.046e-05 |
| cg21750589 | ZNF323 | 6 | 28429280 | -0.6499267 | 8.352e-05 | -0.677093 | 2.084e-05 | 2.058e+00 | 0.44278 | 1.77162 | 1.195e-02 |
| cg07311845 | TMLHE | X | 154495930 | -0.646261 | 9.397e-05 | -0.6418802 | 7.502e-05 | -7.284e-01 | 0.32665 | 1.01986 | 2.824e-02 |
| cg11261264 | PTPRH | 19 | 60412549 | -0.6458944 | 9.507e-05 | -0.6324125 | 0.0001031 | -1.434e+00 | 0.60350 | 2.06395 | 1.695e-02 |
| cg03289872 | ZNF667 | 19 | 61680914 | -0.6396628 | 0.0001158 | -0.6614748 | 3.754e-05 | -1.280e+00 | 0.35059 | 1.02828 | 3.235e-02 |
| cg01959004 | HYOU1 | 11 | 118433621 | -0.6381965 | 0.0001212 | -0.5200803 | 0.00228 | -6.504e-01 | 0.06973 | 0.24064 | 3.365e-04 |
| cg06489418 | FTSJ1 | X | 48219666 | -0.6378299 | 0.0001226 | -0.5875239 | 0.000407 | -1.005e+00 | 0.38259 | 0.14661 | 6.210e-02 |
| cg13840968 | CIDEB | 14 | 23850766 | -0.6370968 | 0.0001254 | -0.6729068 | 2.448e-05 | -4.414e-01 | 0.62768 | 0.23371 | 1.743e-02 |
| cg21614638 | DAPP1 | 4 | 100956844 | -0.6359971 | 0.0001297 | -0.6772374 | 2.072e-05 | 1.227e+00 | 0.29825 | 1.02760 | 1.472e-02 |
| cg11422541 | ADCY6 | 12 | 47468853 | -0.6315982 | 0.0001484 | -0.6698265 | 2.752e-05 | -8.628e-01 | 0.07736 | 0.27396 | 3.214e-04 |
| cg12699145 | TMC7 | 16 | 18903138 | -0.6304985 | 0.0001535 | -0.5322983 | 0.001713 | -4.621e-01 | 0.14460 | 0.41309 | 4.869e-03 |
| cg06458239 | ZNF549 | 19 | 62730385 | -0.6239003 | 0.0001871 | -0.705452 | 6.508e-06 | -5.965e-01 | 0.32036 | 1.27054 | 2.707e-02 |
Table 2. Get Full Table Top 25 most positively correlated methylation probe/gene pairs. Correlation Coefficient: See Methods & Data below. Expression Median and Expression Variance: median and variance of gene expression levels of gene expression probes associated with the gene. Methylation Median and Methylation Variance: median and variance of methylation levels of CpG methylation probes associated with the gene.
| Meth_Probe | Gene | Chromosome | Position | Correlation_Spearman | Pvalue_Spearman | Correlation_Pearson | Pvalue_Pearson | Expression_Mean | Methylation_Mean | Expression_Var | Methylation_Var |
| cg26583078 | SORBS2 | 4 | 187114772 | 0.6319648 | 0.0001468 | 0.5993724 | 0.0002889 | 8.146e-01 | 0.80333 | 2.13367 | 2.469e-03 |
| cg00436603 | CYP2E1 | 10 | 135190730 | 0.5975073 | 0.0003963 | 0.5456031 | 0.001239 | -5.259e-01 | 0.59384 | 1.05369 | 1.201e-02 |
| cg22901840 | DIRAS3 | 1 | 68285365 | 0.5920088 | 0.0004598 | 0.5275886 | 0.001915 | 1.320e+00 | 0.70996 | 2.26021 | 7.799e-03 |
| cg18780284 | SPRR1B | 1 | 151270946 | 0.5817449 | 0.0006028 | 0.4229204 | 0.01588 | 1.121e+00 | 0.47960 | 7.25310 | 2.547e-02 |
| cg24884084 | SPRR1B | 1 | 151269822 | 0.5736804 | 0.0007414 | 0.4247493 | 0.01539 | 1.121e+00 | 0.29119 | 7.25310 | 7.887e-03 |
| cg19273182 | PAPOLG | 2 | 60836921 | 0.5678152 | 0.000859 | 0.5986433 | 0.0002952 | 9.370e-01 | 0.05034 | 0.27105 | 6.858e-05 |
| cg15534366 | CDH4 | 20 | 59259602 | 0.5531525 | 0.001228 | 0.3466569 | 0.05193 | -1.967e+00 | 0.59725 | 1.77258 | 2.045e-02 |
| cg05023116 | NLRP5 | 19 | 61202704 | 0.5491202 | 0.001351 | 0.3285509 | 0.06636 | -7.700e-01 | 0.81268 | 1.02787 | 1.148e-02 |
| cg25426743 | HOXA3 | 7 | 27132628 | 0.5483871 | 0.001375 | 0.4402045 | 0.01169 | 2.665e-01 | 0.66837 | 0.84922 | 1.439e-02 |
| cg15522719 | GLS | 2 | 191453493 | 0.5480205 | 0.001386 | 0.5105346 | 0.002831 | 1.268e+00 | 0.05503 | 1.47706 | 1.828e-04 |
| cg21840599 | PAK2 | 3 | 197951851 | 0.545088 | 0.001485 | 0.5122777 | 0.002722 | -3.541e-01 | 0.05503 | 0.25810 | 6.361e-05 |
| cg12100077 | KLHL7 | 7 | 23111737 | 0.5370235 | 0.001788 | 0.5463793 | 0.001215 | -7.300e-02 | 0.05107 | 0.39013 | 1.015e-04 |
| cg03605761 | RNF126 | 19 | 614973 | 0.5326246 | 0.001975 | 0.5406935 | 0.001399 | -5.068e-01 | 0.53152 | 0.11351 | 1.869e-02 |
| cg05482722 | UTP14C | 13 | 51496176 | 0.5326246 | 0.001975 | 0.5663584 | 0.0007274 | 3.008e-01 | 0.89260 | 0.21766 | 4.337e-04 |
| cg16854606 | DAND5 | 19 | 12941743 | 0.5164956 | 0.002815 | 0.249777 | 0.168 | -2.280e+00 | 0.64868 | 0.52890 | 9.837e-03 |
| cg05492113 | TUB | 11 | 8016908 | 0.5124633 | 0.003068 | 0.5543312 | 0.0009946 | -1.355e+00 | 0.61429 | 0.45112 | 1.254e-02 |
| cg22587758 | SAA4 | 11 | 18214899 | 0.5095308 | 0.003265 | 0.524033 | 0.002081 | -2.439e+00 | 0.57614 | 1.74007 | 1.072e-02 |
| cg24167928 | UTP14C | 13 | 51496903 | 0.5043988 | 0.003635 | 0.4802893 | 0.0054 | 3.008e-01 | 0.84526 | 0.21766 | 1.172e-03 |
| cg13192155 | ERAS | X | 48570887 | 0.4978006 | 0.004164 | 0.4292578 | 0.01422 | 2.213e-02 | 0.70433 | 0.20540 | 8.803e-03 |
| cg24929834 | C22orf31 | 22 | 27787241 | 0.4978006 | 0.004164 | 0.3784687 | 0.03268 | 2.559e-01 | 0.74022 | 0.41334 | 5.409e-03 |
| cg15013019 | LYL1 | 19 | 13074451 | 0.4956012 | 0.004354 | 0.5338554 | 0.00165 | -8.045e-01 | 0.14989 | 0.20346 | 2.824e-03 |
| cg03641225 | DIRAS3 | 1 | 68285127 | 0.4952346 | 0.004387 | 0.4733473 | 0.006214 | 1.320e+00 | 0.43446 | 2.26021 | 1.460e-02 |
| cg00688421 | RAP1GDS1 | 4 | 99400943 | 0.4904692 | 0.004828 | 0.4708623 | 0.006529 | 3.565e-01 | 0.05743 | 0.27725 | 8.053e-05 |
| cg22238923 | DOK1 | 2 | 74635095 | 0.4893695 | 0.004935 | 0.3899629 | 0.02736 | 1.646e-01 | 0.04082 | 0.11821 | 3.732e-05 |
| cg27641018 | EPDR1 | 7 | 37926280 | 0.4827713 | 0.005623 | 0.4592119 | 0.008197 | 5.849e-01 | 0.68485 | 1.31019 | 1.166e-02 |
Methylation Array Platforms: Illumina Infinium HumanMethylation27, Illumina DNA Methylation OMA002, Illumina DNA Methylation OMA003
-
methylation file = /xchip/cga/gdac-prod/tcga-gdac-genepattern/jobResults/11347/PR_GDAC_GBM.methylation__humanmethylation27__jhu_usc_edu__Level_3__within_bioassay_data_set_function__data.data.txt
Gene Expression Platforms: Agilent 244K Gene Expression G4502A-07-1, Agilent 244K Gene Expression G4502A-07-2, Agilent 244K Gene Expression G4502A-07-3, Affymetrix Human Exon 1.0 ST Array, Affymetrix HT Human Genome U133 Array
-
gene expression file = /xchip/cga/gdac-prod/tcga-gdac-genepattern/jobResults/11323/PR_GDAC_GBM.transcriptome__ht_hg_u133a__broad_mit_edu__Level_3__gene_rma__data.data.txt
Level 3 methylation and gene expression arrays were paired on the basis of Entrez Gene ID concordance. The association between CpG site methylation and the level of expression of the corresponding genes was determined by calculating a correlation measure.
-
correlation measure = Spearman