This pipeline calculates clusters based on a consensus non-negative matrix factorization (NMF) clustering method [1],[2]. This pipeline has the following features:
-
Convert input data set to non-negativity matrix by column rank normalization.
-
Classify samples into consensus clusters.
-
Determine differentially expressed marker genes for each subtype.
Using the median data set, we filtered the data to 1500 most variable genes. Consensus NMF clustering of 33 samples and 1500 genes identified 3 subtypes with the stability of the clustering increasing for k = 2 to k = 8 and the average silhouette width calculation for selecting the robust clusters.
Figure 1. The consensus matrix after clustering shows 3 robust clusters with limited overlap between clusters.
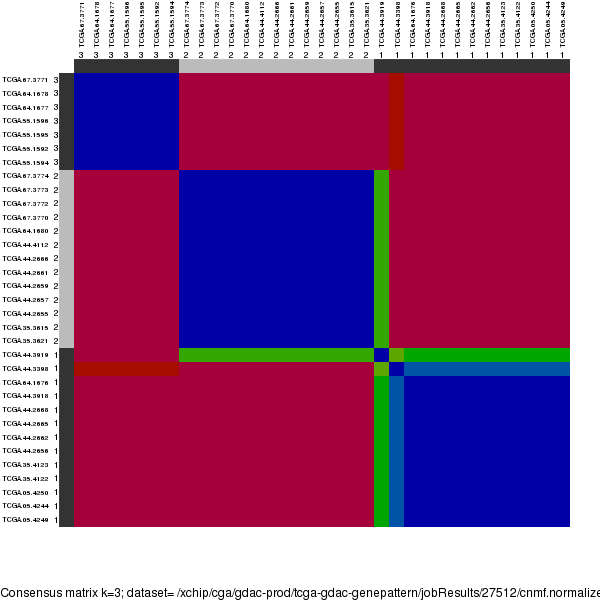
Figure 2. The correlation matrix also shows 3 robust clusters.
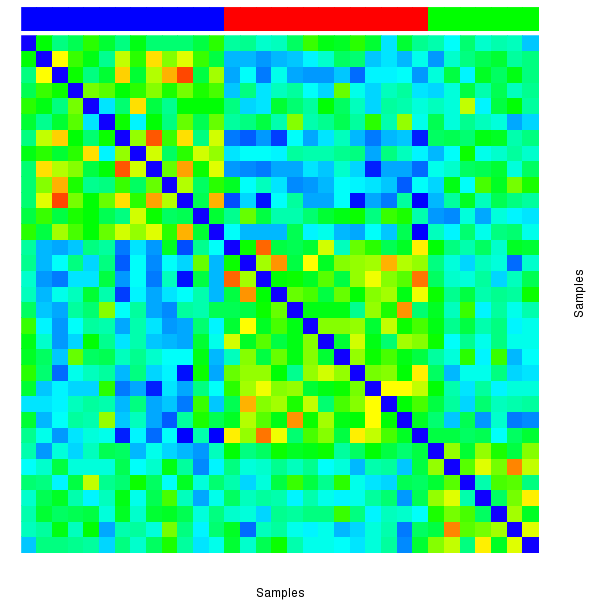
Figure 3. The robust cluster was pointed out by blue symbol (left panel) and the silhouette width of each sample in robust cluster was shown on right panel. Silhouette width is defined as the ratio of average distance of each sample to samples in the same cluster to the smallest distance to samples not in the same cluster. It was calculated and the average silhouette width for all samples within one cluster was shown below according to different clusters (left panel). If silhouette width is close to 1, it means that sample is well clustered. If silhouette width is close to -1, it means that sample is misclassified.

Table 1. Get Full Table List of samples with 3 subtypes and silhouette width.
| SampleName | cluster | silhouetteValue |
| TCGA-05-4244-01A-01R | 1 | 0.0320357278079223 |
| TCGA-05-4249-01A-01R | 1 | 0.204139793937613 |
| TCGA-05-4250-01A-01R | 1 | 0.196991308837182 |
| TCGA-35-4122-01A-01R | 1 | 0.180220623208531 |
| TCGA-35-4123-01A-01R | 1 | 0.0676494443219646 |
| TCGA-44-2656-01A-02R | 1 | 0.028106222182342 |
| TCGA-44-2662-01A-01R | 1 | 0.17591436112649 |
| TCGA-44-2665-01A-01R | 1 | 0.207310242231989 |
| TCGA-44-2668-01A-01R | 1 | 0.246558711363158 |
| TCGA-44-3398-01A-01R | 1 | 0.0790961282325475 |
Table 2. Get Full Table List of samples belonging to each cluster in different k clusters.
| SampleName | K=2 | K=3 | K=4 | K=5 | K=6 | K=7 | K=8 |
| TCGA-05-4244-01A-01R | 1 | 1 | 1 | 1 | 1 | 1 | 1 |
| TCGA-05-4249-01A-01R | 1 | 1 | 2 | 2 | 2 | 2 | 2 |
| TCGA-05-4250-01A-01R | 1 | 1 | 2 | 2 | 2 | 2 | 2 |
| TCGA-35-3615-01A-01R | 2 | 2 | 3 | 3 | 1 | 3 | 3 |
| TCGA-35-3621-01A-01R | 2 | 2 | 3 | 3 | 3 | 4 | 4 |
| TCGA-35-4122-01A-01R | 1 | 1 | 2 | 2 | 2 | 2 | 2 |
| TCGA-35-4123-01A-01R | 1 | 1 | 1 | 1 | 4 | 5 | 5 |
| TCGA-44-2655-01A-01R | 2 | 2 | 3 | 3 | 1 | 3 | 3 |
| TCGA-44-2656-01A-02R | 1 | 1 | 2 | 4 | 5 | 6 | 6 |
| TCGA-44-2657-01A-01R | 2 | 2 | 3 | 3 | 3 | 4 | 4 |
Samples most representative of the clusters, hereby called core samples were identified based on positive silhouette width [3], indicating higher similarity to their own class than to any other class member Figure 3. Core samples were used to select differentially expressed marker genes for each subtype by comparing the subclass versus the other subclasses, using student's t-test.
Table 3. Get Full Table List of marker genes with p<= 0.05 (The positive value of column difference means gene is upregulated in this subtype and vice versa).
| Composite.Element.REF | p | difference | q | subclass |
| CREB3L1 | 0.00311871711878183 | -0.652632043820533 | 0.0330844841025626 | 1 |
| RPS11 | 0.0440951412605347 | -0.380109928435919 | 0.135875764120045 | 1 |
| PRO0478 | 0.0403581619764974 | -0.310911851512841 | 0.129884760502941 | 1 |
| KLHL13 | 0.0066505287336032 | -0.84884165920515 | 0.04966624705257 | 1 |
| CADM4 | 0.0233748261705551 | -0.494820505358995 | 0.0964322516759307 | 1 |
| CFHR5 | 0.0109541028351617 | 0.667363853615364 | 0.0651483978113451 | 1 |
| GP1BA | 0.0105125024197547 | -0.61451012074361 | 0.0638746971752058 | 1 |
| MMP7 | 0.0431769434404591 | 0.739537186948695 | 0.134081470281395 | 1 |
| RTN1 | 0.00916826725502466 | 0.499779815153826 | 0.0592192077168403 | 1 |
| DTNBP1 | 0.00895112419089534 | -0.448849832282072 | 0.0586108072498288 | 1 |
Median-integrated mRNA expression data set The median based integrated expression data set was assembled using column-centered Level 3 data generated from Affymetrix HT-HG-U133A GeneChips, Affymetrix Human Exon 1.0 ST GeneChips, and custom designed Agilent 244k feature Gene Expression Microarrays. This data set included every gene and every samples that has been profiled on one of these platform. If a gene was only assayed on one platform, this measurement was used. If the gene was assayed on two platforms, the average of the two measurements was used; if the gene was assayed on all platforms the median measurement was used.
-
gene expression file = /xchip/cga/gdac-prod/tcga-gdac-genepattern/jobResults/27511/outputprefix.expclu.gct
Non-negative matrix factorization (NMF) is an unsupervised learning algorithm that has been shown to identify molecular patterns when applied to gene expression data [1],[2]. Rather than separating gene clusters based on distance computation, NMF detects contextdependent patterns of gene expression in complex biological systems.