This pipeline uses various statistical tests to identify mRNAs whose expression levels correlated to selected clinical features.
Testing the association between 17931 genes and one clinical feature across 59 samples, statistically thresholded by P value <= 0.05 and Q value <= 0.25
-
1 gene correlated to 'AGE'.
-
ALS2CR4
-
13 genes correlated to 'GENDER'.
-
RPS4Y1 , RPS4Y2 , DDX3Y , CYORF15A , EIF1AY , ...
-
2 genes correlated to 'PATHOLOGY.N'.
-
ARHGAP10 , ACLY
-
No genes correlated to 'Time to Death', and 'PATHOLOGY.T'.
Complete statistical result table is provided in Supplement Table 1
Table 1. Get Full Table This table shows the clinical features, statistical methods used, and the number of genes that are significantly associated with each clinical feature at P value <= 0.05 and Q value <= 0.25.
| Clinical feature | Statistical test | Significant genes | Associated with | Associated with | ||
| Time to Death | Cox regression test | N=0 | ||||
| AGE | Spearman correlation test | N=1 | older | N=1 | younger | N=0 |
| GENDER | t test | N=13 | male | N=12 | female | N=1 |
| PATHOLOGY T | Spearman correlation test | N=0 | ||||
| PATHOLOGY N | Spearman correlation test | N=2 | higher pN | N=2 | lower pN | N=0 |
Table 2. Basic characteristics of clinical feature: 'Time to Death'
| Time to Death | Duration (Months) | 0.4-122.4 (median=18.2) |
| censored | N = 33 | |
| event occurred | N = 25 | |
| Significant markers | N = 0 |
Table 3. Basic characteristics of clinical feature: 'AGE'
| AGE | Mean (SD) | 66.68 (9) |
| Significant markers | N = 1 | |
| pos. correlated | 1 | |
| neg. correlated | 0 |
Table 4. Get Full Table List of one gene significantly correlated to 'AGE' by Spearman correlation test
| SpearmanCorr | corrP | Q | |
| ALS2CR4 | 0.5576 | 4.488e-06 | 0.0805 |
Figure 1. Get High-res Image As an example, this figure shows the association of ALS2CR4 to 'AGE'. P value = 4.49e-06 with Spearman correlation analysis. The straight line presents the best linear regression.

Table 5. Basic characteristics of clinical feature: 'GENDER'
| GENDER | Labels | N |
| FEMALE | 20 | |
| MALE | 39 | |
| Significant markers | N = 13 | |
| Higher in MALE | 12 | |
| Higher in FEMALE | 1 |
Table 6. Get Full Table List of top 10 genes differentially expressed by 'GENDER'
| T | ttestP | Q | AUC | |
| RPS4Y1 | 25.98 | 2.772e-27 | 4.97e-23 | 1 |
| RPS4Y2 | 20.55 | 2.71e-24 | 4.86e-20 | 1 |
| DDX3Y | 17.96 | 1.069e-22 | 1.92e-18 | 1 |
| CYORF15A | 14.07 | 5.712e-20 | 1.02e-15 | 1 |
| EIF1AY | 14.94 | 5.555e-19 | 9.96e-15 | 1 |
| JARID1D | 13.64 | 3.143e-18 | 5.63e-14 | 0.9974 |
| UTY | 11.19 | 3.503e-15 | 6.28e-11 | 0.9859 |
| CYORF15B | 10.3 | 1.501e-14 | 2.69e-10 | 0.9731 |
| USP9Y | 8.64 | 7.223e-12 | 1.29e-07 | 0.9564 |
| ZFY | 8.61 | 1.007e-11 | 1.81e-07 | 0.9718 |
Figure 2. Get High-res Image As an example, this figure shows the association of RPS4Y1 to 'GENDER'. P value = 2.77e-27 with T-test analysis.
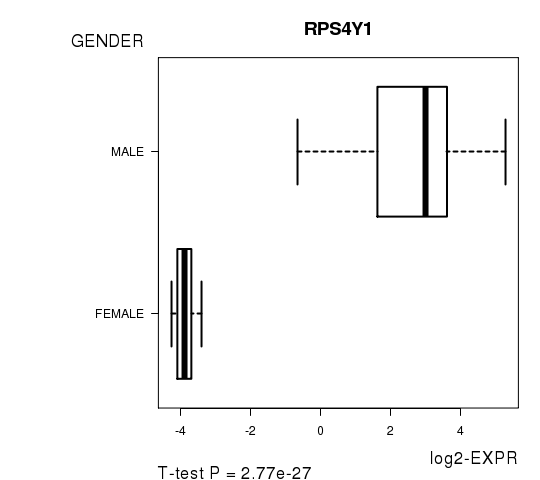
Table 7. Basic characteristics of clinical feature: 'PATHOLOGY.T'
| PATHOLOGY.T | Mean (SD) | 1.98 (0.71) |
| N | ||
| T1 | 12 | |
| T2 | 39 | |
| T3 | 5 | |
| T4 | 3 | |
| Significant markers | N = 0 |
Table 8. Basic characteristics of clinical feature: 'PATHOLOGY.N'
| PATHOLOGY.N | Mean (SD) | 0.37 (0.55) |
| N | ||
| N0 | 39 | |
| N1 | 18 | |
| N2 | 2 | |
| Significant markers | N = 2 | |
| pos. correlated | 2 | |
| neg. correlated | 0 |
Table 9. Get Full Table List of 2 genes significantly correlated to 'PATHOLOGY.N' by Spearman correlation test
| SpearmanCorr | corrP | Q | |
| ARHGAP10 | 0.5805 | 1.786e-06 | 0.032 |
| ACLY | 0.5652 | 3.101e-06 | 0.0556 |
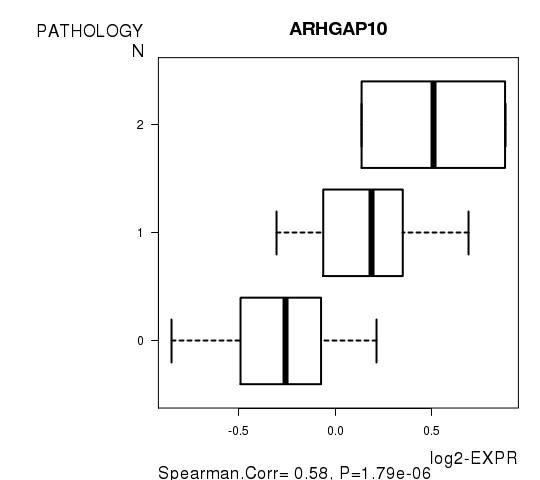
Figure 3. Get High-res Image As an example, this figure shows the association of ARHGAP10 to 'PATHOLOGY.N'. P value = 1.79e-06 with Spearman correlation analysis.
Input Data
-
Expresson data file = LUSC.medianexp.txt
-
Clinical data file = LUSC.clin.merged.picked.txt
-
Number of samples = 59
-
Number of genes = 17931
-
Number of clinical features = 5
-
p value cutoff = 0.05
-
q value cutoff = 0.25