This pipeline checks the correlation between cancer subtypes identified by different molecular portraits to selected clinical features.
Testing the association between 2 clustering variables and 5 clinical features across 59 samples, no significant finding detected with P value <= 0.05 and Q value <= 0.25.
-
CNMF clustering analysis on mRNA expression data identified 3 subtypes that are not correlated to any clinical features.
-
3 subtypes identified in current cancer cohort by 'mRNA HierClus consensus subtypes'. These subtypes are not correlated to any clinical features.
-
No gene mutations related to clinical features.
Table 1. Get Full Table Overview of the association results between 2 clustering variables and 5 clinical features. Shown in the table are P values (Q values). Thresholded by P value <= 0.05 and Q value <= 0.25, no significant finding detected.
|
Clinical Features |
mRNA CNMF subtypes |
mRNA HierClus consensus subtypes |
|
| Time to Death | survival |
0.0797 (0.637) |
0.1 (0.703) |
| AGE | continuous |
0.595 (1.00) |
0.648 (1.00) |
| GENDER | binary |
0.271 (1.00) |
0.577 (1.00) |
| PATHOLOGY T | multiclass(3) |
0.0682 (0.613) |
0.0486 (0.486) |
| PATHOLOGY N | binary |
0.22 (1.00) |
0.526 (1.00) |
Table 2. Get Full Table Description of clustering Variable #1: 'mRNA CNMF subtypes'
| Cluster Labels | 1 | 2 | 3 |
| Number of samples | 14 | 18 | 27 |
P value = 0.0797 (Kaplan-Meier), Q value = 0.64
Table 3. Clustering Variable #1: 'mRNA CNMF subtypes' versus Clinical Variable #1: 'Time to Death'
| N | nEvent | Duration Range (Median), Month | |
| ALL | 58 | 25 | 0.4 - 122.4 (18.2) |
| subtype1 | 13 | 5 | 0.4 - 122.4 (28.9) |
| subtype2 | 18 | 7 | 0.4 - 99.2 (26.5) |
| subtype3 | 27 | 13 | 0.4 - 82.2 (14.9) |
P value = 0.595 (ANOVA), Q value = 1
Table 4. Clustering Variable #1: 'mRNA CNMF subtypes' versus Clinical Variable #2: 'AGE'
| nSamples | Mean (Std.Dev) | |
| ALL | 59 | 66.7 (9.0) |
| subtype1 | 14 | 64.6 (8.4) |
| subtype2 | 18 | 66.9 (8.5) |
| subtype3 | 27 | 67.6 (9.7) |
P value = 0.271 (Chi-square), Q value = 1
Table 5. Clustering Variable #1: 'mRNA CNMF subtypes' versus Clinical Variable #3: 'GENDER'
| nSamples | FEMALE | MALE |
| ALL | 20 | 39 |
| subtype1 | 3 | 11 |
| subtype2 | 5 | 13 |
| subtype3 | 12 | 15 |
P value = 0.0682 (Chi-square), Q value = 0.61
Table 6. Clustering Variable #1: 'mRNA CNMF subtypes' versus Clinical Variable #4: 'PATHOLOGY.T'
| nSamples | T1 | T2 | T3+T4 |
| ALL | 12 | 39 | 8 |
| subtype1 | 1 | 9 | 4 |
| subtype2 | 2 | 13 | 3 |
| subtype3 | 9 | 17 | 1 |
P value = 0.22 (Chi-square), Q value = 1
Table 7. Clustering Variable #1: 'mRNA CNMF subtypes' versus Clinical Variable #5: 'PATHOLOGY.N'
| nSamples | N0 | N1+N2 |
| ALL | 39 | 20 |
| subtype1 | 10 | 4 |
| subtype2 | 9 | 9 |
| subtype3 | 20 | 7 |
Table 8. Get Full Table Description of clustering Variable #2: 'mRNA HierClus consensus subtypes'
| Cluster Labels | 1 | 2 | 3 |
| Number of samples | 18 | 17 | 24 |
P value = 0.1 (Kaplan-Meier), Q value = 0.7
Table 9. Clustering Variable #2: 'mRNA HierClus consensus subtypes' versus Clinical Variable #1: 'Time to Death'
| N | nEvent | Duration Range (Median), Month | |
| ALL | 58 | 25 | 0.4 - 122.4 (18.2) |
| subtype1 | 18 | 7 | 0.4 - 99.2 (26.5) |
| subtype2 | 16 | 7 | 0.4 - 122.4 (29.8) |
| subtype3 | 24 | 11 | 0.4 - 82.2 (12.4) |
P value = 0.648 (ANOVA), Q value = 1
Table 10. Clustering Variable #2: 'mRNA HierClus consensus subtypes' versus Clinical Variable #2: 'AGE'
| nSamples | Mean (Std.Dev) | |
| ALL | 59 | 66.7 (9.0) |
| subtype1 | 18 | 65.6 (7.7) |
| subtype2 | 17 | 68.4 (10.1) |
| subtype3 | 24 | 66.3 (9.3) |
P value = 0.577 (Chi-square), Q value = 1
Table 11. Clustering Variable #2: 'mRNA HierClus consensus subtypes' versus Clinical Variable #3: 'GENDER'
| nSamples | FEMALE | MALE |
| ALL | 20 | 39 |
| subtype1 | 5 | 13 |
| subtype2 | 5 | 12 |
| subtype3 | 10 | 14 |
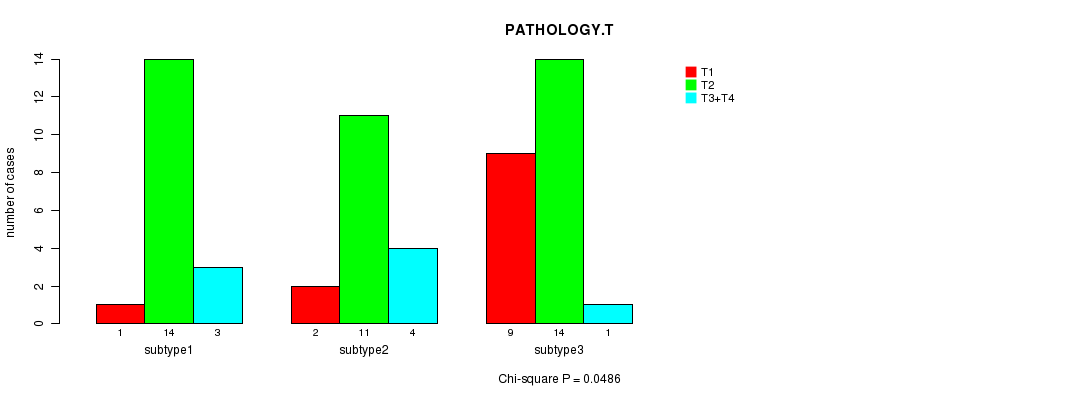
P value = 0.0486 (Chi-square), Q value = 0.49
Table 12. Clustering Variable #2: 'mRNA HierClus consensus subtypes' versus Clinical Variable #4: 'PATHOLOGY.T'
| nSamples | T1 | T2 | T3+T4 |
| ALL | 12 | 39 | 8 |
| subtype1 | 1 | 14 | 3 |
| subtype2 | 2 | 11 | 4 |
| subtype3 | 9 | 14 | 1 |
Figure 1. Get High-res Image Clustering Variable #2: 'mRNA HierClus consensus subtypes' versus Clinical Variable #4: 'PATHOLOGY.T'
P value = 0.526 (Chi-square), Q value = 1
Table 13. Clustering Variable #2: 'mRNA HierClus consensus subtypes' versus Clinical Variable #5: 'PATHOLOGY.N'
| nSamples | N0 | N1+N2 |
| ALL | 39 | 20 |
| subtype1 | 10 | 8 |
| subtype2 | 12 | 5 |
| subtype3 | 17 | 7 |
Input Data
-
Cluster data file = LUSC.mergedcluster.txt
-
Clinical data file = LUSC.clin.merged.picked.txt
-
Number of samples = 59
-
Number of clustering variables = 2
-
Number of filtered clinical features = 5
-
Minimum size criteria to remove small clusters = 3