This report serves to describe the mutational landscape and properties of a given individual set, as well as rank genes and genesets according to mutational significance. MutSig v1.5 was used to generate the results found in this report.
Working with individual set: GBM.
Number of patients in set: 276
The input for this pipeline is a set of individuals with the following files associated for each:
1. An annotated .maf file describing the mutations called for the respective individual, and their properties.
2. A .wig file that contains information about the coverage of the sample.
Significantly mutated genes (q ≤ 0.1): 251
Mutations seen in COSMIC: 450
Significantly mutated genes in COSMIC territory: 56
Genes with clustered mutations (&le 3 aa apart): 335
Significantly mutated genesets: 179
Significantly mutated genesets: (excluding sig. mutated genes): 0
Table 1. Get Full Table Table representing breakdown of mutations by type.
| type | count |
|---|---|
| De_novo_Start_InFrame | 6 |
| De_novo_Start_OutOfFrame | 11 |
| Frame_Shift_Del | 825 |
| Frame_Shift_Ins | 367 |
| In_Frame_Del | 328 |
| In_Frame_Ins | 36 |
| Indel | 1 |
| Missense_Mutation | 23424 |
| Nonsense_Mutation | 1795 |
| Nonstop_Mutation | 17 |
| Silent | 8876 |
| Splice_Site_DNP | 11 |
| Splice_Site_Del | 101 |
| Splice_Site_Ins | 28 |
| Splice_Site_ONP | 1 |
| Splice_Site_SNP | 481 |
| Start_Codon_Del | 2 |
| Start_Codon_Ins | 1 |
| Stop_Codon_Del | 2 |
| Total | 36313 |
Table 2. Get Full Table A breakdown of mutation rates per category discovered for this individual set.
| category | n | N | rate | rate_per_mb | relative_rate |
|---|---|---|---|---|---|
| *CpG->T | 8794 | 406970401 | 0.000022 | 22 | 6 |
| *Cp(A/C/T)->T | 3993 | 3448378213 | 1.2e-06 | 1.2 | 0.32 |
| C->(G/A) | 5881 | 3855348614 | 1.5e-06 | 1.5 | 0.42 |
| A->mut | 4753 | 3770634164 | 1.3e-06 | 1.3 | 0.35 |
| indel+null | 3854 | 7625982864 | 5.1e-07 | 0.51 | 0.14 |
| double_null | 162 | 7625982864 | 2.1e-08 | 0.021 | 0.0059 |
| Total | 27437 | 7625982864 | 3.6e-06 | 3.6 | 1 |
The x axis represents the samples. The y axis represents the exons, one row per exon, and they are sorted by average coverage across samples. For exons with exactly the same average coverage, they are sorted next by the %GC of the exon. (The secondary sort is especially useful for the zero-coverage exons at the bottom).
Figure 1.
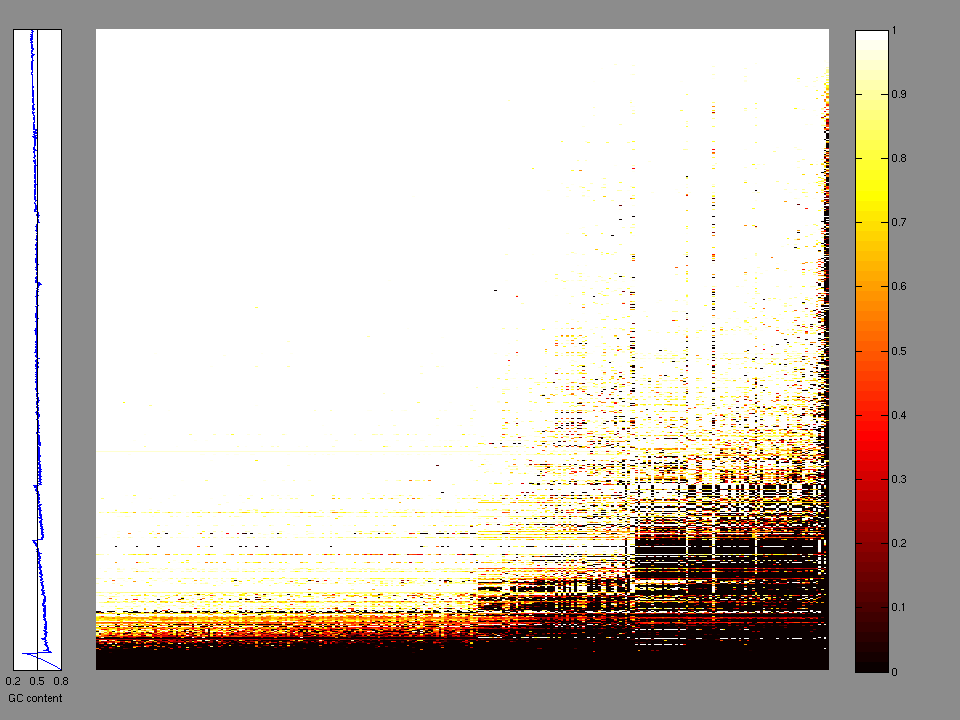
Figure 2.
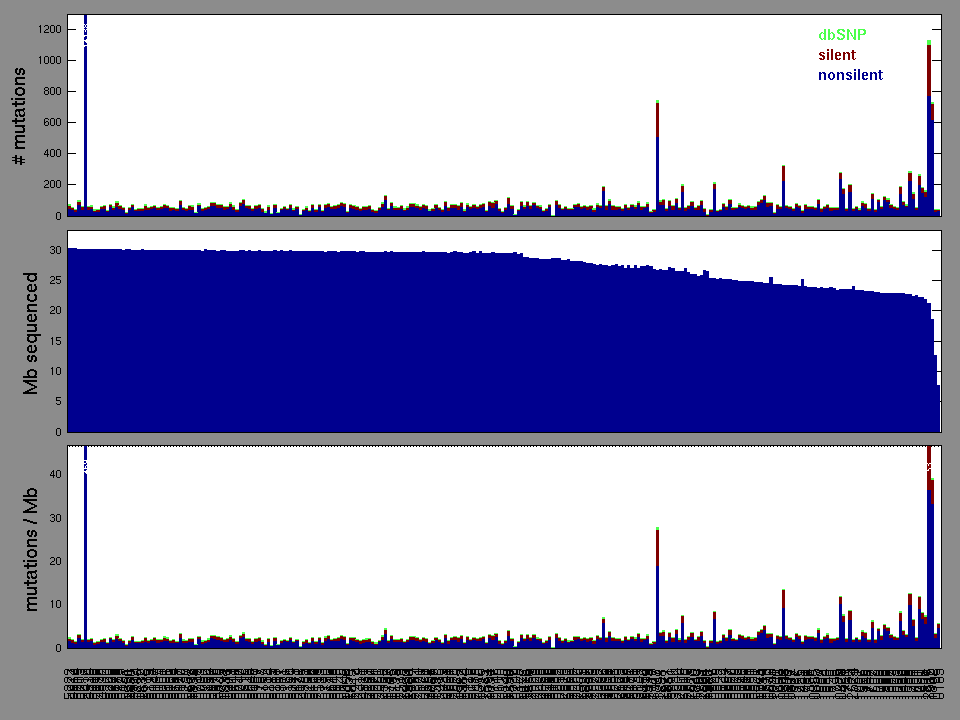
Table 3. Get Full Table A Ranked List of Significantly Mutated Genes. Number of significant genes found: 251. Number of genes displayed: 35
| rank | gene | description | N | n | npat | nsite | nsil | n1 | n2 | n3 | n4 | n5 | n6 | p | q |
|---|---|---|---|---|---|---|---|---|---|---|---|---|---|---|---|
| 1 | TP53 | tumor protein p53 | 344937 | 91 | 80 | 65 | 1 | 23 | 15 | 12 | 13 | 24 | 4 | 2.4e-15 | 4.4e-11 |
| 2 | EGFR | epidermal growth factor receptor (erythroblastic leukemia viral (v-erb-b) oncogene homolog, avian) | 1089173 | 58 | 54 | 26 | 5 | 9 | 21 | 23 | 5 | 0 | 0 | 8.6e-15 | 7.6e-11 |
| 3 | PTEN | phosphatase and tensin homolog (mutated in multiple advanced cancers 1) | 314597 | 80 | 79 | 65 | 0 | 7 | 19 | 8 | 11 | 35 | 0 | 2e-14 | 1.1e-10 |
| 4 | IDH1 | isocitrate dehydrogenase 1 (NADP+), soluble | 349470 | 15 | 15 | 2 | 0 | 14 | 0 | 1 | 0 | 0 | 0 | 4.6e-14 | 1.1e-10 |
| 5 | NF1 | neurofibromin 1 (neurofibromatosis, von Recklinghausen disease, Watson disease) | 2380799 | 34 | 25 | 32 | 1 | 2 | 5 | 3 | 4 | 14 | 6 | 5.1e-14 | 1.1e-10 |
| 6 | RB1 | retinoblastoma 1 (including osteosarcoma) | 722445 | 21 | 21 | 19 | 1 | 1 | 1 | 1 | 0 | 18 | 0 | 5.4e-14 | 1.1e-10 |
| 7 | KRTAP5-5 | keratin associated protein 5-5 | 181491 | 18 | 16 | 7 | 0 | 0 | 0 | 3 | 1 | 14 | 0 | 5.5e-14 | 1.1e-10 |
| 8 | SPTA1 | spectrin, alpha, erythrocytic 1 (elliptocytosis 2) | 2040988 | 30 | 26 | 28 | 5 | 12 | 4 | 6 | 1 | 7 | 0 | 5.5e-14 | 1.1e-10 |
| 9 | PIK3CA | phosphoinositide-3-kinase, catalytic, alpha polypeptide | 885302 | 19 | 19 | 17 | 1 | 3 | 5 | 2 | 7 | 2 | 0 | 5.9e-14 | 1.1e-10 |
| 10 | PIK3R1 | phosphoinositide-3-kinase, regulatory subunit 1 (alpha) | 642722 | 17 | 17 | 14 | 0 | 0 | 3 | 2 | 4 | 8 | 0 | 6e-14 | 1.1e-10 |
| 11 | MICALCL | MICAL C-terminal like | 537385 | 13 | 13 | 3 | 0 | 0 | 0 | 0 | 1 | 12 | 0 | 2.8e-13 | 4.5e-10 |
| 12 | RYR2 | ryanodine receptor 2 (cardiac) | 3381004 | 36 | 28 | 35 | 7 | 21 | 3 | 6 | 6 | 0 | 0 | 1.3e-10 | 1.9e-07 |
| 13 | FLG | filaggrin | 3183335 | 30 | 28 | 30 | 13 | 12 | 6 | 6 | 3 | 3 | 0 | 1.4e-09 | 1.8e-06 |
| 14 | MUC2 | mucin 2, oligomeric mucus/gel-forming | 1046521 | 22 | 15 | 19 | 4 | 9 | 1 | 7 | 4 | 1 | 0 | 1.5e-09 | 1.9e-06 |
| 15 | FOXRED1 | FAD-dependent oxidoreductase domain containing 1 | 345284 | 9 | 9 | 1 | 0 | 0 | 0 | 0 | 9 | 0 | 0 | 1.6e-09 | 1.9e-06 |
| 16 | MST1 | macrophage stimulating 1 (hepatocyte growth factor-like) | 467340 | 10 | 9 | 6 | 0 | 2 | 0 | 0 | 1 | 7 | 0 | 4e-09 | 4.5e-06 |
| 17 | HEATR7B2 | 934727 | 13 | 12 | 12 | 5 | 1 | 1 | 5 | 4 | 2 | 0 | 6.6e-09 | 6.9e-06 | |
| 18 | KEL | Kell blood group, metallo-endopeptidase | 619645 | 12 | 12 | 11 | 3 | 6 | 0 | 3 | 0 | 3 | 0 | 8.7e-09 | 8.6e-06 |
| 19 | GABRA6 | gamma-aminobutyric acid (GABA) A receptor, alpha 6 | 384256 | 9 | 9 | 8 | 0 | 2 | 1 | 5 | 1 | 0 | 0 | 3.9e-08 | 0.000037 |
| 20 | STAG2 | stromal antigen 2 | 1054509 | 11 | 11 | 11 | 0 | 0 | 1 | 3 | 0 | 7 | 0 | 7.2e-08 | 0.000064 |
| 21 | COMMD4 | COMM domain containing 4 | 147026 | 6 | 6 | 1 | 0 | 0 | 0 | 6 | 0 | 0 | 0 | 9.9e-08 | 0.000084 |
| 22 | CRYBA2 | crystallin, beta A2 | 136089 | 6 | 6 | 3 | 1 | 0 | 0 | 5 | 1 | 0 | 0 | 1.1e-07 | 0.000085 |
| 23 | RIMS2 | regulating synaptic membrane exocytosis 2 | 1148237 | 16 | 14 | 14 | 1 | 7 | 1 | 3 | 1 | 4 | 0 | 1.1e-07 | 0.000085 |
| 24 | CALN1 | calneuron 1 | 187028 | 9 | 9 | 8 | 1 | 8 | 0 | 1 | 0 | 0 | 0 | 1.3e-07 | 0.000094 |
| 25 | IL17RA | interleukin 17 receptor A | 452882 | 9 | 9 | 5 | 1 | 1 | 0 | 2 | 6 | 0 | 0 | 1.5e-07 | 0.00011 |
| 26 | POTEB | 448989 | 9 | 9 | 9 | 1 | 2 | 1 | 3 | 3 | 0 | 0 | 2.4e-07 | 0.00017 | |
| 27 | CNTNAP2 | contactin associated protein-like 2 | 1094783 | 16 | 15 | 16 | 7 | 10 | 1 | 4 | 1 | 0 | 0 | 2.5e-07 | 0.00017 |
| 28 | HCN1 | hyperpolarization activated cyclic nucleotide-gated potassium channel 1 | 650787 | 11 | 10 | 11 | 5 | 3 | 0 | 4 | 2 | 2 | 0 | 3.9e-07 | 0.00025 |
| 29 | CDH18 | cadherin 18, type 2 | 661503 | 12 | 10 | 12 | 3 | 3 | 4 | 2 | 1 | 2 | 0 | 4.2e-07 | 0.00026 |
| 30 | DNASE1L1 | deoxyribonuclease I-like 1 | 189681 | 6 | 6 | 2 | 1 | 1 | 0 | 5 | 0 | 0 | 0 | 6.1e-07 | 0.00036 |
| 31 | CEACAM16 | carcinoembryonic antigen-related cell adhesion molecule 16 | 186452 | 7 | 7 | 3 | 0 | 1 | 0 | 6 | 0 | 0 | 0 | 6.3e-07 | 0.00037 |
| 32 | FAM83H | family with sequence similarity 83, member H | 426683 | 12 | 10 | 10 | 2 | 8 | 0 | 0 | 4 | 0 | 0 | 6.8e-07 | 0.00038 |
| 33 | C9orf150 | chromosome 9 open reading frame 150 | 144707 | 6 | 6 | 3 | 0 | 1 | 1 | 0 | 0 | 4 | 0 | 7.1e-07 | 0.00038 |
| 34 | OR5D13 | olfactory receptor, family 5, subfamily D, member 13 | 260757 | 8 | 7 | 8 | 1 | 3 | 1 | 0 | 3 | 1 | 0 | 7.2e-07 | 0.00038 |
| 35 | SLCO6A1 | solute carrier organic anion transporter family, member 6A1 | 579033 | 10 | 10 | 10 | 4 | 4 | 1 | 2 | 3 | 0 | 0 | 7.6e-07 | 0.00039 |
Note:
N - number of sequenced bases in this gene across the individual set.
n - number of (nonsilent) mutations in this gene across the individual set.
npat - number of patients (individuals) with at least one nonsilent mutation.
nsite - number of unique sites having a non-silent mutation.
nsil - number of silent mutations in this gene across the individual set.
n1 - number of nonsilent mutations of type: *CpG->T .
n2 - number of nonsilent mutations of type: *Cp(A/C/T)->T .
n3 - number of nonsilent mutations of type: C->(G/A) .
n4 - number of nonsilent mutations of type: A->mut .
n5 - number of nonsilent mutations of type: indel+null .
null - mutation category that includes nonsense, frameshift, splice-site mutations
p_classic = p-value for the observed amount of nonsilent mutations being elevated in this gene
p_ns_s = p-value for the observed nonsilent/silent ratio being elevated in this gene
p = p-value (overall)
q = q-value, False Discovery Rate (Benjamini-Hochberg procedure)
In this analysis, COSMIC is used as a filter to increase power by restricting the territory of each gene. Cosmic version: v48.
Table 4. Get Full Table Significantly mutated genes (COSMIC territory only). To access the database please go to: COSMIC. Number of significant genes found: 56. Number of genes displayed: 10
| rank | gene | description | n | cos | n_cos | N_cos | cos_ev | p | q |
|---|---|---|---|---|---|---|---|---|---|
| 1 | IDH1 | isocitrate dehydrogenase 1 (NADP+), soluble | 15 | 3 | 15 | 828 | 22380 | 0 | 0 |
| 2 | PIK3R1 | phosphoinositide-3-kinase, regulatory subunit 1 (alpha) | 17 | 33 | 9 | 9108 | 20 | 0 | 0 |
| 3 | EGFR | epidermal growth factor receptor (erythroblastic leukemia viral (v-erb-b) oncogene homolog, avian) | 58 | 218 | 46 | 60168 | 640 | 0 | 0 |
| 4 | TP53 | tumor protein p53 | 91 | 823 | 91 | 227148 | 26340 | 0 | 0 |
| 5 | PTEN | phosphatase and tensin homolog (mutated in multiple advanced cancers 1) | 80 | 728 | 79 | 200928 | 2714 | 0 | 0 |
| 6 | PIK3CA | phosphoinositide-3-kinase, catalytic, alpha polypeptide | 19 | 184 | 15 | 50784 | 3911 | 0 | 0 |
| 7 | NF1 | neurofibromin 1 (neurofibromatosis, von Recklinghausen disease, Watson disease) | 34 | 285 | 12 | 78660 | 21 | 0 | 0 |
| 8 | RB1 | retinoblastoma 1 (including osteosarcoma) | 21 | 267 | 11 | 73692 | 30 | 0 | 0 |
| 9 | PTPN11 | protein tyrosine phosphatase, non-receptor type 11 (Noonan syndrome 1) | 6 | 31 | 4 | 8556 | 16 | 3.6e-08 | 0.000018 |
| 10 | BRAF | v-raf murine sarcoma viral oncogene homolog B1 | 6 | 88 | 5 | 24288 | 42058 | 3.9e-08 | 0.000018 |
Note:
n - number of (nonsilent) mutations in this gene across the individual set.
cos = number of unique mutated sites in this gene in COSMIC
n_cos = overlap between n and cos.
N_cos = number of individuals times cos.
cos_ev = total evidence: number of reports in COSMIC for mutations seen in this gene.
p = p-value for seeing the observed amount of overlap in this gene)
q = q-value, False Discovery Rate (Benjamini-Hochberg procedure)
Table 5. Get Full Table Genes with Clustered Mutations
| num | gene | desc | n | mindist | npairs3 | npairs12 |
|---|---|---|---|---|---|---|
| 2963 | EGFR | epidermal growth factor receptor (erythroblastic leukemia viral (v-erb-b) oncogene homolog, avian) | 58 | 0 | 172 | 195 |
| 10104 | TP53 | tumor protein p53 | 91 | 0 | 133 | 411 |
| 4499 | IDH1 | isocitrate dehydrogenase 1 (NADP+), soluble | 15 | 0 | 105 | 105 |
| 7900 | PTEN | phosphatase and tensin homolog (mutated in multiple advanced cancers 1) | 80 | 0 | 61 | 155 |
| 3606 | FOXRED1 | FAD-dependent oxidoreductase domain containing 1 | 9 | 0 | 36 | 36 |
| 5436 | LPHN1 | latrophilin 1 | 10 | 0 | 16 | 18 |
| 878 | BBS1 | Bardet-Biedl syndrome 1 | 8 | 0 | 15 | 15 |
| 2202 | COL5A3 | collagen, type V, alpha 3 | 11 | 0 | 15 | 15 |
| 2215 | COMMD4 | COMM domain containing 4 | 6 | 0 | 15 | 15 |
| 2317 | CRYBA2 | crystallin, beta A2 | 6 | 0 | 15 | 15 |
Note:
n - number of mutations in this gene in the individual set.
mindist - distance (in aa) between closest pair of mutations in this gene
npairs3 - how many pairs of mutations are within 3 aa of each other.
npairs12 - how many pairs of mutations are within 12 aa of each other.
Table 6. Get Full Table A Ranked List of Significantly Mutated Genesets. (Source: MSigDB GSEA Cannonical Pathway Set).Number of significant genesets found: 179. Number of genesets displayed: 10
| rank | geneset | description | genes | N_genes | mut_tally | N | n | npat | nsite | nsil | n1 | n2 | n3 | n4 | n5 | n6 | p | q |
|---|---|---|---|---|---|---|---|---|---|---|---|---|---|---|---|---|---|---|
| 1 | SIG_INSULIN_RECEPTOR_PATHWAY_IN_CARDIAC_MYOCYTES | Genes related to the insulin receptor pathway | AKT1, AKT2, AKT3, BRD4, CAP1, CBL, CDC42, CDKN2A, F2RL2, FLOT1, FLOT2, FOXO1A, GRB2, GSK3A, GSK3B, IGFBP1, INPPL1, IRS1, IRS2, IRS4, LNPEP, MAPK1, MAPK3, PARD3, PARD6A, PDK1, PIK3CA, PIK3CD, PIK3R1, PPYR1, PSCD3, PTEN, PTPN1, RAF1, RPS6KA1, RPS6KA2, RPS6KA3, RPS6KB1, SERPINB6, SFN, SHC1, SLC2A4, SORBS1, SOS1, SOS2, YWHAB, YWHAE, YWHAG, YWHAH, YWHAQ, YWHAZ | 48 | AKT1(1), AKT2(1), AKT3(1), BRD4(7), CBL(1), CDKN2A(3), FLOT1(2), GSK3B(1), IGFBP1(1), INPPL1(4), IRS1(4), IRS4(3), LNPEP(2), MAPK1(3), MAPK3(2), PARD3(2), PARD6A(1), PIK3CA(19), PIK3CD(2), PIK3R1(17), PPYR1(2), PTEN(80), PTPN1(1), RPS6KA2(2), RPS6KA3(5), RPS6KB1(1), SERPINB6(1), SLC2A4(3), SORBS1(2), SOS1(1), SOS2(4), YWHAB(1), YWHAE(2) | 23158627 | 182 | 128 | 162 | 32 | 30 | 35 | 21 | 36 | 60 | 0 | <1.00e-15 | <1.28e-13 |
| 2 | ARFPATHWAY | Cyclin-dependent kinase inhibitor 2A is a tumor suppressor that induces G1 arrest and can activate the p53 pathway, leading to G2/M arrest. | ABL1, CDKN2A, E2F1, MDM2, MYC, PIK3CA, PIK3R1, POLR1A, POLR1B, POLR1C, POLR1D, RAC1, RB1, TBX2, TP53, TWIST1 | 16 | ABL1(1), CDKN2A(3), MDM2(1), PIK3CA(19), PIK3R1(17), POLR1A(3), POLR1B(1), POLR1C(1), RB1(21), TBX2(1), TP53(91) | 8040458 | 159 | 113 | 126 | 13 | 28 | 28 | 20 | 25 | 54 | 4 | <1.00e-15 | <1.28e-13 |
| 3 | ST_PHOSPHOINOSITIDE_3_KINASE_PATHWAY | The phosphoinositide-3 kinase pathway produces the lipid second messenger PIP3 and regulates cell growth, survival, and movement. | A1BG, AKT1, AKT2, AKT3, BAD, BTK, CDKN2A, CSL4, DAF, DAPP1, FOXO1A, GRB2, GSK3A, GSK3B, IARS, IGFBP1, INPP5D, P14, PDK1, PIK3CA, PPP1R13B, PSCD3, PTEN, RPS6KA1, RPS6KA2, RPS6KA3, RPS6KB1, SFN, SHC1, SOS1, SOS2, TEC, YWHAB, YWHAE, YWHAG, YWHAH, YWHAQ, YWHAZ | 33 | A1BG(2), AKT1(1), AKT2(1), AKT3(1), BTK(1), CDKN2A(3), GSK3B(1), IARS(4), IGFBP1(1), INPP5D(6), PIK3CA(19), PTEN(80), RPS6KA2(2), RPS6KA3(5), RPS6KB1(1), SOS1(1), SOS2(4), TEC(5), YWHAB(1), YWHAE(2) | 14274206 | 141 | 109 | 124 | 17 | 23 | 35 | 15 | 23 | 45 | 0 | <1.00e-15 | <1.28e-13 |
| 4 | P53HYPOXIAPATHWAY | Hypoxia induces p53 accumulation and consequent apoptosis with p53-mediated cell cycle arrest, which is present under conditions of DNA damage. | ABCB1, AKT1, ATM, BAX, CDKN1A, CPB2, CSNK1A1, CSNK1D, FHL2, GADD45A, HIC1, HIF1A, HSPA1A, HSPCA, IGFBP3, MAPK8, MDM2, NFKBIB, NQO1, TP53 | 17 | ABCB1(4), AKT1(1), ATM(7), CDKN1A(1), CPB2(1), FHL2(1), HIF1A(1), IGFBP3(1), MDM2(1), NFKBIB(1), TP53(91) | 8064819 | 110 | 83 | 84 | 5 | 29 | 22 | 13 | 16 | 26 | 4 | 2.44e-15 | 1.28e-13 |
| 5 | APOPTOSIS_GENMAPP | APAF1, BAK1, BCL2L7P1, BAX, BCL2, BCL2L1, BID, BIRC2, BIRC3, BIRC4, CASP2, CASP3, CASP6, CASP7, CASP8, CASP9, CYCS, FADD, FAS, FASLG, GZMB, IKBKG, JUN, MAP2K4, MAP3K1, MAP3K14, MAPK10, MCL1, MDM2, MYC, NFKB1, NFKBIA, PARP1, PRF1, RELA, RIPK1, TNF, TNFRSF1A, TNFRSF1B, TNFSF10, TP53, TRADD, TRAF1, TRAF2 | 41 | APAF1(1), BCL2(3), BID(4), BIRC2(1), BIRC3(1), CASP2(1), CASP6(1), GZMB(3), MAP3K1(5), MAP3K14(2), MDM2(1), NFKB1(1), NFKBIA(2), PARP1(3), PRF1(3), RIPK1(1), TNFRSF1A(2), TNFRSF1B(2), TNFSF10(5), TP53(91), TRAF1(1), TRAF2(2) | 15017861 | 136 | 96 | 107 | 18 | 31 | 20 | 25 | 25 | 31 | 4 | 2.78e-15 | 1.28e-13 | |
| 6 | ERBB3PATHWAY | Neuregulins bind to the receptor tyrosine kinases ErbB3 and ErbB4, surface-localized receptors whose overexpression induces tumor formation. | EGF, EGFR, ERBB3, NRG1, UBE2D1 | 5 | EGF(3), EGFR(58), ERBB3(4), NRG1(4) | 4194729 | 69 | 59 | 37 | 7 | 13 | 21 | 26 | 8 | 1 | 0 | 4.11e-15 | 1.28e-13 |
| 7 | PMLPATHWAY | Ring-shaped PML nuclear bodies regulate transcription and are required co-activators in p53- and DAXX-mediated apoptosis. | CREBBP, DAXX, HRAS, PAX3, PML, PRAM-1, RARA, RB1, SIRT1, SP100, TNF, TNFRSF1A, TNFRSF1B, TNFRSF6, TNFSF6, TP53, UBL1 | 13 | CREBBP(8), DAXX(4), PAX3(3), PML(2), RARA(5), RB1(21), SIRT1(2), SP100(3), TNFRSF1A(2), TNFRSF1B(2), TP53(91) | 7623942 | 143 | 102 | 112 | 11 | 31 | 21 | 20 | 21 | 46 | 4 | 4.55e-15 | 1.28e-13 |
| 8 | G2PATHWAY | Activated Cdc2-cyclin B kinase regulates the G2/M transition; DNA damage stimulates the DNA-PK/ATM/ATR kinases, which inactivate Cdc2. | ATM, ATR, BRCA1, CCNB1, CDC2, CDC25A, CDC25B, CDC25C, CDC34, CDKN1A, CDKN2D, CHEK1, CHEK2, EP300, GADD45A, MDM2, MYT1, PLK, PRKDC, RPS6KA1, TP53, WEE1, YWHAH, YWHAQ | 22 | ATM(7), ATR(9), BRCA1(4), CDC25B(1), CDKN1A(1), CDKN2D(1), CHEK1(5), EP300(6), MDM2(1), MYT1(7), PRKDC(5), TP53(91) | 16932144 | 138 | 96 | 112 | 10 | 34 | 23 | 22 | 21 | 32 | 6 | 4.88e-15 | 1.28e-13 |
| 9 | SA_PTEN_PATHWAY | PTEN is a tumor suppressor that dephosphorylates the lipid messenger phosphatidylinositol triphosphate. | AKT1, AKT2, AKT3, BPNT1, GRB2, ILK, MAPK1, MAPK3, PDK1, PIK3CA, PIK3CD, PIP3-E, PTEN, PTK2B, RBL2, SHC1, SOS1 | 16 | AKT1(1), AKT2(1), AKT3(1), BPNT1(1), ILK(2), MAPK1(3), MAPK3(2), PIK3CA(19), PIK3CD(2), PTEN(80), PTK2B(1), RBL2(1), SOS1(1) | 8079012 | 115 | 104 | 98 | 7 | 14 | 26 | 13 | 24 | 38 | 0 | 5.55e-15 | 1.28e-13 |
| 10 | HSA04010_MAPK_SIGNALING_PATHWAY | Genes involved in MAPK signaling pathway | ACVR1B, ACVR1C, AKT1, AKT2, AKT3, ARRB1, ARRB2, ATF2, ATF4, BDNF, BRAF, CACNA1A, CACNA1B, CACNA1C, CACNA1D, CACNA1E, CACNA1F, CACNA1G, CACNA1H, CACNA1I, CACNA1S, CACNA2D1, CACNA2D2, CACNA2D3, CACNA2D4, CACNB1, CACNB2, CACNB3, CACNB4, CACNG1, CACNG2, CACNG3, CACNG4, CACNG5, CACNG6, CACNG7, CACNG8, CASP3, CD14, CDC25B, CDC42, CHP, CHUK, CRK, CRKL, DAXX, DDIT3, DUSP1, DUSP10, DUSP14, DUSP16, DUSP2, DUSP3, DUSP4, DUSP5, DUSP6, DUSP7, DUSP8, DUSP9, ECSIT, EGF, EGFR, ELK1, ELK4, EVI1, FAS, FASLG, FGF1, FGF10, FGF11, FGF12, FGF13, FGF14, FGF16, FGF17, FGF18, FGF19, FGF2, FGF20, FGF21, FGF22, FGF23, FGF3, FGF4, FGF5, FGF6, FGF7, FGF8, FGF9, FGFR1, FGFR2, FGFR3, FGFR4, FLNA, FLNB, FLNC, FOS, GADD45A, GADD45B, GADD45G, GNA12, GNG12, GRB2, HRAS, IKBKB, IKBKG, IL1A, IL1B, IL1R1, IL1R2, JUN, JUND, KRAS, LOC653852, MAP2K1, MAP2K1IP1, MAP2K2, MAP2K3, MAP2K4, MAP2K5, MAP2K6, MAP2K7, MAP3K1, MAP3K10, MAP3K12, MAP3K13, MAP3K14, MAP3K2, MAP3K3, MAP3K4, MAP3K5, MAP3K6, MAP3K7, MAP3K7IP1, MAP3K7IP2, MAP3K8, MAP4K1, MAP4K2, MAP4K3, MAP4K4, MAPK1, MAPK10, MAPK11, MAPK12, MAPK13, MAPK14, MAPK3, MAPK7, MAPK8, MAPK8IP1, MAPK8IP2, MAPK8IP3, MAPK9, MAPKAPK2, MAPKAPK3, MAPKAPK5, MAPT, MAX, MEF2C, MKNK1, MKNK2, MOS, MRAS, MYC, NF1, NFATC2, NFATC4, NFKB1, NFKB2, NGFB, NLK, NR4A1, NRAS, NTF3, NTF5, NTRK1, NTRK2, PAK1, PAK2, PDGFA, PDGFB, PDGFRA, PDGFRB, PLA2G10, PLA2G12A, PLA2G12B, PLA2G1B, PLA2G2A, PLA2G2D, PLA2G2E, PLA2G2F, PLA2G3, PLA2G4A, PLA2G5, PLA2G6, PPM1A, PPM1B, PPP3CA, PPP3CB, PPP3CC, PPP3R1, PPP3R2, PPP5C, PRKACA, PRKACB, PRKACG, PRKCA, PRKCB1, PRKCG, PRKX, PRKY, PTPN5, PTPN7, PTPRR, RAC1, RAC2, RAC3, RAF1, RAP1A, RAP1B, RAPGEF2, RASA1, RASA2, RASGRF1, RASGRF2, RASGRP1, RASGRP2, RASGRP3, RASGRP4, RPS6KA1, RPS6KA2, RPS6KA3, RPS6KA4, RPS6KA5, RPS6KA6, RRAS, RRAS2, SOS1, SOS2, SRF, STK3, STK4, STMN1, TAOK1, TAOK2, TAOK3, TGFB1, TGFB2, TGFB3, TGFBR1, TGFBR2, TNF, TNFRSF1A, TP53, TRAF2, TRAF6, ZAK | 246 | ACVR1C(2), AKT1(1), AKT2(1), AKT3(1), ATF2(1), ATF4(1), BDNF(1), BRAF(6), CACNA1A(4), CACNA1B(7), CACNA1C(5), CACNA1D(9), CACNA1E(9), CACNA1F(10), CACNA1G(6), CACNA1H(9), CACNA1I(5), CACNA1S(12), CACNA2D1(8), CACNA2D2(1), CACNA2D3(3), CACNA2D4(1), CACNB2(1), CACNB3(1), CACNG1(1), CACNG2(1), CACNG3(4), CACNG6(1), CACNG7(1), CACNG8(1), CD14(2), CDC25B(1), CHUK(4), DAXX(4), DDIT3(1), DUSP10(1), DUSP14(1), DUSP16(1), DUSP2(2), DUSP4(3), DUSP8(1), DUSP9(1), EGF(3), EGFR(58), ELK1(1), ELK4(1), FGF10(1), FGF13(1), FGF14(2), FGF18(1), FGF2(1), FGF20(2), FGF21(1), FGF23(3), FGF3(1), FGF6(3), FGF9(1), FGFR1(3), FGFR2(3), FGFR3(2), FGFR4(3), FLNA(14), FLNB(4), FLNC(6), FOS(1), GADD45B(1), GNA12(2), IKBKB(2), IL1R1(2), KRAS(1), MAP2K1(1), MAP2K2(1), MAP2K3(1), MAP2K5(1), MAP2K7(1), MAP3K1(5), MAP3K10(3), MAP3K12(5), MAP3K13(2), MAP3K14(2), MAP3K2(1), MAP3K3(4), MAP3K4(2), MAP3K5(1), MAP3K6(5), MAP3K7(2), MAP4K1(1), MAP4K2(1), MAP4K3(1), MAP4K4(5), MAPK1(3), MAPK13(1), MAPK14(1), MAPK3(2), MAPK7(3), MAPK8IP1(3), MAPK8IP2(3), MAPK8IP3(5), MAPK9(2), MAPKAPK2(1), MAPKAPK3(1), MAPT(1), MAX(2), MEF2C(1), MKNK1(1), NF1(34), NFATC2(1), NFATC4(2), NFKB1(1), NFKB2(1), NR4A1(3), NRAS(1), NTF3(1), NTRK1(4), NTRK2(1), PAK1(2), PDGFRA(10), PDGFRB(5), PLA2G12A(3), PLA2G2A(5), PLA2G2F(2), PLA2G3(2), PLA2G4A(5), PLA2G5(1), PLA2G6(3), PPM1B(1), PPP3CB(1), PPP3R1(1), PPP3R2(1), PPP5C(1), PRKACG(1), PRKCA(3), PRKCG(1), PRKX(2), PTPRR(2), RAP1B(2), RAPGEF2(4), RASA2(1), RASGRF1(5), RASGRF2(6), RASGRP1(1), RASGRP2(2), RASGRP3(2), RASGRP4(3), RPS6KA2(2), RPS6KA3(5), RRAS2(3), SOS1(1), SOS2(4), SRF(2), STK3(2), STK4(1), STMN1(1), TAOK1(1), TAOK2(2), TAOK3(2), TGFB1(1), TGFB2(1), TGFBR1(1), TGFBR2(5), TNFRSF1A(2), TP53(91), TRAF2(2), ZAK(1) | 111569559 | 592 | 212 | 520 | 148 | 184 | 87 | 111 | 98 | 100 | 12 | 5.66e-15 | 1.28e-13 |
Table 7. Get Full Table A Ranked List of Significantly Mutated Genesets (Excluding Significantly Mutated Genes). Number of significant genesets found: 0. Number of genesets displayed: 10
| rank | geneset | description | genes | N_genes | mut_tally | N | n | npat | nsite | nsil | n1 | n2 | n3 | n4 | n5 | n6 | p | q |
|---|---|---|---|---|---|---|---|---|---|---|---|---|---|---|---|---|---|---|
| 1 | HSA04640_HEMATOPOIETIC_CELL_LINEAGE | Genes involved in hematopoietic cell lineage | ANPEP, CD14, CD19, CD1A, CD1B, CD1C, CD1D, CD1E, CD2, CD22, CD24, CD33, CD34, CD36, CD37, CD38, CD3D, CD3E, CD3G, CD4, CD44, CD5, CD55, CD59, CD7, CD8A, CD8B, CD9, CR1, CR2, CSF1, CSF1R, CSF2, CSF2RA, CSF3, CSF3R, DNTT, EPO, EPOR, FCER2, FCGR1A, FLT3, FLT3LG, GP1BA, GP1BB, GP5, GP9, GYPA, HLA-DRA, HLA-DRB1, HLA-DRB3, HLA-DRB4, HLA-DRB5, IL11, IL11RA, IL1A, IL1B, IL1R1, IL1R2, IL2RA, IL3, IL3RA, IL4, IL4R, IL5, IL5RA, IL6, IL6R, IL7, IL7R, IL9R, ITGA1, ITGA2, ITGA2B, ITGA3, ITGA4, ITGA5, ITGA6, ITGAM, ITGB3, KIT, KITLG, MME, MS4A1, TFRC, THPO, TNF, TPO | 80 | ANPEP(3), CD14(2), CD19(2), CD1B(1), CD1D(2), CD1E(1), CD22(5), CD33(3), CD34(2), CD36(2), CD38(2), CD3E(1), CD3G(1), CD4(3), CD44(4), CD5(2), CD55(2), CD7(2), CD8A(1), CD8B(1), CD9(2), CR1(5), CR2(6), CSF1R(3), CSF3R(2), DNTT(2), EPO(1), EPOR(1), FLT3(7), FLT3LG(1), GP9(1), GYPA(1), HLA-DRA(1), HLA-DRB1(2), HLA-DRB5(2), IL1R1(2), IL2RA(3), IL4(1), IL4R(6), IL5RA(1), IL6(2), IL6R(2), IL7(1), IL7R(1), ITGA1(1), ITGA2(4), ITGA2B(2), ITGA3(2), ITGA4(7), ITGA5(1), ITGA6(2), ITGAM(8), ITGB3(1), KIT(3), KITLG(2), MS4A1(2), TFRC(2), THPO(1), TPO(4) | 31730473 | 140 | 79 | 136 | 52 | 54 | 23 | 28 | 23 | 12 | 0 | 0.00054 | 0.23 |
| 2 | FXRPATHWAY | The nuclear receptor transcription factors FXR and LXR are activated by cholesterol metabolites and regulate cholesterol homeostasis. | FABP6, LDLR, NR0B2, NR1H3, NR1H4, RXRA | 6 | LDLR(4), NR0B2(3), NR1H3(1), NR1H4(3), RXRA(3) | 2161711 | 14 | 14 | 14 | 3 | 3 | 2 | 4 | 3 | 2 | 0 | 0.00076 | 0.23 |
| 3 | BLOOD_CLOTTING_CASCADE | F10, F11, F12, F13B, F2, F5, F7, F8, F8A1, F9, FGA, FGB, FGG, LPA, PLG, PLAT, PLAU, PLG, SERPINB2, SERPINE1, SERPINF2, VWF | 20 | F10(1), F13B(2), F2(1), F5(9), F7(1), F8(8), F9(4), FGA(3), FGB(1), FGG(4), LPA(6), PLAU(2), PLG(2), SERPINB2(2), SERPINE1(1), SERPINF2(1), VWF(10) | 14027949 | 58 | 43 | 58 | 22 | 21 | 10 | 11 | 5 | 11 | 0 | 0.0011 | 0.23 | |
| 4 | TYROSINE_METABOLISM | ABP1, ADH1A, ADH1A, ADH1B, ADH1C, ADH1B, ADH1C, ADH4, ADH6, ADH7, ADHFE1, ALDH1A3, ALDH3A1, ALDH3B1, ALDH3B2, AOC2, AOC3, AOX1, COMT, DBH, DCT, DDC, FAH, GOT1, GOT2, GSTZ1, HGD, HPD, MAOA, MAOB, PNMT, TAT, TH, TPO, TYR | 31 | ABP1(9), ADH1A(4), ADH1B(3), ADH1C(3), ADH6(2), ADH7(1), ALDH1A3(1), ALDH3A1(3), ALDH3B1(2), ALDH3B2(1), AOC2(2), AOC3(2), AOX1(7), COMT(2), DBH(6), DDC(1), FAH(1), GOT1(1), HPD(1), MAOB(1), PNMT(1), TAT(3), TPO(4), TYR(5) | 12332970 | 66 | 42 | 64 | 14 | 35 | 9 | 9 | 13 | 0 | 0 | 0.0019 | 0.29 | |
| 5 | HSA01430_CELL_COMMUNICATION | Genes involved in cell communication | ACTB, ACTG1, CHAD, COL11A1, COL11A2, COL17A1, COL1A1, COL1A2, COL2A1, COL3A1, COL4A1, COL4A2, COL4A4, COL4A6, COL5A1, COL5A2, COL5A3, COL6A1, COL6A2, COL6A3, COL6A6, COMP, DES, DSC1, DSC2, DSC3, DSG1, DSG2, DSG3, DSG4, FN1, GJA1, GJA10, GJA3, GJA4, GJA5, GJA8, GJA9, GJB1, GJB2, GJB3, GJB4, GJB5, GJB6, GJB7, GJC1, GJC2, GJC3, GJD2, GJD3, GJD4, IBSP, INA, ITGA6, ITGB4, KRT1, KRT10, KRT12, KRT13, KRT14, KRT15, KRT16, KRT17, KRT18, KRT19, KRT2, KRT20, KRT23, KRT24, KRT25, KRT27, KRT28, KRT3, KRT31, KRT32, KRT33A, KRT33B, KRT34, KRT35, KRT36, KRT37, KRT38, KRT39, KRT4, KRT40, KRT5, KRT6A, KRT6B, KRT6C, KRT7, KRT71, KRT72, KRT73, KRT74, KRT75, KRT76, KRT77, KRT78, KRT79, KRT8, KRT81, KRT82, KRT83, KRT84, KRT85, KRT86, KRT9, LAMA1, LAMA2, LAMA3, LAMA4, LAMA5, LAMB1, LAMB2, LAMB3, LAMB4, LAMC1, LAMC2, LAMC3, LMNA, LMNB1, LMNB2, LOC728760, NES, PRPH, RELN, SPP1, THBS1, THBS2, THBS3, THBS4, TNC, TNN, TNR, TNXB, VIM, VTN, VWF | 130 | ACTB(1), CHAD(1), COL11A1(8), COL11A2(9), COL17A1(3), COL1A1(4), COL1A2(9), COL2A1(2), COL3A1(5), COL4A1(4), COL4A2(8), COL4A4(4), COL4A6(5), COL5A1(3), COL5A2(5), COL5A3(11), COL6A1(5), COL6A2(3), COL6A6(7), COMP(1), DES(3), DSC1(5), DSC2(2), DSC3(2), DSG1(4), DSG2(1), DSG4(10), FN1(3), GJA1(1), GJA10(1), GJA8(1), GJA9(1), GJB1(4), GJB3(2), GJB5(2), GJB6(1), GJB7(1), GJC1(1), GJC2(1), GJC3(1), GJD4(3), INA(2), ITGA6(2), ITGB4(5), KRT1(2), KRT10(1), KRT12(3), KRT13(4), KRT14(3), KRT15(1), KRT16(4), KRT17(3), KRT18(3), KRT2(3), KRT20(1), KRT24(1), KRT25(3), KRT28(3), KRT3(1), KRT31(3), KRT32(2), KRT33A(3), KRT33B(2), KRT34(3), KRT36(4), KRT37(2), KRT38(2), KRT4(2), KRT5(1), KRT6A(1), KRT6B(2), KRT6C(1), KRT7(3), KRT72(1), KRT73(1), KRT74(3), KRT75(2), KRT76(2), KRT77(2), KRT78(1), KRT79(2), KRT8(3), KRT81(1), KRT82(1), KRT83(2), KRT84(2), KRT85(2), KRT9(3), LAMA1(17), LAMA2(12), LAMA3(7), LAMA4(4), LAMA5(9), LAMB1(4), LAMB2(3), LAMB3(4), LAMB4(11), LAMC1(2), LAMC2(6), LAMC3(5), LMNB1(1), LMNB2(3), NES(3), RELN(20), SPP1(1), THBS1(3), THBS2(5), THBS3(1), THBS4(2), TNC(7), TNN(5), TNR(2), TNXB(6), VIM(1), VWF(10) | 92368007 | 406 | 151 | 395 | 169 | 150 | 79 | 74 | 49 | 52 | 2 | 0.0028 | 0.34 |
| 6 | HSA04612_ANTIGEN_PROCESSING_AND_PRESENTATION | Genes involved in antigen processing and presentation | B2M, CALR, CANX, CD4, CD74, CD8A, CD8B, CIITA, CREB1, CTSB, CTSL1, CTSS, HLA-A, HLA-A29.1, HLA-B, HLA-C, HLA-DMA, HLA-DMB, HLA-DOA, HLA-DOB, HLA-DPA1, HLA-DPB1, HLA-DQA1, HLA-DQA2, HLA-DQB1, HLA-DQB2, HLA-DRA, HLA-DRB1, HLA-DRB3, HLA-DRB4, HLA-DRB5, HLA-E, HLA-F, HLA-G, HSP90AA1, HSP90AB1, HSPA5, IFI30, IFNA1, IFNA10, IFNA13, IFNA14, IFNA16, IFNA17, IFNA2, IFNA21, IFNA4, IFNA5, IFNA6, IFNA7, IFNA8, KIR2DL1, KIR2DL2, KIR2DL3, KIR2DL4, KIR2DL5A, KIR2DS1, KIR2DS2, KIR2DS3, KIR2DS4, KIR2DS5, KIR3DL1, KIR3DL2, KIR3DL3, KLRC1, KLRC2, KLRC3, KLRC4, KLRD1, LGMN, LTA, NFYA, NFYB, NFYC, PDIA3, PSME1, PSME2, RFX5, RFXANK, RFXAP, TAP1, TAP2, TAPBP | 73 | B2M(2), CANX(4), CD4(3), CD8A(1), CD8B(1), CIITA(7), CTSS(2), HLA-A(1), HLA-B(1), HLA-DMA(1), HLA-DMB(1), HLA-DOA(3), HLA-DOB(2), HLA-DPA1(1), HLA-DQA2(1), HLA-DQB1(2), HLA-DRA(1), HLA-DRB1(2), HLA-DRB5(2), HLA-F(2), HSP90AA1(1), HSP90AB1(2), HSPA5(2), IFNA13(1), IFNA14(1), IFNA17(1), IFNA21(1), IFNA5(1), IFNA7(2), KIR2DL1(2), KIR2DL4(1), KIR3DL1(1), KLRC1(1), KLRC3(3), LGMN(1), NFYB(1), NFYC(3), PDIA3(1), PSME1(1), PSME2(1), TAP1(4), TAP2(2) | 18456357 | 74 | 49 | 71 | 27 | 16 | 11 | 17 | 15 | 15 | 0 | 0.005 | 0.41 |
| 7 | IL17PATHWAY | Activated T cells secrete IL-17, which stimulates fibroblasts and other cells to secrete inflammatory and hematopoietic cytokines. | CD2, CD34, CD3D, CD3E, CD3G, CD3Z, CD4, CD58, CD8A, CSF3, IL17, IL3, IL6, IL8, KITLG, TRA@, TRB@ | 13 | CD34(2), CD3E(1), CD3G(1), CD4(3), CD58(1), CD8A(1), IL6(2), KITLG(2) | 2527581 | 13 | 12 | 11 | 3 | 4 | 0 | 3 | 4 | 2 | 0 | 0.0052 | 0.41 |
| 8 | CTLPATHWAY | Cytotoxic T lymphocytes induce apoptosis in infected cells presenting antigen-MHC-I complexes via the perforin and Fas/Fas ligand pathways. | B2M, CD3D, CD3E, CD3G, CD3Z, GZMB, HLA-A, ICAM1, ITGAL, ITGB2, PRF1, TNFRSF6, TNFSF6, TRA@, TRB@ | 10 | B2M(2), CD3E(1), CD3G(1), GZMB(3), HLA-A(1), ITGAL(4), ITGB2(5), PRF1(3) | 3417489 | 20 | 15 | 20 | 14 | 6 | 1 | 4 | 1 | 8 | 0 | 0.0054 | 0.41 |
| 9 | DCPATHWAY | Dendritic cells internalize and present antigen, after which they migrate to lymphocyte-rich tissues and induce T and B cell differentiation. | ANPEP, CD2, CD33, CD5, CD7, CSF2, IFNA1, IFNB1, IFNG, IL10, IL12A, IL12B, IL13, IL3, IL4, IL5, ITGAX, TLR2, TLR4, TLR7, TLR9, TNFRSF5 | 21 | ANPEP(3), CD33(3), CD5(2), CD7(2), IFNB1(1), IFNG(1), IL12B(1), IL4(1), ITGAX(7), TLR2(4), TLR4(1), TLR7(5), TLR9(2) | 7416008 | 33 | 24 | 33 | 13 | 13 | 6 | 9 | 3 | 2 | 0 | 0.006 | 0.41 |
| 10 | NEUROTRANSMITTERSPATHWAY | Biosynthesis of neurotransmitters | DBH, GAD1, HDC, PNMT, TH, TPH1 | 6 | DBH(6), GAD1(4), HDC(3), PNMT(1), TPH1(3) | 2333567 | 17 | 13 | 17 | 6 | 10 | 4 | 2 | 1 | 0 | 0 | 0.007 | 0.43 |
In brief, we tabulate the number of mutations and the number of covered bases for each gene. The counts are broken down by mutation context category: four context categories that are discovered by MutSig, and one for indel and 'null' mutations, which include indels, nonsense mutations, splice-site mutations, and non-stop (read-through) mutations. For each gene, we calculate the probability of seeing the observed constellation of mutations, i.e. the product P1 x P2 x ... x Pm, or a more extreme one, given the background mutation rates calculated across the dataset.[1]
This is an experimental feature. The full results of the analysis summarized in this report can be downloaded from the TCGA Data Coordination Center.