This report serves to describe the mutational landscape and properties of a given individual set, as well as rank genes and genesets according to mutational significance. MutSig v2.0 was used to generate the results found in this report.
Working with individual set: BRCA.
Number of patients in set: 507
The input for this pipeline is a set of individuals with the following files associated for each:
1. An annotated .maf file describing the mutations called for the respective individual, and their properties.
2. A .wig file that contains information about the coverage of the sample.
Significantly mutated genes (q ≤ 0.1): 47
Mutations seen in COSMIC: 503
Significantly mutated genes in COSMIC territory: 16
Genes with clustered mutations (&le 3 aa apart): 273
Significantly mutated genesets: 121
Significantly mutated genesets: (excluding sig. mutated genes): 0
Table 1. Get Full Table Table representing breakdown of mutations by type.
| type | count |
|---|---|
| Frame_Shift_Del | 1019 |
| Frame_Shift_Ins | 317 |
| In_Frame_Del | 401 |
| In_Frame_Ins | 74 |
| Missense_Mutation | 19281 |
| Nonsense_Mutation | 1398 |
| Nonstop_Mutation | 34 |
| Silent | 7287 |
| Splice_Site | 591 |
| Total | 30402 |
Table 2. Get Full Table A breakdown of mutation rates per category discovered for this individual set.
| category | n | N | rate | rate_per_mb | relative_rate | exp_ns_s_ratio |
|---|---|---|---|---|---|---|
| *CpG->T | 3903 | 836685876 | 4.7e-06 | 4.7 | 3.1 | 2.1 |
| *Cp(A/C/T)->T | 4294 | 7060503801 | 6.1e-07 | 0.61 | 0.41 | 1.7 |
| C->(G/A) | 6959 | 7897189677 | 8.8e-07 | 0.88 | 0.59 | 4.8 |
| A->mut | 4125 | 7654859394 | 5.4e-07 | 0.54 | 0.36 | 3.9 |
| indel+null | 3773 | 15552049071 | 2.4e-07 | 0.24 | 0.16 | NaN |
| double_null | 61 | 15552049071 | 3.9e-09 | 0.0039 | 0.0026 | NaN |
| Total | 23115 | 15552049071 | 1.5e-06 | 1.5 | 1 | 3.5 |
The x axis represents the samples. The y axis represents the exons, one row per exon, and they are sorted by average coverage across samples. For exons with exactly the same average coverage, they are sorted next by the %GC of the exon. (The secondary sort is especially useful for the zero-coverage exons at the bottom).
Figure 1.
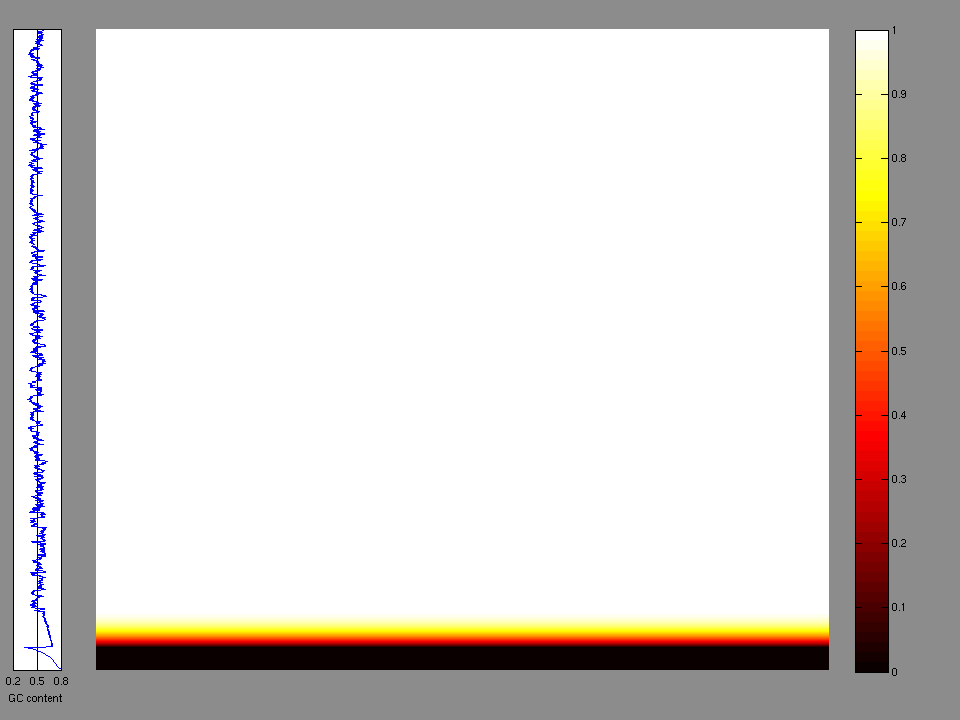
Figure 2.
Figure 3. Get High-res Image The matrix in the center of the figure represents individual mutations in patient samples, color-coded by type of mutation, for the significantly mutated genes. The rate of synonymous and non-synonymous mutations is displayed at the top of the matrix. The barplot on the left of the matrix shows the number of mutations in each gene. The percentages represent the fraction of tumors with at least one mutation in the specified gene. The barplot to the right of the matrix displays the q-values for the most significantly mutated genes. The purple boxplots below the matrix (only displayed if required columns are present in the provided MAF) represent the distributions of allelic fractions observed in each sample. The plot at the bottom represents the base substitution distribution of individual samples, using the same categories that were used to calculate significance.
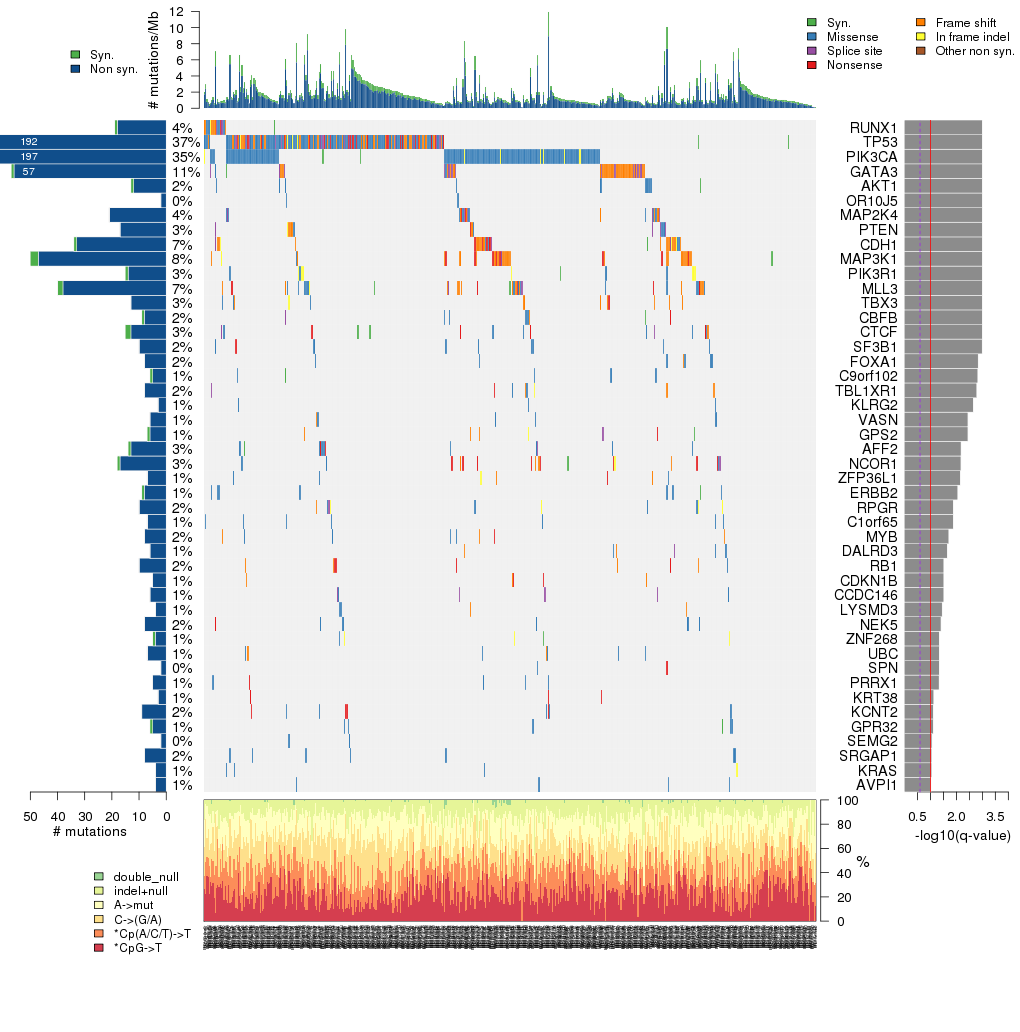
Table 3. Get Full Table A Ranked List of Significantly Mutated Genes. Number of significant genes found: 47. Number of genes displayed: 35
| rank | gene | description | N | n | npat | nsite | nsil | n1 | n2 | n3 | n4 | n5 | n6 | p_classic | p_ns_s | p_ks | p_cons | p_joint | p | q |
|---|---|---|---|---|---|---|---|---|---|---|---|---|---|---|---|---|---|---|---|---|
| 1 | RUNX1 | runt-related transcription factor 1 (acute myeloid leukemia 1; aml1 oncogene) | 630708 | 18 | 18 | 17 | 1 | 0 | 2 | 1 | 3 | 12 | 0 | <1.00e-15 | 0.22 | 0.0025 | 0.26 | 0.0039 | <1.11e-16 | <2.03e-12 |
| 2 | TP53 | tumor protein p53 | 649467 | 189 | 186 | 114 | 3 | 29 | 23 | 23 | 39 | 75 | 0 | <1.00e-15 | 3.33e-15 | 2e-07 | 2e-07 | 0 | <1.00e-15 | <3.05e-12 |
| 3 | PIK3CA | phosphoinositide-3-kinase, catalytic, alpha polypeptide | 1666509 | 194 | 178 | 32 | 3 | 3 | 70 | 8 | 105 | 8 | 0 | <1.00e-15 | <1.00e-15 | 2e-07 | 2e-07 | 0 | <1.00e-15 | <3.05e-12 |
| 4 | GATA3 | GATA binding protein 3 | 574431 | 56 | 54 | 34 | 1 | 0 | 1 | 0 | 3 | 51 | 1 | 1.55e-15 | 0.62 | 2e-07 | 0.066 | 0 | <1.00e-15 | <3.05e-12 |
| 5 | AKT1 | v-akt murine thymoma viral oncogene homolog 1 | 757965 | 12 | 12 | 2 | 1 | 0 | 11 | 0 | 1 | 0 | 0 | 1.79e-09 | 0.0052 | 2e-07 | 0.000036 | 0 | <1.00e-15 | <3.05e-12 |
| 6 | OR10J5 | olfactory receptor, family 10, subfamily J, member 5 | 472524 | 2 | 2 | 2 | 0 | 1 | 1 | 0 | 0 | 0 | 0 | 0.087 | 0.42 | 0.023 | 0.0015 | 0 | <1.00e-15 | <3.05e-12 |
| 7 | MAP2K4 | mitogen-activated protein kinase kinase 4 | 570375 | 21 | 21 | 20 | 0 | 3 | 2 | 2 | 1 | 13 | 0 | <1.00e-15 | 0.035 | 0.097 | 0.23 | 0.086 | <3.22e-15 | <8.41e-12 |
| 8 | PTEN | phosphatase and tensin homolog (mutated in multiple advanced cancers 1) | 632736 | 17 | 17 | 16 | 0 | 1 | 0 | 2 | 2 | 11 | 1 | <1.00e-15 | 0.18 | 0.082 | 0.3 | 0.13 | <4.88e-15 | <1.12e-11 |
| 9 | CDH1 | cadherin 1, type 1, E-cadherin (epithelial) | 1347099 | 33 | 33 | 30 | 1 | 0 | 3 | 1 | 0 | 29 | 0 | <1.00e-15 | 0.031 | 0.27 | 0.34 | 0.25 | <9.33e-15 | <1.89e-11 |
| 10 | MAP3K1 | mitogen-activated protein kinase kinase kinase 1 | 2095431 | 47 | 39 | 46 | 3 | 0 | 0 | 2 | 5 | 25 | 15 | 1.11e-15 | 0.32 | 0.88 | 0.3 | 0.66 | 2.63e-14 | 4.81e-11 |
| 11 | PIK3R1 | phosphoinositide-3-kinase, regulatory subunit 1 (alpha) | 1196520 | 14 | 14 | 13 | 1 | 0 | 2 | 2 | 1 | 9 | 0 | 1.95e-11 | 0.61 | 0.000013 | 0.13 | 7e-05 | 4.81e-14 | 7.99e-11 |
| 12 | MLL3 | myeloid/lymphoid or mixed-lineage leukemia 3 | 7571538 | 38 | 37 | 38 | 2 | 0 | 8 | 4 | 3 | 23 | 0 | 5.70e-14 | 0.12 | 0.38 | 0.15 | 0.22 | 4.19e-13 | 5.91e-10 |
| 13 | TBX3 | T-box 3 (ulnar mammary syndrome) | 709800 | 13 | 13 | 13 | 0 | 0 | 2 | 1 | 0 | 10 | 0 | 3.54e-13 | 0.18 | 0.021 | 0.8 | 0.036 | 4.20e-13 | 5.91e-10 |
| 14 | CBFB | core-binding factor, beta subunit | 246909 | 8 | 8 | 8 | 1 | 0 | 4 | 0 | 1 | 3 | 0 | 1.46e-10 | 0.34 | 0.32 | 0.074 | 0.2 | 7.49e-10 | 9.79e-07 |
| 15 | CTCF | CCCTC-binding factor (zinc finger protein) | 1127568 | 13 | 13 | 11 | 2 | 1 | 1 | 2 | 2 | 7 | 0 | 1.53e-07 | 0.49 | 0.029 | 0.00038 | 0.00098 | 3.56e-09 | 4.33e-06 |
| 16 | SF3B1 | splicing factor 3b, subunit 1, 155kDa | 2047773 | 10 | 10 | 6 | 0 | 0 | 1 | 0 | 8 | 1 | 0 | 0.000033 | 0.050 | 0.000032 | 0.11 | 1e-05 | 7.46e-09 | 8.53e-06 |
| 17 | FOXA1 | forkhead box A1 | 603330 | 8 | 8 | 7 | 0 | 1 | 3 | 2 | 1 | 1 | 0 | 0.000014 | 0.050 | 0.00065 | 0.43 | 0.0016 | 4.09e-07 | 0.00044 |
| 18 | C9orf102 | chromosome 9 open reading frame 102 | 1098162 | 5 | 5 | 3 | 1 | 0 | 3 | 0 | 2 | 0 | 0 | 0.0028 | 0.55 | 2.6e-06 | 1 | 9.6e-06 | 4.99e-07 | 0.00051 |
| 19 | TBL1XR1 | transducin (beta)-like 1 X-linked receptor 1 | 811707 | 8 | 8 | 7 | 0 | 0 | 0 | 1 | 1 | 4 | 2 | 5.78e-08 | 0.45 | 0.46 | 0.7 | 0.67 | 6.97e-07 | 0.00067 |
| 20 | KLRG2 | killer cell lectin-like receptor subfamily G, member 2 | 228150 | 3 | 3 | 1 | 0 | 0 | 0 | 3 | 0 | 0 | 0 | 0.0026 | 0.50 | 0.000022 | 0.66 | 0.000029 | 1.31e-06 | 0.0012 |
| 21 | VASN | vasorin | 348309 | 6 | 6 | 3 | 0 | 0 | 0 | 1 | 4 | 1 | 0 | 4.66e-06 | 0.38 | 0.023 | 0.92 | 0.038 | 2.96e-06 | 0.0026 |
| 22 | GPS2 | G protein pathway suppressor 2 | 518661 | 6 | 6 | 6 | 1 | 0 | 0 | 0 | 0 | 6 | 0 | 0.000010 | 0.92 | 0.036 | 0.074 | 0.018 | 3.10e-06 | 0.0026 |
| 23 | AFF2 | AF4/FMR2 family, member 2 | 2066025 | 13 | 13 | 13 | 1 | 2 | 1 | 6 | 1 | 3 | 0 | 1.80e-06 | 0.23 | 0.14 | 0.68 | 0.25 | 7.05e-06 | 0.0056 |
| 24 | NCOR1 | nuclear receptor co-repressor 1 | 3804021 | 17 | 17 | 17 | 1 | 0 | 1 | 1 | 1 | 13 | 1 | 1.16e-06 | 0.13 | 0.51 | 0.22 | 0.41 | 7.46e-06 | 0.0057 |
| 25 | ZFP36L1 | zinc finger protein 36, C3H type-like 1 | 519675 | 7 | 7 | 7 | 0 | 0 | 1 | 1 | 1 | 4 | 0 | 3.59e-06 | 0.30 | 0.076 | 0.91 | 0.15 | 8.19e-06 | 0.0060 |
| 26 | ERBB2 | v-erb-b2 erythroblastic leukemia viral oncogene homolog 2, neuro/glioblastoma derived oncogene homolog (avian) | 1902264 | 8 | 7 | 6 | 1 | 2 | 0 | 3 | 3 | 0 | 0 | 0.013 | 0.39 | 0.00074 | 0.00078 | 0.000059 | 0.000011 | 0.0079 |
| 27 | RPGR | retinitis pigmentosa GTPase regulator | 1930149 | 10 | 10 | 10 | 0 | 1 | 2 | 1 | 0 | 6 | 0 | 0.000011 | 0.27 | 0.32 | 0.08 | 0.11 | 0.000018 | 0.012 |
| 28 | C1orf65 | chromosome 1 open reading frame 65 | 581529 | 7 | 7 | 5 | 0 | 1 | 4 | 1 | 1 | 0 | 0 | 0.000036 | 0.037 | 0.015 | 0.79 | 0.035 | 0.000018 | 0.012 |
| 29 | MYB | v-myb myeloblastosis viral oncogene homolog (avian) | 1177761 | 8 | 8 | 8 | 0 | 1 | 1 | 1 | 1 | 4 | 0 | 0.000052 | 0.21 | 0.18 | 0.023 | 0.041 | 0.000030 | 0.019 |
| 30 | DALRD3 | DALR anticodon binding domain containing 3 | 649467 | 6 | 6 | 6 | 0 | 1 | 0 | 2 | 0 | 3 | 0 | 0.00027 | 0.28 | 0.11 | 0.0056 | 0.0093 | 0.000035 | 0.021 |
| 31 | RB1 | retinoblastoma 1 (including osteosarcoma) | 1394250 | 10 | 9 | 10 | 0 | 0 | 0 | 0 | 2 | 8 | 0 | 4.00e-06 | 0.30 | 0.66 | 0.36 | 0.93 | 0.000050 | 0.030 |
| 32 | CDKN1B | cyclin-dependent kinase inhibitor 1B (p27, Kip1) | 272259 | 5 | 5 | 4 | 0 | 0 | 0 | 0 | 0 | 5 | 0 | 0.000012 | 0.67 | 0.3 | 0.31 | 0.32 | 0.000053 | 0.030 |
| 33 | CCDC146 | coiled-coil domain containing 146 | 1489566 | 6 | 6 | 3 | 0 | 0 | 0 | 2 | 0 | 4 | 0 | 0.0019 | 0.77 | 0.0008 | 0.55 | 0.0021 | 0.000053 | 0.030 |
| 34 | LYSMD3 | LysM, putative peptidoglycan-binding, domain containing 3 | 471003 | 4 | 4 | 4 | 0 | 0 | 0 | 1 | 1 | 2 | 0 | 0.00039 | 0.68 | 0.0038 | 0.6 | 0.012 | 0.000064 | 0.034 |
| 35 | NEK5 | NIMA (never in mitosis gene a)-related kinase 5 | 1078896 | 8 | 8 | 8 | 0 | 1 | 0 | 4 | 2 | 1 | 0 | 0.000021 | 0.18 | 0.26 | 0.36 | 0.27 | 0.000074 | 0.038 |
Note:
N - number of sequenced bases in this gene across the individual set.
n - number of (nonsilent) mutations in this gene across the individual set.
npat - number of patients (individuals) with at least one nonsilent mutation.
nsite - number of unique sites having a non-silent mutation.
nsil - number of silent mutations in this gene across the individual set.
n1 - number of nonsilent mutations of type: *CpG->T .
n2 - number of nonsilent mutations of type: *Cp(A/C/T)->T .
n3 - number of nonsilent mutations of type: C->(G/A) .
n4 - number of nonsilent mutations of type: A->mut .
n5 - number of nonsilent mutations of type: indel+null .
null - mutation category that includes nonsense, frameshift, splice-site mutations
p_classic = p-value for the observed amount of nonsilent mutations being elevated in this gene
p_ns_s = p-value for the observed nonsilent/silent ratio being elevated in this gene
p = p-value (overall)
q = q-value, False Discovery Rate (Benjamini-Hochberg procedure)
In this analysis, COSMIC is used as a filter to increase power by restricting the territory of each gene. Cosmic version: v48.
Table 4. Get Full Table Significantly mutated genes (COSMIC territory only). To access the database please go to: COSMIC. Number of significant genes found: 16. Number of genes displayed: 10
| rank | gene | description | n | cos | n_cos | N_cos | cos_ev | p | q |
|---|---|---|---|---|---|---|---|---|---|
| 1 | PIK3CA | phosphoinositide-3-kinase, catalytic, alpha polypeptide | 194 | 184 | 184 | 93288 | 113646 | 0 | 0 |
| 2 | GATA3 | GATA binding protein 3 | 56 | 34 | 21 | 17238 | 155 | 0 | 0 |
| 3 | TP53 | tumor protein p53 | 189 | 308 | 182 | 156156 | 37556 | 0 | 0 |
| 4 | PIK3R1 | phosphoinositide-3-kinase, regulatory subunit 1 (alpha) | 14 | 33 | 7 | 16731 | 8 | 0 | 0 |
| 5 | CDH1 | cadherin 1, type 1, E-cadherin (epithelial) | 33 | 184 | 15 | 93288 | 27 | 0 | 0 |
| 6 | RUNX1 | runt-related transcription factor 1 (acute myeloid leukemia 1; aml1 oncogene) | 18 | 175 | 14 | 88725 | 54 | 0 | 0 |
| 7 | PTEN | phosphatase and tensin homolog (mutated in multiple advanced cancers 1) | 17 | 728 | 17 | 369096 | 712 | 0 | 0 |
| 8 | ERBB2 | v-erb-b2 erythroblastic leukemia viral oncogene homolog 2, neuro/glioblastoma derived oncogene homolog (avian) | 8 | 41 | 6 | 20787 | 44 | 5.8e-13 | 3.2e-10 |
| 9 | MAP2K4 | mitogen-activated protein kinase kinase 4 | 21 | 15 | 3 | 7605 | 6 | 2.4e-07 | 0.00012 |
| 10 | PTPN22 | protein tyrosine phosphatase, non-receptor type 22 (lymphoid) | 8 | 5 | 2 | 2535 | 2 | 7.1e-06 | 0.0032 |
Note:
n - number of (nonsilent) mutations in this gene across the individual set.
cos = number of unique mutated sites in this gene in COSMIC
n_cos = overlap between n and cos.
N_cos = number of individuals times cos.
cos_ev = total evidence: number of reports in COSMIC for mutations seen in this gene.
p = p-value for seeing the observed amount of overlap in this gene)
q = q-value, False Discovery Rate (Benjamini-Hochberg procedure)
Table 5. Get Full Table Genes with Clustered Mutations
| num | gene | desc | n | mindist | nmuts0 | nmuts3 | nmuts12 | npairs0 | npairs3 | npairs12 |
|---|---|---|---|---|---|---|---|---|---|---|
| 6956 | PIK3CA | phosphoinositide-3-kinase, catalytic, alpha polypeptide | 194 | 0 | 4345 | 5558 | 5984 | 4345 | 5558 | 5984 |
| 9426 | TP53 | tumor protein p53 | 189 | 0 | 237 | 643 | 1330 | 237 | 643 | 1330 |
| 312 | AKT1 | v-akt murine thymoma viral oncogene homolog 1 | 12 | 0 | 55 | 55 | 55 | 55 | 55 | 55 |
| 8183 | SF3B1 | splicing factor 3b, subunit 1, 155kDa | 10 | 0 | 10 | 10 | 10 | 10 | 10 | 10 |
| 6296 | OBSCN | obscurin, cytoskeletal calmodulin and titin-interacting RhoGEF | 27 | 0 | 7 | 7 | 8 | 7 | 7 | 8 |
| 9886 | VASN | vasorin | 6 | 0 | 6 | 6 | 6 | 6 | 6 | 6 |
| 1758 | CDH1 | cadherin 1, type 1, E-cadherin (epithelial) | 33 | 0 | 5 | 5 | 6 | 5 | 5 | 6 |
| 2279 | CTCF | CCCTC-binding factor (zinc finger protein) | 13 | 0 | 3 | 7 | 7 | 3 | 7 | 7 |
| 3865 | GPR32 | G protein-coupled receptor 32 | 5 | 0 | 3 | 4 | 4 | 3 | 4 | 4 |
| 3014 | ERBB2 | v-erb-b2 erythroblastic leukemia viral oncogene homolog 2, neuro/glioblastoma derived oncogene homolog (avian) | 8 | 0 | 3 | 3 | 4 | 3 | 3 | 4 |
Note:
n - number of mutations in this gene in the individual set.
mindist - distance (in aa) between closest pair of mutations in this gene
npairs3 - how many pairs of mutations are within 3 aa of each other.
npairs12 - how many pairs of mutations are within 12 aa of each other.
Table 6. Get Full Table A Ranked List of Significantly Mutated Genesets. (Source: MSigDB GSEA Cannonical Pathway Set).Number of significant genesets found: 121. Number of genesets displayed: 10
| rank | geneset | description | genes | N_genes | mut_tally | N | n | npat | nsite | nsil | n1 | n2 | n3 | n4 | n5 | n6 | p_ns_s | p | q |
|---|---|---|---|---|---|---|---|---|---|---|---|---|---|---|---|---|---|---|---|
| 1 | HSA04210_APOPTOSIS | Genes involved in apoptosis | AIFM1, AKT1, AKT2, AKT3, APAF1, ATM, BAD, BAX, BCL2, BCL2L1, BID, BIRC2, BIRC3, BIRC4, CAPN1, CAPN2, CASP10, CASP3, CASP6, CASP7, CASP8, CASP9, CFLAR, CHP, CHUK, CSF2RB, CYCS, DFFA, DFFB, ENDOG, FADD, FAS, FASLG, IKBKB, IKBKG, IL1A, IL1B, IL1R1, IL1RAP, IL3, IL3RA, IRAK1, IRAK2, IRAK3, IRAK4, MAP3K14, MYD88, NFKB1, NFKB2, NFKBIA, NGFB, NTRK1, PIK3CA, PIK3CB, PIK3CD, PIK3CG, PIK3R1, PIK3R2, PIK3R3, PIK3R5, PPP3CA, PPP3CB, PPP3CC, PPP3R1, PPP3R2, PRKACA, PRKACB, PRKACG, PRKAR1A, PRKAR1B, PRKAR2A, PRKAR2B, RELA, RIPK1, TNF, TNFRSF10A, TNFRSF10B, TNFRSF10C, TNFRSF10D, TNFRSF1A, TNFSF10, TP53, TRADD, TRAF2 | 81 | AKT1(12), AKT2(1), AKT3(3), APAF1(1), ATM(12), BAD(1), BID(4), CAPN1(3), CAPN2(2), CASP6(2), CASP8(3), CSF2RB(2), DFFB(2), FAS(1), FASLG(1), IKBKB(3), IL1A(1), IL1R1(1), IL1RAP(2), IL3RA(1), IRAK1(1), IRAK2(3), IRAK3(1), IRAK4(2), NFKB1(1), NFKB2(3), NFKBIA(1), NTRK1(3), PIK3CA(194), PIK3CB(4), PIK3CG(2), PIK3R1(14), PIK3R3(1), PPP3CA(3), PPP3CB(3), PRKACA(1), PRKAR1A(1), PRKAR2A(1), PRKAR2B(1), RELA(1), RIPK1(3), TNFRSF10D(1), TNFRSF1A(1), TP53(189) | 64465557 | 493 | 361 | 245 | 28 | 43 | 129 | 50 | 162 | 108 | 1 | <1.00e-15 | <1.00e-15 | <8.56e-15 |
| 2 | ARFPATHWAY | Cyclin-dependent kinase inhibitor 2A is a tumor suppressor that induces G1 arrest and can activate the p53 pathway, leading to G2/M arrest. | ABL1, CDKN2A, E2F1, MDM2, MYC, PIK3CA, PIK3R1, POLR1A, POLR1B, POLR1C, POLR1D, RAC1, RB1, TBX2, TP53, TWIST1 | 16 | ABL1(4), E2F1(2), MDM2(2), MYC(1), PIK3CA(194), PIK3R1(14), POLR1A(2), POLR1B(2), POLR1C(2), POLR1D(2), RB1(10), TP53(189) | 14816568 | 424 | 336 | 186 | 11 | 35 | 97 | 37 | 151 | 104 | 0 | <1.00e-15 | <1.00e-15 | <8.56e-15 |
| 3 | CELL_CYCLE_KEGG | ABL1, ASK, ATM, BUB1, BUB1B, BUB3, CCNA1, CCNA2, CCNB1, CCNB2, CCNB3, CCND2, CCND3, CCNE1, CCNE2, CCNH, CDAN1, CDC14A, CDC14B, CDC14B, CDC14C, CDC2, CDC20, CDC25A, CDC25B, CDC25C, CDC45L, CDC6, CDC7, CDH1, CDK2, CDK4, CDKN1A, CDKN2A, CHEK1, CHEK2, DTX4, E2F1, E2F2, E2F3, E2F4, E2F5, E2F6, EP300, ESPL1, FLJ14001, GADD45A, GSK3B, HDAC1, HDAC2, HDAC3, HDAC4, HDAC5, HDAC6, HDAC7A, HDAC8, MAD1L1, MAD2L1, MAD2L2, MCM2, MCM3, MCM4, MCM5, MCM6, MCM7, MDM2, MPEG1, MPL, ORC1L, ORC2L, ORC3L, ORC4L, ORC5L, ORC6L, PCNA, PLK1, PRKDC, PTPRA, PTTG1, PTTG2, PTTG3, RB1, RBL1, SKP2, SMAD4, SMC1L1, TBC1D8, TFDP1, TGFB1, TP53, WEE1 | 82 | ABL1(4), ATM(12), BUB1(1), CCNA2(2), CCNB1(2), CCNB3(6), CCND3(3), CCNE1(1), CDAN1(1), CDC25A(1), CDC25B(3), CDC25C(1), CDC7(1), CDH1(33), CDK2(1), CHEK2(2), DTX4(1), E2F1(2), E2F3(1), E2F4(2), E2F5(1), EP300(3), ESPL1(7), HDAC1(2), HDAC2(3), HDAC3(2), HDAC4(1), HDAC5(2), HDAC6(3), HDAC8(3), MAD2L1(2), MAD2L2(1), MCM2(1), MCM3(1), MCM4(2), MCM6(2), MCM7(2), MDM2(2), ORC1L(1), ORC2L(1), ORC3L(1), PLK1(2), PRKDC(8), PTPRA(1), PTTG2(1), RB1(10), RBL1(1), SMAD4(1), TBC1D8(1), TFDP1(1), TP53(189), WEE1(1) | 85526844 | 339 | 272 | 260 | 32 | 44 | 45 | 50 | 62 | 137 | 1 | 1.14e-10 | <1.00e-15 | <8.56e-15 | |
| 4 | HSA04620_TOLL_LIKE_RECEPTOR_SIGNALING_PATHWAY | Genes involved in Toll-like receptor signaling pathway | AKT1, AKT2, AKT3, CASP8, CCL3, CCL4, CCL5, CD14, CD40, CD80, CD86, CHUK, CXCL10, CXCL11, CXCL9, FADD, FOS, IFNA1, IFNA10, IFNA13, IFNA14, IFNA16, IFNA17, IFNA2, IFNA21, IFNA4, IFNA5, IFNA6, IFNA7, IFNA8, IFNAR1, IFNAR2, IFNB1, IKBKB, IKBKE, IKBKG, IL12A, IL12B, IL1B, IL6, IL8, IRAK1, IRAK4, IRF3, IRF5, IRF7, JUN, LBP, LY96, MAP2K1, MAP2K2, MAP2K3, MAP2K4, MAP2K6, MAP2K7, MAP3K7, MAP3K7IP1, MAP3K7IP2, MAP3K8, MAPK1, MAPK10, MAPK11, MAPK12, MAPK13, MAPK14, MAPK3, MAPK8, MAPK9, MYD88, NFKB1, NFKB2, NFKBIA, PIK3CA, PIK3CB, PIK3CD, PIK3CG, PIK3R1, PIK3R2, PIK3R3, PIK3R5, RAC1, RELA, RIPK1, SPP1, STAT1, TBK1, TICAM1, TICAM2, TIRAP, TLR1, TLR2, TLR3, TLR4, TLR5, TLR6, TLR7, TLR8, TLR9, TNF, TOLLIP, TRAF3, TRAF6 | 99 | AKT1(12), AKT2(1), AKT3(3), CASP8(3), CD14(1), CD40(1), CD86(2), IFNA1(1), IFNA10(1), IFNA13(1), IFNA14(2), IFNA16(1), IFNA2(2), IFNA4(1), IFNA7(1), IFNAR1(1), IFNAR2(1), IFNB1(1), IKBKB(3), IKBKE(1), IL12A(1), IL12B(1), IL6(2), IRAK1(1), IRAK4(2), IRF3(2), JUN(1), LBP(1), MAP2K1(1), MAP2K2(1), MAP2K3(1), MAP2K4(21), MAP2K7(1), MAP3K7(1), MAP3K8(2), MAPK1(1), MAPK10(1), MAPK14(1), MAPK3(1), MAPK8(2), NFKB1(1), NFKB2(3), NFKBIA(1), PIK3CA(194), PIK3CB(4), PIK3CG(2), PIK3R1(14), PIK3R3(1), RELA(1), RIPK1(3), SPP1(2), STAT1(1), TBK1(1), TICAM1(2), TIRAP(2), TLR1(1), TLR2(1), TLR3(1), TLR4(8), TLR5(1), TLR7(5), TLR8(3), TLR9(1), TRAF3(1), TRAF6(2) | 67859415 | 341 | 267 | 166 | 40 | 20 | 108 | 32 | 126 | 54 | 1 | 1.50e-13 | <1.00e-15 | <8.56e-15 |
| 5 | ST_JNK_MAPK_PATHWAY | JNKs are MAP kinases regulated by several levels of kinases (MAPKK, MAPKKK) and phosphorylate transcription factors and regulatory proteins. | AKT1, ATF2, CDC42, DLD, DUSP10, DUSP4, DUSP8, GAB1, GADD45A, GCK, IL1R1, JUN, MAP2K4, MAP2K5, MAP2K7, MAP3K1, MAP3K10, MAP3K11, MAP3K12, MAP3K13, MAP3K2, MAP3K3, MAP3K4, MAP3K5, MAP3K7, MAP3K7IP1, MAP3K7IP2, MAP3K9, MAPK10, MAPK7, MAPK8, MAPK9, MYEF2, NFATC3, NR2C2, PAPPA, SHC1, TP53, TRAF6, ZAK | 38 | AKT1(12), ATF2(2), DLD(1), DUSP10(1), DUSP4(1), GAB1(1), GCK(2), IL1R1(1), JUN(1), MAP2K4(21), MAP2K5(2), MAP2K7(1), MAP3K1(47), MAP3K10(4), MAP3K11(1), MAP3K12(2), MAP3K13(5), MAP3K4(4), MAP3K5(2), MAP3K7(1), MAP3K9(3), MAPK10(1), MAPK8(2), MYEF2(2), NFATC3(3), NR2C2(1), PAPPA(4), SHC1(1), TP53(189), TRAF6(2), ZAK(1) | 38087868 | 321 | 266 | 233 | 21 | 42 | 46 | 38 | 51 | 129 | 15 | 6.13e-13 | <1.00e-15 | <8.56e-15 |
| 6 | HSA04664_FC_EPSILON_RI_SIGNALING_PATHWAY | Genes involved in Fc epsilon RI signaling pathway | AKT1, AKT2, AKT3, BTK, CSF2, FCER1A, FCER1G, FYN, GAB2, GRB2, HRAS, IL13, IL3, IL4, IL5, INPP5D, KRAS, LAT, LCP2, LYN, MAP2K1, MAP2K2, MAP2K3, MAP2K4, MAP2K6, MAP2K7, MAPK1, MAPK10, MAPK11, MAPK12, MAPK13, MAPK14, MAPK3, MAPK8, MAPK9, MS4A2, NRAS, PDK1, PIK3CA, PIK3CB, PIK3CD, PIK3CG, PIK3R1, PIK3R2, PIK3R3, PIK3R5, PLA2G10, PLA2G12A, PLA2G12B, PLA2G1B, PLA2G2A, PLA2G2D, PLA2G2E, PLA2G2F, PLA2G3, PLA2G4A, PLA2G5, PLA2G6, PLCG1, PLCG2, PRKCA, PRKCB1, PRKCD, PRKCE, RAC1, RAC2, RAC3, RAF1, SOS1, SOS2, SYK, TNF, VAV1, VAV2, VAV3 | 74 | AKT1(12), AKT2(1), AKT3(3), BTK(3), FCER1A(2), GAB2(2), GRB2(1), INPP5D(3), KRAS(4), LAT(1), LCP2(1), LYN(4), MAP2K1(1), MAP2K2(1), MAP2K3(1), MAP2K4(21), MAP2K7(1), MAPK1(1), MAPK10(1), MAPK14(1), MAPK3(1), MAPK8(2), PDK1(1), PIK3CA(194), PIK3CB(4), PIK3CG(2), PIK3R1(14), PIK3R3(1), PLA2G12A(1), PLA2G2D(1), PLA2G2E(1), PLA2G2F(1), PLA2G3(3), PLA2G4A(7), PLA2G6(2), PLCG1(5), PLCG2(2), PRKCE(1), RAF1(1), SOS1(4), SOS2(2), SYK(2), VAV1(2), VAV2(1), VAV3(1) | 55090620 | 321 | 257 | 144 | 30 | 20 | 103 | 38 | 120 | 40 | 0 | <1.00e-15 | <1.00e-15 | <8.56e-15 |
| 7 | APOPTOSIS_GENMAPP | APAF1, BAK1, BCL2L7P1, BAX, BCL2, BCL2L1, BID, BIRC2, BIRC3, BIRC4, CASP2, CASP3, CASP6, CASP7, CASP8, CASP9, CYCS, FADD, FAS, FASLG, GZMB, IKBKG, JUN, MAP2K4, MAP3K1, MAP3K14, MAPK10, MCL1, MDM2, MYC, NFKB1, NFKBIA, PARP1, PRF1, RELA, RIPK1, TNF, TNFRSF1A, TNFRSF1B, TNFSF10, TP53, TRADD, TRAF1, TRAF2 | 41 | APAF1(1), BAK1(1), BID(4), CASP2(3), CASP6(2), CASP8(3), FAS(1), FASLG(1), JUN(1), MAP2K4(21), MAP3K1(47), MAPK10(1), MDM2(2), MYC(1), NFKB1(1), NFKBIA(1), PARP1(1), PRF1(2), RELA(1), RIPK1(3), TNFRSF1A(1), TP53(189), TRAF1(1) | 27872325 | 289 | 249 | 212 | 14 | 39 | 34 | 33 | 47 | 121 | 15 | 5.44e-15 | <1.00e-15 | <8.56e-15 | |
| 8 | FCER1PATHWAY | In mast cells, Fc epsilon receptor 1 activates BTK, PKC, and the MAP kinase pathway to promote degranulation and arachnidonic acid release. | BTK, CALM1, CALM2, CALM3, ELK1, FCER1A, FCER1G, FOS, GRB2, HRAS, JUN, LYN, MAP2K1, MAP2K4, MAP2K7, MAP3K1, MAPK1, MAPK3, MAPK8, NFATC1, NFATC2, NFATC3, NFATC4, PAK2, PIK3CA, PIK3R1, PLA2G4A, PLCG1, PPP3CA, PPP3CB, PPP3CC, PRKCB1, RAF1, SHC1, SOS1, SYK, SYT1, VAV1 | 37 | BTK(3), ELK1(2), FCER1A(2), GRB2(1), JUN(1), LYN(4), MAP2K1(1), MAP2K4(21), MAP2K7(1), MAP3K1(47), MAPK1(1), MAPK3(1), MAPK8(2), NFATC1(1), NFATC2(1), NFATC3(3), NFATC4(4), PAK2(1), PIK3CA(194), PIK3R1(14), PLA2G4A(7), PLCG1(5), PPP3CA(3), PPP3CB(3), RAF1(1), SHC1(1), SOS1(4), SYK(2), VAV1(2) | 32114394 | 333 | 249 | 167 | 20 | 14 | 89 | 32 | 120 | 63 | 15 | <1.00e-15 | <1.00e-15 | <8.56e-15 |
| 9 | SIG_CHEMOTAXIS | Genes related to chemotaxis | ACTR2, ACTR3, AKT1, AKT2, AKT3, ANGPTL2, ARHGAP1, ARHGAP4, ARHGEF11, BTK, CDC42, CFL1, CFL2, GDI1, GDI2, INPPL1, ITPR1, ITPR2, ITPR3, LIMK1, MYLK, MYLK2, P101-PI3K, PAK1, PAK2, PAK3, PAK4, PAK6, PAK7, PDK1, PIK3CA, PIK3CD, PIK3CG, PIK3R1, PITX2, PPP1R13B, PTEN, RACGAP1, RHO, ROCK1, ROCK2, RPS4X, SAG, WASF1, WASL | 44 | AKT1(12), AKT2(1), AKT3(3), ARHGEF11(2), BTK(3), GDI1(4), INPPL1(2), ITPR1(8), ITPR2(3), ITPR3(4), LIMK1(3), MYLK(6), MYLK2(1), PAK1(2), PAK2(1), PAK3(2), PAK6(1), PAK7(1), PDK1(1), PIK3CA(194), PIK3CG(2), PIK3R1(14), PITX2(2), PPP1R13B(2), PTEN(17), RHO(2), ROCK1(1), ROCK2(2), RPS4X(1), SAG(1), WASF1(3), WASL(1) | 53971164 | 302 | 248 | 128 | 33 | 14 | 97 | 30 | 121 | 39 | 1 | 7.40e-13 | <1.00e-15 | <8.56e-15 |
| 10 | SIG_PIP3_SIGNALING_IN_CARDIAC_MYOCTES | Genes related to PIP3 signaling in cardiac myocytes | AKT1, AKT2, AKT3, BAD, BCL2L1, CDC42, CDK2, CDKN1B, CDKN2A, CREB1, CREB3, CREB5, EBP, ERBB4, F2RL2, FOXO3A, FRAP1, GAB1, GADD45A, GRB2, GSK3A, GSK3B, IFI27, IGF1, IGFBP1, INPPL1, IRS1, IRS2, IRS4, MET, MYC, NOLC1, P101-PI3K, PAK1, PAK2, PAK3, PAK4, PAK6, PAK7, PARD3, PARD6A, PDK1, PIK3CA, PIK3CD, PPP1R13B, PREX1, PSCD3, PTEN, PTK2, PTPN1, RPS6KA1, RPS6KA2, RPS6KA3, RPS6KB1, SFN, SHC1, SLC2A4, SOS1, SOS2, TSC1, TSC2, YWHAB, YWHAE, YWHAG, YWHAH, YWHAQ, YWHAZ | 62 | AKT1(12), AKT2(1), AKT3(3), BAD(1), CDK2(1), CDKN1B(5), CREB1(1), CREB3(1), EBP(1), ERBB4(6), F2RL2(1), GAB1(1), GRB2(1), GSK3A(1), IGF1(1), INPPL1(2), IRS1(1), IRS4(4), MET(5), MYC(1), NOLC1(2), PAK1(2), PAK2(1), PAK3(2), PAK6(1), PAK7(1), PARD3(3), PDK1(1), PIK3CA(194), PPP1R13B(2), PREX1(8), PTEN(17), PTK2(3), RPS6KA1(1), RPS6KA2(2), RPS6KA3(2), SHC1(1), SLC2A4(1), SOS1(4), SOS2(2), TSC1(3), TSC2(2), YWHAB(1) | 57138393 | 306 | 247 | 132 | 28 | 18 | 98 | 38 | 117 | 34 | 1 | 2.78e-15 | <1.00e-15 | <8.56e-15 |
Table 7. Get Full Table A Ranked List of Significantly Mutated Genesets (Excluding Significantly Mutated Genes). Number of significant genesets found: 0. Number of genesets displayed: 10
| rank | geneset | description | genes | N_genes | mut_tally | N | n | npat | nsite | nsil | n1 | n2 | n3 | n4 | n5 | n6 | p_ns_s | p | q |
|---|---|---|---|---|---|---|---|---|---|---|---|---|---|---|---|---|---|---|---|
| 1 | STILBENE_COUMARINE_AND_LIGNIN_BIOSYNTHESIS | EPX, GBA3, LPO, MPO, PRDX1, PRDX2, PRDX5, PRDX6, TPO, TYR | 10 | EPX(1), LPO(5), MPO(2), PRDX1(1), PRDX5(1), TPO(6), TYR(4) | 7428057 | 20 | 20 | 20 | 2 | 6 | 2 | 5 | 3 | 4 | 0 | 0.067 | 0.014 | 1 | |
| 2 | EOSINOPHILSPATHWAY | Recruitment of eosinophils in the inflammatory response observed in asthma occurs via the chemoattractant eotaxin binding to the CCR3 receptor. | CCL11, CCL5, CCR3, CSF2, HLA-DRA, HLA-DRB1, IL3, IL5 | 7 | CCL11(1), CCR3(1), HLA-DRB1(4) | 1828749 | 6 | 6 | 6 | 1 | 0 | 1 | 1 | 2 | 2 | 0 | 0.43 | 0.015 | 1 |
| 3 | CREMPATHWAY | The transcription factor CREM activates a post-meiotic transcriptional cascade culminating in spermatogenesis. | ADCY1, CREM, FHL5, FSHB, FSHR, GNAS, XPO1 | 7 | ADCY1(3), CREM(2), FHL5(1), FSHR(4), GNAS(5), XPO1(3) | 6833346 | 18 | 18 | 18 | 2 | 4 | 4 | 3 | 5 | 2 | 0 | 0.13 | 0.015 | 1 |
| 4 | ST_PAC1_RECEPTOR_PATHWAY | The signaling peptide PACAP binds to its receptor, PAC1R, which activates adenylyl cyclase and phospholipase C. | ASAH1, CAMP, DAG1, GAS, GNAQ, ITPKA, ITPKB, PACAP | 6 | ASAH1(1), DAG1(1), GNAQ(1), ITPKA(1), ITPKB(8) | 4432701 | 12 | 12 | 12 | 0 | 2 | 1 | 3 | 4 | 2 | 0 | 0.04 | 0.024 | 1 |
| 5 | HSA00601_GLYCOSPHINGOLIPID_BIOSYNTHESIS_LACTOSERIES | Genes involved in glycosphingolipid biosynthesis - lactoseries | ABO, B3GALT1, B3GALT2, B3GALT5, B3GNT5, FUT1, FUT2, FUT3, ST3GAL3, ST3GAL4 | 10 | ABO(4), B3GALT1(1), B3GALT2(1), B3GALT5(1), FUT2(2), FUT3(4), ST3GAL3(1), ST3GAL4(1) | 5407662 | 15 | 15 | 14 | 2 | 4 | 5 | 2 | 2 | 2 | 0 | 0.05 | 0.028 | 1 |
| 6 | BLOOD_GROUP_GLYCOLIPID_BIOSYNTHESIS_LACTOSERIES | ABO, FUT1, FUT2, FUT3, FUT5, FUT6, SIAT6, ST3GAL3 | 7 | ABO(4), FUT2(2), FUT3(4), FUT5(1), ST3GAL3(1) | 3810105 | 12 | 12 | 11 | 2 | 4 | 3 | 1 | 2 | 2 | 0 | 0.096 | 0.039 | 1 | |
| 7 | INOSITOL_METABOLISM | ALDH6A1, ALDOA, ALDOB, ALDOC, TPI1 | 5 | ALDOA(4), ALDOB(2), TPI1(2) | 2928939 | 8 | 8 | 8 | 0 | 0 | 4 | 3 | 0 | 1 | 0 | 0.051 | 0.071 | 1 | |
| 8 | HSA00940_PHENYLPROPANOID_BIOSYNTHESIS | Genes involved in phenylpropanoid biosynthesis | EPX, GBA, GBA3, LPO, MPO, PRDX6, TPO | 7 | EPX(1), LPO(5), MPO(2), TPO(6) | 6402396 | 14 | 14 | 14 | 0 | 6 | 1 | 2 | 2 | 3 | 0 | 0.012 | 0.074 | 1 |
| 9 | METHIONINEPATHWAY | Catabolic Pathways for Methionine, Isoleucine, Threonine and Valine | BCKDHB, BCKDK, CBS, CTH, MUT | 5 | BCKDK(2), CBS(2), CTH(3), MUT(1) | 3739125 | 8 | 8 | 8 | 0 | 1 | 1 | 1 | 1 | 4 | 0 | 0.14 | 0.11 | 1 |
| 10 | PROSTAGLANDIN_AND_LEUKOTRIENE_METABOLISM | AKR1C3, ALOX12, ALOX15, ALOX5, CBR1, CBR3, CYP4F2, CYP4F3, CYP4F3, CYP4F2, EPX, GGT1, LPO, LTA4H, MPO, PGDS, PLA2G1B, PLA2G2A, PLA2G2E, PLA2G3, PLA2G4A, PLA2G5, PLA2G6, PRDX1, PRDX2, PRDX5, PRDX6, PTGDS, PTGES2, PTGIS, PTGS1, PTGS2, TBXAS1, TPO | 31 | AKR1C3(1), ALOX12(2), ALOX5(1), CBR1(1), CBR3(1), CYP4F2(1), EPX(1), GGT1(2), LPO(5), MPO(2), PLA2G2E(1), PLA2G3(3), PLA2G4A(7), PLA2G6(2), PRDX1(1), PRDX5(1), PTGDS(1), PTGIS(1), PTGS1(1), PTGS2(1), TBXAS1(1), TPO(6) | 21581976 | 43 | 41 | 41 | 3 | 9 | 5 | 14 | 7 | 8 | 0 | 0.00095 | 0.12 | 1 |
In brief, we tabulate the number of mutations and the number of covered bases for each gene. The counts are broken down by mutation context category: four context categories that are discovered by MutSig, and one for indel and 'null' mutations, which include indels, nonsense mutations, splice-site mutations, and non-stop (read-through) mutations. For each gene, we calculate the probability of seeing the observed constellation of mutations, i.e. the product P1 x P2 x ... x Pm, or a more extreme one, given the background mutation rates calculated across the dataset. [1]
This is an experimental feature. The full results of the analysis summarized in this report can be downloaded from the TCGA Data Coordination Center.