This pipeline computes the correlation between significant arm-level copy number variations (cnvs) and selected clinical features.
Testing the association between copy number variation 70 arm-level results and 8 clinical features across 489 patients, 5 significant findings detected with Q value < 0.25.
-
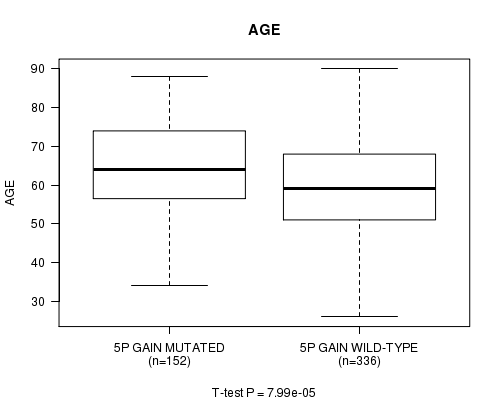
5p gain cnv correlated to 'AGE'.
-
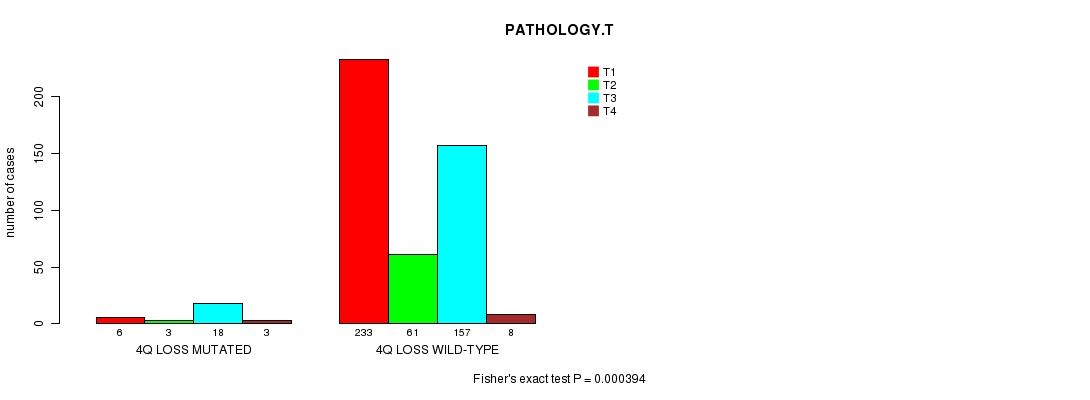
4q loss cnv correlated to 'PATHOLOGY.T'.
-
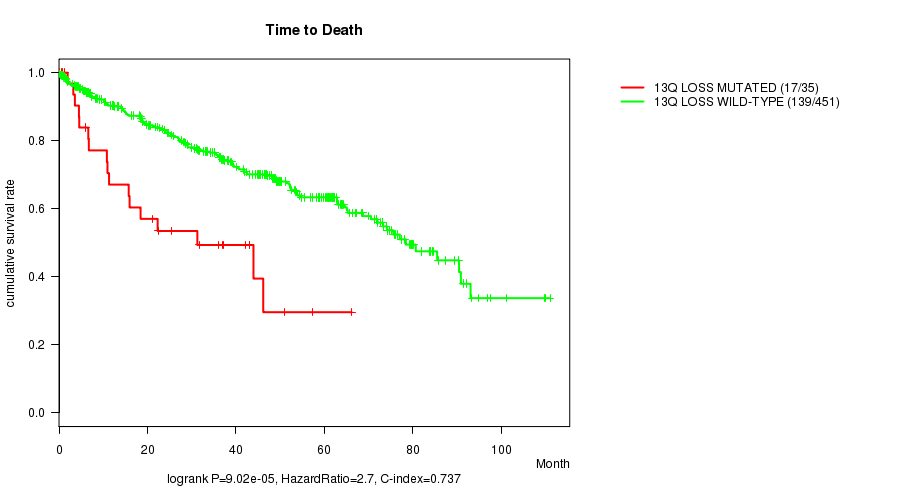
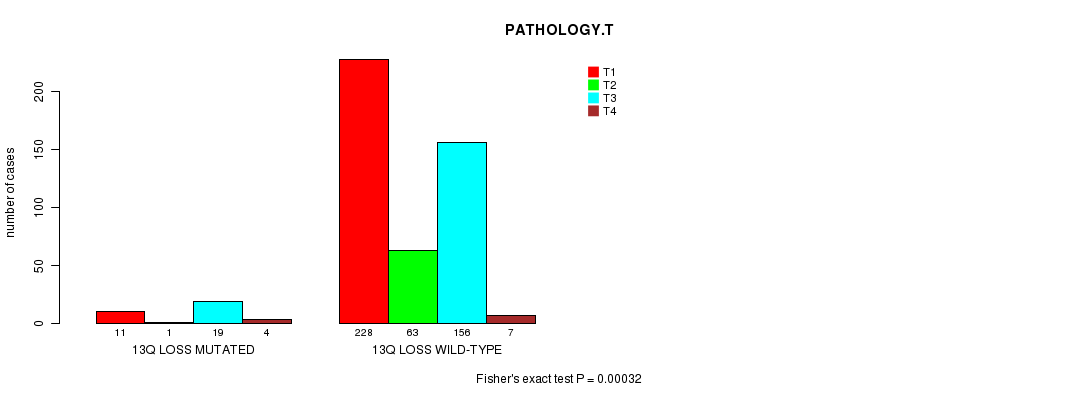
13q loss cnv correlated to 'Time to Death' and 'PATHOLOGY.T'.
-
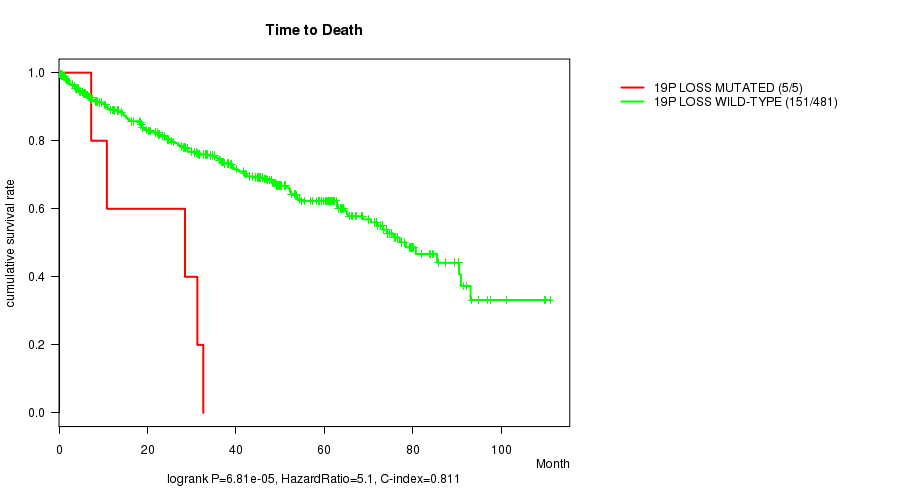
19p loss cnv correlated to 'Time to Death'.
Table 1. Get Full Table Overview of the association between significant copy number variation of 70 arm-level results and 8 clinical features. Shown in the table are P values (Q values). Thresholded by Q value < 0.25, 5 significant findings detected.
|
Clinical Features |
Time to Death |
AGE | GENDER |
KARNOFSKY PERFORMANCE SCORE |
PATHOLOGY T |
PATHOLOGY N |
PATHOLOGICSPREAD(M) |
NEOADJUVANT THERAPY |
||
| nCNV (%) | nWild-Type | logrank test | t-test | Fisher's exact test | t-test | Fisher's exact test | Fisher's exact test | Fisher's exact test | Fisher's exact test | |
| 13q loss | 35 (7%) | 454 |
9.02e-05 (0.0476) |
0.0205 (1.00) |
0.717 (1.00) |
0.00419 (1.00) |
0.00032 (0.168) |
0.63 (1.00) |
0.0468 (1.00) |
1 (1.00) |
| 5p gain | 152 (31%) | 337 |
0.657 (1.00) |
7.99e-05 (0.0422) |
0.473 (1.00) |
0.664 (1.00) |
0.00728 (1.00) |
0.796 (1.00) |
0.343 (1.00) |
0.177 (1.00) |
| 4q loss | 30 (6%) | 459 |
0.00995 (1.00) |
0.53 (1.00) |
0.43 (1.00) |
0.0261 (1.00) |
0.000394 (0.207) |
1 (1.00) |
0.033 (1.00) |
0.272 (1.00) |
| 19p loss | 5 (1%) | 484 |
6.81e-05 (0.036) |
0.684 (1.00) |
1 (1.00) |
0.00979 (1.00) |
0.266 (1.00) |
0.567 (1.00) |
1 (1.00) |
|
| 1p gain | 10 (2%) | 479 |
0.941 (1.00) |
0.997 (1.00) |
0.744 (1.00) |
0.407 (1.00) |
1 (1.00) |
0.656 (1.00) |
1 (1.00) |
|
| 1q gain | 37 (8%) | 452 |
0.839 (1.00) |
0.0198 (1.00) |
0.721 (1.00) |
0.518 (1.00) |
0.567 (1.00) |
0.12 (1.00) |
0.634 (1.00) |
0.326 (1.00) |
| 2p gain | 45 (9%) | 444 |
0.926 (1.00) |
0.0905 (1.00) |
0.188 (1.00) |
0.563 (1.00) |
0.639 (1.00) |
1 (1.00) |
0.278 (1.00) |
1 (1.00) |
| 2q gain | 50 (10%) | 439 |
0.352 (1.00) |
0.0512 (1.00) |
0.0114 (1.00) |
0.159 (1.00) |
0.761 (1.00) |
0.23 (1.00) |
0.15 (1.00) |
1 (1.00) |
| 3q gain | 25 (5%) | 464 |
0.642 (1.00) |
0.844 (1.00) |
0.667 (1.00) |
0.0875 (1.00) |
0.362 (1.00) |
0.278 (1.00) |
0.0853 (1.00) |
0.0228 (1.00) |
| 4p gain | 9 (2%) | 480 |
0.0583 (1.00) |
0.798 (1.00) |
0.726 (1.00) |
0.091 (1.00) |
0.0873 (1.00) |
1 (1.00) |
1 (1.00) |
|
| 4q gain | 9 (2%) | 480 |
0.346 (1.00) |
0.184 (1.00) |
1 (1.00) |
0.155 (1.00) |
0.421 (1.00) |
1 (1.00) |
1 (1.00) |
|
| 5q gain | 231 (47%) | 258 |
0.228 (1.00) |
0.00468 (1.00) |
0.849 (1.00) |
0.944 (1.00) |
0.137 (1.00) |
0.327 (1.00) |
0.708 (1.00) |
0.671 (1.00) |
| 6p gain | 5 (1%) | 484 |
0.531 (1.00) |
0.264 (1.00) |
1 (1.00) |
0.407 (1.00) |
1 (1.00) |
0.567 (1.00) |
1 (1.00) |
|
| 6q gain | 4 (1%) | 485 |
0.462 (1.00) |
0.491 (1.00) |
1 (1.00) |
0.148 (1.00) |
1 (1.00) |
0.487 (1.00) |
1 (1.00) |
|
| 7p gain | 125 (26%) | 364 |
0.871 (1.00) |
0.434 (1.00) |
0.0813 (1.00) |
0.893 (1.00) |
0.203 (1.00) |
0.29 (1.00) |
0.0306 (1.00) |
0.606 (1.00) |
| 7q gain | 126 (26%) | 363 |
0.805 (1.00) |
0.552 (1.00) |
0.039 (1.00) |
0.699 (1.00) |
0.186 (1.00) |
0.413 (1.00) |
0.0151 (1.00) |
0.111 (1.00) |
| 8p gain | 19 (4%) | 470 |
0.454 (1.00) |
0.495 (1.00) |
0.0884 (1.00) |
0.757 (1.00) |
0.0038 (1.00) |
1 (1.00) |
1 (1.00) |
1 (1.00) |
| 8q gain | 38 (8%) | 451 |
0.489 (1.00) |
0.198 (1.00) |
0.158 (1.00) |
0.297 (1.00) |
0.00444 (1.00) |
0.639 (1.00) |
1 (1.00) |
1 (1.00) |
| 9p gain | 9 (2%) | 480 |
0.298 (1.00) |
0.343 (1.00) |
0.0708 (1.00) |
0.177 (1.00) |
1 (1.00) |
0.367 (1.00) |
1 (1.00) |
|
| 9q gain | 7 (1%) | 482 |
0.748 (1.00) |
0.384 (1.00) |
0.244 (1.00) |
0.00433 (1.00) |
1 (1.00) |
1 (1.00) |
1 (1.00) |
|
| 10p gain | 5 (1%) | 484 |
0.711 (1.00) |
0.0955 (1.00) |
0.347 (1.00) |
0.0273 (1.00) |
1 (1.00) |
0.567 (1.00) |
0.0503 (1.00) |
|
| 10q gain | 3 (1%) | 486 |
0.478 (1.00) |
0.34 (1.00) |
0.0415 (1.00) |
0.301 (1.00) |
1 (1.00) |
1 (1.00) |
0.0304 (1.00) |
|
| 11p gain | 16 (3%) | 473 |
0.981 (1.00) |
0.949 (1.00) |
0.795 (1.00) |
0.115 (1.00) |
0.0296 (1.00) |
1 (1.00) |
0.082 (1.00) |
0.154 (1.00) |
| 11q gain | 15 (3%) | 474 |
0.616 (1.00) |
0.444 (1.00) |
0.784 (1.00) |
0.0363 (1.00) |
1 (1.00) |
0.264 (1.00) |
0.145 (1.00) |
|
| 12p gain | 72 (15%) | 417 |
0.0587 (1.00) |
0.214 (1.00) |
0.503 (1.00) |
0.404 (1.00) |
0.0161 (1.00) |
0.534 (1.00) |
0.0203 (1.00) |
0.159 (1.00) |
| 12q gain | 74 (15%) | 415 |
0.0861 (1.00) |
0.267 (1.00) |
0.356 (1.00) |
0.404 (1.00) |
0.0217 (1.00) |
1 (1.00) |
0.0339 (1.00) |
0.166 (1.00) |
| 13q gain | 16 (3%) | 473 |
0.323 (1.00) |
0.987 (1.00) |
0.795 (1.00) |
0.148 (1.00) |
1 (1.00) |
0.722 (1.00) |
0.00949 (1.00) |
|
| 14q gain | 5 (1%) | 484 |
0.438 (1.00) |
0.518 (1.00) |
1 (1.00) |
0.0221 (1.00) |
1 (1.00) |
0.567 (1.00) |
1 (1.00) |
|
| 15q gain | 14 (3%) | 475 |
0.867 (1.00) |
0.954 (1.00) |
0.779 (1.00) |
0.233 (1.00) |
0.465 (1.00) |
0.46 (1.00) |
1 (1.00) |
|
| 16p gain | 66 (13%) | 423 |
0.568 (1.00) |
0.0783 (1.00) |
0.269 (1.00) |
0.4 (1.00) |
0.857 (1.00) |
0.0837 (1.00) |
0.716 (1.00) |
0.137 (1.00) |
| 16q gain | 59 (12%) | 430 |
0.444 (1.00) |
0.0752 (1.00) |
0.112 (1.00) |
0.191 (1.00) |
0.73 (1.00) |
0.144 (1.00) |
1 (1.00) |
0.476 (1.00) |
| 17p gain | 17 (3%) | 472 |
0.297 (1.00) |
0.464 (1.00) |
1 (1.00) |
0.188 (1.00) |
0.544 (1.00) |
0.491 (1.00) |
0.163 (1.00) |
|
| 17q gain | 22 (4%) | 467 |
0.46 (1.00) |
0.191 (1.00) |
0.647 (1.00) |
0.161 (1.00) |
0.2 (1.00) |
1 (1.00) |
0.226 (1.00) |
0.206 (1.00) |
| 18p gain | 17 (3%) | 472 |
0.105 (1.00) |
0.659 (1.00) |
0.0404 (1.00) |
0.922 (1.00) |
1 (1.00) |
0.491 (1.00) |
1 (1.00) |
|
| 18q gain | 16 (3%) | 473 |
0.105 (1.00) |
0.889 (1.00) |
0.106 (1.00) |
0.721 (1.00) |
1 (1.00) |
0.486 (1.00) |
1 (1.00) |
|
| 19p gain | 24 (5%) | 465 |
0.625 (1.00) |
0.412 (1.00) |
0.827 (1.00) |
0.161 (1.00) |
0.544 (1.00) |
1 (1.00) |
0.775 (1.00) |
0.223 (1.00) |
| 19q gain | 28 (6%) | 461 |
0.858 (1.00) |
0.374 (1.00) |
0.683 (1.00) |
0.161 (1.00) |
0.491 (1.00) |
1 (1.00) |
0.414 (1.00) |
0.0284 (1.00) |
| 20p gain | 50 (10%) | 439 |
0.841 (1.00) |
0.965 (1.00) |
0.0272 (1.00) |
0.473 (1.00) |
0.172 (1.00) |
0.702 (1.00) |
0.0129 (1.00) |
0.418 (1.00) |
| 20q gain | 52 (11%) | 437 |
0.807 (1.00) |
0.459 (1.00) |
0.0656 (1.00) |
0.473 (1.00) |
0.13 (1.00) |
0.702 (1.00) |
0.0638 (1.00) |
0.431 (1.00) |
| 21q gain | 33 (7%) | 456 |
0.11 (1.00) |
0.313 (1.00) |
0.851 (1.00) |
0.161 (1.00) |
0.422 (1.00) |
1 (1.00) |
0.618 (1.00) |
1 (1.00) |
| 22q gain | 23 (5%) | 466 |
0.957 (1.00) |
0.803 (1.00) |
0.823 (1.00) |
0.17 (1.00) |
1 (1.00) |
0.375 (1.00) |
1 (1.00) |
|
| 1p loss | 35 (7%) | 454 |
0.575 (1.00) |
0.326 (1.00) |
0.274 (1.00) |
0.115 (1.00) |
0.263 (1.00) |
1 (1.00) |
0.632 (1.00) |
1 (1.00) |
| 1q loss | 21 (4%) | 468 |
0.409 (1.00) |
0.926 (1.00) |
0.353 (1.00) |
0.21 (1.00) |
0.506 (1.00) |
0.546 (1.00) |
1 (1.00) |
|
| 2p loss | 12 (2%) | 477 |
0.895 (1.00) |
0.857 (1.00) |
0.556 (1.00) |
0.0126 (1.00) |
1 (1.00) |
0.702 (1.00) |
1 (1.00) |
|
| 2q loss | 13 (3%) | 476 |
0.722 (1.00) |
0.906 (1.00) |
0.557 (1.00) |
0.0343 (1.00) |
1 (1.00) |
0.702 (1.00) |
1 (1.00) |
|
| 3p loss | 371 (76%) | 118 |
0.109 (1.00) |
0.536 (1.00) |
1 (1.00) |
0.788 (1.00) |
0.00183 (0.956) |
0.584 (1.00) |
0.0557 (1.00) |
0.0935 (1.00) |
| 3q loss | 90 (18%) | 399 |
0.2 (1.00) |
0.013 (1.00) |
0.0497 (1.00) |
0.0535 (1.00) |
0.0285 (1.00) |
1 (1.00) |
0.0738 (1.00) |
0.59 (1.00) |
| 4p loss | 31 (6%) | 458 |
0.0124 (1.00) |
0.932 (1.00) |
1 (1.00) |
0.0176 (1.00) |
0.00303 (1.00) |
1 (1.00) |
0.298 (1.00) |
0.28 (1.00) |
| 6p loss | 60 (12%) | 429 |
0.27 (1.00) |
0.219 (1.00) |
0.00374 (1.00) |
0.499 (1.00) |
0.62 (1.00) |
0.391 (1.00) |
0.337 (1.00) |
0.482 (1.00) |
| 6q loss | 95 (19%) | 394 |
0.786 (1.00) |
0.343 (1.00) |
0.0558 (1.00) |
0.851 (1.00) |
0.959 (1.00) |
0.152 (1.00) |
0.636 (1.00) |
0.251 (1.00) |
| 8p loss | 93 (19%) | 396 |
0.433 (1.00) |
0.164 (1.00) |
0.227 (1.00) |
0.0817 (1.00) |
0.278 (1.00) |
0.0498 (1.00) |
0.873 (1.00) |
1 (1.00) |
| 8q loss | 40 (8%) | 449 |
0.285 (1.00) |
0.795 (1.00) |
0.0156 (1.00) |
0.00425 (1.00) |
0.919 (1.00) |
0.375 (1.00) |
0.176 (1.00) |
1 (1.00) |
| 9p loss | 84 (17%) | 405 |
0.00702 (1.00) |
0.0339 (1.00) |
0.0115 (1.00) |
0.0261 (1.00) |
0.37 (1.00) |
1 (1.00) |
0.00428 (1.00) |
0.206 (1.00) |
| 9q loss | 84 (17%) | 405 |
0.0217 (1.00) |
0.0178 (1.00) |
0.0232 (1.00) |
0.0473 (1.00) |
0.143 (1.00) |
0.746 (1.00) |
0.00428 (1.00) |
0.206 (1.00) |
| 10p loss | 34 (7%) | 455 |
0.718 (1.00) |
0.413 (1.00) |
0.853 (1.00) |
0.00413 (1.00) |
0.0159 (1.00) |
1 (1.00) |
0.628 (1.00) |
1 (1.00) |
| 10q loss | 55 (11%) | 434 |
0.216 (1.00) |
0.095 (1.00) |
0.135 (1.00) |
0.66 (1.00) |
0.00682 (1.00) |
0.649 (1.00) |
1 (1.00) |
1 (1.00) |
| 11p loss | 4 (1%) | 485 |
0.00131 (0.686) |
0.737 (1.00) |
1 (1.00) |
0.816 (1.00) |
0.143 (1.00) |
0.487 (1.00) |
1 (1.00) |
|
| 11q loss | 7 (1%) | 482 |
0.326 (1.00) |
0.38 (1.00) |
0.43 (1.00) |
0.707 (1.00) |
0.322 (1.00) |
0.293 (1.00) |
1 (1.00) |
|
| 12p loss | 3 (1%) | 486 |
0.837 (1.00) |
0.73 (1.00) |
1 (1.00) |
0.743 (1.00) |
1 (1.00) |
1 (1.00) |
1 (1.00) |
|
| 12q loss | 4 (1%) | 485 |
0.179 (1.00) |
0.59 (1.00) |
1 (1.00) |
1 (1.00) |
1 (1.00) |
1 (1.00) |
1 (1.00) |
|
| 14q loss | 157 (32%) | 332 |
0.204 (1.00) |
0.145 (1.00) |
0.362 (1.00) |
0.508 (1.00) |
0.0724 (1.00) |
0.195 (1.00) |
0.347 (1.00) |
0.0387 (1.00) |
| 15q loss | 11 (2%) | 478 |
0.521 (1.00) |
0.0482 (1.00) |
0.755 (1.00) |
0.406 (1.00) |
0.373 (1.00) |
0.68 (1.00) |
1 (1.00) |
|
| 16q loss | 6 (1%) | 483 |
0.256 (1.00) |
0.0574 (1.00) |
0.67 (1.00) |
0.0124 (1.00) |
1 (1.00) |
1 (1.00) |
1 (1.00) |
|
| 17p loss | 28 (6%) | 461 |
0.00811 (1.00) |
0.304 (1.00) |
0.311 (1.00) |
0.115 (1.00) |
0.358 (1.00) |
0.608 (1.00) |
0.172 (1.00) |
0.256 (1.00) |
| 17q loss | 13 (3%) | 476 |
0.875 (1.00) |
0.95 (1.00) |
0.236 (1.00) |
0.125 (1.00) |
1 (1.00) |
0.432 (1.00) |
0.127 (1.00) |
|
| 18p loss | 44 (9%) | 445 |
0.214 (1.00) |
0.06 (1.00) |
0.509 (1.00) |
0.482 (1.00) |
0.249 (1.00) |
0.671 (1.00) |
0.378 (1.00) |
0.377 (1.00) |
| 18q loss | 50 (10%) | 439 |
0.408 (1.00) |
0.158 (1.00) |
0.348 (1.00) |
0.482 (1.00) |
0.47 (1.00) |
1 (1.00) |
0.308 (1.00) |
0.418 (1.00) |
| 20p loss | 6 (1%) | 483 |
0.754 (1.00) |
0.958 (1.00) |
1 (1.00) |
0.881 (1.00) |
1 (1.00) |
1 (1.00) |
1 (1.00) |
|
| 21q loss | 31 (6%) | 458 |
0.822 (1.00) |
0.922 (1.00) |
1 (1.00) |
0.00679 (1.00) |
0.336 (1.00) |
0.202 (1.00) |
1 (1.00) |
|
| 22q loss | 11 (2%) | 478 |
0.0956 (1.00) |
0.0317 (1.00) |
0.755 (1.00) |
0.0964 (1.00) |
1 (1.00) |
1 (1.00) |
1 (1.00) |
P value = 7.99e-05 (t-test), Q value = 0.042
Table S1. Gene #8: '5p gain mutation analysis' versus Clinical Feature #2: 'AGE'
| nPatients | Mean (Std.Dev) | |
|---|---|---|
| ALL | 488 | 60.6 (12.2) |
| 5P GAIN MUTATED | 152 | 63.8 (11.6) |
| 5P GAIN WILD-TYPE | 336 | 59.2 (12.2) |
Figure S1. Get High-res Image Gene #8: '5p gain mutation analysis' versus Clinical Feature #2: 'AGE'
P value = 0.000394 (Fisher's exact test), Q value = 0.21
Table S2. Gene #46: '4q loss mutation analysis' versus Clinical Feature #5: 'PATHOLOGY.T'
| nPatients | T1 | T2 | T3 | T4 |
|---|---|---|---|---|
| ALL | 239 | 64 | 175 | 11 |
| 4Q LOSS MUTATED | 6 | 3 | 18 | 3 |
| 4Q LOSS WILD-TYPE | 233 | 61 | 157 | 8 |
Figure S2. Get High-res Image Gene #46: '4q loss mutation analysis' versus Clinical Feature #5: 'PATHOLOGY.T'
P value = 9.02e-05 (logrank test), Q value = 0.048
Table S3. Gene #59: '13q loss mutation analysis' versus Clinical Feature #1: 'Time to Death'
| nPatients | nDeath | Duration Range (Median), Month | |
|---|---|---|---|
| ALL | 486 | 156 | 0.1 - 111.0 (34.9) |
| 13Q LOSS MUTATED | 35 | 17 | 0.1 - 66.2 (18.4) |
| 13Q LOSS WILD-TYPE | 451 | 139 | 0.1 - 111.0 (36.2) |
Figure S3. Get High-res Image Gene #59: '13q loss mutation analysis' versus Clinical Feature #1: 'Time to Death'
P value = 0.00032 (Fisher's exact test), Q value = 0.17
Table S4. Gene #59: '13q loss mutation analysis' versus Clinical Feature #5: 'PATHOLOGY.T'
| nPatients | T1 | T2 | T3 | T4 |
|---|---|---|---|---|
| ALL | 239 | 64 | 175 | 11 |
| 13Q LOSS MUTATED | 11 | 1 | 19 | 4 |
| 13Q LOSS WILD-TYPE | 228 | 63 | 156 | 7 |
Figure S4. Get High-res Image Gene #59: '13q loss mutation analysis' versus Clinical Feature #5: 'PATHOLOGY.T'
P value = 6.81e-05 (logrank test), Q value = 0.036
Table S5. Gene #67: '19p loss mutation analysis' versus Clinical Feature #1: 'Time to Death'
| nPatients | nDeath | Duration Range (Median), Month | |
|---|---|---|---|
| ALL | 486 | 156 | 0.1 - 111.0 (34.9) |
| 19P LOSS MUTATED | 5 | 5 | 7.3 - 32.6 (28.5) |
| 19P LOSS WILD-TYPE | 481 | 151 | 0.1 - 111.0 (35.5) |
Figure S5. Get High-res Image Gene #67: '19p loss mutation analysis' versus Clinical Feature #1: 'Time to Death'
-
Mutation data file = broad_values_by_arm.mutsig.cluster.txt
-
Clinical data file = KIRC.clin.merged.picked.txt
-
Number of patients = 489
-
Number of significantly arm-level cnvs = 70
-
Number of selected clinical features = 8
-
Exclude genes that fewer than K tumors have mutations, K = 3
For survival clinical features, the Kaplan-Meier survival curves of tumors with and without gene mutations were plotted and the statistical significance P values were estimated by logrank test (Bland and Altman 2004) using the 'survdiff' function in R
For continuous numerical clinical features, two-tailed Student's t test with unequal variance (Lehmann and Romano 2005) was applied to compare the clinical values between tumors with and without gene mutations using 't.test' function in R
For binary or multi-class clinical features (nominal or ordinal), two-tailed Fisher's exact tests (Fisher 1922) were used to estimate the P values using the 'fisher.test' function in R
For multiple hypothesis correction, Q value is the False Discovery Rate (FDR) analogue of the P value (Benjamini and Hochberg 1995), defined as the minimum FDR at which the test may be called significant. We used the 'Benjamini and Hochberg' method of 'p.adjust' function in R to convert P values into Q values.
This is an experimental feature. The full results of the analysis summarized in this report can be downloaded from the TCGA Data Coordination Center.