This pipeline computes the correlation between significant arm-level copy number variations (cnvs) and selected clinical features.
Testing the association between copy number variation 78 arm-level results and 6 clinical features across 552 patients, 8 significant findings detected with Q value < 0.25.
-
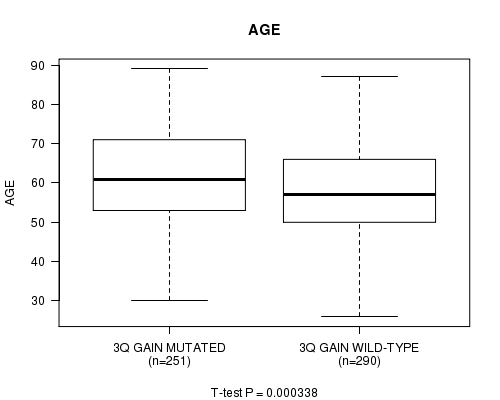
3q gain cnv correlated to 'AGE'.
-
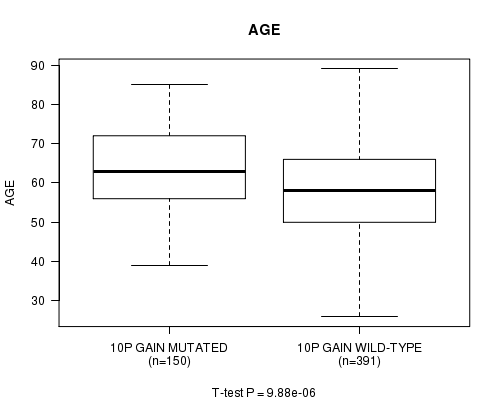
10p gain cnv correlated to 'AGE'.
-
12p gain cnv correlated to 'AGE'.
-
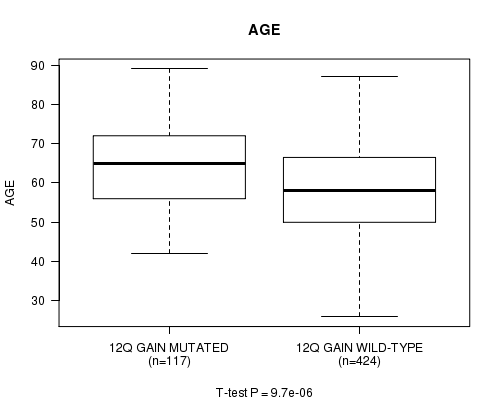
12q gain cnv correlated to 'AGE'.
-
20p gain cnv correlated to 'AGE'.
-
20q gain cnv correlated to 'AGE'.
-
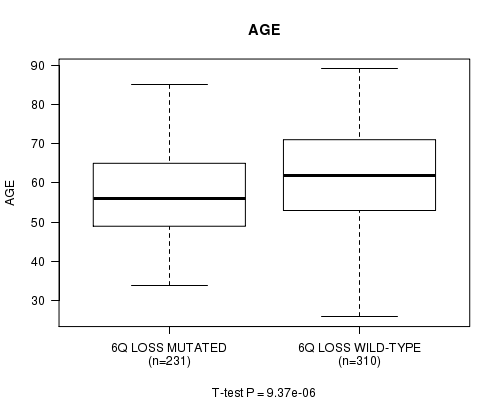
6q loss cnv correlated to 'AGE'.
-
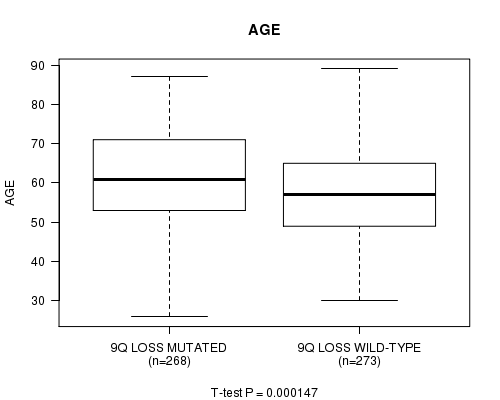
9q loss cnv correlated to 'AGE'.
Table 1. Get Full Table Overview of the association between significant copy number variation of 78 arm-level results and 6 clinical features. Shown in the table are P values (Q values). Thresholded by Q value < 0.25, 8 significant findings detected.
|
Clinical Features |
Time to Death |
AGE |
PRIMARY SITE OF DISEASE |
KARNOFSKY PERFORMANCE SCORE |
RADIATIONS RADIATION REGIMENINDICATION |
NEOADJUVANT THERAPY |
||
| nCNV (%) | nWild-Type | logrank test | t-test | Fisher's exact test | t-test | Fisher's exact test | Fisher's exact test | |
| 3q gain | 256 (46%) | 296 |
0.781 (1.00) |
0.000338 (0.155) |
0.465 (1.00) |
0.517 (1.00) |
0.253 (1.00) |
0.102 (1.00) |
| 10p gain | 154 (28%) | 398 |
0.474 (1.00) |
9.88e-06 (0.00456) |
0.149 (1.00) |
0.281 (1.00) |
1 (1.00) |
0.227 (1.00) |
| 12p gain | 213 (39%) | 339 |
0.281 (1.00) |
5.52e-06 (0.00256) |
0.275 (1.00) |
0.0439 (1.00) |
0.562 (1.00) |
0.219 (1.00) |
| 12q gain | 121 (22%) | 431 |
0.126 (1.00) |
9.7e-06 (0.00448) |
0.21 (1.00) |
0.261 (1.00) |
1 (1.00) |
0.599 (1.00) |
| 20p gain | 233 (42%) | 319 |
0.202 (1.00) |
2.2e-05 (0.0101) |
0.324 (1.00) |
0.0439 (1.00) |
0.576 (1.00) |
0.0787 (1.00) |
| 20q gain | 273 (49%) | 279 |
0.213 (1.00) |
0.000384 (0.175) |
0.749 (1.00) |
0.279 (1.00) |
0.62 (1.00) |
0.329 (1.00) |
| 6q loss | 237 (43%) | 315 |
0.732 (1.00) |
9.37e-06 (0.00434) |
1 (1.00) |
0.248 (1.00) |
1 (1.00) |
0.743 (1.00) |
| 9q loss | 274 (50%) | 278 |
0.78 (1.00) |
0.000147 (0.0675) |
0.185 (1.00) |
0.417 (1.00) |
0.622 (1.00) |
1 (1.00) |
| 1p gain | 109 (20%) | 443 |
0.206 (1.00) |
0.183 (1.00) |
0.0258 (1.00) |
0.106 (1.00) |
0.101 (1.00) |
0.683 (1.00) |
| 1q gain | 180 (33%) | 372 |
0.775 (1.00) |
0.00782 (1.00) |
0.104 (1.00) |
0.0796 (1.00) |
1 (1.00) |
1 (1.00) |
| 2p gain | 145 (26%) | 407 |
0.138 (1.00) |
0.000702 (0.32) |
1 (1.00) |
0.485 (1.00) |
1 (1.00) |
0.711 (1.00) |
| 2q gain | 114 (21%) | 438 |
0.203 (1.00) |
0.0113 (1.00) |
1 (1.00) |
0.964 (1.00) |
0.501 (1.00) |
0.688 (1.00) |
| 3p gain | 110 (20%) | 442 |
0.763 (1.00) |
0.00143 (0.648) |
0.59 (1.00) |
0.417 (1.00) |
1 (1.00) |
0.173 (1.00) |
| 4p gain | 38 (7%) | 514 |
0.127 (1.00) |
0.695 (1.00) |
0.249 (1.00) |
0.747 (1.00) |
1 (1.00) |
0.671 (1.00) |
| 4q gain | 16 (3%) | 536 |
0.832 (1.00) |
0.736 (1.00) |
1 (1.00) |
1 (1.00) |
0.518 (1.00) |
|
| 5p gain | 169 (31%) | 383 |
0.287 (1.00) |
0.187 (1.00) |
0.0877 (1.00) |
0.976 (1.00) |
1 (1.00) |
1 (1.00) |
| 5q gain | 39 (7%) | 513 |
0.765 (1.00) |
0.227 (1.00) |
0.255 (1.00) |
0.614 (1.00) |
1 (1.00) |
0.523 (1.00) |
| 6p gain | 162 (29%) | 390 |
0.102 (1.00) |
0.0231 (1.00) |
0.337 (1.00) |
0.00643 (1.00) |
0.559 (1.00) |
0.285 (1.00) |
| 6q gain | 65 (12%) | 487 |
0.575 (1.00) |
0.0406 (1.00) |
0.395 (1.00) |
0.15 (1.00) |
1 (1.00) |
0.236 (1.00) |
| 7p gain | 135 (24%) | 417 |
0.77 (1.00) |
0.0153 (1.00) |
0.252 (1.00) |
0.0427 (1.00) |
1 (1.00) |
0.528 (1.00) |
| 7q gain | 177 (32%) | 375 |
0.0687 (1.00) |
0.0242 (1.00) |
0.385 (1.00) |
0.00141 (0.642) |
0.555 (1.00) |
0.295 (1.00) |
| 8p gain | 71 (13%) | 481 |
0.412 (1.00) |
0.7 (1.00) |
1 (1.00) |
0.657 (1.00) |
0.339 (1.00) |
0.0744 (1.00) |
| 8q gain | 255 (46%) | 297 |
0.137 (1.00) |
0.353 (1.00) |
0.752 (1.00) |
0.981 (1.00) |
1 (1.00) |
0.23 (1.00) |
| 9p gain | 70 (13%) | 482 |
0.851 (1.00) |
0.0858 (1.00) |
1 (1.00) |
0.599 (1.00) |
1 (1.00) |
0.87 (1.00) |
| 9q gain | 28 (5%) | 524 |
0.631 (1.00) |
0.589 (1.00) |
1 (1.00) |
1 (1.00) |
1 (1.00) |
|
| 10q gain | 74 (13%) | 478 |
0.341 (1.00) |
0.167 (1.00) |
0.439 (1.00) |
0.394 (1.00) |
1 (1.00) |
0.203 (1.00) |
| 11p gain | 49 (9%) | 503 |
0.0848 (1.00) |
0.64 (1.00) |
1 (1.00) |
0.407 (1.00) |
1 (1.00) |
0.0836 (1.00) |
| 11q gain | 91 (16%) | 461 |
0.603 (1.00) |
0.0385 (1.00) |
1 (1.00) |
0.192 (1.00) |
1 (1.00) |
0.561 (1.00) |
| 13q gain | 53 (10%) | 499 |
0.843 (1.00) |
0.0127 (1.00) |
1 (1.00) |
0.232 (1.00) |
0.262 (1.00) |
0.094 (1.00) |
| 14q gain | 31 (6%) | 521 |
0.466 (1.00) |
0.909 (1.00) |
0.207 (1.00) |
0.392 (1.00) |
1 (1.00) |
1 (1.00) |
| 15q gain | 26 (5%) | 526 |
0.358 (1.00) |
0.724 (1.00) |
1 (1.00) |
1 (1.00) |
0.8 (1.00) |
|
| 16p gain | 38 (7%) | 514 |
0.141 (1.00) |
0.267 (1.00) |
1 (1.00) |
0.0292 (1.00) |
1 (1.00) |
0.83 (1.00) |
| 16q gain | 17 (3%) | 535 |
0.674 (1.00) |
0.886 (1.00) |
1 (1.00) |
0.22 (1.00) |
1 (1.00) |
1 (1.00) |
| 17p gain | 18 (3%) | 534 |
0.934 (1.00) |
0.764 (1.00) |
1 (1.00) |
0.767 (1.00) |
1 (1.00) |
0.219 (1.00) |
| 17q gain | 41 (7%) | 511 |
0.595 (1.00) |
0.227 (1.00) |
1 (1.00) |
0.913 (1.00) |
1 (1.00) |
0.541 (1.00) |
| 18p gain | 89 (16%) | 463 |
0.311 (1.00) |
0.0797 (1.00) |
1 (1.00) |
0.557 (1.00) |
1 (1.00) |
0.0255 (1.00) |
| 18q gain | 43 (8%) | 509 |
0.556 (1.00) |
0.563 (1.00) |
1 (1.00) |
0.252 (1.00) |
1 (1.00) |
0.308 (1.00) |
| 19p gain | 114 (21%) | 438 |
0.501 (1.00) |
0.0171 (1.00) |
0.605 (1.00) |
0.31 (1.00) |
0.501 (1.00) |
0.788 (1.00) |
| 19q gain | 92 (17%) | 460 |
0.323 (1.00) |
0.0424 (1.00) |
0.519 (1.00) |
0.657 (1.00) |
0.422 (1.00) |
0.465 (1.00) |
| 21q gain | 77 (14%) | 475 |
0.139 (1.00) |
0.0316 (1.00) |
1 (1.00) |
0.407 (1.00) |
1 (1.00) |
0.876 (1.00) |
| 22q gain | 13 (2%) | 539 |
0.344 (1.00) |
0.206 (1.00) |
1 (1.00) |
0.00339 (1.00) |
1 (1.00) |
0.28 (1.00) |
| 1p loss | 40 (7%) | 512 |
0.553 (1.00) |
0.352 (1.00) |
1 (1.00) |
0.464 (1.00) |
0.202 (1.00) |
0.531 (1.00) |
| 1q loss | 25 (5%) | 527 |
0.685 (1.00) |
0.846 (1.00) |
1 (1.00) |
0.498 (1.00) |
0.13 (1.00) |
0.112 (1.00) |
| 2p loss | 27 (5%) | 525 |
0.502 (1.00) |
0.601 (1.00) |
1 (1.00) |
0.0731 (1.00) |
1 (1.00) |
0.801 (1.00) |
| 2q loss | 29 (5%) | 523 |
0.691 (1.00) |
0.199 (1.00) |
0.195 (1.00) |
0.102 (1.00) |
1 (1.00) |
0.224 (1.00) |
| 3p loss | 78 (14%) | 474 |
0.337 (1.00) |
0.592 (1.00) |
1 (1.00) |
0.339 (1.00) |
0.367 (1.00) |
0.117 (1.00) |
| 3q loss | 22 (4%) | 530 |
0.116 (1.00) |
0.389 (1.00) |
1 (1.00) |
0.498 (1.00) |
0.115 (1.00) |
0.158 (1.00) |
| 4p loss | 280 (51%) | 272 |
0.572 (1.00) |
0.137 (1.00) |
0.492 (1.00) |
0.546 (1.00) |
1 (1.00) |
0.587 (1.00) |
| 4q loss | 320 (58%) | 232 |
0.92 (1.00) |
0.115 (1.00) |
0.322 (1.00) |
0.44 (1.00) |
1 (1.00) |
0.509 (1.00) |
| 5p loss | 100 (18%) | 452 |
0.318 (1.00) |
0.351 (1.00) |
1 (1.00) |
0.482 (1.00) |
0.452 (1.00) |
0.572 (1.00) |
| 5q loss | 213 (39%) | 339 |
0.971 (1.00) |
0.895 (1.00) |
0.775 (1.00) |
0.621 (1.00) |
0.562 (1.00) |
0.314 (1.00) |
| 6p loss | 134 (24%) | 418 |
0.498 (1.00) |
0.00682 (1.00) |
0.672 (1.00) |
0.503 (1.00) |
0.567 (1.00) |
0.526 (1.00) |
| 7p loss | 106 (19%) | 446 |
0.462 (1.00) |
0.162 (1.00) |
0.575 (1.00) |
0.139 (1.00) |
1 (1.00) |
1 (1.00) |
| 7q loss | 54 (10%) | 498 |
0.801 (1.00) |
0.447 (1.00) |
0.338 (1.00) |
0.921 (1.00) |
0.266 (1.00) |
0.145 (1.00) |
| 8p loss | 289 (52%) | 263 |
0.491 (1.00) |
0.257 (1.00) |
0.75 (1.00) |
0.254 (1.00) |
1 (1.00) |
0.383 (1.00) |
| 8q loss | 70 (13%) | 482 |
0.509 (1.00) |
0.28 (1.00) |
1 (1.00) |
0.0604 (1.00) |
1 (1.00) |
0.87 (1.00) |
| 9p loss | 243 (44%) | 309 |
0.714 (1.00) |
0.0286 (1.00) |
0.159 (1.00) |
0.957 (1.00) |
0.585 (1.00) |
0.274 (1.00) |
| 10p loss | 89 (16%) | 463 |
0.979 (1.00) |
0.529 (1.00) |
1 (1.00) |
0.995 (1.00) |
0.0691 (1.00) |
0.302 (1.00) |
| 10q loss | 117 (21%) | 435 |
0.541 (1.00) |
0.917 (1.00) |
1 (1.00) |
0.862 (1.00) |
0.00933 (1.00) |
0.0631 (1.00) |
| 11p loss | 182 (33%) | 370 |
0.435 (1.00) |
0.175 (1.00) |
1 (1.00) |
0.621 (1.00) |
0.254 (1.00) |
0.817 (1.00) |
| 11q loss | 120 (22%) | 432 |
0.362 (1.00) |
0.0888 (1.00) |
0.626 (1.00) |
0.243 (1.00) |
0.521 (1.00) |
0.694 (1.00) |
| 12p loss | 63 (11%) | 489 |
0.469 (1.00) |
0.0427 (1.00) |
1 (1.00) |
0.169 (1.00) |
1 (1.00) |
0.231 (1.00) |
| 12q loss | 99 (18%) | 453 |
0.678 (1.00) |
0.0122 (1.00) |
1 (1.00) |
0.737 (1.00) |
1 (1.00) |
0.57 (1.00) |
| 13q loss | 266 (48%) | 286 |
0.904 (1.00) |
0.753 (1.00) |
0.482 (1.00) |
0.449 (1.00) |
1 (1.00) |
0.327 (1.00) |
| 14q loss | 197 (36%) | 355 |
0.215 (1.00) |
0.387 (1.00) |
0.408 (1.00) |
0.637 (1.00) |
0.556 (1.00) |
0.427 (1.00) |
| 15q loss | 228 (41%) | 324 |
0.809 (1.00) |
0.0571 (1.00) |
0.312 (1.00) |
0.596 (1.00) |
0.572 (1.00) |
0.0475 (1.00) |
| 16p loss | 283 (51%) | 269 |
0.319 (1.00) |
0.265 (1.00) |
0.749 (1.00) |
0.0109 (1.00) |
0.615 (1.00) |
0.745 (1.00) |
| 16q loss | 388 (70%) | 164 |
0.295 (1.00) |
0.0344 (1.00) |
1 (1.00) |
0.0549 (1.00) |
0.558 (1.00) |
0.405 (1.00) |
| 17p loss | 419 (76%) | 133 |
0.783 (1.00) |
0.0148 (1.00) |
0.246 (1.00) |
0.671 (1.00) |
0.146 (1.00) |
0.899 (1.00) |
| 17q loss | 317 (57%) | 235 |
0.166 (1.00) |
0.0337 (1.00) |
1 (1.00) |
0.299 (1.00) |
0.578 (1.00) |
0.0615 (1.00) |
| 18p loss | 198 (36%) | 354 |
0.301 (1.00) |
0.612 (1.00) |
0.408 (1.00) |
0.709 (1.00) |
0.0457 (1.00) |
0.174 (1.00) |
| 18q loss | 267 (48%) | 285 |
0.704 (1.00) |
0.24 (1.00) |
0.25 (1.00) |
0.167 (1.00) |
0.113 (1.00) |
0.192 (1.00) |
| 19p loss | 169 (31%) | 383 |
0.841 (1.00) |
0.615 (1.00) |
0.769 (1.00) |
0.77 (1.00) |
0.223 (1.00) |
1 (1.00) |
| 19q loss | 186 (34%) | 366 |
0.539 (1.00) |
0.519 (1.00) |
0.8 (1.00) |
0.725 (1.00) |
0.554 (1.00) |
0.819 (1.00) |
| 20p loss | 45 (8%) | 507 |
0.055 (1.00) |
0.141 (1.00) |
1 (1.00) |
0.921 (1.00) |
0.226 (1.00) |
0.692 (1.00) |
| 20q loss | 23 (4%) | 529 |
0.152 (1.00) |
0.887 (1.00) |
1 (1.00) |
1 (1.00) |
0.411 (1.00) |
|
| 21q loss | 159 (29%) | 393 |
0.549 (1.00) |
0.876 (1.00) |
0.744 (1.00) |
0.725 (1.00) |
1 (1.00) |
0.632 (1.00) |
| 22q loss | 393 (71%) | 159 |
0.662 (1.00) |
0.97 (1.00) |
0.0742 (1.00) |
0.737 (1.00) |
0.561 (1.00) |
0.548 (1.00) |
P value = 0.000338 (t-test), Q value = 0.15
Table S1. Gene #6: '3q gain mutation analysis' versus Clinical Feature #2: 'AGE'
| nPatients | Mean (Std.Dev) | |
|---|---|---|
| ALL | 541 | 59.7 (11.6) |
| 3Q GAIN MUTATED | 251 | 61.7 (11.5) |
| 3Q GAIN WILD-TYPE | 290 | 58.1 (11.5) |
Figure S1. Get High-res Image Gene #6: '3q gain mutation analysis' versus Clinical Feature #2: 'AGE'
P value = 9.88e-06 (t-test), Q value = 0.0046
Table S2. Gene #19: '10p gain mutation analysis' versus Clinical Feature #2: 'AGE'
| nPatients | Mean (Std.Dev) | |
|---|---|---|
| ALL | 541 | 59.7 (11.6) |
| 10P GAIN MUTATED | 150 | 63.2 (10.8) |
| 10P GAIN WILD-TYPE | 391 | 58.4 (11.6) |
Figure S2. Get High-res Image Gene #19: '10p gain mutation analysis' versus Clinical Feature #2: 'AGE'
P value = 5.52e-06 (t-test), Q value = 0.0026
Table S3. Gene #23: '12p gain mutation analysis' versus Clinical Feature #2: 'AGE'
| nPatients | Mean (Std.Dev) | |
|---|---|---|
| ALL | 541 | 59.7 (11.6) |
| 12P GAIN MUTATED | 207 | 62.6 (11.2) |
| 12P GAIN WILD-TYPE | 334 | 58.0 (11.5) |
Figure S3. Get High-res Image Gene #23: '12p gain mutation analysis' versus Clinical Feature #2: 'AGE'

P value = 9.7e-06 (t-test), Q value = 0.0045
Table S4. Gene #24: '12q gain mutation analysis' versus Clinical Feature #2: 'AGE'
| nPatients | Mean (Std.Dev) | |
|---|---|---|
| ALL | 541 | 59.7 (11.6) |
| 12Q GAIN MUTATED | 117 | 63.9 (11.0) |
| 12Q GAIN WILD-TYPE | 424 | 58.6 (11.5) |
Figure S4. Get High-res Image Gene #24: '12q gain mutation analysis' versus Clinical Feature #2: 'AGE'
P value = 2.2e-05 (t-test), Q value = 0.01
Table S5. Gene #36: '20p gain mutation analysis' versus Clinical Feature #2: 'AGE'
| nPatients | Mean (Std.Dev) | |
|---|---|---|
| ALL | 541 | 59.7 (11.6) |
| 20P GAIN MUTATED | 228 | 62.2 (11.5) |
| 20P GAIN WILD-TYPE | 313 | 57.9 (11.4) |
Figure S5. Get High-res Image Gene #36: '20p gain mutation analysis' versus Clinical Feature #2: 'AGE'

P value = 0.000384 (t-test), Q value = 0.18
Table S6. Gene #37: '20q gain mutation analysis' versus Clinical Feature #2: 'AGE'
| nPatients | Mean (Std.Dev) | |
|---|---|---|
| ALL | 541 | 59.7 (11.6) |
| 20Q GAIN MUTATED | 267 | 61.5 (11.9) |
| 20Q GAIN WILD-TYPE | 274 | 58.0 (11.0) |
Figure S6. Get High-res Image Gene #37: '20q gain mutation analysis' versus Clinical Feature #2: 'AGE'

P value = 9.37e-06 (t-test), Q value = 0.0043
Table S7. Gene #51: '6q loss mutation analysis' versus Clinical Feature #2: 'AGE'
| nPatients | Mean (Std.Dev) | |
|---|---|---|
| ALL | 541 | 59.7 (11.6) |
| 6Q LOSS MUTATED | 231 | 57.2 (10.9) |
| 6Q LOSS WILD-TYPE | 310 | 61.6 (11.8) |
Figure S7. Get High-res Image Gene #51: '6q loss mutation analysis' versus Clinical Feature #2: 'AGE'
P value = 0.000147 (t-test), Q value = 0.068
Table S8. Gene #57: '9q loss mutation analysis' versus Clinical Feature #2: 'AGE'
| nPatients | Mean (Std.Dev) | |
|---|---|---|
| ALL | 541 | 59.7 (11.6) |
| 9Q LOSS MUTATED | 268 | 61.7 (11.7) |
| 9Q LOSS WILD-TYPE | 273 | 57.9 (11.2) |
Figure S8. Get High-res Image Gene #57: '9q loss mutation analysis' versus Clinical Feature #2: 'AGE'
-
Mutation data file = broad_values_by_arm.mutsig.cluster.txt
-
Clinical data file = OV.clin.merged.picked.txt
-
Number of patients = 552
-
Number of significantly arm-level cnvs = 78
-
Number of selected clinical features = 6
-
Exclude genes that fewer than K tumors have mutations, K = 3
For survival clinical features, the Kaplan-Meier survival curves of tumors with and without gene mutations were plotted and the statistical significance P values were estimated by logrank test (Bland and Altman 2004) using the 'survdiff' function in R
For continuous numerical clinical features, two-tailed Student's t test with unequal variance (Lehmann and Romano 2005) was applied to compare the clinical values between tumors with and without gene mutations using 't.test' function in R
For binary or multi-class clinical features (nominal or ordinal), two-tailed Fisher's exact tests (Fisher 1922) were used to estimate the P values using the 'fisher.test' function in R
For multiple hypothesis correction, Q value is the False Discovery Rate (FDR) analogue of the P value (Benjamini and Hochberg 1995), defined as the minimum FDR at which the test may be called significant. We used the 'Benjamini and Hochberg' method of 'p.adjust' function in R to convert P values into Q values.
This is an experimental feature. The full results of the analysis summarized in this report can be downloaded from the TCGA Data Coordination Center.