This pipeline computes the correlation between significant arm-level copy number variations (cnvs) and selected clinical features.
Testing the association between copy number variation 79 arm-level results and 11 clinical features across 278 patients, 14 significant findings detected with Q value < 0.25.
-
1p gain cnv correlated to 'HISTOLOGICAL.TYPE'.
-
2q gain cnv correlated to 'HISTOLOGICAL.TYPE'.
-
11p gain cnv correlated to 'KARNOFSKY.PERFORMANCE.SCORE'.
-
17p gain cnv correlated to 'HISTOLOGICAL.TYPE'.
-
18q gain cnv correlated to 'KARNOFSKY.PERFORMANCE.SCORE'.
-
19p gain cnv correlated to 'KARNOFSKY.PERFORMANCE.SCORE' and 'HISTOLOGICAL.TYPE'.
-
21q gain cnv correlated to 'HISTOLOGICAL.TYPE'.
-
Xq gain cnv correlated to 'KARNOFSKY.PERFORMANCE.SCORE'.
-
12p loss cnv correlated to 'HISTOLOGICAL.TYPE'.
-
12q loss cnv correlated to 'HISTOLOGICAL.TYPE'.
-
16p loss cnv correlated to 'KARNOFSKY.PERFORMANCE.SCORE'.
-
16q loss cnv correlated to 'KARNOFSKY.PERFORMANCE.SCORE'.
-
17q loss cnv correlated to 'KARNOFSKY.PERFORMANCE.SCORE'.
Table 1. Get Full Table Overview of the association between significant copy number variation of 79 arm-level results and 11 clinical features. Shown in the table are P values (Q values). Thresholded by Q value < 0.25, 14 significant findings detected.
|
Clinical Features |
Time to Death |
AGE | GENDER |
KARNOFSKY PERFORMANCE SCORE |
HISTOLOGICAL TYPE |
PATHOLOGY T |
PATHOLOGY N |
PATHOLOGICSPREAD(M) |
TUMOR STAGE |
RADIATIONS RADIATION REGIMENINDICATION |
NEOADJUVANT THERAPY |
||
| nCNV (%) | nWild-Type | logrank test | t-test | Fisher's exact test | t-test | Chi-square test | Fisher's exact test | Fisher's exact test | Fisher's exact test | Fisher's exact test | Fisher's exact test | Fisher's exact test | |
| 19p gain | 30 (11%) | 248 |
0.431 (1.00) |
0.46 (1.00) |
0.828 (1.00) |
7.92e-06 (0.00672) |
1.44e-05 (0.0121) |
0.828 (1.00) |
0.736 (1.00) |
0.673 (1.00) |
0.685 (1.00) |
0.294 (1.00) |
1 (1.00) |
| 1p gain | 18 (6%) | 260 |
0.867 (1.00) |
0.154 (1.00) |
0.097 (1.00) |
3.73e-06 (0.00317) |
0.0354 (1.00) |
0.647 (1.00) |
0.278 (1.00) |
0.345 (1.00) |
0.494 (1.00) |
0.415 (1.00) |
|
| 2q gain | 34 (12%) | 244 |
0.564 (1.00) |
0.542 (1.00) |
0.836 (1.00) |
0.591 (1.00) |
2.92e-06 (0.00248) |
0.339 (1.00) |
0.422 (1.00) |
0.324 (1.00) |
0.029 (1.00) |
0.11 (1.00) |
0.766 (1.00) |
| 11p gain | 17 (6%) | 261 |
0.962 (1.00) |
0.511 (1.00) |
0.255 (1.00) |
8.74e-06 (0.0074) |
0.954 (1.00) |
0.00121 (1.00) |
0.409 (1.00) |
1 (1.00) |
0.589 (1.00) |
0.474 (1.00) |
0.694 (1.00) |
| 17p gain | 6 (2%) | 272 |
0.444 (1.00) |
0.48 (1.00) |
0.347 (1.00) |
2.93e-09 (2.49e-06) |
0.233 (1.00) |
0.558 (1.00) |
0.456 (1.00) |
0.126 (1.00) |
1 (1.00) |
1 (1.00) |
|
| 18q gain | 32 (12%) | 246 |
0.326 (1.00) |
0.91 (1.00) |
1 (1.00) |
9.14e-06 (0.00772) |
0.122 (1.00) |
0.558 (1.00) |
0.594 (1.00) |
0.167 (1.00) |
0.909 (1.00) |
1 (1.00) |
0.757 (1.00) |
| 21q gain | 15 (5%) | 263 |
0.675 (1.00) |
0.994 (1.00) |
1 (1.00) |
0.996 (1.00) |
4.07e-05 (0.0343) |
0.383 (1.00) |
0.334 (1.00) |
0.417 (1.00) |
0.383 (1.00) |
0.431 (1.00) |
0.0125 (1.00) |
| Xq gain | 8 (3%) | 270 |
0.901 (1.00) |
0.363 (1.00) |
1 (1.00) |
9.14e-06 (0.00772) |
0.989 (1.00) |
0.408 (1.00) |
1 (1.00) |
1 (1.00) |
0.468 (1.00) |
1 (1.00) |
0.198 (1.00) |
| 12p loss | 4 (1%) | 274 |
0.499 (1.00) |
0.0133 (1.00) |
0.289 (1.00) |
4.02e-14 (3.43e-11) |
0.522 (1.00) |
1 (1.00) |
0.333 (1.00) |
0.554 (1.00) |
1 (1.00) |
0.358 (1.00) |
|
| 12q loss | 3 (1%) | 275 |
0.41 (1.00) |
0.174 (1.00) |
4.85e-19 (4.14e-16) |
0.395 (1.00) |
0.678 (1.00) |
0.261 (1.00) |
0.454 (1.00) |
1 (1.00) |
0.282 (1.00) |
||
| 16p loss | 38 (14%) | 240 |
0.0958 (1.00) |
0.411 (1.00) |
1 (1.00) |
8.74e-06 (0.0074) |
0.801 (1.00) |
0.74 (1.00) |
0.556 (1.00) |
1 (1.00) |
0.889 (1.00) |
1 (1.00) |
0.393 (1.00) |
| 16q loss | 51 (18%) | 227 |
0.0552 (1.00) |
0.0642 (1.00) |
0.226 (1.00) |
7.92e-06 (0.00672) |
0.675 (1.00) |
0.917 (1.00) |
0.324 (1.00) |
0.149 (1.00) |
0.916 (1.00) |
0.398 (1.00) |
0.619 (1.00) |
| 17q loss | 13 (5%) | 265 |
0.729 (1.00) |
0.433 (1.00) |
0.341 (1.00) |
9.14e-06 (0.00772) |
0.973 (1.00) |
0.154 (1.00) |
0.853 (1.00) |
0.245 (1.00) |
0.0697 (1.00) |
1 (1.00) |
0.633 (1.00) |
| 1q gain | 60 (22%) | 218 |
0.284 (1.00) |
0.451 (1.00) |
0.743 (1.00) |
0.446 (1.00) |
0.00517 (1.00) |
0.257 (1.00) |
0.786 (1.00) |
0.245 (1.00) |
0.492 (1.00) |
1 (1.00) |
0.347 (1.00) |
| 2p gain | 70 (25%) | 208 |
0.713 (1.00) |
0.733 (1.00) |
0.0424 (1.00) |
0.198 (1.00) |
0.0186 (1.00) |
0.173 (1.00) |
0.141 (1.00) |
0.0923 (1.00) |
0.194 (1.00) |
0.128 (1.00) |
0.258 (1.00) |
| 3p gain | 33 (12%) | 245 |
0.41 (1.00) |
0.0427 (1.00) |
0.142 (1.00) |
0.264 (1.00) |
0.979 (1.00) |
0.0531 (1.00) |
0.956 (1.00) |
0.491 (1.00) |
0.5 (1.00) |
1 (1.00) |
0.549 (1.00) |
| 3q gain | 124 (45%) | 154 |
0.705 (1.00) |
0.249 (1.00) |
0.891 (1.00) |
0.31 (1.00) |
0.348 (1.00) |
0.695 (1.00) |
0.93 (1.00) |
0.261 (1.00) |
0.722 (1.00) |
1 (1.00) |
0.0743 (1.00) |
| 4p gain | 10 (4%) | 268 |
0.997 (1.00) |
0.506 (1.00) |
0.0672 (1.00) |
0.796 (1.00) |
0.651 (1.00) |
0.047 (1.00) |
0.908 (1.00) |
0.64 (1.00) |
0.434 (1.00) |
1 (1.00) |
0.606 (1.00) |
| 4q gain | 7 (3%) | 271 |
0.317 (1.00) |
0.286 (1.00) |
0.679 (1.00) |
0.391 (1.00) |
0.0698 (1.00) |
1 (1.00) |
1 (1.00) |
0.591 (1.00) |
1 (1.00) |
1 (1.00) |
|
| 5p gain | 131 (47%) | 147 |
0.435 (1.00) |
0.0771 (1.00) |
0.497 (1.00) |
0.693 (1.00) |
0.332 (1.00) |
0.0368 (1.00) |
0.612 (1.00) |
0.162 (1.00) |
0.65 (1.00) |
1 (1.00) |
1 (1.00) |
| 5q gain | 31 (11%) | 247 |
0.857 (1.00) |
0.454 (1.00) |
1 (1.00) |
0.523 (1.00) |
0.979 (1.00) |
0.816 (1.00) |
0.441 (1.00) |
0.554 (1.00) |
0.56 (1.00) |
0.309 (1.00) |
1 (1.00) |
| 6p gain | 27 (10%) | 251 |
0.739 (1.00) |
0.331 (1.00) |
1 (1.00) |
0.225 (1.00) |
0.0362 (1.00) |
0.0826 (1.00) |
0.795 (1.00) |
0.351 (1.00) |
0.0664 (1.00) |
0.252 (1.00) |
1 (1.00) |
| 6q gain | 15 (5%) | 263 |
0.83 (1.00) |
0.32 (1.00) |
0.766 (1.00) |
0.428 (1.00) |
0.0012 (1.00) |
0.493 (1.00) |
0.689 (1.00) |
1 (1.00) |
0.863 (1.00) |
0.431 (1.00) |
0.661 (1.00) |
| 7p gain | 82 (29%) | 196 |
0.399 (1.00) |
0.548 (1.00) |
0.656 (1.00) |
0.619 (1.00) |
0.762 (1.00) |
0.00711 (1.00) |
0.718 (1.00) |
0.534 (1.00) |
0.337 (1.00) |
0.728 (1.00) |
0.832 (1.00) |
| 7q gain | 77 (28%) | 201 |
0.528 (1.00) |
0.873 (1.00) |
0.544 (1.00) |
0.333 (1.00) |
0.496 (1.00) |
0.0223 (1.00) |
0.67 (1.00) |
0.326 (1.00) |
0.18 (1.00) |
0.732 (1.00) |
1 (1.00) |
| 8p gain | 42 (15%) | 236 |
0.481 (1.00) |
0.714 (1.00) |
0.85 (1.00) |
0.0289 (1.00) |
0.134 (1.00) |
0.532 (1.00) |
0.664 (1.00) |
0.134 (1.00) |
0.239 (1.00) |
0.18 (1.00) |
0.17 (1.00) |
| 8q gain | 85 (31%) | 193 |
0.533 (1.00) |
0.905 (1.00) |
0.662 (1.00) |
0.31 (1.00) |
0.852 (1.00) |
0.159 (1.00) |
0.67 (1.00) |
0.124 (1.00) |
0.0853 (1.00) |
0.18 (1.00) |
0.672 (1.00) |
| 9p gain | 18 (6%) | 260 |
0.209 (1.00) |
0.545 (1.00) |
0.269 (1.00) |
0.00323 (1.00) |
0.706 (1.00) |
0.619 (1.00) |
0.518 (1.00) |
0.634 (1.00) |
1 (1.00) |
1 (1.00) |
|
| 9q gain | 27 (10%) | 251 |
0.223 (1.00) |
0.429 (1.00) |
0.819 (1.00) |
0.602 (1.00) |
0.524 (1.00) |
0.526 (1.00) |
0.773 (1.00) |
0.269 (1.00) |
0.673 (1.00) |
0.605 (1.00) |
0.502 (1.00) |
| 10p gain | 13 (5%) | 265 |
0.631 (1.00) |
0.955 (1.00) |
0.524 (1.00) |
0.852 (1.00) |
0.973 (1.00) |
0.131 (1.00) |
0.132 (1.00) |
0.159 (1.00) |
0.0113 (1.00) |
0.386 (1.00) |
0.143 (1.00) |
| 10q gain | 6 (2%) | 272 |
0.349 (1.00) |
0.733 (1.00) |
1 (1.00) |
0.994 (1.00) |
0.429 (1.00) |
0.463 (1.00) |
1 (1.00) |
0.523 (1.00) |
0.199 (1.00) |
0.121 (1.00) |
|
| 11q gain | 19 (7%) | 259 |
0.569 (1.00) |
0.956 (1.00) |
0.419 (1.00) |
0.452 (1.00) |
0.934 (1.00) |
0.0064 (1.00) |
0.241 (1.00) |
0.527 (1.00) |
0.0404 (1.00) |
0.513 (1.00) |
0.431 (1.00) |
| 12p gain | 78 (28%) | 200 |
0.615 (1.00) |
0.804 (1.00) |
0.023 (1.00) |
0.368 (1.00) |
0.881 (1.00) |
0.057 (1.00) |
0.725 (1.00) |
0.918 (1.00) |
0.672 (1.00) |
0.474 (1.00) |
0.274 (1.00) |
| 12q gain | 36 (13%) | 242 |
0.733 (1.00) |
0.642 (1.00) |
0.0706 (1.00) |
0.958 (1.00) |
0.977 (1.00) |
0.0725 (1.00) |
0.108 (1.00) |
0.253 (1.00) |
0.212 (1.00) |
1 (1.00) |
0.237 (1.00) |
| 13q gain | 6 (2%) | 272 |
0.112 (1.00) |
0.567 (1.00) |
1 (1.00) |
0.994 (1.00) |
0.126 (1.00) |
1 (1.00) |
0.456 (1.00) |
0.759 (1.00) |
1 (1.00) |
1 (1.00) |
|
| 14q gain | 29 (10%) | 249 |
0.0929 (1.00) |
0.0403 (1.00) |
0.513 (1.00) |
0.937 (1.00) |
0.977 (1.00) |
0.439 (1.00) |
0.897 (1.00) |
0.669 (1.00) |
1 (1.00) |
1 (1.00) |
0.203 (1.00) |
| 15q gain | 25 (9%) | 253 |
0.618 (1.00) |
0.85 (1.00) |
0.817 (1.00) |
0.365 (1.00) |
0.458 (1.00) |
0.647 (1.00) |
0.255 (1.00) |
0.799 (1.00) |
0.247 (1.00) |
1 (1.00) |
0.733 (1.00) |
| 16p gain | 16 (6%) | 262 |
0.516 (1.00) |
0.315 (1.00) |
0.251 (1.00) |
0.0584 (1.00) |
0.889 (1.00) |
0.0252 (1.00) |
0.473 (1.00) |
1 (1.00) |
0.549 (1.00) |
1 (1.00) |
0.389 (1.00) |
| 16q gain | 19 (7%) | 259 |
0.838 (1.00) |
0.107 (1.00) |
0.114 (1.00) |
0.305 (1.00) |
0.944 (1.00) |
0.00727 (1.00) |
0.17 (1.00) |
0.296 (1.00) |
0.139 (1.00) |
1 (1.00) |
1 (1.00) |
| 17q gain | 34 (12%) | 244 |
0.133 (1.00) |
0.238 (1.00) |
0.0386 (1.00) |
0.326 (1.00) |
0.703 (1.00) |
0.662 (1.00) |
0.00659 (1.00) |
0.345 (1.00) |
0.0663 (1.00) |
0.11 (1.00) |
0.55 (1.00) |
| 18p gain | 45 (16%) | 233 |
0.0651 (1.00) |
0.101 (1.00) |
0.357 (1.00) |
0.577 (1.00) |
0.367 (1.00) |
0.39 (1.00) |
0.0579 (1.00) |
0.278 (1.00) |
0.219 (1.00) |
0.667 (1.00) |
0.436 (1.00) |
| 19q gain | 42 (15%) | 236 |
0.731 (1.00) |
0.833 (1.00) |
0.85 (1.00) |
0.183 (1.00) |
0.00113 (0.945) |
0.963 (1.00) |
0.281 (1.00) |
0.134 (1.00) |
0.121 (1.00) |
0.651 (1.00) |
0.41 (1.00) |
| 20p gain | 82 (29%) | 196 |
0.848 (1.00) |
0.137 (1.00) |
0.011 (1.00) |
0.19 (1.00) |
0.209 (1.00) |
0.808 (1.00) |
0.461 (1.00) |
0.115 (1.00) |
0.147 (1.00) |
0.166 (1.00) |
0.832 (1.00) |
| 20q gain | 70 (25%) | 208 |
0.482 (1.00) |
0.424 (1.00) |
0.162 (1.00) |
0.764 (1.00) |
0.109 (1.00) |
0.989 (1.00) |
0.535 (1.00) |
0.0531 (1.00) |
0.132 (1.00) |
0.128 (1.00) |
0.371 (1.00) |
| 22q gain | 64 (23%) | 214 |
0.0325 (1.00) |
0.419 (1.00) |
0.42 (1.00) |
0.674 (1.00) |
0.907 (1.00) |
0.231 (1.00) |
0.922 (1.00) |
0.5 (1.00) |
0.431 (1.00) |
0.701 (1.00) |
1 (1.00) |
| 1p loss | 41 (15%) | 237 |
0.676 (1.00) |
0.572 (1.00) |
0.00703 (1.00) |
0.541 (1.00) |
0.119 (1.00) |
0.43 (1.00) |
0.531 (1.00) |
0.349 (1.00) |
0.435 (1.00) |
0.17 (1.00) |
1 (1.00) |
| 1q loss | 7 (3%) | 271 |
0.435 (1.00) |
0.0138 (1.00) |
0.679 (1.00) |
0.992 (1.00) |
0.0926 (1.00) |
0.425 (1.00) |
0.509 (1.00) |
0.452 (1.00) |
0.228 (1.00) |
1 (1.00) |
|
| 2q loss | 8 (3%) | 270 |
0.0509 (1.00) |
0.0687 (1.00) |
1 (1.00) |
0.989 (1.00) |
0.562 (1.00) |
0.661 (1.00) |
1 (1.00) |
0.612 (1.00) |
1 (1.00) |
0.591 (1.00) |
|
| 3p loss | 120 (43%) | 158 |
0.45 (1.00) |
0.0522 (1.00) |
1 (1.00) |
0.116 (1.00) |
0.406 (1.00) |
0.968 (1.00) |
0.732 (1.00) |
0.764 (1.00) |
0.98 (1.00) |
0.75 (1.00) |
0.173 (1.00) |
| 3q loss | 24 (9%) | 254 |
0.164 (1.00) |
0.541 (1.00) |
0.81 (1.00) |
0.745 (1.00) |
0.0221 (1.00) |
0.19 (1.00) |
0.0778 (1.00) |
0.463 (1.00) |
0.0856 (1.00) |
1 (1.00) |
0.293 (1.00) |
| 4p loss | 116 (42%) | 162 |
0.146 (1.00) |
0.88 (1.00) |
0.891 (1.00) |
0.227 (1.00) |
0.405 (1.00) |
0.672 (1.00) |
0.337 (1.00) |
0.164 (1.00) |
0.188 (1.00) |
1 (1.00) |
0.32 (1.00) |
| 4q loss | 99 (36%) | 179 |
0.102 (1.00) |
0.549 (1.00) |
0.323 (1.00) |
0.0968 (1.00) |
0.234 (1.00) |
0.793 (1.00) |
0.742 (1.00) |
0.0746 (1.00) |
0.297 (1.00) |
0.748 (1.00) |
0.153 (1.00) |
| 5p loss | 17 (6%) | 261 |
0.0341 (1.00) |
0.417 (1.00) |
0.572 (1.00) |
0.787 (1.00) |
0.00309 (1.00) |
0.112 (1.00) |
0.523 (1.00) |
1 (1.00) |
0.717 (1.00) |
0.474 (1.00) |
0.087 (1.00) |
| 5q loss | 97 (35%) | 181 |
0.0894 (1.00) |
0.817 (1.00) |
0.67 (1.00) |
0.285 (1.00) |
0.233 (1.00) |
0.0481 (1.00) |
0.328 (1.00) |
0.168 (1.00) |
0.0357 (1.00) |
0.743 (1.00) |
0.537 (1.00) |
| 6p loss | 28 (10%) | 250 |
0.837 (1.00) |
0.5 (1.00) |
0.0447 (1.00) |
0.939 (1.00) |
0.0176 (1.00) |
0.139 (1.00) |
0.322 (1.00) |
0.814 (1.00) |
0.246 (1.00) |
0.606 (1.00) |
0.511 (1.00) |
| 6q loss | 32 (12%) | 246 |
0.731 (1.00) |
0.809 (1.00) |
1 (1.00) |
0.696 (1.00) |
0.0392 (1.00) |
0.221 (1.00) |
0.225 (1.00) |
0.839 (1.00) |
0.666 (1.00) |
0.611 (1.00) |
0.549 (1.00) |
| 7p loss | 17 (6%) | 261 |
0.573 (1.00) |
0.612 (1.00) |
1 (1.00) |
0.861 (1.00) |
0.954 (1.00) |
0.654 (1.00) |
0.171 (1.00) |
1 (1.00) |
0.66 (1.00) |
0.474 (1.00) |
1 (1.00) |
| 7q loss | 9 (3%) | 269 |
0.584 (1.00) |
0.724 (1.00) |
0.453 (1.00) |
0.987 (1.00) |
0.222 (1.00) |
0.382 (1.00) |
1 (1.00) |
1 (1.00) |
0.284 (1.00) |
0.604 (1.00) |
|
| 8p loss | 80 (29%) | 198 |
0.419 (1.00) |
0.315 (1.00) |
0.37 (1.00) |
0.221 (1.00) |
0.874 (1.00) |
0.0309 (1.00) |
0.672 (1.00) |
0.395 (1.00) |
0.561 (1.00) |
0.0676 (1.00) |
0.668 (1.00) |
| 8q loss | 8 (3%) | 270 |
0.696 (1.00) |
0.623 (1.00) |
1 (1.00) |
0.428 (1.00) |
0.491 (1.00) |
0.715 (1.00) |
0.764 (1.00) |
0.557 (1.00) |
0.906 (1.00) |
1 (1.00) |
0.198 (1.00) |
| 9p loss | 113 (41%) | 165 |
0.598 (1.00) |
0.501 (1.00) |
0.17 (1.00) |
0.0888 (1.00) |
0.402 (1.00) |
0.764 (1.00) |
0.542 (1.00) |
0.938 (1.00) |
0.538 (1.00) |
1 (1.00) |
0.552 (1.00) |
| 9q loss | 71 (26%) | 207 |
0.603 (1.00) |
0.0141 (1.00) |
0.437 (1.00) |
0.527 (1.00) |
0.156 (1.00) |
0.225 (1.00) |
0.6 (1.00) |
0.459 (1.00) |
0.771 (1.00) |
0.719 (1.00) |
0.823 (1.00) |
| 10p loss | 58 (21%) | 220 |
0.408 (1.00) |
0.792 (1.00) |
0.181 (1.00) |
0.708 (1.00) |
0.332 (1.00) |
0.525 (1.00) |
0.0886 (1.00) |
0.591 (1.00) |
0.11 (1.00) |
0.128 (1.00) |
0.469 (1.00) |
| 10q loss | 58 (21%) | 220 |
0.368 (1.00) |
0.993 (1.00) |
0.505 (1.00) |
0.708 (1.00) |
0.342 (1.00) |
0.899 (1.00) |
0.711 (1.00) |
0.586 (1.00) |
0.192 (1.00) |
0.128 (1.00) |
0.469 (1.00) |
| 11p loss | 45 (16%) | 233 |
0.179 (1.00) |
0.28 (1.00) |
1 (1.00) |
0.62 (1.00) |
0.232 (1.00) |
0.775 (1.00) |
0.946 (1.00) |
0.443 (1.00) |
0.829 (1.00) |
0.209 (1.00) |
0.794 (1.00) |
| 11q loss | 25 (9%) | 253 |
0.49 (1.00) |
0.046 (1.00) |
0.817 (1.00) |
0.915 (1.00) |
0.906 (1.00) |
0.621 (1.00) |
0.346 (1.00) |
0.606 (1.00) |
1 (1.00) |
0.224 (1.00) |
0.0882 (1.00) |
| 13q loss | 101 (36%) | 177 |
0.124 (1.00) |
0.614 (1.00) |
0.574 (1.00) |
0.135 (1.00) |
0.354 (1.00) |
0.972 (1.00) |
0.193 (1.00) |
0.363 (1.00) |
0.0171 (1.00) |
1 (1.00) |
0.316 (1.00) |
| 14q loss | 50 (18%) | 228 |
0.146 (1.00) |
0.239 (1.00) |
0.0524 (1.00) |
0.316 (1.00) |
0.162 (1.00) |
0.044 (1.00) |
0.238 (1.00) |
0.375 (1.00) |
0.675 (1.00) |
0.393 (1.00) |
1 (1.00) |
| 15q loss | 34 (12%) | 244 |
0.954 (1.00) |
0.507 (1.00) |
0.145 (1.00) |
0.446 (1.00) |
0.077 (1.00) |
0.104 (1.00) |
0.0157 (1.00) |
0.517 (1.00) |
0.00474 (1.00) |
1 (1.00) |
1 (1.00) |
| 17p loss | 99 (36%) | 179 |
0.538 (1.00) |
0.784 (1.00) |
0.672 (1.00) |
0.0303 (1.00) |
0.545 (1.00) |
0.47 (1.00) |
0.14 (1.00) |
0.641 (1.00) |
0.779 (1.00) |
1 (1.00) |
0.541 (1.00) |
| 18p loss | 30 (11%) | 248 |
0.972 (1.00) |
0.91 (1.00) |
0.274 (1.00) |
0.416 (1.00) |
0.869 (1.00) |
0.871 (1.00) |
0.15 (1.00) |
0.369 (1.00) |
0.0713 (1.00) |
0.607 (1.00) |
0.752 (1.00) |
| 18q loss | 54 (19%) | 224 |
0.835 (1.00) |
0.21 (1.00) |
0.0854 (1.00) |
0.382 (1.00) |
0.175 (1.00) |
0.384 (1.00) |
0.953 (1.00) |
0.489 (1.00) |
0.982 (1.00) |
0.218 (1.00) |
1 (1.00) |
| 19p loss | 44 (16%) | 234 |
0.101 (1.00) |
0.908 (1.00) |
0.71 (1.00) |
0.0806 (1.00) |
0.135 (1.00) |
0.281 (1.00) |
0.672 (1.00) |
0.365 (1.00) |
0.338 (1.00) |
0.0559 (1.00) |
0.426 (1.00) |
| 19q loss | 30 (11%) | 248 |
0.17 (1.00) |
0.295 (1.00) |
0.665 (1.00) |
0.405 (1.00) |
0.00152 (1.00) |
0.251 (1.00) |
0.558 (1.00) |
0.82 (1.00) |
0.735 (1.00) |
0.294 (1.00) |
1 (1.00) |
| 20p loss | 12 (4%) | 266 |
0.0975 (1.00) |
0.546 (1.00) |
0.526 (1.00) |
0.977 (1.00) |
0.952 (1.00) |
0.267 (1.00) |
1 (1.00) |
0.0927 (1.00) |
1 (1.00) |
1 (1.00) |
|
| 20q loss | 14 (5%) | 264 |
0.39 (1.00) |
0.542 (1.00) |
0.367 (1.00) |
0.968 (1.00) |
0.925 (1.00) |
0.404 (1.00) |
1 (1.00) |
0.805 (1.00) |
1 (1.00) |
1 (1.00) |
|
| 21q loss | 91 (33%) | 187 |
0.497 (1.00) |
0.356 (1.00) |
0.00898 (1.00) |
0.747 (1.00) |
0.544 (1.00) |
0.301 (1.00) |
0.68 (1.00) |
0.234 (1.00) |
0.211 (1.00) |
0.733 (1.00) |
0.403 (1.00) |
| 22q loss | 29 (10%) | 249 |
0.605 (1.00) |
0.196 (1.00) |
0.0745 (1.00) |
0.275 (1.00) |
0.00151 (1.00) |
0.43 (1.00) |
0.000743 (0.623) |
0.299 (1.00) |
0.00859 (1.00) |
0.606 (1.00) |
0.521 (1.00) |
| Xq loss | 14 (5%) | 264 |
0.878 (1.00) |
0.143 (1.00) |
0.534 (1.00) |
0.00067 (0.563) |
0.313 (1.00) |
0.126 (1.00) |
1 (1.00) |
0.544 (1.00) |
1 (1.00) |
0.0458 (1.00) |
P value = 3.73e-06 (Chi-square test), Q value = 0.0032
Table S1. Gene #1: '1p gain mutation analysis' versus Clinical Feature #5: 'HISTOLOGICAL.TYPE'
| nPatients | LUNG BASALOID SQUAMOUS CELL CARCINOMA | LUNG PAPILLARY SQUAMOUS CELL CARCINOMA | LUNG PAPILLARY SQUAMOUS CELL CARICNOMA | LUNG SMALL CELL SQUAMOUS CELL CARCINOMA | LUNG SQUAMOUS CELL CARCINOMA- NOT OTHERWISE SPECIFIED (NOS) |
|---|---|---|---|---|---|
| ALL | 7 | 1 | 1 | 1 | 268 |
| 1P GAIN MUTATED | 4 | 0 | 0 | 0 | 14 |
| 1P GAIN WILD-TYPE | 3 | 1 | 1 | 1 | 254 |
Figure S1. Get High-res Image Gene #1: '1p gain mutation analysis' versus Clinical Feature #5: 'HISTOLOGICAL.TYPE'

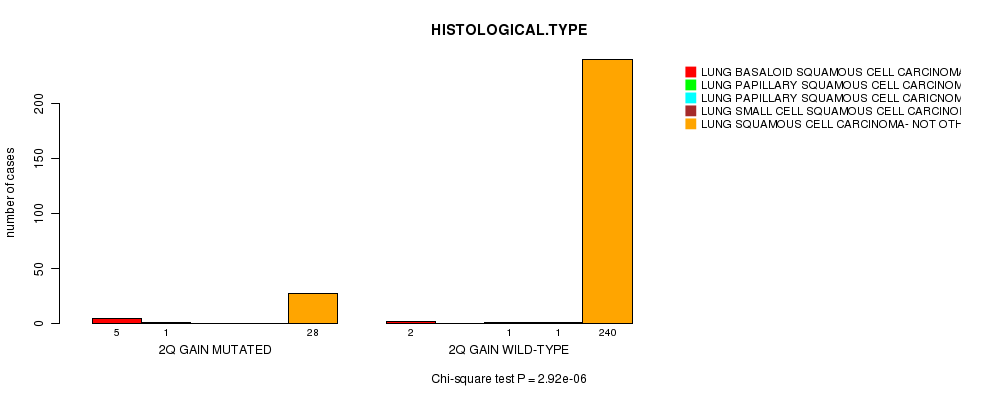
P value = 2.92e-06 (Chi-square test), Q value = 0.0025
Table S2. Gene #4: '2q gain mutation analysis' versus Clinical Feature #5: 'HISTOLOGICAL.TYPE'
| nPatients | LUNG BASALOID SQUAMOUS CELL CARCINOMA | LUNG PAPILLARY SQUAMOUS CELL CARCINOMA | LUNG PAPILLARY SQUAMOUS CELL CARICNOMA | LUNG SMALL CELL SQUAMOUS CELL CARCINOMA | LUNG SQUAMOUS CELL CARCINOMA- NOT OTHERWISE SPECIFIED (NOS) |
|---|---|---|---|---|---|
| ALL | 7 | 1 | 1 | 1 | 268 |
| 2Q GAIN MUTATED | 5 | 1 | 0 | 0 | 28 |
| 2Q GAIN WILD-TYPE | 2 | 0 | 1 | 1 | 240 |
Figure S2. Get High-res Image Gene #4: '2q gain mutation analysis' versus Clinical Feature #5: 'HISTOLOGICAL.TYPE'
P value = 8.74e-06 (t-test), Q value = 0.0074
Table S3. Gene #21: '11p gain mutation analysis' versus Clinical Feature #4: 'KARNOFSKY.PERFORMANCE.SCORE'
| nPatients | Mean (Std.Dev) | |
|---|---|---|
| ALL | 52 | 26.5 (39.1) |
| 11P GAIN MUTATED | 4 | 0.0 (0.0) |
| 11P GAIN WILD-TYPE | 48 | 28.8 (39.9) |
Figure S3. Get High-res Image Gene #21: '11p gain mutation analysis' versus Clinical Feature #4: 'KARNOFSKY.PERFORMANCE.SCORE'

P value = 2.93e-09 (Chi-square test), Q value = 2.5e-06
Table S4. Gene #30: '17p gain mutation analysis' versus Clinical Feature #5: 'HISTOLOGICAL.TYPE'
| nPatients | LUNG BASALOID SQUAMOUS CELL CARCINOMA | LUNG PAPILLARY SQUAMOUS CELL CARCINOMA | LUNG PAPILLARY SQUAMOUS CELL CARICNOMA | LUNG SMALL CELL SQUAMOUS CELL CARCINOMA | LUNG SQUAMOUS CELL CARCINOMA- NOT OTHERWISE SPECIFIED (NOS) |
|---|---|---|---|---|---|
| ALL | 7 | 1 | 1 | 1 | 268 |
| 17P GAIN MUTATED | 0 | 1 | 0 | 0 | 5 |
| 17P GAIN WILD-TYPE | 7 | 0 | 1 | 1 | 263 |
Figure S4. Get High-res Image Gene #30: '17p gain mutation analysis' versus Clinical Feature #5: 'HISTOLOGICAL.TYPE'

P value = 9.14e-06 (t-test), Q value = 0.0077
Table S5. Gene #33: '18q gain mutation analysis' versus Clinical Feature #4: 'KARNOFSKY.PERFORMANCE.SCORE'
| nPatients | Mean (Std.Dev) | |
|---|---|---|
| ALL | 52 | 26.5 (39.1) |
| 18Q GAIN MUTATED | 3 | 0.0 (0.0) |
| 18Q GAIN WILD-TYPE | 49 | 28.2 (39.7) |
Figure S5. Get High-res Image Gene #33: '18q gain mutation analysis' versus Clinical Feature #4: 'KARNOFSKY.PERFORMANCE.SCORE'

P value = 7.92e-06 (t-test), Q value = 0.0067
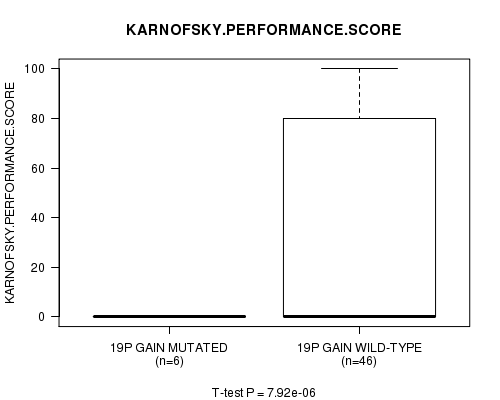
Table S6. Gene #34: '19p gain mutation analysis' versus Clinical Feature #4: 'KARNOFSKY.PERFORMANCE.SCORE'
| nPatients | Mean (Std.Dev) | |
|---|---|---|
| ALL | 52 | 26.5 (39.1) |
| 19P GAIN MUTATED | 6 | 0.0 (0.0) |
| 19P GAIN WILD-TYPE | 46 | 30.0 (40.3) |
Figure S6. Get High-res Image Gene #34: '19p gain mutation analysis' versus Clinical Feature #4: 'KARNOFSKY.PERFORMANCE.SCORE'
P value = 1.44e-05 (Chi-square test), Q value = 0.012
Table S7. Gene #34: '19p gain mutation analysis' versus Clinical Feature #5: 'HISTOLOGICAL.TYPE'
| nPatients | LUNG BASALOID SQUAMOUS CELL CARCINOMA | LUNG PAPILLARY SQUAMOUS CELL CARCINOMA | LUNG PAPILLARY SQUAMOUS CELL CARICNOMA | LUNG SMALL CELL SQUAMOUS CELL CARCINOMA | LUNG SQUAMOUS CELL CARCINOMA- NOT OTHERWISE SPECIFIED (NOS) |
|---|---|---|---|---|---|
| ALL | 7 | 1 | 1 | 1 | 268 |
| 19P GAIN MUTATED | 5 | 0 | 0 | 0 | 25 |
| 19P GAIN WILD-TYPE | 2 | 1 | 1 | 1 | 243 |
Figure S7. Get High-res Image Gene #34: '19p gain mutation analysis' versus Clinical Feature #5: 'HISTOLOGICAL.TYPE'

P value = 4.07e-05 (Chi-square test), Q value = 0.034
Table S8. Gene #38: '21q gain mutation analysis' versus Clinical Feature #5: 'HISTOLOGICAL.TYPE'
| nPatients | LUNG BASALOID SQUAMOUS CELL CARCINOMA | LUNG PAPILLARY SQUAMOUS CELL CARCINOMA | LUNG PAPILLARY SQUAMOUS CELL CARICNOMA | LUNG SMALL CELL SQUAMOUS CELL CARCINOMA | LUNG SQUAMOUS CELL CARCINOMA- NOT OTHERWISE SPECIFIED (NOS) |
|---|---|---|---|---|---|
| ALL | 7 | 1 | 1 | 1 | 268 |
| 21Q GAIN MUTATED | 2 | 0 | 0 | 1 | 12 |
| 21Q GAIN WILD-TYPE | 5 | 1 | 1 | 0 | 256 |
Figure S8. Get High-res Image Gene #38: '21q gain mutation analysis' versus Clinical Feature #5: 'HISTOLOGICAL.TYPE'

P value = 9.14e-06 (t-test), Q value = 0.0077
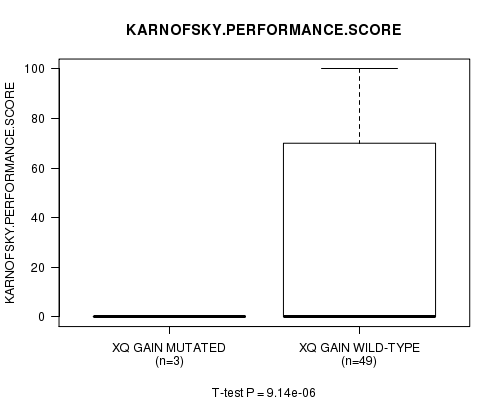
Table S9. Gene #40: 'Xq gain mutation analysis' versus Clinical Feature #4: 'KARNOFSKY.PERFORMANCE.SCORE'
| nPatients | Mean (Std.Dev) | |
|---|---|---|
| ALL | 52 | 26.5 (39.1) |
| XQ GAIN MUTATED | 3 | 0.0 (0.0) |
| XQ GAIN WILD-TYPE | 49 | 28.2 (39.7) |
Figure S9. Get High-res Image Gene #40: 'Xq gain mutation analysis' versus Clinical Feature #4: 'KARNOFSKY.PERFORMANCE.SCORE'
P value = 4.02e-14 (Chi-square test), Q value = 3.4e-11
Table S10. Gene #62: '12p loss mutation analysis' versus Clinical Feature #5: 'HISTOLOGICAL.TYPE'
| nPatients | LUNG BASALOID SQUAMOUS CELL CARCINOMA | LUNG PAPILLARY SQUAMOUS CELL CARCINOMA | LUNG PAPILLARY SQUAMOUS CELL CARICNOMA | LUNG SMALL CELL SQUAMOUS CELL CARCINOMA | LUNG SQUAMOUS CELL CARCINOMA- NOT OTHERWISE SPECIFIED (NOS) |
|---|---|---|---|---|---|
| ALL | 7 | 1 | 1 | 1 | 268 |
| 12P LOSS MUTATED | 0 | 0 | 0 | 1 | 3 |
| 12P LOSS WILD-TYPE | 7 | 1 | 1 | 0 | 265 |
Figure S10. Get High-res Image Gene #62: '12p loss mutation analysis' versus Clinical Feature #5: 'HISTOLOGICAL.TYPE'

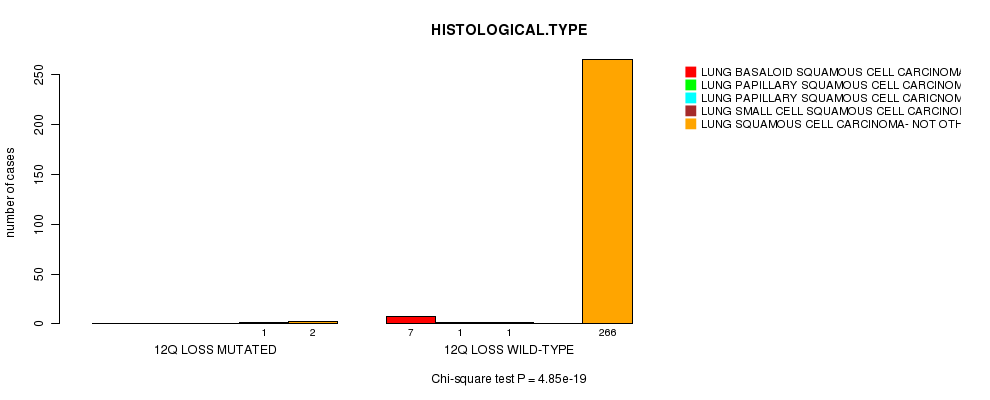
P value = 4.85e-19 (Chi-square test), Q value = 4.1e-16
Table S11. Gene #63: '12q loss mutation analysis' versus Clinical Feature #5: 'HISTOLOGICAL.TYPE'
| nPatients | LUNG BASALOID SQUAMOUS CELL CARCINOMA | LUNG PAPILLARY SQUAMOUS CELL CARCINOMA | LUNG PAPILLARY SQUAMOUS CELL CARICNOMA | LUNG SMALL CELL SQUAMOUS CELL CARCINOMA | LUNG SQUAMOUS CELL CARCINOMA- NOT OTHERWISE SPECIFIED (NOS) |
|---|---|---|---|---|---|
| ALL | 7 | 1 | 1 | 1 | 268 |
| 12Q LOSS MUTATED | 0 | 0 | 0 | 1 | 2 |
| 12Q LOSS WILD-TYPE | 7 | 1 | 1 | 0 | 266 |
Figure S11. Get High-res Image Gene #63: '12q loss mutation analysis' versus Clinical Feature #5: 'HISTOLOGICAL.TYPE'
P value = 8.74e-06 (t-test), Q value = 0.0074
Table S12. Gene #67: '16p loss mutation analysis' versus Clinical Feature #4: 'KARNOFSKY.PERFORMANCE.SCORE'
| nPatients | Mean (Std.Dev) | |
|---|---|---|
| ALL | 52 | 26.5 (39.1) |
| 16P LOSS MUTATED | 4 | 0.0 (0.0) |
| 16P LOSS WILD-TYPE | 48 | 28.8 (39.9) |
Figure S12. Get High-res Image Gene #67: '16p loss mutation analysis' versus Clinical Feature #4: 'KARNOFSKY.PERFORMANCE.SCORE'

P value = 7.92e-06 (t-test), Q value = 0.0067
Table S13. Gene #68: '16q loss mutation analysis' versus Clinical Feature #4: 'KARNOFSKY.PERFORMANCE.SCORE'
| nPatients | Mean (Std.Dev) | |
|---|---|---|
| ALL | 52 | 26.5 (39.1) |
| 16Q LOSS MUTATED | 6 | 0.0 (0.0) |
| 16Q LOSS WILD-TYPE | 46 | 30.0 (40.3) |
Figure S13. Get High-res Image Gene #68: '16q loss mutation analysis' versus Clinical Feature #4: 'KARNOFSKY.PERFORMANCE.SCORE'

P value = 9.14e-06 (t-test), Q value = 0.0077
Table S14. Gene #70: '17q loss mutation analysis' versus Clinical Feature #4: 'KARNOFSKY.PERFORMANCE.SCORE'
| nPatients | Mean (Std.Dev) | |
|---|---|---|
| ALL | 52 | 26.5 (39.1) |
| 17Q LOSS MUTATED | 3 | 0.0 (0.0) |
| 17Q LOSS WILD-TYPE | 49 | 28.2 (39.7) |
Figure S14. Get High-res Image Gene #70: '17q loss mutation analysis' versus Clinical Feature #4: 'KARNOFSKY.PERFORMANCE.SCORE'

-
Mutation data file = broad_values_by_arm.mutsig.cluster.txt
-
Clinical data file = LUSC.clin.merged.picked.txt
-
Number of patients = 278
-
Number of significantly arm-level cnvs = 79
-
Number of selected clinical features = 11
-
Exclude genes that fewer than K tumors have mutations, K = 3
For survival clinical features, the Kaplan-Meier survival curves of tumors with and without gene mutations were plotted and the statistical significance P values were estimated by logrank test (Bland and Altman 2004) using the 'survdiff' function in R
For continuous numerical clinical features, two-tailed Student's t test with unequal variance (Lehmann and Romano 2005) was applied to compare the clinical values between tumors with and without gene mutations using 't.test' function in R
For binary or multi-class clinical features (nominal or ordinal), two-tailed Fisher's exact tests (Fisher 1922) were used to estimate the P values using the 'fisher.test' function in R
For multi-class clinical features (nominal or ordinal), Chi-square tests (Greenwood and Nikulin 1996) were used to estimate the P values using the 'chisq.test' function in R
For multiple hypothesis correction, Q value is the False Discovery Rate (FDR) analogue of the P value (Benjamini and Hochberg 1995), defined as the minimum FDR at which the test may be called significant. We used the 'Benjamini and Hochberg' method of 'p.adjust' function in R to convert P values into Q values.
This is an experimental feature. The full results of the analysis summarized in this report can be downloaded from the TCGA Data Coordination Center.