This pipeline computes the correlation between significant arm-level copy number variations (cnvs) and selected clinical features.
Testing the association between copy number variation 76 arm-level results and 10 clinical features across 413 patients, 18 significant findings detected with Q value < 0.25.
-
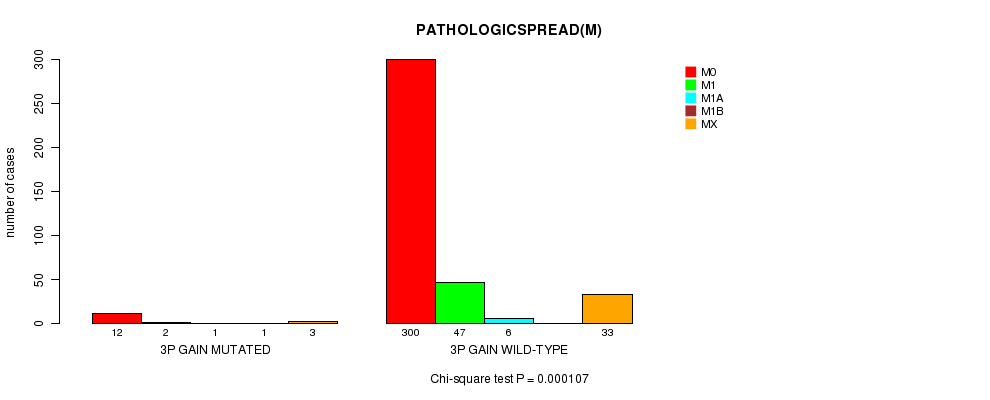
3p gain cnv correlated to 'PATHOLOGICSPREAD(M)'.
-
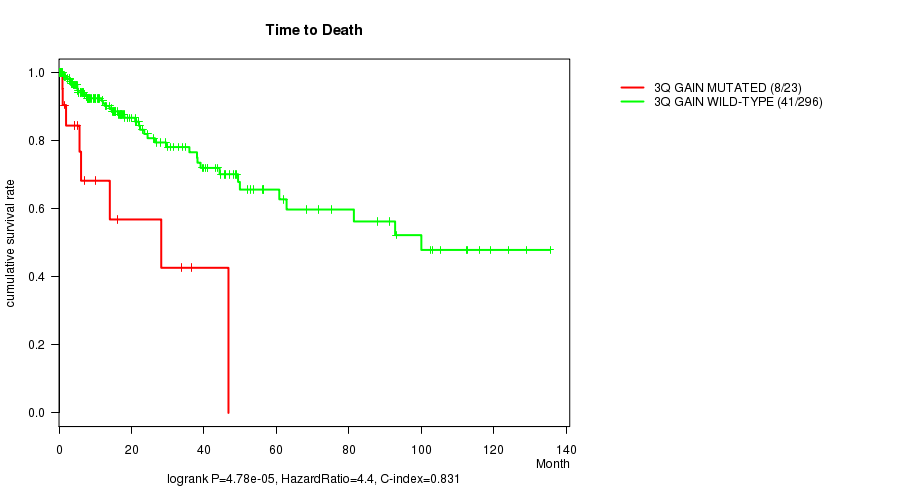
3q gain cnv correlated to 'Time to Death'.
-
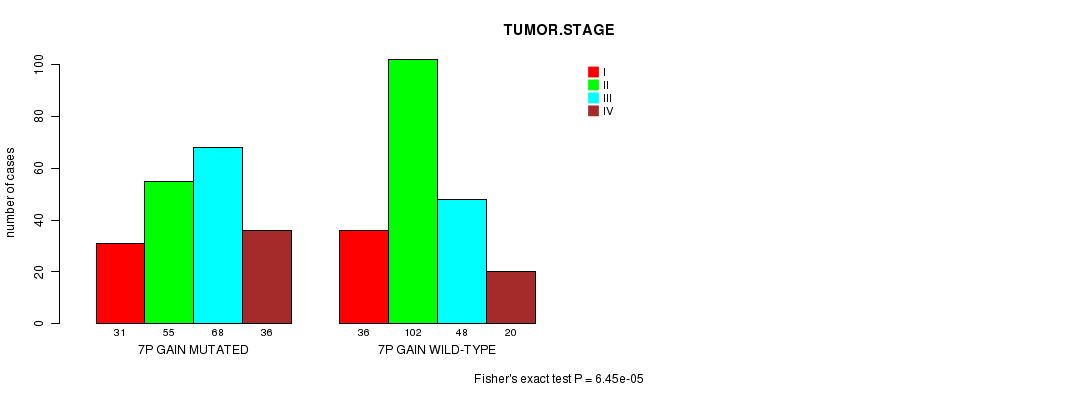
7p gain cnv correlated to 'TUMOR.STAGE'.
-
13q gain cnv correlated to 'HISTOLOGICAL.TYPE'.
-
17p gain cnv correlated to 'PATHOLOGICSPREAD(M)'.
-
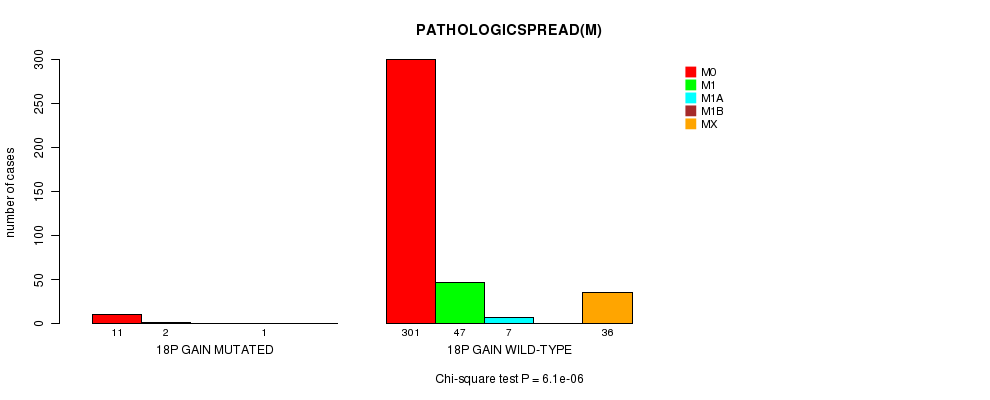
18p gain cnv correlated to 'PATHOLOGICSPREAD(M)'.
-
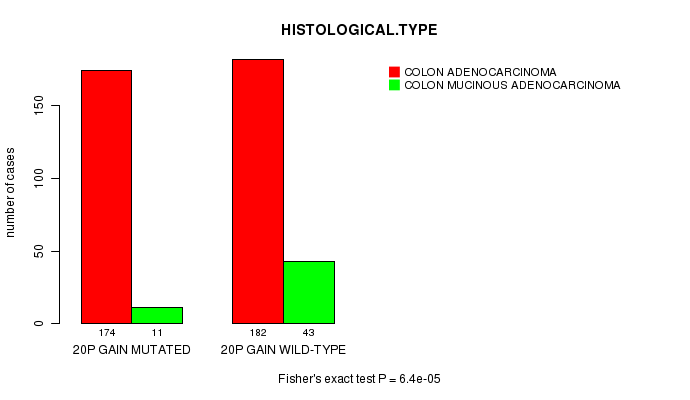
20p gain cnv correlated to 'HISTOLOGICAL.TYPE'.
-
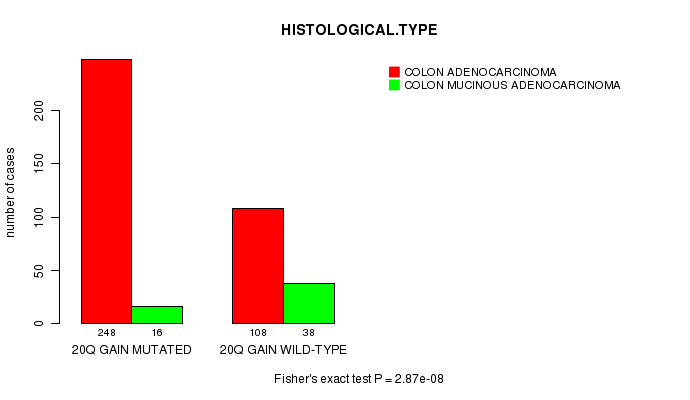
20q gain cnv correlated to 'HISTOLOGICAL.TYPE'.
-
Xq gain cnv correlated to 'PATHOLOGICSPREAD(M)'.
-
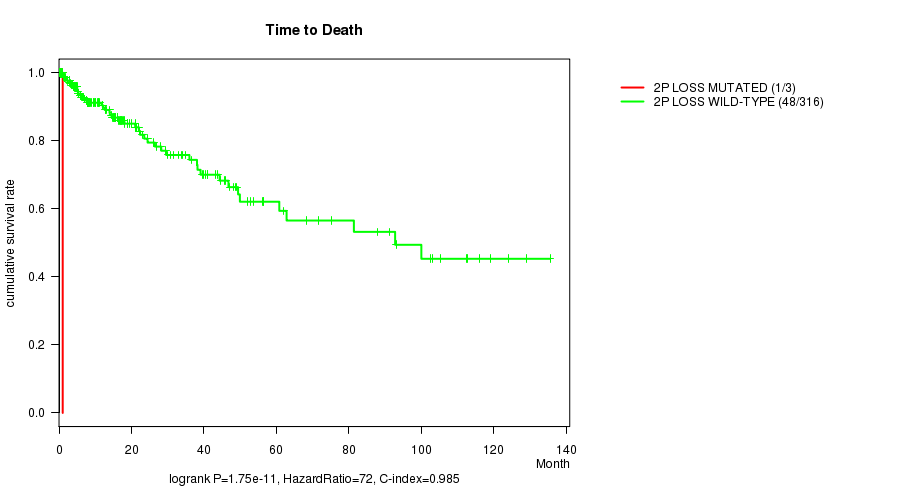
2p loss cnv correlated to 'Time to Death'.
-
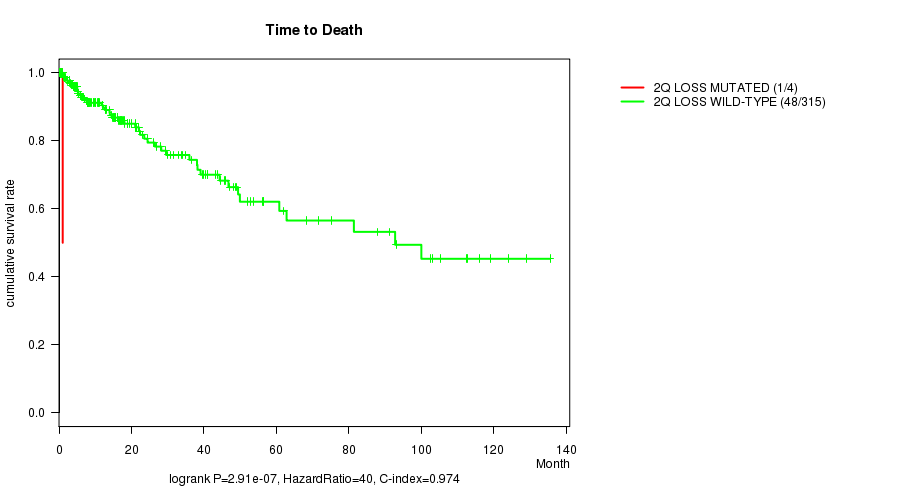
2q loss cnv correlated to 'Time to Death'.
-
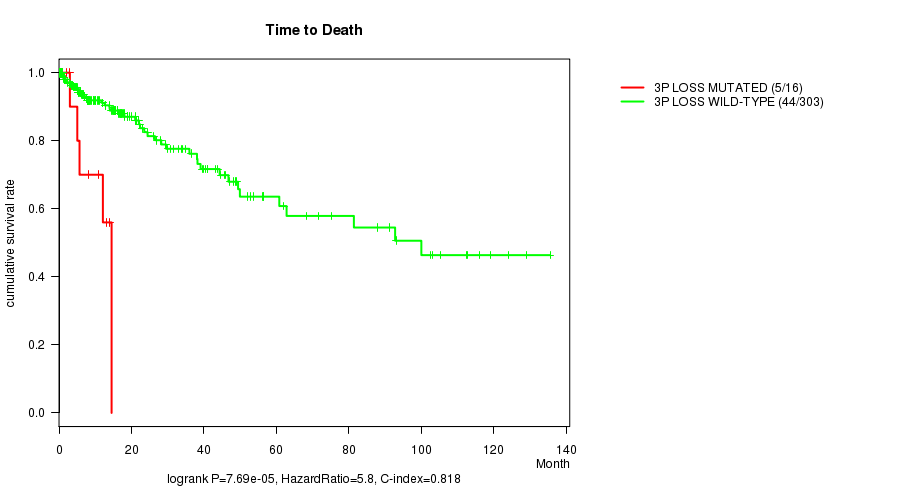
3p loss cnv correlated to 'Time to Death'.
-
6q loss cnv correlated to 'PATHOLOGICSPREAD(M)'.
-
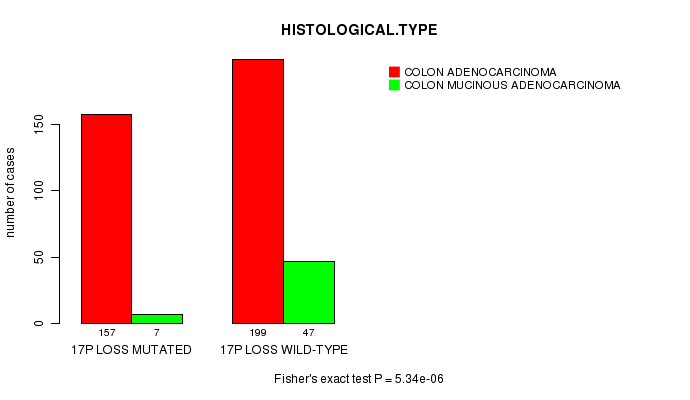
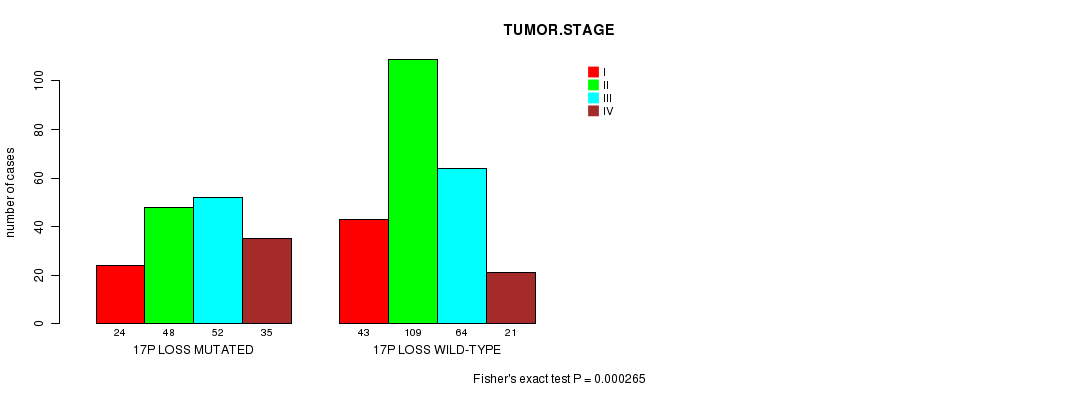
17p loss cnv correlated to 'HISTOLOGICAL.TYPE' and 'TUMOR.STAGE'.
-
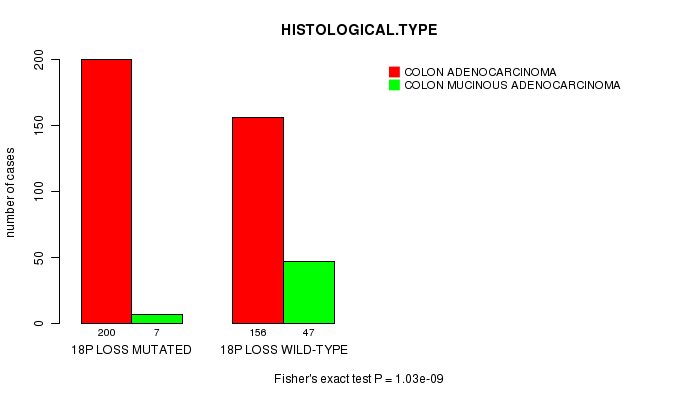
18p loss cnv correlated to 'HISTOLOGICAL.TYPE'.
-
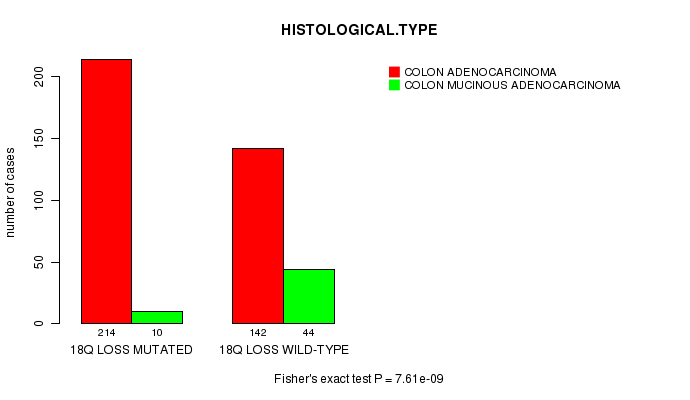
18q loss cnv correlated to 'HISTOLOGICAL.TYPE'.
-
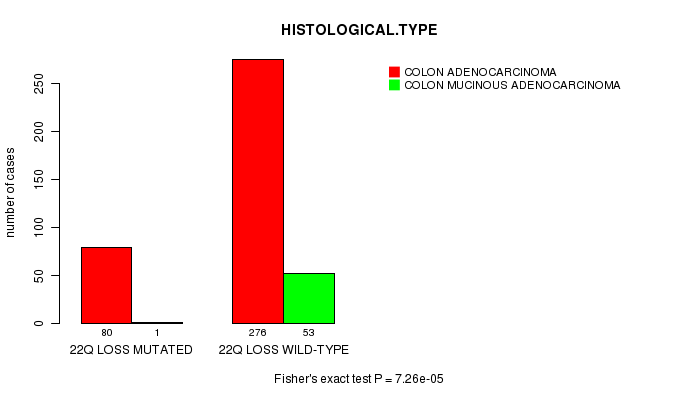
22q loss cnv correlated to 'HISTOLOGICAL.TYPE'.
Table 1. Get Full Table Overview of the association between significant copy number variation of 76 arm-level results and 10 clinical features. Shown in the table are P values (Q values). Thresholded by Q value < 0.25, 18 significant findings detected.
|
Clinical Features |
Time to Death |
AGE | GENDER |
HISTOLOGICAL TYPE |
PATHOLOGY T |
PATHOLOGY N |
PATHOLOGICSPREAD(M) |
TUMOR STAGE |
RADIATIONS RADIATION REGIMENINDICATION |
NEOADJUVANT THERAPY |
||
| nCNV (%) | nWild-Type | logrank test | t-test | Fisher's exact test | Fisher's exact test | Fisher's exact test | Fisher's exact test | Chi-square test | Fisher's exact test | Fisher's exact test | Fisher's exact test | |
| 17p loss | 164 (40%) | 249 |
0.162 (1.00) |
0.339 (1.00) |
0.191 (1.00) |
5.34e-06 (0.00402) |
0.867 (1.00) |
0.0039 (1.00) |
0.000887 (0.654) |
0.000265 (0.197) |
0.566 (1.00) |
0.885 (1.00) |
| 3p gain | 20 (5%) | 393 |
0.00121 (0.892) |
0.152 (1.00) |
0.496 (1.00) |
1 (1.00) |
0.686 (1.00) |
0.293 (1.00) |
0.000107 (0.0799) |
0.352 (1.00) |
1 (1.00) |
0.751 (1.00) |
| 3q gain | 30 (7%) | 383 |
4.78e-05 (0.0359) |
0.588 (1.00) |
0.342 (1.00) |
0.783 (1.00) |
0.908 (1.00) |
0.0835 (1.00) |
0.000364 (0.27) |
0.0597 (1.00) |
1 (1.00) |
1 (1.00) |
| 7p gain | 200 (48%) | 213 |
0.252 (1.00) |
0.362 (1.00) |
1 (1.00) |
0.00119 (0.875) |
0.774 (1.00) |
0.00436 (1.00) |
0.032 (1.00) |
6.45e-05 (0.0483) |
0.113 (1.00) |
0.321 (1.00) |
| 13q gain | 211 (51%) | 202 |
0.76 (1.00) |
0.942 (1.00) |
0.376 (1.00) |
4e-06 (0.00301) |
0.946 (1.00) |
0.0349 (1.00) |
0.127 (1.00) |
0.0117 (1.00) |
0.249 (1.00) |
0.257 (1.00) |
| 17p gain | 9 (2%) | 404 |
0.206 (1.00) |
0.863 (1.00) |
0.739 (1.00) |
0.613 (1.00) |
0.588 (1.00) |
0.801 (1.00) |
0.000127 (0.0944) |
0.224 (1.00) |
1 (1.00) |
0.119 (1.00) |
| 18p gain | 15 (4%) | 398 |
0.319 (1.00) |
0.816 (1.00) |
1 (1.00) |
0.0351 (1.00) |
0.842 (1.00) |
0.0119 (1.00) |
6.1e-06 (0.00459) |
0.635 (1.00) |
1 (1.00) |
1 (1.00) |
| 20p gain | 188 (46%) | 225 |
0.287 (1.00) |
0.283 (1.00) |
0.0599 (1.00) |
6.4e-05 (0.048) |
0.58 (1.00) |
0.575 (1.00) |
0.0382 (1.00) |
0.0798 (1.00) |
0.594 (1.00) |
0.394 (1.00) |
| 20q gain | 267 (65%) | 146 |
0.614 (1.00) |
0.625 (1.00) |
0.257 (1.00) |
2.87e-08 (2.17e-05) |
0.222 (1.00) |
0.242 (1.00) |
0.17 (1.00) |
0.0248 (1.00) |
1 (1.00) |
0.462 (1.00) |
| Xq gain | 12 (3%) | 401 |
0.0145 (1.00) |
0.315 (1.00) |
0.559 (1.00) |
0.664 (1.00) |
1 (1.00) |
0.0919 (1.00) |
1.5e-07 (0.000113) |
0.616 (1.00) |
1 (1.00) |
1 (1.00) |
| 2p loss | 4 (1%) | 409 |
1.75e-11 (1.33e-08) |
0.693 (1.00) |
0.626 (1.00) |
1 (1.00) |
0.77 (1.00) |
0.804 (1.00) |
0.877 (1.00) |
0.906 (1.00) |
1 (1.00) |
1 (1.00) |
| 2q loss | 6 (1%) | 407 |
2.91e-07 (0.000219) |
0.81 (1.00) |
0.221 (1.00) |
1 (1.00) |
1 (1.00) |
0.847 (1.00) |
0.77 (1.00) |
0.544 (1.00) |
1 (1.00) |
1 (1.00) |
| 3p loss | 27 (7%) | 386 |
7.69e-05 (0.0574) |
0.754 (1.00) |
0.325 (1.00) |
0.233 (1.00) |
0.0627 (1.00) |
0.0697 (1.00) |
0.026 (1.00) |
0.0567 (1.00) |
1 (1.00) |
0.401 (1.00) |
| 6q loss | 21 (5%) | 392 |
0.0115 (1.00) |
0.368 (1.00) |
1 (1.00) |
0.748 (1.00) |
0.706 (1.00) |
0.0332 (1.00) |
0.000182 (0.135) |
0.0939 (1.00) |
1 (1.00) |
1 (1.00) |
| 18p loss | 209 (51%) | 204 |
0.365 (1.00) |
0.108 (1.00) |
1 (1.00) |
1.03e-09 (7.8e-07) |
0.85 (1.00) |
0.00445 (1.00) |
0.029 (1.00) |
0.000665 (0.492) |
1 (1.00) |
0.572 (1.00) |
| 18q loss | 225 (54%) | 188 |
0.265 (1.00) |
0.119 (1.00) |
0.429 (1.00) |
7.61e-09 (5.77e-06) |
0.941 (1.00) |
0.00272 (1.00) |
0.014 (1.00) |
0.000422 (0.313) |
0.254 (1.00) |
0.888 (1.00) |
| 22q loss | 81 (20%) | 332 |
0.527 (1.00) |
0.105 (1.00) |
0.535 (1.00) |
7.26e-05 (0.0543) |
0.839 (1.00) |
0.0355 (1.00) |
0.148 (1.00) |
0.0803 (1.00) |
0.481 (1.00) |
0.153 (1.00) |
| 1p gain | 11 (3%) | 402 |
0.44 (1.00) |
0.664 (1.00) |
1 (1.00) |
1 (1.00) |
0.616 (1.00) |
0.44 (1.00) |
0.776 (1.00) |
0.483 (1.00) |
1 (1.00) |
0.376 (1.00) |
| 1q gain | 47 (11%) | 366 |
0.889 (1.00) |
0.466 (1.00) |
0.0868 (1.00) |
0.173 (1.00) |
0.617 (1.00) |
0.313 (1.00) |
0.23 (1.00) |
0.0686 (1.00) |
1 (1.00) |
1 (1.00) |
| 2p gain | 40 (10%) | 373 |
0.604 (1.00) |
0.61 (1.00) |
0.869 (1.00) |
0.0447 (1.00) |
0.239 (1.00) |
0.0603 (1.00) |
0.895 (1.00) |
0.0498 (1.00) |
0.264 (1.00) |
0.477 (1.00) |
| 2q gain | 39 (9%) | 374 |
0.906 (1.00) |
0.781 (1.00) |
0.738 (1.00) |
0.0436 (1.00) |
0.286 (1.00) |
0.0172 (1.00) |
0.786 (1.00) |
0.0188 (1.00) |
0.258 (1.00) |
0.227 (1.00) |
| 4p gain | 3 (1%) | 410 |
0.457 (1.00) |
0.569 (1.00) |
1 (1.00) |
0.346 (1.00) |
1 (1.00) |
0.0652 (1.00) |
0.000376 (0.279) |
0.19 (1.00) |
1 (1.00) |
0.366 (1.00) |
| 4q gain | 5 (1%) | 408 |
0.445 (1.00) |
0.856 (1.00) |
0.668 (1.00) |
0.508 (1.00) |
0.522 (1.00) |
0.107 (1.00) |
0.291 (1.00) |
0.0467 (1.00) |
1 (1.00) |
0.533 (1.00) |
| 5p gain | 39 (9%) | 374 |
0.806 (1.00) |
0.0805 (1.00) |
0.239 (1.00) |
0.453 (1.00) |
0.799 (1.00) |
0.163 (1.00) |
0.347 (1.00) |
0.681 (1.00) |
1 (1.00) |
0.468 (1.00) |
| 5q gain | 21 (5%) | 392 |
0.609 (1.00) |
0.285 (1.00) |
0.374 (1.00) |
0.335 (1.00) |
0.846 (1.00) |
0.113 (1.00) |
0.742 (1.00) |
0.749 (1.00) |
1 (1.00) |
0.516 (1.00) |
| 6p gain | 50 (12%) | 363 |
0.747 (1.00) |
0.574 (1.00) |
0.763 (1.00) |
0.506 (1.00) |
0.369 (1.00) |
0.0192 (1.00) |
0.995 (1.00) |
0.163 (1.00) |
1 (1.00) |
1 (1.00) |
| 6q gain | 45 (11%) | 368 |
0.676 (1.00) |
0.9 (1.00) |
0.755 (1.00) |
1 (1.00) |
0.492 (1.00) |
0.0176 (1.00) |
0.969 (1.00) |
0.0792 (1.00) |
1 (1.00) |
0.494 (1.00) |
| 7q gain | 175 (42%) | 238 |
0.313 (1.00) |
0.448 (1.00) |
0.921 (1.00) |
0.0115 (1.00) |
0.559 (1.00) |
0.204 (1.00) |
0.0184 (1.00) |
0.0046 (1.00) |
0.577 (1.00) |
1 (1.00) |
| 8p gain | 80 (19%) | 333 |
0.845 (1.00) |
0.199 (1.00) |
0.618 (1.00) |
1 (1.00) |
0.237 (1.00) |
0.411 (1.00) |
0.935 (1.00) |
0.61 (1.00) |
0.477 (1.00) |
1 (1.00) |
| 8q gain | 162 (39%) | 251 |
0.61 (1.00) |
0.0678 (1.00) |
0.267 (1.00) |
0.00673 (1.00) |
0.0393 (1.00) |
0.715 (1.00) |
0.3 (1.00) |
0.381 (1.00) |
0.564 (1.00) |
0.772 (1.00) |
| 9p gain | 46 (11%) | 367 |
0.0786 (1.00) |
0.544 (1.00) |
0.347 (1.00) |
0.358 (1.00) |
0.552 (1.00) |
0.607 (1.00) |
0.786 (1.00) |
0.6 (1.00) |
1 (1.00) |
0.0115 (1.00) |
| 9q gain | 39 (9%) | 374 |
0.0609 (1.00) |
0.608 (1.00) |
0.179 (1.00) |
0.622 (1.00) |
0.199 (1.00) |
0.262 (1.00) |
0.799 (1.00) |
0.571 (1.00) |
1 (1.00) |
0.00301 (1.00) |
| 10p gain | 18 (4%) | 395 |
0.00999 (1.00) |
0.098 (1.00) |
0.813 (1.00) |
0.711 (1.00) |
0.108 (1.00) |
0.0158 (1.00) |
0.622 (1.00) |
0.125 (1.00) |
1 (1.00) |
0.154 (1.00) |
| 10q gain | 7 (2%) | 406 |
0.788 (1.00) |
0.0299 (1.00) |
1 (1.00) |
0.232 (1.00) |
0.481 (1.00) |
0.0384 (1.00) |
0.86 (1.00) |
0.144 (1.00) |
1 (1.00) |
0.0089 (1.00) |
| 11p gain | 18 (4%) | 395 |
0.412 (1.00) |
0.198 (1.00) |
0.631 (1.00) |
0.147 (1.00) |
0.215 (1.00) |
0.119 (1.00) |
0.93 (1.00) |
0.106 (1.00) |
1 (1.00) |
1 (1.00) |
| 11q gain | 22 (5%) | 391 |
0.203 (1.00) |
0.0508 (1.00) |
0.828 (1.00) |
0.0957 (1.00) |
0.235 (1.00) |
0.0445 (1.00) |
0.864 (1.00) |
0.0183 (1.00) |
1 (1.00) |
0.215 (1.00) |
| 12p gain | 66 (16%) | 347 |
0.659 (1.00) |
0.0837 (1.00) |
1 (1.00) |
0.69 (1.00) |
0.537 (1.00) |
0.0345 (1.00) |
0.446 (1.00) |
0.0528 (1.00) |
1 (1.00) |
0.0514 (1.00) |
| 12q gain | 60 (15%) | 353 |
0.845 (1.00) |
0.0503 (1.00) |
0.889 (1.00) |
0.677 (1.00) |
0.695 (1.00) |
0.0677 (1.00) |
0.188 (1.00) |
0.0299 (1.00) |
1 (1.00) |
0.105 (1.00) |
| 14q gain | 15 (4%) | 398 |
0.506 (1.00) |
0.922 (1.00) |
0.43 (1.00) |
0.43 (1.00) |
0.724 (1.00) |
0.81 (1.00) |
0.00355 (1.00) |
0.706 (1.00) |
1 (1.00) |
0.244 (1.00) |
| 15q gain | 5 (1%) | 408 |
0.493 (1.00) |
0.709 (1.00) |
1 (1.00) |
1 (1.00) |
1 (1.00) |
0.829 (1.00) |
0.825 (1.00) |
0.863 (1.00) |
1 (1.00) |
0.533 (1.00) |
| 16p gain | 67 (16%) | 346 |
0.938 (1.00) |
0.205 (1.00) |
0.79 (1.00) |
0.0179 (1.00) |
0.696 (1.00) |
0.00924 (1.00) |
0.662 (1.00) |
0.00959 (1.00) |
0.413 (1.00) |
0.337 (1.00) |
| 16q gain | 66 (16%) | 347 |
0.738 (1.00) |
0.107 (1.00) |
1 (1.00) |
0.027 (1.00) |
0.699 (1.00) |
0.0019 (1.00) |
0.633 (1.00) |
0.00129 (0.945) |
0.408 (1.00) |
0.175 (1.00) |
| 17q gain | 48 (12%) | 365 |
0.0544 (1.00) |
0.335 (1.00) |
0.539 (1.00) |
0.0648 (1.00) |
0.0588 (1.00) |
0.329 (1.00) |
0.00607 (1.00) |
0.433 (1.00) |
0.31 (1.00) |
0.00325 (1.00) |
| 18q gain | 9 (2%) | 404 |
0.699 (1.00) |
0.331 (1.00) |
0.512 (1.00) |
0.102 (1.00) |
0.445 (1.00) |
0.12 (1.00) |
0.909 (1.00) |
0.962 (1.00) |
1 (1.00) |
1 (1.00) |
| 19p gain | 34 (8%) | 379 |
0.605 (1.00) |
0.445 (1.00) |
0.858 (1.00) |
0.0669 (1.00) |
0.486 (1.00) |
0.338 (1.00) |
0.168 (1.00) |
0.924 (1.00) |
1 (1.00) |
0.118 (1.00) |
| 19q gain | 41 (10%) | 372 |
0.285 (1.00) |
0.403 (1.00) |
0.869 (1.00) |
0.631 (1.00) |
0.96 (1.00) |
1 (1.00) |
0.589 (1.00) |
0.876 (1.00) |
1 (1.00) |
0.634 (1.00) |
| 21q gain | 11 (3%) | 402 |
0.152 (1.00) |
0.00583 (1.00) |
0.762 (1.00) |
1 (1.00) |
0.0282 (1.00) |
0.172 (1.00) |
0.799 (1.00) |
0.111 (1.00) |
1 (1.00) |
1 (1.00) |
| 1p loss | 51 (12%) | 362 |
0.0103 (1.00) |
0.507 (1.00) |
1 (1.00) |
0.122 (1.00) |
0.783 (1.00) |
0.0291 (1.00) |
0.0303 (1.00) |
0.0386 (1.00) |
1 (1.00) |
0.085 (1.00) |
| 1q loss | 18 (4%) | 395 |
0.558 (1.00) |
0.256 (1.00) |
0.631 (1.00) |
1 (1.00) |
0.565 (1.00) |
0.441 (1.00) |
0.424 (1.00) |
0.587 (1.00) |
1 (1.00) |
1 (1.00) |
| 3q loss | 12 (3%) | 401 |
0.0351 (1.00) |
0.0171 (1.00) |
0.0406 (1.00) |
0.38 (1.00) |
0.744 (1.00) |
0.774 (1.00) |
0.19 (1.00) |
0.103 (1.00) |
1 (1.00) |
0.388 (1.00) |
| 4p loss | 84 (20%) | 329 |
0.00142 (1.00) |
0.764 (1.00) |
0.807 (1.00) |
0.0103 (1.00) |
0.719 (1.00) |
0.0224 (1.00) |
0.00219 (1.00) |
0.00624 (1.00) |
0.495 (1.00) |
0.014 (1.00) |
| 4q loss | 68 (16%) | 345 |
0.0221 (1.00) |
0.478 (1.00) |
0.596 (1.00) |
0.0179 (1.00) |
0.841 (1.00) |
0.103 (1.00) |
0.125 (1.00) |
0.0769 (1.00) |
0.418 (1.00) |
0.0352 (1.00) |
| 5p loss | 25 (6%) | 388 |
0.761 (1.00) |
0.819 (1.00) |
1 (1.00) |
0.227 (1.00) |
0.8 (1.00) |
0.145 (1.00) |
0.822 (1.00) |
0.139 (1.00) |
0.171 (1.00) |
0.0662 (1.00) |
| 5q loss | 38 (9%) | 375 |
0.341 (1.00) |
0.867 (1.00) |
0.0602 (1.00) |
0.0433 (1.00) |
0.919 (1.00) |
0.00472 (1.00) |
0.729 (1.00) |
0.271 (1.00) |
0.252 (1.00) |
0.63 (1.00) |
| 6p loss | 12 (3%) | 401 |
0.755 (1.00) |
0.625 (1.00) |
0.777 (1.00) |
1 (1.00) |
0.8 (1.00) |
0.842 (1.00) |
0.366 (1.00) |
0.895 (1.00) |
1 (1.00) |
1 (1.00) |
| 8p loss | 93 (23%) | 320 |
0.61 (1.00) |
0.641 (1.00) |
0.238 (1.00) |
0.081 (1.00) |
0.836 (1.00) |
0.0218 (1.00) |
0.118 (1.00) |
0.0964 (1.00) |
0.536 (1.00) |
0.313 (1.00) |
| 8q loss | 8 (2%) | 405 |
0.884 (1.00) |
0.21 (1.00) |
0.293 (1.00) |
1 (1.00) |
0.601 (1.00) |
0.256 (1.00) |
0.674 (1.00) |
0.132 (1.00) |
1 (1.00) |
0.607 (1.00) |
| 9p loss | 27 (7%) | 386 |
0.21 (1.00) |
0.0653 (1.00) |
1 (1.00) |
0.556 (1.00) |
0.158 (1.00) |
0.779 (1.00) |
0.919 (1.00) |
0.752 (1.00) |
1 (1.00) |
0.401 (1.00) |
| 9q loss | 26 (6%) | 387 |
0.736 (1.00) |
0.0045 (1.00) |
0.311 (1.00) |
0.227 (1.00) |
0.0141 (1.00) |
0.607 (1.00) |
0.926 (1.00) |
0.23 (1.00) |
1 (1.00) |
0.773 (1.00) |
| 10p loss | 22 (5%) | 391 |
0.811 (1.00) |
0.321 (1.00) |
0.514 (1.00) |
1 (1.00) |
0.305 (1.00) |
0.559 (1.00) |
0.104 (1.00) |
0.105 (1.00) |
1 (1.00) |
1 (1.00) |
| 10q loss | 24 (6%) | 389 |
0.28 (1.00) |
0.178 (1.00) |
0.529 (1.00) |
1 (1.00) |
0.501 (1.00) |
0.52 (1.00) |
0.2 (1.00) |
0.255 (1.00) |
1 (1.00) |
1 (1.00) |
| 11p loss | 22 (5%) | 391 |
0.235 (1.00) |
0.207 (1.00) |
1 (1.00) |
0.335 (1.00) |
0.786 (1.00) |
0.532 (1.00) |
0.736 (1.00) |
0.342 (1.00) |
1 (1.00) |
0.339 (1.00) |
| 11q loss | 27 (7%) | 386 |
0.724 (1.00) |
0.285 (1.00) |
0.426 (1.00) |
0.556 (1.00) |
0.354 (1.00) |
0.174 (1.00) |
0.455 (1.00) |
0.36 (1.00) |
1 (1.00) |
0.401 (1.00) |
| 12p loss | 21 (5%) | 392 |
0.278 (1.00) |
0.775 (1.00) |
0.374 (1.00) |
0.0918 (1.00) |
0.16 (1.00) |
0.0514 (1.00) |
0.797 (1.00) |
0.245 (1.00) |
0.145 (1.00) |
1 (1.00) |
| 12q loss | 20 (5%) | 393 |
0.389 (1.00) |
0.941 (1.00) |
0.256 (1.00) |
0.0904 (1.00) |
0.289 (1.00) |
0.0983 (1.00) |
0.742 (1.00) |
0.164 (1.00) |
1 (1.00) |
0.751 (1.00) |
| 13q loss | 6 (1%) | 407 |
0.237 (1.00) |
0.627 (1.00) |
1 (1.00) |
0.574 (1.00) |
0.156 (1.00) |
0.0823 (1.00) |
0.496 (1.00) |
0.196 (1.00) |
1 (1.00) |
1 (1.00) |
| 14q loss | 94 (23%) | 319 |
0.345 (1.00) |
0.939 (1.00) |
0.64 (1.00) |
0.000719 (0.531) |
0.893 (1.00) |
0.0883 (1.00) |
0.266 (1.00) |
0.283 (1.00) |
1 (1.00) |
0.315 (1.00) |
| 15q loss | 99 (24%) | 314 |
0.365 (1.00) |
0.424 (1.00) |
0.908 (1.00) |
0.00173 (1.00) |
0.687 (1.00) |
0.554 (1.00) |
0.215 (1.00) |
0.208 (1.00) |
0.562 (1.00) |
0.869 (1.00) |
| 16p loss | 9 (2%) | 404 |
0.977 (1.00) |
0.999 (1.00) |
0.315 (1.00) |
0.337 (1.00) |
0.897 (1.00) |
0.894 (1.00) |
0.993 (1.00) |
0.477 (1.00) |
1 (1.00) |
0.368 (1.00) |
| 16q loss | 7 (2%) | 406 |
0.478 (1.00) |
0.612 (1.00) |
0.71 (1.00) |
0.232 (1.00) |
0.743 (1.00) |
1 (1.00) |
0.98 (1.00) |
0.792 (1.00) |
1 (1.00) |
1 (1.00) |
| 17q loss | 32 (8%) | 381 |
0.702 (1.00) |
0.544 (1.00) |
0.716 (1.00) |
0.101 (1.00) |
0.748 (1.00) |
0.0518 (1.00) |
0.37 (1.00) |
0.0488 (1.00) |
1 (1.00) |
0.0663 (1.00) |
| 19p loss | 14 (3%) | 399 |
0.291 (1.00) |
0.5 (1.00) |
0.275 (1.00) |
0.232 (1.00) |
0.296 (1.00) |
0.928 (1.00) |
0.226 (1.00) |
0.14 (1.00) |
1 (1.00) |
0.703 (1.00) |
| 19q loss | 13 (3%) | 400 |
0.291 (1.00) |
0.73 (1.00) |
0.156 (1.00) |
0.232 (1.00) |
0.222 (1.00) |
1 (1.00) |
0.166 (1.00) |
0.178 (1.00) |
1 (1.00) |
1 (1.00) |
| 20p loss | 33 (8%) | 380 |
0.56 (1.00) |
0.806 (1.00) |
0.59 (1.00) |
0.599 (1.00) |
0.735 (1.00) |
0.513 (1.00) |
0.71 (1.00) |
0.508 (1.00) |
1 (1.00) |
1 (1.00) |
| 21q loss | 71 (17%) | 342 |
0.666 (1.00) |
0.675 (1.00) |
0.896 (1.00) |
0.0514 (1.00) |
0.152 (1.00) |
0.407 (1.00) |
0.928 (1.00) |
0.857 (1.00) |
1 (1.00) |
0.348 (1.00) |
| Xq loss | 5 (1%) | 408 |
0.725 (1.00) |
0.78 (1.00) |
0.668 (1.00) |
0.508 (1.00) |
0.251 (1.00) |
0.107 (1.00) |
0.869 (1.00) |
0.536 (1.00) |
1 (1.00) |
0.533 (1.00) |
P value = 0.000107 (Chi-square test), Q value = 0.08
Table S1. Gene #5: '3p gain mutation analysis' versus Clinical Feature #7: 'PATHOLOGICSPREAD(M)'
| nPatients | M0 | M1 | M1A | M1B | MX |
|---|---|---|---|---|---|
| ALL | 312 | 49 | 7 | 1 | 36 |
| 3P GAIN MUTATED | 12 | 2 | 1 | 1 | 3 |
| 3P GAIN WILD-TYPE | 300 | 47 | 6 | 0 | 33 |
Figure S1. Get High-res Image Gene #5: '3p gain mutation analysis' versus Clinical Feature #7: 'PATHOLOGICSPREAD(M)'
P value = 4.78e-05 (logrank test), Q value = 0.036
Table S2. Gene #6: '3q gain mutation analysis' versus Clinical Feature #1: 'Time to Death'
| nPatients | nDeath | Duration Range (Median), Month | |
|---|---|---|---|
| ALL | 319 | 49 | 0.1 - 135.5 (7.7) |
| 3Q GAIN MUTATED | 23 | 8 | 0.2 - 46.8 (5.0) |
| 3Q GAIN WILD-TYPE | 296 | 41 | 0.1 - 135.5 (8.0) |
Figure S2. Get High-res Image Gene #6: '3q gain mutation analysis' versus Clinical Feature #1: 'Time to Death'
P value = 6.45e-05 (Fisher's exact test), Q value = 0.048
Table S3. Gene #13: '7p gain mutation analysis' versus Clinical Feature #8: 'TUMOR.STAGE'
| nPatients | I | II | III | IV |
|---|---|---|---|---|
| ALL | 67 | 157 | 116 | 56 |
| 7P GAIN MUTATED | 31 | 55 | 68 | 36 |
| 7P GAIN WILD-TYPE | 36 | 102 | 48 | 20 |
Figure S3. Get High-res Image Gene #13: '7p gain mutation analysis' versus Clinical Feature #8: 'TUMOR.STAGE'
P value = 4e-06 (Fisher's exact test), Q value = 0.003
Table S4. Gene #25: '13q gain mutation analysis' versus Clinical Feature #4: 'HISTOLOGICAL.TYPE'
| nPatients | COLON ADENOCARCINOMA | COLON MUCINOUS ADENOCARCINOMA |
|---|---|---|
| ALL | 356 | 54 |
| 13Q GAIN MUTATED | 198 | 12 |
| 13Q GAIN WILD-TYPE | 158 | 42 |
Figure S4. Get High-res Image Gene #25: '13q gain mutation analysis' versus Clinical Feature #4: 'HISTOLOGICAL.TYPE'

P value = 0.000127 (Chi-square test), Q value = 0.094
Table S5. Gene #30: '17p gain mutation analysis' versus Clinical Feature #7: 'PATHOLOGICSPREAD(M)'
| nPatients | M0 | M1 | M1A | M1B | MX |
|---|---|---|---|---|---|
| ALL | 312 | 49 | 7 | 1 | 36 |
| 17P GAIN MUTATED | 5 | 1 | 2 | 0 | 1 |
| 17P GAIN WILD-TYPE | 307 | 48 | 5 | 1 | 35 |
Figure S5. Get High-res Image Gene #30: '17p gain mutation analysis' versus Clinical Feature #7: 'PATHOLOGICSPREAD(M)'

P value = 6.1e-06 (Chi-square test), Q value = 0.0046
Table S6. Gene #32: '18p gain mutation analysis' versus Clinical Feature #7: 'PATHOLOGICSPREAD(M)'
| nPatients | M0 | M1 | M1A | M1B | MX |
|---|---|---|---|---|---|
| ALL | 312 | 49 | 7 | 1 | 36 |
| 18P GAIN MUTATED | 11 | 2 | 0 | 1 | 0 |
| 18P GAIN WILD-TYPE | 301 | 47 | 7 | 0 | 36 |
Figure S6. Get High-res Image Gene #32: '18p gain mutation analysis' versus Clinical Feature #7: 'PATHOLOGICSPREAD(M)'
P value = 6.4e-05 (Fisher's exact test), Q value = 0.048
Table S7. Gene #36: '20p gain mutation analysis' versus Clinical Feature #4: 'HISTOLOGICAL.TYPE'
| nPatients | COLON ADENOCARCINOMA | COLON MUCINOUS ADENOCARCINOMA |
|---|---|---|
| ALL | 356 | 54 |
| 20P GAIN MUTATED | 174 | 11 |
| 20P GAIN WILD-TYPE | 182 | 43 |
Figure S7. Get High-res Image Gene #36: '20p gain mutation analysis' versus Clinical Feature #4: 'HISTOLOGICAL.TYPE'
P value = 2.87e-08 (Fisher's exact test), Q value = 2.2e-05
Table S8. Gene #37: '20q gain mutation analysis' versus Clinical Feature #4: 'HISTOLOGICAL.TYPE'
| nPatients | COLON ADENOCARCINOMA | COLON MUCINOUS ADENOCARCINOMA |
|---|---|---|
| ALL | 356 | 54 |
| 20Q GAIN MUTATED | 248 | 16 |
| 20Q GAIN WILD-TYPE | 108 | 38 |
Figure S8. Get High-res Image Gene #37: '20q gain mutation analysis' versus Clinical Feature #4: 'HISTOLOGICAL.TYPE'
P value = 1.5e-07 (Chi-square test), Q value = 0.00011
Table S9. Gene #39: 'Xq gain mutation analysis' versus Clinical Feature #7: 'PATHOLOGICSPREAD(M)'
| nPatients | M0 | M1 | M1A | M1B | MX |
|---|---|---|---|---|---|
| ALL | 312 | 49 | 7 | 1 | 36 |
| XQ GAIN MUTATED | 8 | 2 | 0 | 1 | 0 |
| XQ GAIN WILD-TYPE | 304 | 47 | 7 | 0 | 36 |
Figure S9. Get High-res Image Gene #39: 'Xq gain mutation analysis' versus Clinical Feature #7: 'PATHOLOGICSPREAD(M)'

P value = 1.75e-11 (logrank test), Q value = 1.3e-08
Table S10. Gene #42: '2p loss mutation analysis' versus Clinical Feature #1: 'Time to Death'
| nPatients | nDeath | Duration Range (Median), Month | |
|---|---|---|---|
| ALL | 319 | 49 | 0.1 - 135.5 (7.7) |
| 2P LOSS MUTATED | 3 | 1 | 0.3 - 1.0 (1.0) |
| 2P LOSS WILD-TYPE | 316 | 48 | 0.1 - 135.5 (7.9) |
Figure S10. Get High-res Image Gene #42: '2p loss mutation analysis' versus Clinical Feature #1: 'Time to Death'
P value = 2.91e-07 (logrank test), Q value = 0.00022
Table S11. Gene #43: '2q loss mutation analysis' versus Clinical Feature #1: 'Time to Death'
| nPatients | nDeath | Duration Range (Median), Month | |
|---|---|---|---|
| ALL | 319 | 49 | 0.1 - 135.5 (7.7) |
| 2Q LOSS MUTATED | 4 | 1 | 0.3 - 1.0 (1.0) |
| 2Q LOSS WILD-TYPE | 315 | 48 | 0.1 - 135.5 (8.0) |
Figure S11. Get High-res Image Gene #43: '2q loss mutation analysis' versus Clinical Feature #1: 'Time to Death'
P value = 7.69e-05 (logrank test), Q value = 0.057
Table S12. Gene #44: '3p loss mutation analysis' versus Clinical Feature #1: 'Time to Death'
| nPatients | nDeath | Duration Range (Median), Month | |
|---|---|---|---|
| ALL | 319 | 49 | 0.1 - 135.5 (7.7) |
| 3P LOSS MUTATED | 16 | 5 | 0.3 - 14.5 (5.3) |
| 3P LOSS WILD-TYPE | 303 | 44 | 0.1 - 135.5 (7.9) |
Figure S12. Get High-res Image Gene #44: '3p loss mutation analysis' versus Clinical Feature #1: 'Time to Death'
P value = 0.000182 (Chi-square test), Q value = 0.14
Table S13. Gene #51: '6q loss mutation analysis' versus Clinical Feature #7: 'PATHOLOGICSPREAD(M)'
| nPatients | M0 | M1 | M1A | M1B | MX |
|---|---|---|---|---|---|
| ALL | 312 | 49 | 7 | 1 | 36 |
| 6Q LOSS MUTATED | 12 | 4 | 1 | 1 | 3 |
| 6Q LOSS WILD-TYPE | 300 | 45 | 6 | 0 | 33 |
Figure S13. Get High-res Image Gene #51: '6q loss mutation analysis' versus Clinical Feature #7: 'PATHOLOGICSPREAD(M)'

P value = 5.34e-06 (Fisher's exact test), Q value = 0.004
Table S14. Gene #67: '17p loss mutation analysis' versus Clinical Feature #4: 'HISTOLOGICAL.TYPE'
| nPatients | COLON ADENOCARCINOMA | COLON MUCINOUS ADENOCARCINOMA |
|---|---|---|
| ALL | 356 | 54 |
| 17P LOSS MUTATED | 157 | 7 |
| 17P LOSS WILD-TYPE | 199 | 47 |
Figure S14. Get High-res Image Gene #67: '17p loss mutation analysis' versus Clinical Feature #4: 'HISTOLOGICAL.TYPE'
P value = 0.000265 (Fisher's exact test), Q value = 0.2
Table S15. Gene #67: '17p loss mutation analysis' versus Clinical Feature #8: 'TUMOR.STAGE'
| nPatients | I | II | III | IV |
|---|---|---|---|---|
| ALL | 67 | 157 | 116 | 56 |
| 17P LOSS MUTATED | 24 | 48 | 52 | 35 |
| 17P LOSS WILD-TYPE | 43 | 109 | 64 | 21 |
Figure S15. Get High-res Image Gene #67: '17p loss mutation analysis' versus Clinical Feature #8: 'TUMOR.STAGE'
P value = 1.03e-09 (Fisher's exact test), Q value = 7.8e-07
Table S16. Gene #69: '18p loss mutation analysis' versus Clinical Feature #4: 'HISTOLOGICAL.TYPE'
| nPatients | COLON ADENOCARCINOMA | COLON MUCINOUS ADENOCARCINOMA |
|---|---|---|
| ALL | 356 | 54 |
| 18P LOSS MUTATED | 200 | 7 |
| 18P LOSS WILD-TYPE | 156 | 47 |
Figure S16. Get High-res Image Gene #69: '18p loss mutation analysis' versus Clinical Feature #4: 'HISTOLOGICAL.TYPE'
P value = 7.61e-09 (Fisher's exact test), Q value = 5.8e-06
Table S17. Gene #70: '18q loss mutation analysis' versus Clinical Feature #4: 'HISTOLOGICAL.TYPE'
| nPatients | COLON ADENOCARCINOMA | COLON MUCINOUS ADENOCARCINOMA |
|---|---|---|
| ALL | 356 | 54 |
| 18Q LOSS MUTATED | 214 | 10 |
| 18Q LOSS WILD-TYPE | 142 | 44 |
Figure S17. Get High-res Image Gene #70: '18q loss mutation analysis' versus Clinical Feature #4: 'HISTOLOGICAL.TYPE'
P value = 7.26e-05 (Fisher's exact test), Q value = 0.054
Table S18. Gene #75: '22q loss mutation analysis' versus Clinical Feature #4: 'HISTOLOGICAL.TYPE'
| nPatients | COLON ADENOCARCINOMA | COLON MUCINOUS ADENOCARCINOMA |
|---|---|---|
| ALL | 356 | 54 |
| 22Q LOSS MUTATED | 80 | 1 |
| 22Q LOSS WILD-TYPE | 276 | 53 |
Figure S18. Get High-res Image Gene #75: '22q loss mutation analysis' versus Clinical Feature #4: 'HISTOLOGICAL.TYPE'
-
Mutation data file = broad_values_by_arm.mutsig.cluster.txt
-
Clinical data file = COAD.clin.merged.picked.txt
-
Number of patients = 413
-
Number of significantly arm-level cnvs = 76
-
Number of selected clinical features = 10
-
Exclude genes that fewer than K tumors have mutations, K = 3
For survival clinical features, the Kaplan-Meier survival curves of tumors with and without gene mutations were plotted and the statistical significance P values were estimated by logrank test (Bland and Altman 2004) using the 'survdiff' function in R
For continuous numerical clinical features, two-tailed Student's t test with unequal variance (Lehmann and Romano 2005) was applied to compare the clinical values between tumors with and without gene mutations using 't.test' function in R
For binary or multi-class clinical features (nominal or ordinal), two-tailed Fisher's exact tests (Fisher 1922) were used to estimate the P values using the 'fisher.test' function in R
For multi-class clinical features (nominal or ordinal), Chi-square tests (Greenwood and Nikulin 1996) were used to estimate the P values using the 'chisq.test' function in R
For multiple hypothesis correction, Q value is the False Discovery Rate (FDR) analogue of the P value (Benjamini and Hochberg 1995), defined as the minimum FDR at which the test may be called significant. We used the 'Benjamini and Hochberg' method of 'p.adjust' function in R to convert P values into Q values.
This is an experimental feature. The full results of the analysis summarized in this report can be downloaded from the TCGA Data Coordination Center.