This report serves to describe the mutational landscape and properties of a given individual set, as well as rank genes and genesets according to mutational significance. MutSig v2.0 was used to generate the results found in this report.
-
Working with individual set: COAD
-
Number of patients in set: 155
The input for this pipeline is a set of individuals with the following files associated for each:
-
An annotated .maf file describing the mutations called for the respective individual, and their properties.
-
A .wig file that contains information about the coverage of the sample.
-
MAF used for this analysis:COAD.final_analysis_set.maf
-
Significantly mutated genes (q ≤ 0.1): 110
-
Mutations seen in COSMIC: 517
-
Significantly mutated genes in COSMIC territory: 23
-
Genes with clustered mutations (≤ 3 aa apart): 0
-
Significantly mutated genesets: 163
-
Significantly mutated genesets: (excluding sig. mutated genes):0
-
Read 102 MAFs of type "Broad"
-
Read 53 MAFs of type "Baylor"
-
Total number of mutations in input MAFs: 62560
-
After removing 1112 invalidated mutations: 61448
-
After removing 976 noncoding mutations: 60472
-
After collapsing adjacent/redundant mutations: 60470
-
Number of mutations before filtering: 60470
-
After removing 608 mutations outside gene set: 59862
-
After removing 171 mutations outside category set: 59691
-
After removing 29 "impossible" mutations in
-
gene-patient-category bins of zero coverage: 59662
Table 1. Get Full Table Table representing breakdown of mutations by type.
| type | count |
|---|---|
| De_novo_Start_InFrame | 17 |
| De_novo_Start_OutOfFrame | 126 |
| Frame_Shift_Del | 1140 |
| Frame_Shift_Ins | 653 |
| In_Frame_Del | 139 |
| In_Frame_Ins | 20 |
| Missense_Mutation | 39632 |
| Nonsense_Mutation | 3280 |
| Nonstop_Mutation | 30 |
| Silent | 14503 |
| Splice_Site | 149 |
| Translation_Start_Site | 2 |
| Total | 59691 |
Table 2. Get Full Table A breakdown of mutation rates per category discovered for this individual set.
| category | n | N | rate | rate_per_mb | relative_rate |
|---|---|---|---|---|---|
| *CpG->T | 15469 | 257126057 | 6e-05 | 60 | 6.2 |
| *Np(A/C/T)->transit | 10144 | 3670800380 | 2.8e-06 | 2.8 | 0.28 |
| *ApG->G | 966 | 712178712 | 1.4e-06 | 1.4 | 0.14 |
| transver | 13037 | 4640105149 | 2.8e-06 | 2.8 | 0.29 |
| indel+null | 5407 | 4640105304 | 1.2e-06 | 1.2 | 0.12 |
| double_null | 147 | 4640105304 | 3.2e-08 | 0.032 | 0.0033 |
| Total | 45170 | 4640105304 | 9.7e-06 | 9.7 | 1 |
The x axis represents the samples. The y axis represents the exons, one row per exon, and they are sorted by average coverage across samples. For exons with exactly the same average coverage, they are sorted next by the %GC of the exon. (The secondary sort is especially useful for the zero-coverage exons at the bottom).
Figure 1.
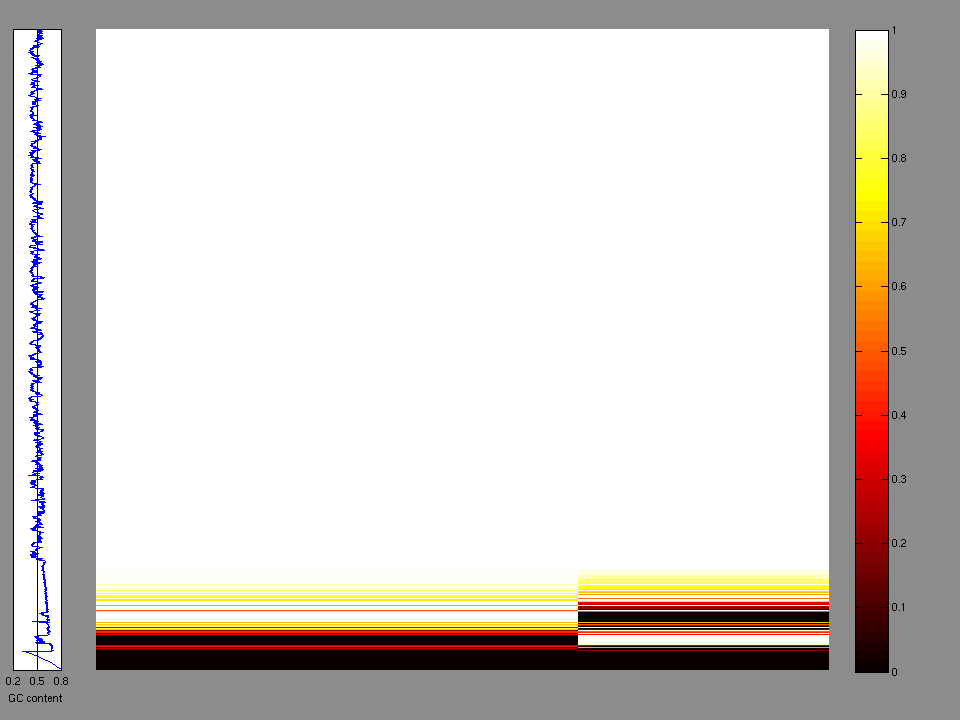
Figure 2. Patients counts and rates file used to generate this plot: COAD.patients.counts_and_rates.txt
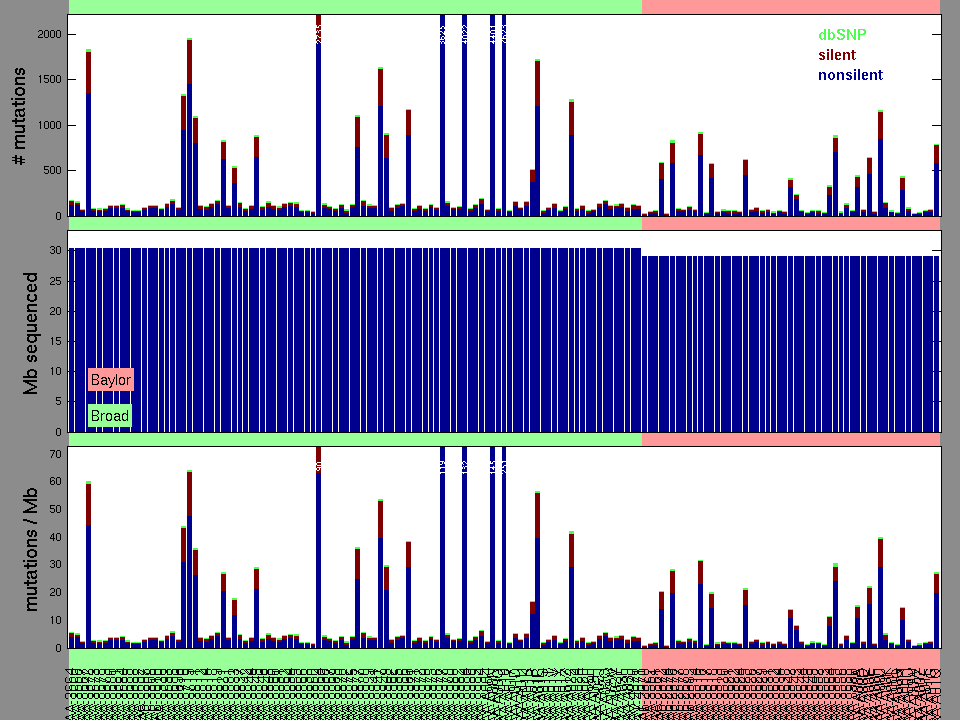
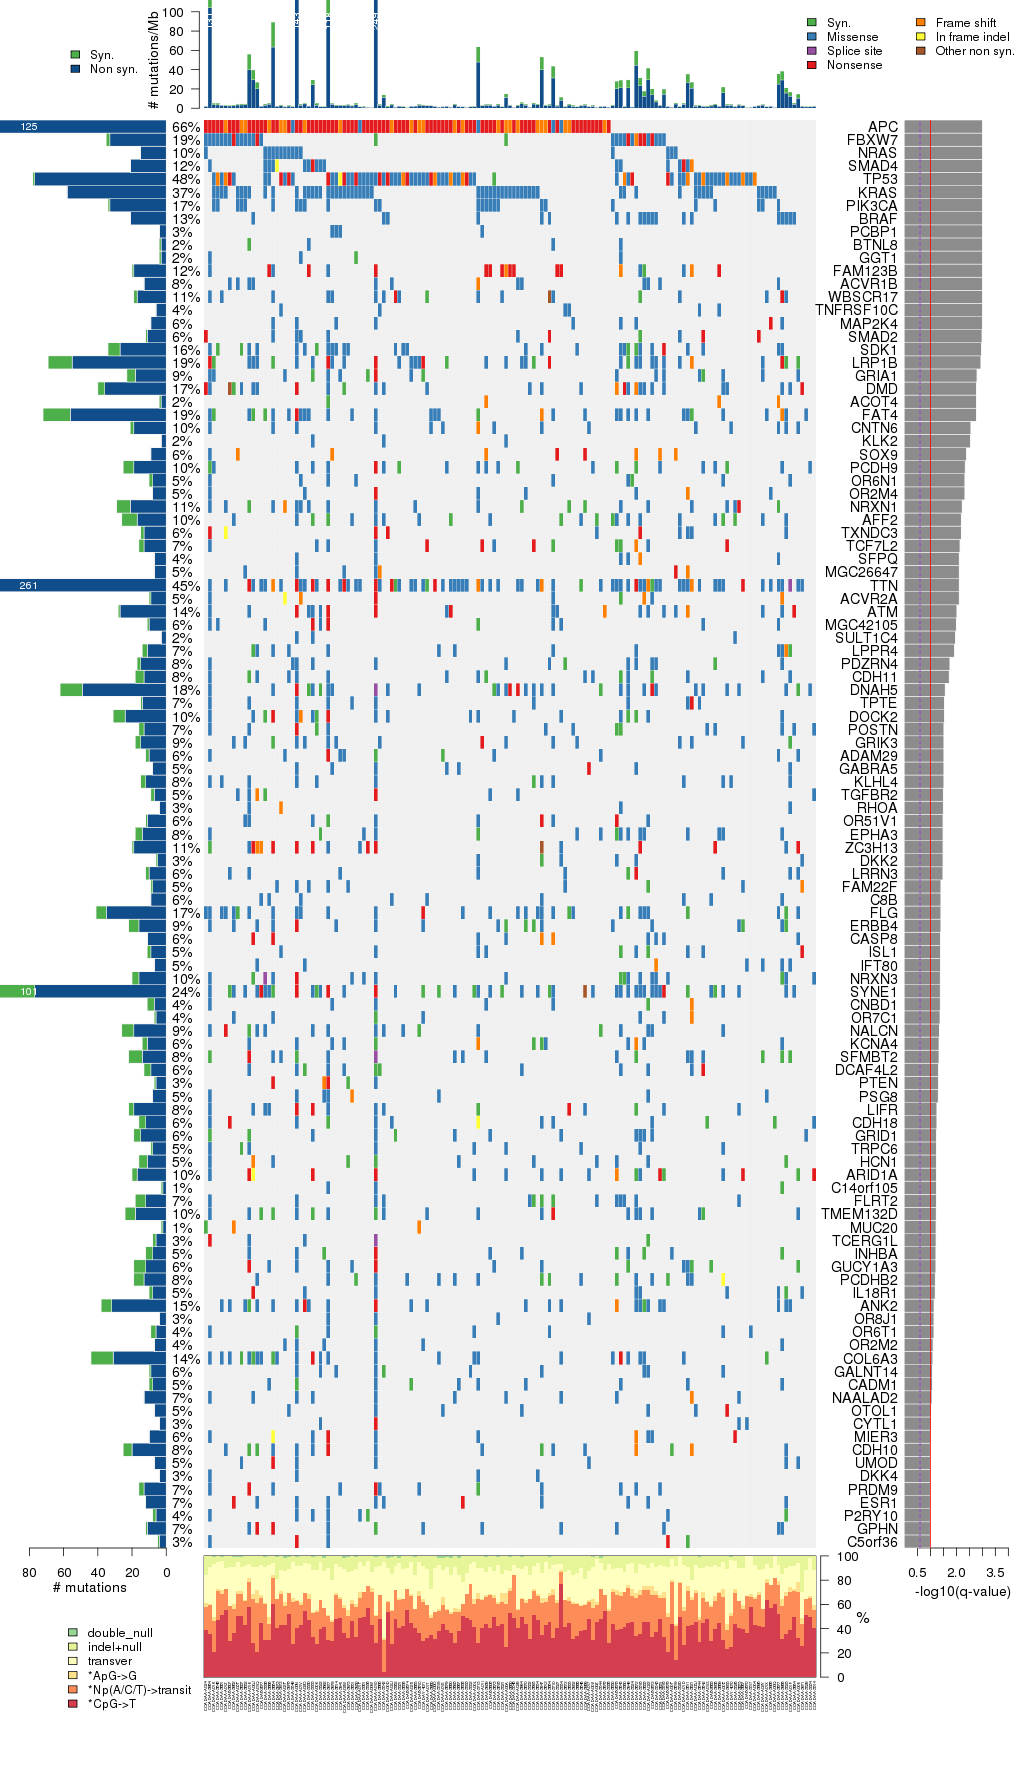
Figure 3. Get High-res Image The matrix in the center of the figure represents individual mutations in patient samples, color-coded by type of mutation, for the significantly mutated genes. The rate of synonymous and non-synonymous mutations is displayed at the top of the matrix. The barplot on the left of the matrix shows the number of mutations in each gene. The percentages represent the fraction of tumors with at least one mutation in the specified gene. The barplot to the right of the matrix displays the q-values for the most significantly mutated genes. The purple boxplots below the matrix (only displayed if required columns are present in the provided MAF) represent the distributions of allelic fractions observed in each sample. The plot at the bottom represents the base substitution distribution of individual samples, using the same categories that were used to calculate significance.
Column Descriptions:
-
N = number of sequenced bases in this gene across the individual set
-
n = number of (nonsilent) mutations in this gene across the individual set
-
npat = number of patients (individuals) with at least one nonsilent mutation
-
nsite = number of unique sites having a non-silent mutation
-
nsil = number of silent mutations in this gene across the individual set
-
n1 = number of nonsilent mutations of type: *CpG->T
-
n2 = number of nonsilent mutations of type: *Np(A/C/T)->transit
-
n3 = number of nonsilent mutations of type: *ApG->G
-
n4 = number of nonsilent mutations of type: transver
-
n5 = number of nonsilent mutations of type: indel+null
-
p_classic = p-value for the observed amount of nonsilent mutations being elevated in this gene
-
p_ks = p-value for clustering of mutations (Kolmogorov-Smirnoff test)
-
p_cons = p-value for enrichment of mutations at evolutionarily most-conserved sites in gene
-
p_joint = p-value for clustering + conservation
-
p = p-value (overall)
-
q = q-value, False Discovery Rate (Benjamini-Hochberg procedure)
Table 3. Get Full Table A Ranked List of Significantly Mutated Genes. Number of significant genes found: 110. Number of genes displayed: 35. Click on a gene name to display its stick figure depicting the distribution of mutations and mutation types across the chosen gene (this feature may not be available for all significant genes).
| rank | gene | description | N | n | npat | nsite | nsil | n1 | n2 | n3 | n4 | n5 | n6 | p_classic | p_ks | p_cons | p_joint | p | q |
|---|---|---|---|---|---|---|---|---|---|---|---|---|---|---|---|---|---|---|---|
| 1 | APC | adenomatous polyposis coli | 1331760 | 121 | 103 | 85 | 4 | 5 | 6 | 1 | 11 | 64 | 34 | 1.11e-15 | 2e-07 | 0.59 | 0.000016 | 0.00 | 0.00 |
| 2 | FBXW7 | F-box and WD repeat domain containing 7 | 400520 | 33 | 29 | 21 | 2 | 17 | 1 | 0 | 8 | 7 | 0 | <1.00e-15 | 0.00023 | 0.068 | 0.00043 | <0.00 | <0.00 |
| 3 | NRAS | neuroblastoma RAS viral (v-ras) oncogene homolog | 90830 | 15 | 15 | 7 | 0 | 2 | 2 | 0 | 11 | 0 | 0 | <1.00e-15 | 0.0012 | 0.014 | 0.00025 | <0.00 | <0.00 |
| 4 | SMAD4 | SMAD family member 4 | 263965 | 21 | 18 | 17 | 0 | 8 | 7 | 0 | 2 | 3 | 1 | <1.00e-15 | 0.078 | 0.0024 | 0.0037 | <1.11e-16 | <5.01e-13 |
| 5 | TP53 | tumor protein p53 | 200247 | 77 | 75 | 50 | 1 | 29 | 11 | 0 | 11 | 26 | 0 | <1.00e-15 | 2e-07 | 2e-07 | 0 | <1.00e-15 | <1.64e-12 |
| 6 | KRAS | v-Ki-ras2 Kirsten rat sarcoma viral oncogene homolog | 109585 | 58 | 58 | 8 | 0 | 0 | 31 | 0 | 27 | 0 | 0 | 1.89e-15 | 2e-07 | 2e-07 | 0 | <1.00e-15 | <1.64e-12 |
| 7 | PIK3CA | phosphoinositide-3-kinase, catalytic, alpha polypeptide | 509485 | 33 | 26 | 18 | 1 | 5 | 19 | 1 | 8 | 0 | 0 | <1.00e-15 | 0.00093 | 4e-07 | 0 | <1.00e-15 | <1.64e-12 |
| 8 | BRAF | v-raf murine sarcoma viral oncogene homolog B1 | 345805 | 21 | 20 | 3 | 0 | 0 | 0 | 0 | 21 | 0 | 0 | 6.03e-13 | 2e-07 | 8.4e-06 | 0 | <1.00e-15 | <1.64e-12 |
| 9 | PCBP1 | poly(rC) binding protein 1 | 159629 | 4 | 4 | 2 | 0 | 0 | 0 | 2 | 2 | 0 | 0 | 0.0019 | 1.6e-06 | 0.029 | 0 | <1.00e-15 | <1.64e-12 |
| 10 | BTNL8 | butyrophilin-like 8 | 125577 | 3 | 3 | 1 | 1 | 0 | 0 | 0 | 3 | 0 | 0 | 0.010 | 2e-07 | 0.049 | 0 | <1.00e-15 | <1.64e-12 |
| 11 | GGT1 | gamma-glutamyltransferase 1 | 249792 | 3 | 3 | 1 | 1 | 0 | 3 | 0 | 0 | 0 | 0 | 0.32 | 1e-06 | 2.2e-06 | 0 | <1.00e-15 | <1.64e-12 |
| 12 | FAM123B | family with sequence similarity 123B | 514207 | 19 | 19 | 17 | 1 | 1 | 2 | 0 | 2 | 14 | 0 | 1.95e-12 | 0.014 | 0.6 | 0.041 | 2.47e-12 | 3.71e-09 |
| 13 | ACVR1B | activin A receptor, type IB | 236140 | 13 | 13 | 13 | 0 | 4 | 6 | 0 | 2 | 1 | 0 | 2.14e-08 | 0.089 | 0.00044 | 0.0017 | 9.04e-10 | 1.25e-06 |
| 14 | WBSCR17 | Williams-Beuren syndrome chromosome region 17 | 279631 | 17 | 17 | 16 | 2 | 10 | 2 | 1 | 1 | 3 | 0 | 5.37e-10 | 0.043 | 0.49 | 0.089 | 1.18e-09 | 1.52e-06 |
| 15 | TNFRSF10C | tumor necrosis factor receptor superfamily, member 10c, decoy without an intracellular domain | 122980 | 6 | 6 | 2 | 0 | 0 | 0 | 0 | 6 | 0 | 0 | 6.99e-06 | 2.4e-06 | 1 | 0.000012 | 2.06e-09 | 2.48e-06 |
| 16 | MAP2K4 | mitogen-activated protein kinase kinase 4 | 174375 | 9 | 9 | 8 | 0 | 2 | 3 | 1 | 2 | 1 | 0 | 1.66e-06 | 0.031 | 0.00011 | 0.00029 | 1.07e-08 | 0.000012 |
| 17 | SMAD2 | SMAD family member 2 | 223820 | 11 | 10 | 8 | 1 | 3 | 0 | 0 | 4 | 4 | 0 | 1.12e-07 | 0.028 | 0.059 | 0.017 | 3.95e-08 | 0.000042 |
| 18 | SDK1 | sidekick homolog 1, cell adhesion molecule (chicken) | 994132 | 27 | 25 | 25 | 7 | 18 | 2 | 0 | 6 | 1 | 0 | 1.90e-06 | 0.0014 | 0.16 | 0.0025 | 9.48e-08 | 0.000095 |
| 19 | LRP1B | low density lipoprotein-related protein 1B (deleted in tumors) | 2195420 | 55 | 30 | 55 | 14 | 8 | 11 | 3 | 26 | 4 | 3 | 1.63e-08 | 0.44 | 0.53 | 0.55 | 1.75e-07 | 0.00017 |
| 20 | GRIA1 | glutamate receptor, ionotropic, AMPA 1 | 431675 | 18 | 14 | 17 | 5 | 7 | 5 | 2 | 3 | 1 | 0 | 1.04e-06 | 0.017 | 0.98 | 0.037 | 6.89e-07 | 0.00062 |
| 21 | DMD | dystrophin (muscular dystrophy, Duchenne and Becker types) | 1804783 | 36 | 27 | 35 | 4 | 6 | 5 | 2 | 16 | 7 | 0 | 8.52e-07 | 0.029 | 0.64 | 0.056 | 8.50e-07 | 0.00070 |
| 22 | ACOT4 | acyl-CoA thioesterase 4 | 166432 | 3 | 3 | 2 | 1 | 0 | 0 | 0 | 0 | 2 | 1 | 0.016 | 4e-07 | 0.019 | 3e-06 | 8.78e-07 | 0.00070 |
| 23 | FAT4 | FAT tumor suppressor homolog 4 (Drosophila) | 2316411 | 56 | 29 | 56 | 16 | 14 | 19 | 0 | 20 | 3 | 0 | 0.000059 | 0.0003 | 0.42 | 0.00085 | 8.95e-07 | 0.00070 |
| 24 | CNTN6 | contactin 6 | 492125 | 19 | 15 | 19 | 2 | 5 | 3 | 0 | 10 | 1 | 0 | 1.88e-07 | 0.63 | 0.67 | 0.77 | 2.43e-06 | 0.0018 |
| 25 | KLK2 | kallikrein-related peptidase 2 | 130665 | 3 | 3 | 1 | 0 | 0 | 0 | 0 | 3 | 0 | 0 | 0.049 | 2.8e-06 | 0.18 | 3.2e-06 | 2.60e-06 | 0.0019 |
| 26 | SOX9 | SRY (sex determining region Y)-box 9 (campomelic dysplasia, autosomal sex-reversal) | 187883 | 9 | 9 | 9 | 0 | 0 | 1 | 0 | 0 | 8 | 0 | 1.53e-06 | 0.12 | 0.54 | 0.18 | 4.45e-06 | 0.0031 |
| 27 | PCDH9 | protocadherin 9 | 578150 | 19 | 16 | 19 | 6 | 1 | 4 | 0 | 13 | 1 | 0 | 3.99e-07 | 0.71 | 0.68 | 0.85 | 5.36e-06 | 0.0036 |
| 28 | OR6N1 | olfactory receptor, family 6, subfamily N, member 1 | 146165 | 8 | 8 | 8 | 2 | 1 | 2 | 1 | 4 | 0 | 0 | 2.12e-06 | 0.17 | 0.29 | 0.18 | 6.08e-06 | 0.0038 |
| 29 | OR2M4 | olfactory receptor, family 2, subfamily M, member 4 | 145700 | 8 | 8 | 8 | 0 | 3 | 2 | 1 | 0 | 2 | 0 | 3.39e-06 | 0.49 | 0.03 | 0.12 | 6.18e-06 | 0.0038 |
| 30 | NRXN1 | neurexin 1 | 722337 | 21 | 17 | 21 | 8 | 8 | 1 | 0 | 10 | 2 | 0 | 0.000035 | 0.016 | 0.13 | 0.015 | 8.33e-06 | 0.0050 |
| 31 | AFF2 | AF4/FMR2 family, member 2 | 623100 | 17 | 15 | 16 | 9 | 2 | 7 | 0 | 8 | 0 | 0 | 2.29e-06 | 0.23 | 0.34 | 0.28 | 9.72e-06 | 0.0055 |
| 32 | TXNDC3 | thioredoxin domain containing 3 (spermatozoa) | 283185 | 13 | 10 | 13 | 2 | 3 | 1 | 1 | 3 | 5 | 0 | 6.45e-07 | 0.53 | 0.79 | 1 | 9.84e-06 | 0.0055 |
| 33 | TCF7L2 | transcription factor 7-like 2 (T-cell specific, HMG-box) | 313613 | 13 | 11 | 13 | 3 | 3 | 2 | 0 | 3 | 5 | 0 | 0.000021 | 0.02 | 0.3 | 0.036 | 0.000012 | 0.0063 |
| 34 | SFPQ | splicing factor proline/glutamine-rich (polypyrimidine tract binding protein associated) | 229920 | 7 | 6 | 6 | 0 | 4 | 2 | 0 | 0 | 1 | 0 | 0.047 | 0.0017 | 0.00023 | 0.000018 | 0.000013 | 0.0068 |
| 35 | MGC26647 | 118730 | 7 | 7 | 7 | 0 | 1 | 1 | 0 | 2 | 3 | 0 | 5.15e-06 | 0.11 | 0.79 | 0.18 | 0.000014 | 0.0068 |
In this analysis, COSMIC is used as a filter to increase power by restricting the territory of each gene. Cosmic version: v48.
Table 4. Get Full Table Significantly mutated genes (COSMIC territory only). To access the database please go to: COSMIC. Number of significant genes found: 23. Number of genes displayed: 10
| rank | gene | description | n | cos | n_cos | N_cos | cos_ev | p | q |
|---|---|---|---|---|---|---|---|---|---|
| 1 | KRAS | v-Ki-ras2 Kirsten rat sarcoma viral oncogene homolog | 58 | 51 | 58 | 7905 | 650714 | 0 | 0 |
| 2 | NRAS | neuroblastoma RAS viral (v-ras) oncogene homolog | 15 | 28 | 13 | 4340 | 12243 | 0 | 0 |
| 3 | FBXW7 | F-box and WD repeat domain containing 7 | 33 | 91 | 25 | 14105 | 899 | 0 | 0 |
| 4 | BRAF | v-raf murine sarcoma viral oncogene homolog B1 | 21 | 88 | 19 | 13640 | 199652 | 0 | 0 |
| 5 | PIK3CA | phosphoinositide-3-kinase, catalytic, alpha polypeptide | 33 | 184 | 30 | 28520 | 11874 | 0 | 0 |
| 6 | APC | adenomatous polyposis coli | 121 | 838 | 87 | 129890 | 1514 | 0 | 0 |
| 7 | TP53 | tumor protein p53 | 77 | 823 | 77 | 127565 | 27419 | 0 | 0 |
| 8 | SMAD4 | SMAD family member 4 | 21 | 159 | 13 | 24645 | 51 | 0 | 0 |
| 9 | ERBB3 | v-erb-b2 erythroblastic leukemia viral oncogene homolog 3 (avian) | 11 | 6 | 5 | 930 | 5 | 4.9e-13 | 2.4e-10 |
| 10 | CDC27 | cell division cycle 27 homolog (S. cerevisiae) | 9 | 3 | 4 | 465 | 4 | 1.7e-11 | 7.8e-09 |
Note:
n - number of (nonsilent) mutations in this gene across the individual set.
cos = number of unique mutated sites in this gene in COSMIC
n_cos = overlap between n and cos.
N_cos = number of individuals times cos.
cos_ev = total evidence: number of reports in COSMIC for mutations seen in this gene.
p = p-value for seeing the observed amount of overlap in this gene)
q = q-value, False Discovery Rate (Benjamini-Hochberg procedure)
There were no clustered mutations discovered.
Table 5. Get Full Table A Ranked List of Significantly Mutated Genesets. (Source: MSigDB GSEA Cannonical Pathway Set).Number of significant genesets found: 163. Number of genesets displayed: 10
| rank | geneset | description | genes | N_genes | mut_tally | N | n | npat | nsite | nsil | n1 | n2 | n3 | n4 | n5 | n6 | p | q |
|---|---|---|---|---|---|---|---|---|---|---|---|---|---|---|---|---|---|---|
| 1 | HSA04310_WNT_SIGNALING_PATHWAY | Genes involved in Wnt signaling pathway | APC, APC2, AXIN1, AXIN2, BTRC, CACYBP, CAMK2A, CAMK2B, CAMK2D, CAMK2G, CCND1, CCND2, CCND3, CER1, CHD8, CHP, CREBBP, CSNK1A1, CSNK1A1L, CSNK1E, CSNK2A1, CSNK2A2, CSNK2B, CTBP1, CTBP2, CTNNB1, CTNNBIP1, CUL1, CXXC4, DAAM1, DAAM2, DKK1, DKK2, DKK4, DVL1, DVL2, DVL3, EP300, FBXW11, FOSL1, FRAT1, FRAT2, FZD1, FZD10, FZD2, FZD3, FZD4, FZD5, FZD6, FZD7, FZD8, FZD9, GSK3B, JUN, LEF1, LOC652788, LRP5, LRP6, MAP3K7, MAPK10, MAPK8, MAPK9, MMP7, MYC, NFAT5, NFATC1, NFATC2, NFATC3, NFATC4, NKD1, NKD2, NLK, PLCB1, PLCB2, PLCB3, PLCB4, PORCN, PPARD, PPP2CA, PPP2CB, PPP2R1A, PPP2R1B, PPP2R2A, PPP2R2B, PPP2R2C, PPP3CA, PPP3CB, PPP3CC, PPP3R1, PPP3R2, PRICKLE1, PRICKLE2, PRKACA, PRKACB, PRKACG, PRKCA, PRKCB1, PRKCG, PRKX, PRKY, PSEN1, RAC1, RAC2, RAC3, RBX1, RHOA, ROCK1, ROCK2, RUVBL1, SENP2, SFRP1, SFRP2, SFRP4, SFRP5, SIAH1, SKP1, SMAD2, SMAD3, SMAD4, SOX17, TBL1X, TBL1XR1, TBL1Y, TCF7, TCF7L1, TCF7L2, TP53, VANGL1, VANGL2, WIF1, WNT1, WNT10A, WNT10B, WNT11, WNT16, WNT2, WNT2B, WNT3, WNT3A, WNT4, WNT5A, WNT5B, WNT6, WNT7A, WNT7B, WNT8A, WNT8B, WNT9A, WNT9B | 144 | APC(121), APC2(1), AXIN1(1), AXIN2(7), BTRC(2), CACYBP(1), CAMK2A(1), CAMK2B(2), CAMK2D(2), CAMK2G(2), CCND2(1), CCND3(1), CER1(3), CHD8(4), CREBBP(21), CSNK1A1(2), CSNK1A1L(5), CSNK2A1(4), CSNK2A2(2), CSNK2B(2), CTBP1(1), CTBP2(2), CTNNB1(8), CTNNBIP1(1), CUL1(7), CXXC4(1), DAAM1(1), DAAM2(5), DKK1(3), DKK2(5), DKK4(4), DVL2(8), DVL3(2), EP300(13), FBXW11(7), FZD10(4), FZD2(2), FZD3(10), FZD4(1), FZD6(3), FZD7(3), FZD8(1), GSK3B(7), LEF1(4), LRP5(5), LRP6(10), MAP3K7(2), MAPK10(4), MAPK8(2), MAPK9(3), MMP7(3), NFAT5(5), NFATC1(1), NFATC2(3), NFATC3(4), NFATC4(4), NKD1(3), NKD2(1), NLK(1), PLCB1(8), PLCB2(3), PLCB3(3), PLCB4(9), PORCN(2), PPARD(1), PPP2CA(1), PPP2R1A(4), PPP2R1B(1), PPP2R2A(1), PPP2R2B(1), PPP2R2C(3), PPP3CA(1), PPP3CB(4), PPP3CC(3), PPP3R1(1), PPP3R2(1), PRICKLE1(8), PRICKLE2(5), PRKACB(1), PRKACG(2), PRKCA(2), PRKCG(8), PRKX(2), PSEN1(3), RHOA(4), ROCK1(8), ROCK2(2), RUVBL1(6), SENP2(2), SFRP1(2), SFRP2(1), SFRP4(3), SFRP5(1), SIAH1(1), SKP1(1), SMAD2(11), SMAD3(6), SMAD4(21), SOX17(2), TBL1X(5), TBL1XR1(6), TCF7(3), TCF7L1(3), TCF7L2(13), TP53(77), VANGL1(2), VANGL2(5), WIF1(2), WNT1(1), WNT10B(3), WNT11(3), WNT16(2), WNT2B(1), WNT3(4), WNT3A(1), WNT4(1), WNT5A(3), WNT7A(2), WNT7B(2), WNT8A(1), WNT9A(2), WNT9B(1) | 37707125 | 631 | 150 | 557 | 120 | 207 | 110 | 8 | 124 | 147 | 35 | <1.00e-15 | <1.40e-14 |
| 2 | HSA04810_REGULATION_OF_ACTIN_CYTOSKELETON | Genes involved in regulation of actin cytoskeleton | ABI2, ACTN1, ACTN2, ACTN3, ACTN4, APC, APC2, ARAF, ARHGEF1, ARHGEF12, ARHGEF4, ARHGEF6, ARHGEF7, ARPC1A, ARPC1B, ARPC2, ARPC3, ARPC4, ARPC5, ARPC5L, BAIAP2, BCAR1, BDKRB1, BDKRB2, BRAF, C3orf10, CD14, CDC42, CFL1, CFL2, CHRM1, CHRM2, CHRM3, CHRM4, CHRM5, CRK, CRKL, CSK, CYFIP1, CYFIP2, DIAPH1, DIAPH2, DIAPH3, DOCK1, EGF, EGFR, EZR, F2, F2R, FGD1, FGD3, FGF1, FGF10, FGF11, FGF12, FGF13, FGF14, FGF16, FGF17, FGF18, FGF19, FGF2, FGF20, FGF21, FGF22, FGF23, FGF3, FGF4, FGF5, FGF6, FGF7, FGF8, FGF9, FGFR1, FGFR2, FGFR3, FGFR4, FN1, GIT1, GNA12, GNA13, GNG12, GRLF1, GSN, HRAS, INS, IQGAP1, IQGAP2, IQGAP3, ITGA1, ITGA10, ITGA11, ITGA2, ITGA2B, ITGA3, ITGA4, ITGA5, ITGA6, ITGA7, ITGA8, ITGA9, ITGAD, ITGAE, ITGAL, ITGAM, ITGAV, ITGAX, ITGB1, ITGB2, ITGB3, ITGB4, ITGB5, ITGB6, ITGB7, ITGB8, KRAS, LIMK1, LIMK2, LOC200025, LOC645126, LOC653888, MAP2K1, MAP2K2, MAPK1, MAPK3, MLCK, MOS, MRAS, MRCL3, MRLC2, MSN, MYH10, MYH14, MYH9, MYL2, MYL5, MYL7, MYL8P, MYL9, MYLC2PL, MYLK, MYLK2, MYLPF, NCKAP1, NCKAP1L, NRAS, PAK1, PAK2, PAK3, PAK4, PAK6, PAK7, PDGFA, PDGFB, PDGFRA, PDGFRB, PFN1, PFN2, PFN3, PFN4, PIK3CA, PIK3CB, PIK3CD, PIK3CG, PIK3R1, PIK3R2, PIK3R3, PIK3R5, PIP4K2A, PIP4K2B, PIP4K2C, PIP5K1A, PIP5K1B, PIP5K1C, PIP5K3, PPP1CA, PPP1CB, PPP1CC, PPP1R12A, PPP1R12B, PTK2, PXN, RAC1, RAC2, RAC3, RAF1, RDX, RHOA, ROCK1, ROCK2, RRAS, RRAS2, SCIN, SLC9A1, SOS1, SOS2, SSH1, SSH2, SSH3, TIAM1, TIAM2, TMSB4X, TMSB4Y, TMSL3, VAV1, VAV2, VAV3, VCL, WAS, WASF1, WASF2, WASL | 203 | ACTN1(3), ACTN2(7), ACTN3(2), ACTN4(2), APC(121), APC2(1), ARAF(3), ARHGEF1(4), ARHGEF12(7), ARHGEF4(3), ARHGEF6(7), ARHGEF7(8), ARPC1A(5), ARPC1B(2), ARPC2(1), ARPC5(1), ARPC5L(1), BDKRB2(2), BRAF(21), CD14(1), CFL1(1), CHRM1(3), CHRM2(8), CHRM3(4), CHRM5(1), CRKL(2), CSK(1), CYFIP1(5), CYFIP2(4), DIAPH1(1), DIAPH2(9), DIAPH3(3), DOCK1(5), EGF(3), EGFR(10), EZR(2), F2(2), FGD1(6), FGD3(1), FGF1(2), FGF11(2), FGF12(2), FGF13(2), FGF14(5), FGF17(1), FGF20(1), FGF21(1), FGF23(1), FGF3(1), FGF5(2), FGF6(3), FGF7(1), FGF8(1), FGF9(1), FGFR1(3), FGFR2(1), FGFR3(2), FGFR4(2), FN1(17), GIT1(2), GNA12(2), GNA13(2), GRLF1(7), IQGAP1(10), IQGAP2(9), IQGAP3(11), ITGA1(3), ITGA10(3), ITGA11(2), ITGA2(5), ITGA2B(2), ITGA3(4), ITGA4(3), ITGA5(7), ITGA6(3), ITGA7(6), ITGA8(5), ITGA9(4), ITGAD(7), ITGAE(5), ITGAL(5), ITGAM(5), ITGAV(1), ITGAX(4), ITGB1(6), ITGB2(4), ITGB3(7), ITGB4(2), ITGB5(5), ITGB6(6), ITGB7(4), ITGB8(4), KRAS(58), LIMK1(4), LIMK2(4), MAP2K1(3), MAPK1(2), MAPK3(2), MOS(2), MRAS(1), MSN(3), MYH10(8), MYH14(9), MYH9(9), MYL2(1), MYL7(1), MYLK(11), MYLK2(2), NCKAP1(8), NCKAP1L(7), NRAS(15), PAK1(4), PAK2(2), PAK3(3), PAK6(1), PAK7(4), PDGFA(1), PDGFRA(13), PDGFRB(5), PFN2(1), PFN4(1), PIK3CA(33), PIK3CB(2), PIK3CD(2), PIK3CG(12), PIK3R1(5), PIK3R2(1), PIK3R5(1), PIP4K2A(2), PIP4K2B(2), PIP4K2C(3), PIP5K1A(3), PIP5K1B(1), PIP5K1C(3), PPP1CB(1), PPP1CC(1), PPP1R12A(2), PPP1R12B(5), PTK2(5), RAF1(4), RDX(2), RHOA(4), ROCK1(8), ROCK2(2), RRAS2(1), SCIN(2), SLC9A1(2), SOS1(5), SOS2(9), SSH1(4), SSH2(4), TIAM1(12), TIAM2(14), TMSL3(1), VAV1(11), VAV2(2), VAV3(10), VCL(1), WAS(1), WASF1(1), WASF2(2), WASL(5) | 65590343 | 855 | 150 | 721 | 208 | 260 | 177 | 23 | 237 | 122 | 36 | <1.00e-15 | <1.40e-14 |
| 3 | ST_ADRENERGIC | Adrenergic receptors respond to epinephrine and norepinephrine signaling. | AKT1, APC, AR, ASAH1, BF, BRAF, CAMP, CCL13, CCL15, CCL16, DAG1, EGFR, GAS, GNA11, GNA15, GNAI1, GNAQ, ITPKA, ITPKB, ITPR1, ITPR2, ITPR3, KCNJ3, KCNJ5, KCNJ9, MAPK1, MAPK10, MAPK14, PHKA2, PIK3CA, PIK3CD, PIK3R1, PITX2, PTX1, PTX3, RAF1, SRC | 34 | AKT1(2), APC(121), AR(4), ASAH1(3), BRAF(21), CCL13(1), CCL15(1), DAG1(4), EGFR(10), GNA11(1), GNA15(3), GNAI1(3), GNAQ(3), ITPKB(4), ITPR1(11), ITPR2(12), ITPR3(11), KCNJ3(6), KCNJ5(3), KCNJ9(2), MAPK1(2), MAPK10(4), MAPK14(3), PHKA2(5), PIK3CA(33), PIK3CD(2), PIK3R1(5), PITX2(2), PTX3(2), RAF1(4), SRC(3) | 12617889 | 291 | 131 | 221 | 54 | 59 | 42 | 8 | 74 | 74 | 34 | <1.00e-15 | <1.40e-14 |
| 4 | WNT_SIGNALING | Wnt signaling genes | APC, ARHA, AXIN1, C2orf31, CCND1, CCND2, CCND3, CSNK1E, CSNK1E, LOC400927, CTNNB1, DIPA, DVL1, DVL2, DVL3, FBXW2, FOSL1, FRAT1, FZD1, FZD10, FZD2, FZD3, FZD5, FZD6, FZD7, FZD8, FZD9, GSK3B, JUN, LDLR, MAPK10, MAPK9, MYC, PAFAH1B1, PLAU, PPP2R5C, PPP2R5E, PRKCA, PRKCB1, PRKCD, PRKCE, PRKCG, PRKCH, PRKCI, PRKCM, PRKCQ, PRKCZ, PRKD1, RAC1, RHOA, SFRP4, TCF7, WNT1, WNT10A, WNT10B, WNT11, WNT16, WNT2, WNT2B, WNT3, WNT4, WNT5A, WNT5B, WNT6, WNT7A, WNT7B | 58 | APC(121), AXIN1(1), CCND2(1), CCND3(1), CTNNB1(8), DVL2(8), DVL3(2), FBXW2(2), FZD10(4), FZD2(2), FZD3(10), FZD6(3), FZD7(3), FZD8(1), GSK3B(7), LDLR(4), MAPK10(4), MAPK9(3), PAFAH1B1(3), PLAU(2), PPP2R5C(2), PPP2R5E(2), PRKCA(2), PRKCD(3), PRKCE(4), PRKCG(8), PRKCH(2), PRKCI(4), PRKCQ(4), PRKD1(10), RHOA(4), SFRP4(3), TCF7(3), WNT1(1), WNT10B(3), WNT11(3), WNT16(2), WNT2B(1), WNT3(4), WNT4(1), WNT5A(3), WNT7A(2), WNT7B(2) | 13763150 | 263 | 129 | 225 | 48 | 68 | 34 | 3 | 45 | 79 | 34 | <1.00e-15 | <1.40e-14 |
| 5 | HSA04210_APOPTOSIS | Genes involved in apoptosis | AIFM1, AKT1, AKT2, AKT3, APAF1, ATM, BAD, BAX, BCL2, BCL2L1, BID, BIRC2, BIRC3, BIRC4, CAPN1, CAPN2, CASP10, CASP3, CASP6, CASP7, CASP8, CASP9, CFLAR, CHP, CHUK, CSF2RB, CYCS, DFFA, DFFB, ENDOG, FADD, FAS, FASLG, IKBKB, IKBKG, IL1A, IL1B, IL1R1, IL1RAP, IL3, IL3RA, IRAK1, IRAK2, IRAK3, IRAK4, MAP3K14, MYD88, NFKB1, NFKB2, NFKBIA, NGFB, NTRK1, PIK3CA, PIK3CB, PIK3CD, PIK3CG, PIK3R1, PIK3R2, PIK3R3, PIK3R5, PPP3CA, PPP3CB, PPP3CC, PPP3R1, PPP3R2, PRKACA, PRKACB, PRKACG, PRKAR1A, PRKAR1B, PRKAR2A, PRKAR2B, RELA, RIPK1, TNF, TNFRSF10A, TNFRSF10B, TNFRSF10C, TNFRSF10D, TNFRSF1A, TNFSF10, TP53, TRADD, TRAF2 | 80 | AIFM1(1), AKT1(2), AKT2(5), APAF1(7), ATM(27), BAD(1), BAX(1), BCL2(1), BCL2L1(1), BID(1), BIRC2(2), BIRC3(2), CAPN1(2), CAPN2(5), CASP10(2), CASP3(1), CASP6(1), CASP7(1), CASP8(11), CASP9(2), CFLAR(2), CHUK(4), CSF2RB(7), DFFA(2), DFFB(2), FASLG(1), IKBKB(2), IL1A(1), IL1R1(3), IL3(3), IRAK1(1), IRAK2(8), IRAK3(1), IRAK4(2), MAP3K14(2), MYD88(1), NFKB1(3), NFKB2(2), NTRK1(6), PIK3CA(33), PIK3CB(2), PIK3CD(2), PIK3CG(12), PIK3R1(5), PIK3R2(1), PIK3R5(1), PPP3CA(1), PPP3CB(4), PPP3CC(3), PPP3R1(1), PPP3R2(1), PRKACB(1), PRKACG(2), PRKAR1A(1), PRKAR1B(1), PRKAR2B(2), RELA(2), RIPK1(2), TNFRSF10A(3), TNFRSF10B(2), TNFRSF10C(6), TNFRSF1A(1), TNFSF10(1), TP53(77), TRADD(1), TRAF2(1) | 19452085 | 298 | 127 | 250 | 48 | 91 | 71 | 6 | 74 | 55 | 1 | <1.00e-15 | <1.40e-14 |
| 6 | ALKPATHWAY | Activin receptor-like kinase 3 (ALK3) is required during gestation for cardiac muscle development. | ACVR1, APC, ATF2, AXIN1, BMP10, BMP2, BMP4, BMP5, BMP7, BMPR1A, BMPR2, CHRD, CTNNB1, DVL1, FZD1, GATA4, GSK3B, MADH1, MADH4, MADH5, MADH6, MAP3K7, MEF2C, MYL2, NKX2-5, NOG, NPPA, NPPB, RFC1, TCF1, TGFB1, TGFB2, TGFB3, TGFBR1, TGFBR2, TGFBR3, WNT1 | 32 | ACVR1(3), APC(121), AXIN1(1), BMP10(2), BMP4(1), BMP5(4), BMP7(5), BMPR1A(4), BMPR2(7), CHRD(5), CTNNB1(8), GATA4(1), GSK3B(7), MAP3K7(2), MEF2C(7), MYL2(1), NKX2-5(1), NPPA(1), RFC1(10), TGFB1(1), TGFB2(5), TGFBR1(6), TGFBR2(7), TGFBR3(5), WNT1(1) | 8372664 | 216 | 126 | 179 | 31 | 37 | 23 | 2 | 37 | 83 | 34 | <1.00e-15 | <1.40e-14 |
| 7 | ST_WNT_BETA_CATENIN_PATHWAY | Beta-catenin is degraded in the absence of Wnt signaling; when extracellular Wnt binds Frizzled receptors, beta-catenin accumulates in the nucleus and may promote cell survival. | AKT1, AKT2, AKT3, ANKRD6, APC, AXIN1, AXIN2, C22orf2, CER1, CSNK1A1, CTNNB1, DACT1, DKK1, DKK2, DKK3, DKK4, DVL1, FRAT1, FSTL1, GSK3A, GSK3B, IDAX, LAMR1, LRP1, MVP, NKD1, NKD2, PIN1, PSEN1, PTPRA, SENP2, SFRP1, TSHB, WIF1 | 30 | AKT1(2), AKT2(5), ANKRD6(5), APC(121), AXIN1(1), AXIN2(7), CER1(3), CSNK1A1(2), CTNNB1(8), DACT1(5), DKK1(3), DKK2(5), DKK3(2), DKK4(4), FSTL1(5), GSK3A(2), GSK3B(7), LRP1(14), MVP(4), NKD1(3), NKD2(1), PIN1(1), PSEN1(3), PTPRA(2), SENP2(2), SFRP1(2), WIF1(2) | 9421665 | 221 | 126 | 184 | 33 | 52 | 22 | 4 | 32 | 77 | 34 | <1.00e-15 | <1.40e-14 |
| 8 | CELL_CYCLE_KEGG | ABL1, ASK, ATM, BUB1, BUB1B, BUB3, CCNA1, CCNA2, CCNB1, CCNB2, CCNB3, CCND2, CCND3, CCNE1, CCNE2, CCNH, CDAN1, CDC14A, CDC14B, CDC14B, CDC14C, CDC2, CDC20, CDC25A, CDC25B, CDC25C, CDC45L, CDC6, CDC7, CDH1, CDK2, CDK4, CDKN1A, CDKN2A, CHEK1, CHEK2, DTX4, E2F1, E2F2, E2F3, E2F4, E2F5, E2F6, EP300, ESPL1, FLJ14001, GADD45A, GSK3B, HDAC1, HDAC2, HDAC3, HDAC4, HDAC5, HDAC6, HDAC7A, HDAC8, MAD1L1, MAD2L1, MAD2L2, MCM2, MCM3, MCM4, MCM5, MCM6, MCM7, MDM2, MPEG1, MPL, ORC1L, ORC2L, ORC3L, ORC4L, ORC5L, ORC6L, PCNA, PLK1, PRKDC, PTPRA, PTTG1, PTTG2, PTTG3, RB1, RBL1, SKP2, SMAD4, SMC1L1, TBC1D8, TFDP1, TGFB1, TP53, WEE1 | 82 | ABL1(4), ATM(27), BUB1(4), BUB1B(3), BUB3(2), CCNA1(4), CCNA2(3), CCNB1(2), CCNB2(2), CCNB3(4), CCND2(1), CCND3(1), CCNE1(3), CCNE2(1), CCNH(2), CDAN1(1), CDC14A(1), CDC14B(3), CDC20(3), CDC25A(2), CDC25B(5), CDC25C(3), CDC7(2), CDH1(4), CDK2(2), CDK4(2), CDKN1A(1), CDKN2A(1), CHEK1(1), CHEK2(1), DTX4(3), E2F2(1), E2F3(1), E2F4(1), E2F5(2), EP300(13), ESPL1(8), GSK3B(7), HDAC1(2), HDAC2(2), HDAC3(2), HDAC4(5), HDAC5(1), HDAC6(4), MAD1L1(1), MAD2L1(1), MAD2L2(1), MCM3(1), MCM4(4), MCM5(3), MCM6(3), MCM7(2), MDM2(4), MPEG1(2), MPL(1), ORC1L(1), ORC3L(1), ORC4L(1), ORC5L(1), PCNA(2), PLK1(6), PRKDC(13), PTPRA(2), PTTG1(1), RB1(4), RBL1(3), SKP2(1), SMAD4(21), TBC1D8(5), TFDP1(4), TGFB1(1), TP53(77), WEE1(3) | 26179810 | 317 | 123 | 286 | 54 | 92 | 80 | 4 | 77 | 61 | 3 | <1.00e-15 | <1.40e-14 | |
| 9 | ST_MYOCYTE_AD_PATHWAY | Cardiac myocytes have a variety of adrenergic receptors that induce subtype-specific signaling effects. | ADRB1, AKT1, APC, ASAH1, BF, CAMP, CAV3, DAG1, DLG4, EPHB2, GAS, GNAI1, GNAQ, HTATIP, ITPR1, ITPR2, ITPR3, KCNJ3, KCNJ5, KCNJ9, MAPK1, PITX2, PLB, PTX1, PTX3, RAC1, RHO, RYR1 | 23 | ADRB1(2), AKT1(2), APC(121), ASAH1(3), CAV3(2), DAG1(4), DLG4(2), EPHB2(7), GNAI1(3), GNAQ(3), ITPR1(11), ITPR2(12), ITPR3(11), KCNJ3(6), KCNJ5(3), KCNJ9(2), MAPK1(2), PITX2(2), PTX3(2), RHO(2), RYR1(19) | 10912170 | 221 | 123 | 184 | 49 | 55 | 22 | 5 | 33 | 72 | 34 | <1.00e-15 | <1.40e-14 |
| 10 | PITX2PATHWAY | The bicoid-related transcription factor Pitx2 is activated by Wnt binding to the Frizzled receptor and induces tissue-specific cell proliferation. | APC, AXIN1, CREBBP, CTNNB1, DVL1, EP300, FZD1, GSK3B, HDAC1, HTATIP, LDB1, LEF1, PITX2, PPARBP, TRRAP, WNT1 | 14 | APC(121), AXIN1(1), CREBBP(21), CTNNB1(8), EP300(13), GSK3B(7), HDAC1(2), LDB1(3), LEF1(4), PITX2(2), TRRAP(17), WNT1(1) | 7596514 | 200 | 122 | 163 | 25 | 38 | 31 | 2 | 19 | 76 | 34 | <1.00e-15 | <1.40e-14 |
Table 6. Get Full Table A Ranked List of Significantly Mutated Genesets (Excluding Significantly Mutated Genes). Number of significant genesets found: 0. Number of genesets displayed: 10
| rank | geneset | description | genes | N_genes | mut_tally | N | n | npat | nsite | nsil | n1 | n2 | n3 | n4 | n5 | n6 | p | q |
|---|---|---|---|---|---|---|---|---|---|---|---|---|---|---|---|---|---|---|
| 1 | EOSINOPHILSPATHWAY | Recruitment of eosinophils in the inflammatory response observed in asthma occurs via the chemoattractant eotaxin binding to the CCR3 receptor. | CCL11, CCL5, CCR3, CSF2, HLA-DRA, HLA-DRB1, IL3, IL5 | 8 | CCR3(3), HLA-DRA(4), HLA-DRB1(1), IL3(3) | 657753 | 11 | 11 | 10 | 2 | 5 | 1 | 0 | 3 | 0 | 2 | 0.0008 | 0.35 |
| 2 | PITX2PATHWAY | The bicoid-related transcription factor Pitx2 is activated by Wnt binding to the Frizzled receptor and induces tissue-specific cell proliferation. | APC, AXIN1, CREBBP, CTNNB1, DVL1, EP300, FZD1, GSK3B, HDAC1, HTATIP, LDB1, LEF1, PITX2, PPARBP, TRRAP, WNT1 | 13 | AXIN1(1), CREBBP(21), CTNNB1(8), EP300(13), GSK3B(7), HDAC1(2), LDB1(3), LEF1(4), PITX2(2), TRRAP(17), WNT1(1) | 6264754 | 79 | 46 | 78 | 21 | 33 | 25 | 1 | 8 | 12 | 0 | 0.0014 | 0.35 |
| 3 | CTLA4PATHWAY | T cell activation requires interaction with an antigen-MHC-I complex on an antigen-presenting cell (APC), as well as CD28 interaction with the APC's CD80 or 86. | CD28, CD3D, CD3E, CD3G, CD3Z, CD80, CD86, CTLA4, GRB2, HLA-DRA, HLA-DRB1, ICOS, ICOSL, IL2, ITK, LCK, PIK3CA, PIK3R1, PTPN11, TRA@, TRB@ | 16 | CD28(1), CD3D(1), CD3G(2), CTLA4(1), GRB2(2), HLA-DRA(4), HLA-DRB1(1), ICOS(1), IL2(3), ITK(8), LCK(2), PIK3R1(5), PTPN11(2) | 2423198 | 33 | 23 | 32 | 7 | 7 | 9 | 2 | 8 | 5 | 2 | 0.0017 | 0.35 |
| 4 | PELP1PATHWAY | Pelp1 acts downstream of activated estrogen receptor to promote cell proliferation and is overexpressed in many breast tumors. | CREBBP, EP300, ESR1, MAPK1, MAPK3, PELP1, SRC | 7 | CREBBP(21), EP300(13), ESR1(12), MAPK1(2), MAPK3(2), PELP1(2), SRC(3) | 3533262 | 55 | 34 | 55 | 13 | 18 | 20 | 1 | 9 | 7 | 0 | 0.003 | 0.35 |
| 5 | GPCRDB_CLASS_A_RHODOPSIN_LIKE | ADORA1, ADORA2A, ADORA2B, ADORA3, ADRA1A, ADRA1B, ADRA1D, ADRA2A, ADRA2C, ADRB1, ADRB2, ADRB3, AGTR1, AGTR2, AGTRL1, AVPR1A, AVPR1B, AVPR2, BDKRB1, BDKRB2, BLR1, BRS3, C3AR1, C5R1, CCBP2, CCKAR, CCKBR, CCR1, CCR10, CCR2, CCR3, CCR4, CCR5, CCR6, CCR7, CCR8, CCR9, CCRL1, CCRL2, CHML, CHRM1, CHRM2, CHRM3, CHRM4, CHRM5, CMKLR1, CMKOR1, CNR1, CNR2, CX3CR1, CXCR3, CXCR4, DRD1, DRD2, DRD3, DRD4, DRD5, EDNRA, EDNRB, ELA3A, F2R, F2RL1, F2RL2, F2RL3, FPR1, FPRL1, FPRL2, FSHR, GALR1, GALR2, GALR3, GALT, GHSR, GNB2L1, GPR10, GPR147, GPR17, GPR173, GPR174, GPR23, GPR24, GPR27, GPR3, GPR30, GPR35, GPR37, GPR37L1, GPR4, GPR44, GPR50, GPR6, GPR63, GPR74, GPR77, GPR83, GPR85, GPR87, GPR92, GRPR, HCRTR1, HCRTR2, HRH1, HRH2, HRH3, HTR1A, HTR1B, HTR1D, HTR1E, HTR1F, HTR2A, HTR2B, HTR2C, HTR4, HTR5A, HTR6, HTR7, HTR7, LOC93164, IL8RA, IL8RB, LHCGR, LTB4R, MAS1, MC1R, MC3R, MC4R, MC5R, MLNR, MTNR1A, MTNR1B, NMBR, NMUR1, NMUR2, NPY1R, NPY2R, NPY5R, NPY6R, NTSR1, NTSR2, OPN1SW, OPN3, OPRD1, OPRK1, OPRL1, OPRM1, OR10A5, OR11A1, OR12D3, OR1C1, OR1F1, OR1Q1, OR2H1, OR5V1, OR5V1, OR12D3, OR7A5, OR7C1, OR8B8, OXTR, P2RY1, P2RY10, P2RY11, P2RY12, P2RY13, P2RY14, P2RY2, P2RY5, P2RY6, PPYR1, PTAFR, PTGDR, PTGER1, PTGER2, PTGER4, PTGFR, PTGIR, Rgr, RGR, RHO, RRH, SSTR1, SSTR2, SSTR3, SSTR4, SUCNR1, TBXA2R, TRHR | 162 | ADORA1(5), ADORA2A(3), ADORA2B(1), ADORA3(3), ADRA1A(5), ADRA1B(4), ADRA1D(2), ADRA2A(3), ADRB1(2), ADRB3(1), AGTR1(3), AGTR2(4), AVPR1A(3), AVPR1B(3), AVPR2(6), BDKRB2(2), BRS3(1), C3AR1(2), CCBP2(5), CCKAR(1), CCKBR(3), CCR1(5), CCR3(3), CCR5(1), CCR6(2), CCR7(1), CCR8(4), CCR9(4), CCRL1(2), CHML(4), CHRM1(3), CHRM2(8), CHRM3(4), CHRM5(1), CMKLR1(2), CNR1(3), CX3CR1(1), CXCR4(3), DRD1(1), DRD2(3), DRD3(3), DRD5(2), EDNRA(4), EDNRB(7), F2RL2(2), FPR1(2), FSHR(6), GALR1(1), GALT(2), GHSR(5), GPR17(1), GPR173(2), GPR174(2), GPR37(6), GPR37L1(3), GPR4(1), GPR50(5), GPR6(5), GPR63(2), GPR77(1), GPR83(1), GPR85(1), GPR87(4), GRPR(3), HCRTR1(1), HCRTR2(1), HRH1(1), HRH2(4), HTR1A(3), HTR1B(3), HTR1D(2), HTR1E(5), HTR1F(2), HTR2A(2), HTR2B(1), HTR2C(6), HTR4(2), HTR5A(2), HTR7(6), LHCGR(4), MAS1(1), MC3R(1), MC4R(3), MC5R(4), MLNR(3), MTNR1B(3), NMUR1(4), NMUR2(6), NPY1R(4), NPY2R(5), NPY5R(1), NTSR1(1), NTSR2(4), OPN1SW(3), OPN3(1), OPRD1(1), OPRK1(5), OPRM1(1), OR12D3(1), OR1C1(1), OR1F1(2), OR2H1(3), OR5V1(2), OR7A5(3), OR8B8(2), OXTR(2), P2RY1(3), P2RY10(6), P2RY12(3), P2RY13(2), P2RY14(4), P2RY2(2), PPYR1(1), PTAFR(1), PTGER2(1), PTGFR(6), PTGIR(1), RGR(2), RHO(2), RRH(2), SSTR1(4), SSTR2(2), SSTR4(2), TRHR(6) | 27582563 | 350 | 94 | 351 | 123 | 144 | 85 | 5 | 90 | 26 | 0 | 0.0033 | 0.35 | |
| 6 | GABAPATHWAY | Gamma-aminobutyric acid (GABA) is an inhibitory neurotransmitter whose receptor is regulated by Plic-1, gephyrin, and GABARAP, which promote receptor clustering. | DNM1, GABARAP, GABRA1, GABRA2, GABRA3, GABRA4, GABRA5, GABRA6, GPHN, NSF, SRC, UBQLN1 | 11 | DNM1(8), GABRA1(2), GABRA2(6), GABRA3(4), GABRA4(6), GABRA6(4), GPHN(11), NSF(1), SRC(3), UBQLN1(2) | 2609190 | 47 | 27 | 45 | 20 | 13 | 9 | 1 | 17 | 7 | 0 | 0.0034 | 0.35 |
| 7 | 1_AND_2_METHYLNAPHTHALENE_DEGRADATION | ADH1A, ADH1A, ADH1B, ADH1C, ADH1B, ADH1C, ADH4, ADH6, ADH7, ADHFE1 | 7 | ADH1B(2), ADH1C(3), ADH4(1), ADH6(5), ADH7(2), ADHFE1(6) | 1307115 | 19 | 16 | 19 | 5 | 3 | 4 | 1 | 11 | 0 | 0 | 0.0053 | 0.35 | |
| 8 | HSA04012_ERBB_SIGNALING_PATHWAY | Genes involved in ErbB signaling pathway | ABL1, ABL2, AKT1, AKT2, AKT3, ARAF, AREG, BAD, BRAF, BTC, CAMK2A, CAMK2B, CAMK2D, CAMK2G, CBL, CBLB, CBLC, CDKN1A, CDKN1B, CRK, CRKL, EGF, EGFR, EIF4EBP1, ELK1, ERBB2, ERBB3, ERBB4, EREG, FRAP1, GAB1, GRB2, GSK3B, HBEGF, HRAS, JUN, KRAS, MAP2K1, MAP2K2, MAP2K4, MAP2K7, MAPK1, MAPK10, MAPK3, MAPK8, MAPK9, MYC, NCK1, NCK2, NRAS, NRG1, NRG2, NRG3, NRG4, PAK1, PAK2, PAK3, PAK4, PAK6, PAK7, PIK3CA, PIK3CB, PIK3CD, PIK3CG, PIK3R1, PIK3R2, PIK3R3, PIK3R5, PLCG1, PLCG2, PRKCA, PRKCB1, PRKCG, PTK2, RAF1, RPS6KB1, RPS6KB2, SHC1, SHC2, SHC3, SHC4, SOS1, SOS2, SRC, STAT5A, STAT5B, TGFA | 79 | ABL1(4), ABL2(5), AKT1(2), AKT2(5), ARAF(3), BAD(1), BTC(2), CAMK2A(1), CAMK2B(2), CAMK2D(2), CAMK2G(2), CBL(2), CBLB(6), CDKN1A(1), CDKN1B(1), CRKL(2), EGF(3), EGFR(10), ERBB2(6), ERBB3(11), EREG(1), GAB1(6), GRB2(2), GSK3B(7), HBEGF(1), MAP2K1(3), MAPK1(2), MAPK10(4), MAPK3(2), MAPK8(2), MAPK9(3), NRG1(9), NRG2(4), NRG3(3), NRG4(1), PAK1(4), PAK2(2), PAK3(3), PAK6(1), PAK7(4), PIK3CB(2), PIK3CD(2), PIK3CG(12), PIK3R1(5), PIK3R2(1), PIK3R5(1), PLCG1(4), PLCG2(9), PRKCA(2), PRKCG(8), PTK2(5), RAF1(4), RPS6KB1(3), RPS6KB2(1), SHC1(3), SHC3(1), SHC4(5), SOS1(5), SOS2(9), SRC(3), STAT5B(2) | 22279133 | 222 | 77 | 216 | 71 | 77 | 54 | 9 | 52 | 30 | 0 | 0.0055 | 0.35 |
| 9 | HSA04080_NEUROACTIVE_LIGAND_RECEPTOR_INTERACTION | Genes involved in neuroactive ligand-receptor interaction | ADCYAP1R1, ADORA1, ADORA2A, ADORA2B, ADORA3, ADRA1A, ADRA1B, ADRA2A, ADRA2B, ADRA2C, ADRB1, ADRB2, ADRB3, AGTR1, AGTR2, AGTRL1, AVPR1A, AVPR1B, AVPR2, BDKRB1, BDKRB2, BRS3, C3AR1, C5AR1, CALCR, CALCRL, CCKAR, CCKBR, CGA, CHRM1, CHRM2, CHRM3, CHRM4, CHRM5, CNR1, CNR2, CRHR1, CRHR2, CTSG, CYSLTR1, CYSLTR2, DRD1, DRD2, DRD3, DRD4, DRD5, EDG1, EDG2, EDG3, EDG4, EDG5, EDG6, EDG7, EDG8, EDNRA, EDNRB, F2, F2R, F2RL1, F2RL2, F2RL3, FPR1, FPRL1, FPRL2, FSHB, FSHR, GABBR1, GABBR2, GABRA1, GABRA2, GABRA3, GABRA4, GABRA5, GABRA6, GABRB1, GABRB2, GABRB3, GABRD, GABRE, GABRG1, GABRG2, GABRG3, GABRP, GABRQ, GABRR1, GABRR2, GALR1, GALR2, GALR3, GCGR, GH1, GH2, GHR, GHRHR, GHSR, GIPR, GLP1R, GLP2R, GLRA1, GLRA2, GLRA3, GLRB, GNRHR, GPR156, GPR23, GPR35, GPR50, GPR63, GPR83, GRIA1, GRIA2, GRIA3, GRIA4, GRID1, GRID2, GRIK1, GRIK2, GRIK3, GRIK4, GRIK5, GRIN1, GRIN2A, GRIN2B, GRIN2C, GRIN2D, GRIN3A, GRIN3B, GRM1, GRM2, GRM3, GRM4, GRM5, GRM6, GRM7, GRM8, GRPR, GZMA, HCRTR1, HCRTR2, HRH1, HRH2, HRH3, HRH4, HTR1A, HTR1B, HTR1D, HTR1E, HTR1F, HTR2A, HTR2B, HTR2C, HTR4, HTR5A, HTR6, HTR7, KISS1R, LEP, LEPR, LHB, LHCGR, LTB4R, LTB4R2, MAS1, MC1R, MC2R, MC3R, MC4R, MC5R, MCHR1, MCHR2, MLNR, MTNR1A, MTNR1B, NMBR, NMUR1, NMUR2, NPBWR1, NPBWR2, NPFFR1, NPFFR2, NPY1R, NPY2R, NPY5R, NR3C1, NTSR1, NTSR2, OPRD1, OPRK1, OPRL1, OPRM1, OXTR, P2RX1, P2RX2, P2RX3, P2RX4, P2RX5, P2RX7, P2RXL1, P2RY1, P2RY10, P2RY11, P2RY13, P2RY14, P2RY2, P2RY4, P2RY5, P2RY6, P2RY8, PARD3, PPYR1, PRL, PRLHR, PRLR, PRSS1, PRSS2, PRSS3, PTAFR, PTGDR, PTGER1, PTGER2, PTGER3, PTGER4, PTGFR, PTGIR, PTH2R, PTHR1, RXFP1, RXFP2, SCTR, SSTR1, SSTR2, SSTR3, SSTR4, SSTR5, TAAR1, TAAR2, TAAR5, TAAR6, TAAR8, TAAR9, TACR1, TACR2, TACR3, TBXA2R, THRA, THRB, TRHR, TRPV1, TSHB, TSHR, TSPO, UTS2R, VIPR1, VIPR2 | 232 | ADCYAP1R1(1), ADORA1(5), ADORA2A(3), ADORA2B(1), ADORA3(3), ADRA1A(5), ADRA1B(4), ADRA2A(3), ADRB1(2), ADRB3(1), AGTR1(3), AGTR2(4), AVPR1A(3), AVPR1B(3), AVPR2(6), BDKRB2(2), BRS3(1), C3AR1(2), C5AR1(2), CALCR(3), CALCRL(5), CCKAR(1), CCKBR(3), CGA(1), CHRM1(3), CHRM2(8), CHRM3(4), CHRM5(1), CNR1(3), CRHR1(1), CRHR2(4), CTSG(2), CYSLTR1(3), CYSLTR2(3), DRD1(1), DRD2(3), DRD3(3), DRD5(2), EDNRA(4), EDNRB(7), F2(2), F2RL2(2), FPR1(2), FSHB(1), FSHR(6), GABBR1(4), GABBR2(3), GABRA1(2), GABRA2(6), GABRA3(4), GABRA4(6), GABRA6(4), GABRB1(6), GABRB2(4), GABRB3(5), GABRE(5), GABRG1(7), GABRG2(8), GABRG3(5), GABRP(2), GABRQ(7), GABRR1(2), GABRR2(3), GALR1(1), GH1(1), GH2(1), GHR(6), GHRHR(2), GHSR(5), GLP1R(2), GLP2R(3), GLRA1(2), GLRA2(2), GLRA3(7), GLRB(6), GNRHR(4), GPR156(6), GPR50(5), GPR63(2), GPR83(1), GRIA2(10), GRIA3(5), GRIA4(12), GRID2(10), GRIK1(5), GRIK2(10), GRIK4(11), GRIK5(5), GRIN1(1), GRIN2A(15), GRIN2B(8), GRIN2C(2), GRIN2D(3), GRIN3A(3), GRM1(9), GRM2(3), GRM3(5), GRM4(7), GRM5(8), GRM6(9), GRM7(8), GRM8(7), GRPR(3), GZMA(2), HCRTR1(1), HCRTR2(1), HRH1(1), HRH2(4), HRH4(2), HTR1A(3), HTR1B(3), HTR1D(2), HTR1E(5), HTR1F(2), HTR2A(2), HTR2B(1), HTR2C(6), HTR4(2), HTR5A(2), HTR7(6), LEP(1), LEPR(5), LHB(1), LHCGR(4), MAS1(1), MC2R(2), MC3R(1), MC4R(3), MC5R(4), MCHR1(6), MCHR2(2), MLNR(3), MTNR1B(3), NMUR1(4), NMUR2(6), NPBWR1(3), NPFFR2(3), NPY1R(4), NPY2R(5), NPY5R(1), NR3C1(3), NTSR1(1), NTSR2(4), OPRD1(1), OPRK1(5), OPRM1(1), OXTR(2), P2RX1(1), P2RX2(1), P2RX3(2), P2RX4(2), P2RX5(1), P2RX7(2), P2RY1(3), P2RY10(6), P2RY13(2), P2RY14(4), P2RY2(2), P2RY4(6), PARD3(5), PPYR1(1), PRL(2), PRLR(2), PRSS1(3), PRSS2(1), PRSS3(4), PTAFR(1), PTGER2(1), PTGER3(6), PTGFR(6), PTGIR(1), PTH2R(6), RXFP1(2), RXFP2(8), SCTR(3), SSTR1(4), SSTR2(2), SSTR4(2), TAAR1(3), TAAR2(2), TAAR5(5), TAAR6(2), TAAR8(1), TAAR9(1), TACR1(2), TACR2(1), TACR3(4), THRA(2), THRB(4), TRHR(6), TRPV1(3), TSHR(6), VIPR1(3), VIPR2(3) | 49927640 | 694 | 117 | 691 | 262 | 266 | 153 | 15 | 202 | 58 | 0 | 0.0064 | 0.35 |
| 10 | ERBB3PATHWAY | Neuregulins bind to the receptor tyrosine kinases ErbB3 and ErbB4, surface-localized receptors whose overexpression induces tumor formation. | EGF, EGFR, ERBB3, NRG1, UBE2D1 | 5 | EGF(3), EGFR(10), ERBB3(11), NRG1(9), UBE2D1(1) | 2391404 | 34 | 26 | 31 | 6 | 16 | 7 | 0 | 7 | 4 | 0 | 0.0074 | 0.35 |
In brief, we tabulate the number of mutations and the number of covered bases for each gene. The counts are broken down by mutation context category: four context categories that are discovered by MutSig, and one for indel and 'null' mutations, which include indels, nonsense mutations, splice-site mutations, and non-stop (read-through) mutations. For each gene, we calculate the probability of seeing the observed constellation of mutations, i.e. the product P1 x P2 x ... x Pm, or a more extreme one, given the background mutation rates calculated across the dataset. [1]
This is an experimental feature. The full results of the analysis summarized in this report can be downloaded from the TCGA Data Coordination Center.