This pipeline computes the correlation between significant arm-level copy number variations (cnvs) and selected clinical features.
Testing the association between copy number variation 45 arm-level results and 7 clinical features across 145 patients, 15 significant findings detected with Q value < 0.25.
-
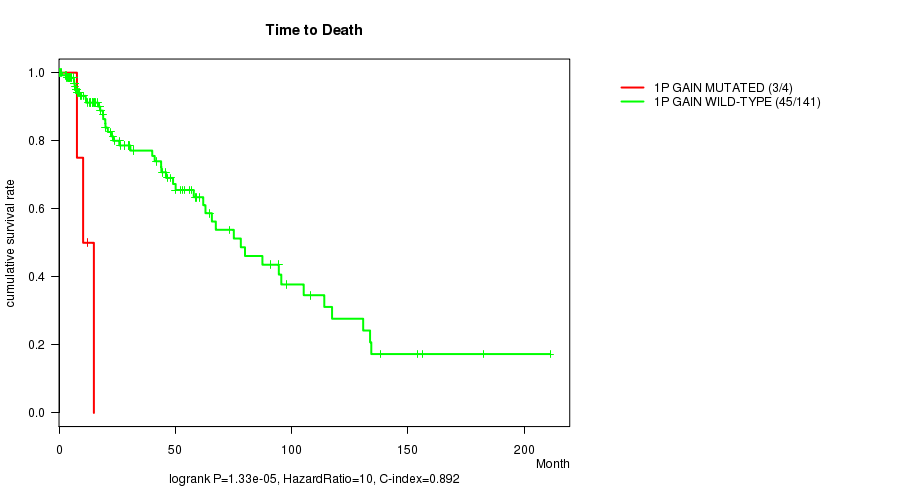
1p gain cnv correlated to 'Time to Death'.
-
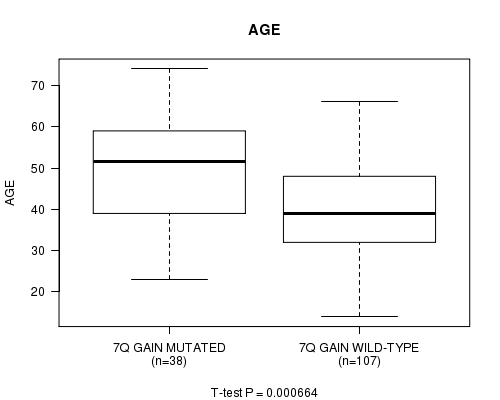
7q gain cnv correlated to 'AGE'.
-
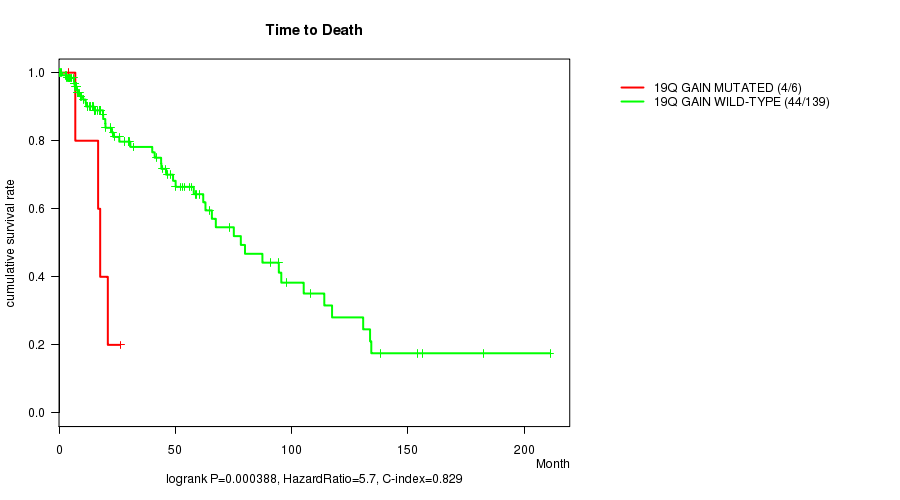
19q gain cnv correlated to 'Time to Death'.
-
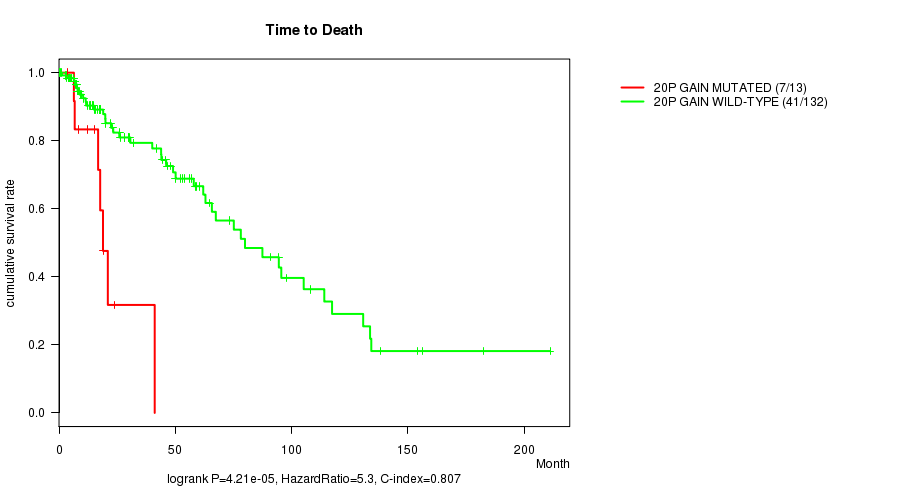
20p gain cnv correlated to 'Time to Death'.
-
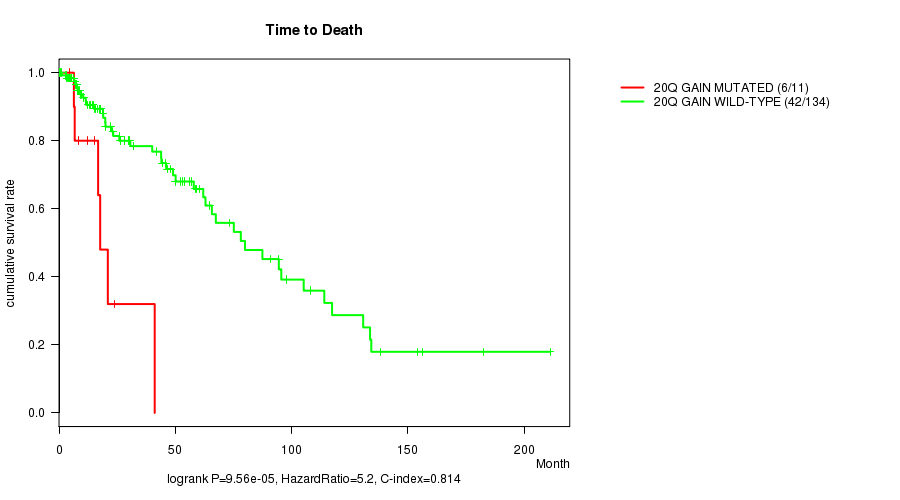
20q gain cnv correlated to 'Time to Death'.
-
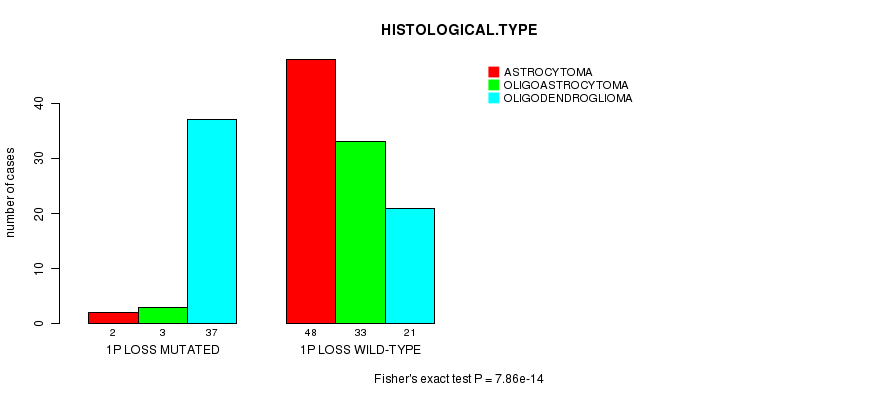
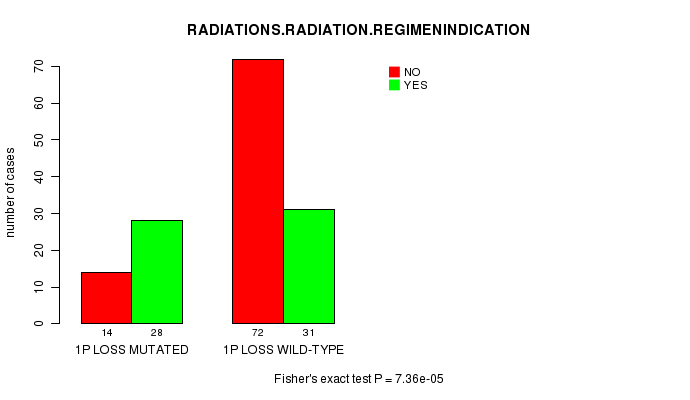
1p loss cnv correlated to 'HISTOLOGICAL.TYPE' and 'RADIATIONS.RADIATION.REGIMENINDICATION'.
-
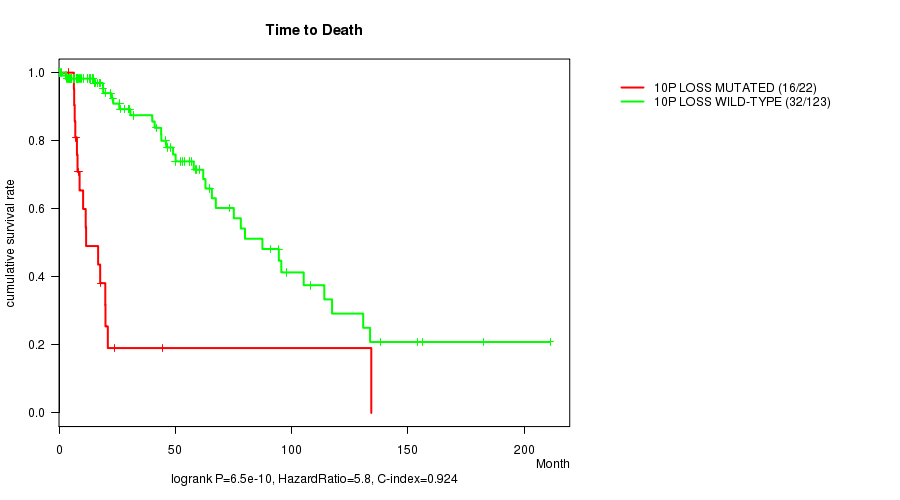
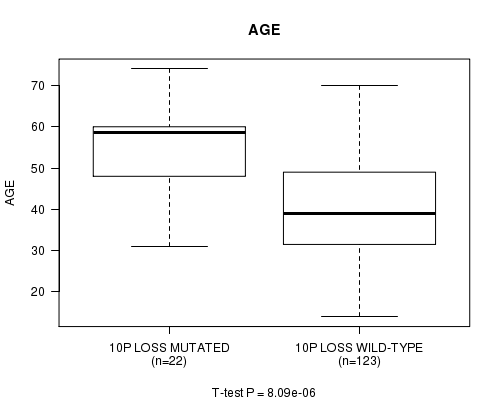
10p loss cnv correlated to 'Time to Death' and 'AGE'.
-
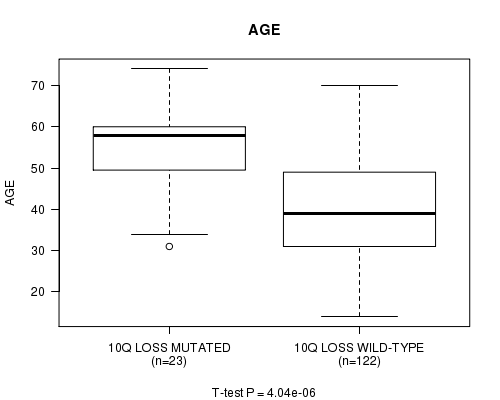
10q loss cnv correlated to 'Time to Death' and 'AGE'.
-
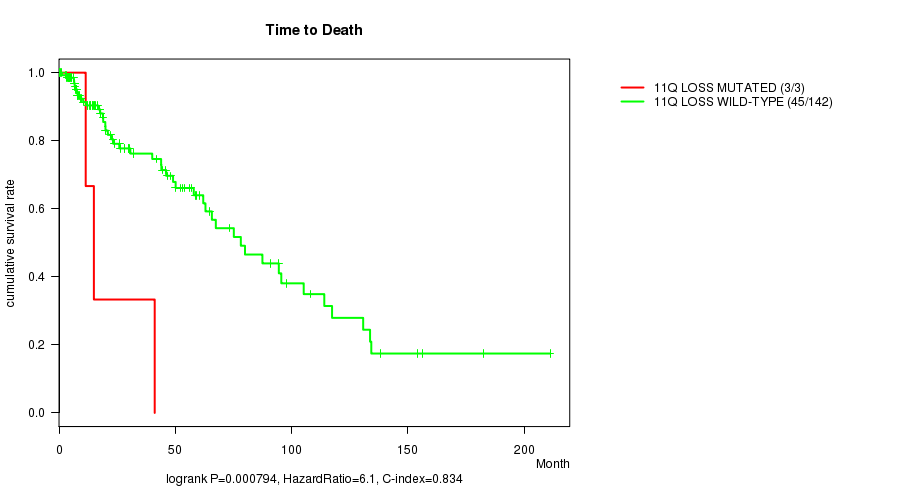
11q loss cnv correlated to 'Time to Death'.
-
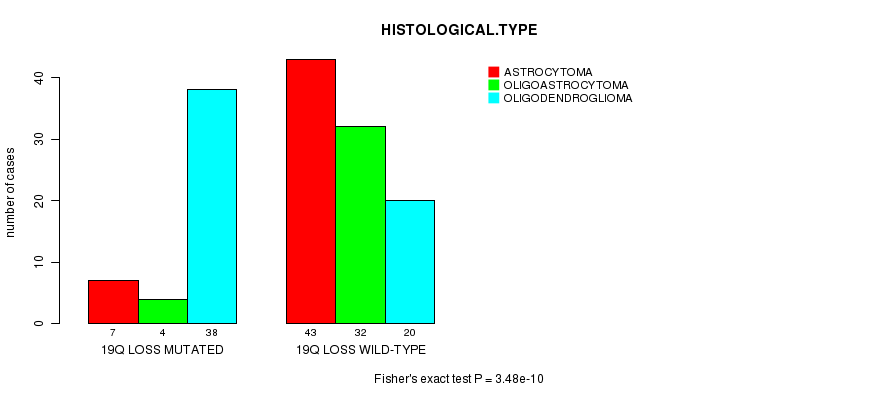
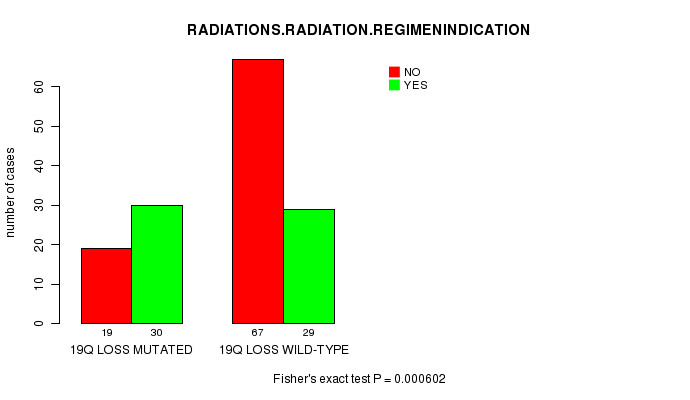
19q loss cnv correlated to 'HISTOLOGICAL.TYPE' and 'RADIATIONS.RADIATION.REGIMENINDICATION'.
-
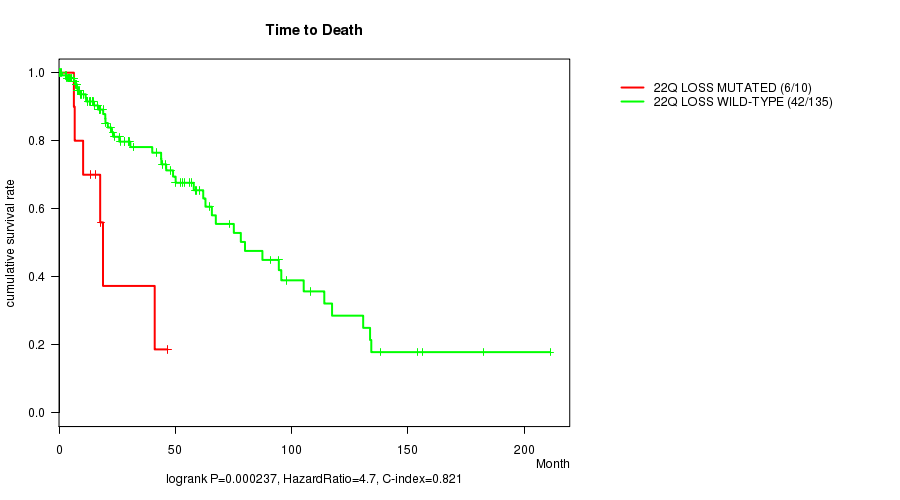
22q loss cnv correlated to 'Time to Death'.
Table 1. Get Full Table Overview of the association between significant copy number variation of 45 arm-level results and 7 clinical features. Shown in the table are P values (Q values). Thresholded by Q value < 0.25, 15 significant findings detected.
|
Clinical Features |
Time to Death |
AGE | GENDER |
KARNOFSKY PERFORMANCE SCORE |
HISTOLOGICAL TYPE |
RADIATIONS RADIATION REGIMENINDICATION |
NEOADJUVANT THERAPY |
||
| nCNV (%) | nWild-Type | logrank test | t-test | Fisher's exact test | t-test | Fisher's exact test | Fisher's exact test | Fisher's exact test | |
| 1p loss | 42 (29%) | 103 |
0.102 (1.00) |
0.0374 (1.00) |
0.715 (1.00) |
0.941 (1.00) |
7.86e-14 (2.35e-11) |
7.36e-05 (0.0214) |
0.857 (1.00) |
| 10p loss | 22 (15%) | 123 |
6.5e-10 (1.93e-07) |
8.09e-06 (0.00238) |
0.249 (1.00) |
0.441 (1.00) |
0.0234 (1.00) |
0.481 (1.00) |
0.647 (1.00) |
| 10q loss | 23 (16%) | 122 |
1.37e-09 (4.07e-07) |
4.04e-06 (0.00119) |
0.171 (1.00) |
0.473 (1.00) |
0.0129 (1.00) |
0.357 (1.00) |
0.499 (1.00) |
| 19q loss | 49 (34%) | 96 |
0.108 (1.00) |
0.113 (1.00) |
1 (1.00) |
0.985 (1.00) |
3.48e-10 (1.04e-07) |
0.000602 (0.173) |
0.489 (1.00) |
| 1p gain | 4 (3%) | 141 |
1.33e-05 (0.0039) |
0.0704 (1.00) |
0.313 (1.00) |
0.0168 (1.00) |
1 (1.00) |
0.36 (1.00) |
|
| 7q gain | 38 (26%) | 107 |
0.0127 (1.00) |
0.000664 (0.19) |
0.569 (1.00) |
0.649 (1.00) |
0.292 (1.00) |
0.249 (1.00) |
0.576 (1.00) |
| 19q gain | 6 (4%) | 139 |
0.000388 (0.112) |
0.0511 (1.00) |
0.239 (1.00) |
0.315 (1.00) |
0.384 (1.00) |
0.401 (1.00) |
0.681 (1.00) |
| 20p gain | 13 (9%) | 132 |
4.21e-05 (0.0123) |
0.0631 (1.00) |
0.558 (1.00) |
0.607 (1.00) |
0.13 (1.00) |
0.561 (1.00) |
0.777 (1.00) |
| 20q gain | 11 (8%) | 134 |
9.56e-05 (0.0277) |
0.119 (1.00) |
0.53 (1.00) |
0.458 (1.00) |
0.204 (1.00) |
1 (1.00) |
1 (1.00) |
| 11q loss | 3 (2%) | 142 |
0.000794 (0.226) |
0.197 (1.00) |
0.576 (1.00) |
0.0549 (1.00) |
0.271 (1.00) |
0.615 (1.00) |
|
| 22q loss | 10 (7%) | 135 |
0.000237 (0.0684) |
0.917 (1.00) |
0.745 (1.00) |
0.21 (1.00) |
0.006 (1.00) |
0.529 (1.00) |
0.527 (1.00) |
| 1q gain | 6 (4%) | 139 |
0.139 (1.00) |
0.0381 (1.00) |
0.402 (1.00) |
0.457 (1.00) |
0.239 (1.00) |
1 (1.00) |
0.435 (1.00) |
| 7p gain | 28 (19%) | 117 |
0.00937 (1.00) |
0.0333 (1.00) |
0.0941 (1.00) |
0.745 (1.00) |
0.199 (1.00) |
0.0857 (1.00) |
0.835 (1.00) |
| 8p gain | 12 (8%) | 133 |
0.692 (1.00) |
0.912 (1.00) |
0.557 (1.00) |
0.511 (1.00) |
0.474 (1.00) |
0.123 (1.00) |
0.238 (1.00) |
| 8q gain | 15 (10%) | 130 |
0.922 (1.00) |
0.475 (1.00) |
1 (1.00) |
0.75 (1.00) |
0.195 (1.00) |
0.281 (1.00) |
0.179 (1.00) |
| 9p gain | 3 (2%) | 142 |
0.122 (1.00) |
0.0184 (1.00) |
0.576 (1.00) |
0.348 (1.00) |
1 (1.00) |
0.615 (1.00) |
|
| 9q gain | 3 (2%) | 142 |
0.0507 (1.00) |
0.236 (1.00) |
0.576 (1.00) |
0.0549 (1.00) |
0.271 (1.00) |
0.615 (1.00) |
|
| 10p gain | 17 (12%) | 128 |
0.522 (1.00) |
0.00718 (1.00) |
0.301 (1.00) |
0.179 (1.00) |
0.312 (1.00) |
0.432 (1.00) |
1 (1.00) |
| 11p gain | 7 (5%) | 138 |
0.564 (1.00) |
0.538 (1.00) |
1 (1.00) |
0.102 (1.00) |
0.486 (1.00) |
0.701 (1.00) |
0.269 (1.00) |
| 11q gain | 11 (8%) | 134 |
0.68 (1.00) |
0.335 (1.00) |
0.53 (1.00) |
0.479 (1.00) |
0.854 (1.00) |
1 (1.00) |
0.762 (1.00) |
| 12p gain | 7 (5%) | 138 |
0.496 (1.00) |
0.0178 (1.00) |
0.0201 (1.00) |
0.792 (1.00) |
1 (1.00) |
0.442 (1.00) |
|
| 12q gain | 3 (2%) | 142 |
0.381 (1.00) |
0.00111 (0.316) |
0.261 (1.00) |
1 (1.00) |
0.567 (1.00) |
0.245 (1.00) |
|
| 18p gain | 3 (2%) | 142 |
0.516 (1.00) |
0.847 (1.00) |
0.576 (1.00) |
0.0549 (1.00) |
0.567 (1.00) |
0.615 (1.00) |
|
| 19p gain | 8 (6%) | 137 |
0.175 (1.00) |
0.01 (1.00) |
0.467 (1.00) |
0.0931 (1.00) |
0.301 (1.00) |
0.142 (1.00) |
0.488 (1.00) |
| 21q gain | 4 (3%) | 141 |
0.293 (1.00) |
0.992 (1.00) |
0.636 (1.00) |
0.454 (1.00) |
0.646 (1.00) |
0.62 (1.00) |
|
| 1q loss | 7 (5%) | 138 |
0.5 (1.00) |
0.0318 (1.00) |
0.461 (1.00) |
0.128 (1.00) |
0.00282 (0.795) |
1 (1.00) |
1 (1.00) |
| 3q loss | 7 (5%) | 138 |
0.589 (1.00) |
0.932 (1.00) |
0.699 (1.00) |
0.513 (1.00) |
0.375 (1.00) |
1 (1.00) |
0.715 (1.00) |
| 4p loss | 13 (9%) | 132 |
0.122 (1.00) |
0.165 (1.00) |
0.154 (1.00) |
0.359 (1.00) |
0.0407 (1.00) |
0.141 (1.00) |
0.394 (1.00) |
| 4q loss | 21 (14%) | 124 |
0.0946 (1.00) |
0.873 (1.00) |
0.475 (1.00) |
0.36 (1.00) |
0.257 (1.00) |
0.148 (1.00) |
0.242 (1.00) |
| 5p loss | 10 (7%) | 135 |
0.234 (1.00) |
0.944 (1.00) |
0.517 (1.00) |
0.181 (1.00) |
0.00704 (1.00) |
0.74 (1.00) |
0.527 (1.00) |
| 5q loss | 7 (5%) | 138 |
0.0135 (1.00) |
0.884 (1.00) |
0.461 (1.00) |
0.44 (1.00) |
0.549 (1.00) |
0.241 (1.00) |
1 (1.00) |
| 6q loss | 14 (10%) | 131 |
0.00814 (1.00) |
0.251 (1.00) |
0.27 (1.00) |
0.236 (1.00) |
0.00126 (0.356) |
0.00817 (1.00) |
0.269 (1.00) |
| 9p loss | 29 (20%) | 116 |
0.00615 (1.00) |
0.0833 (1.00) |
0.676 (1.00) |
0.9 (1.00) |
0.0517 (1.00) |
0.00538 (1.00) |
0.147 (1.00) |
| 9q loss | 3 (2%) | 142 |
0.885 (1.00) |
0.0917 (1.00) |
0.576 (1.00) |
0.786 (1.00) |
0.567 (1.00) |
1 (1.00) |
|
| 11p loss | 15 (10%) | 130 |
0.0773 (1.00) |
0.128 (1.00) |
1 (1.00) |
0.939 (1.00) |
0.00586 (1.00) |
0.281 (1.00) |
0.789 (1.00) |
| 12q loss | 6 (4%) | 139 |
0.557 (1.00) |
0.6 (1.00) |
1 (1.00) |
0.196 (1.00) |
1 (1.00) |
0.681 (1.00) |
|
| 13q loss | 17 (12%) | 128 |
0.296 (1.00) |
0.702 (1.00) |
1 (1.00) |
0.428 (1.00) |
0.806 (1.00) |
0.188 (1.00) |
0.445 (1.00) |
| 14q loss | 17 (12%) | 128 |
0.00327 (0.919) |
0.12 (1.00) |
0.068 (1.00) |
0.664 (1.00) |
0.224 (1.00) |
0.121 (1.00) |
0.608 (1.00) |
| 15q loss | 9 (6%) | 136 |
0.943 (1.00) |
0.846 (1.00) |
0.301 (1.00) |
0.0478 (1.00) |
0.159 (1.00) |
0.742 (1.00) |
|
| 16q loss | 4 (3%) | 141 |
0.944 (1.00) |
0.179 (1.00) |
1 (1.00) |
0.827 (1.00) |
0.146 (1.00) |
1 (1.00) |
|
| 18p loss | 10 (7%) | 135 |
0.67 (1.00) |
0.683 (1.00) |
0.745 (1.00) |
0.399 (1.00) |
0.134 (1.00) |
1 (1.00) |
0.527 (1.00) |
| 18q loss | 12 (8%) | 133 |
0.253 (1.00) |
0.903 (1.00) |
0.362 (1.00) |
0.467 (1.00) |
0.033 (1.00) |
0.762 (1.00) |
0.558 (1.00) |
| 19p loss | 5 (3%) | 140 |
0.682 (1.00) |
0.652 (1.00) |
1 (1.00) |
0.447 (1.00) |
0.397 (1.00) |
0.677 (1.00) |
|
| 21q loss | 5 (3%) | 140 |
0.946 (1.00) |
0.751 (1.00) |
1 (1.00) |
0.532 (1.00) |
1 (1.00) |
0.677 (1.00) |
|
| Xq loss | 3 (2%) | 142 |
0.289 (1.00) |
0.188 (1.00) |
1 (1.00) |
0.271 (1.00) |
0.615 (1.00) |
P value = 1.33e-05 (logrank test), Q value = 0.0039
Table S1. Gene #1: '1p gain mutation analysis' versus Clinical Feature #1: 'Time to Death'
| nPatients | nDeath | Duration Range (Median), Month | |
|---|---|---|---|
| ALL | 145 | 48 | 0.0 - 211.2 (18.0) |
| 1P GAIN MUTATED | 4 | 3 | 7.7 - 15.0 (11.4) |
| 1P GAIN WILD-TYPE | 141 | 45 | 0.0 - 211.2 (18.9) |
Figure S1. Get High-res Image Gene #1: '1p gain mutation analysis' versus Clinical Feature #1: 'Time to Death'
P value = 0.000664 (t-test), Q value = 0.19
Table S2. Gene #4: '7q gain mutation analysis' versus Clinical Feature #2: 'AGE'
| nPatients | Mean (Std.Dev) | |
|---|---|---|
| ALL | 145 | 42.8 (13.0) |
| 7Q GAIN MUTATED | 38 | 49.6 (14.0) |
| 7Q GAIN WILD-TYPE | 107 | 40.4 (11.8) |
Figure S2. Get High-res Image Gene #4: '7q gain mutation analysis' versus Clinical Feature #2: 'AGE'
P value = 0.000388 (logrank test), Q value = 0.11
Table S3. Gene #16: '19q gain mutation analysis' versus Clinical Feature #1: 'Time to Death'
| nPatients | nDeath | Duration Range (Median), Month | |
|---|---|---|---|
| ALL | 145 | 48 | 0.0 - 211.2 (18.0) |
| 19Q GAIN MUTATED | 6 | 4 | 4.1 - 26.3 (17.2) |
| 19Q GAIN WILD-TYPE | 139 | 44 | 0.0 - 211.2 (18.9) |
Figure S3. Get High-res Image Gene #16: '19q gain mutation analysis' versus Clinical Feature #1: 'Time to Death'
P value = 4.21e-05 (logrank test), Q value = 0.012
Table S4. Gene #17: '20p gain mutation analysis' versus Clinical Feature #1: 'Time to Death'
| nPatients | nDeath | Duration Range (Median), Month | |
|---|---|---|---|
| ALL | 145 | 48 | 0.0 - 211.2 (18.0) |
| 20P GAIN MUTATED | 13 | 7 | 3.8 - 41.1 (16.8) |
| 20P GAIN WILD-TYPE | 132 | 41 | 0.0 - 211.2 (19.4) |
Figure S4. Get High-res Image Gene #17: '20p gain mutation analysis' versus Clinical Feature #1: 'Time to Death'
P value = 9.56e-05 (logrank test), Q value = 0.028
Table S5. Gene #18: '20q gain mutation analysis' versus Clinical Feature #1: 'Time to Death'
| nPatients | nDeath | Duration Range (Median), Month | |
|---|---|---|---|
| ALL | 145 | 48 | 0.0 - 211.2 (18.0) |
| 20Q GAIN MUTATED | 11 | 6 | 4.7 - 41.1 (15.3) |
| 20Q GAIN WILD-TYPE | 134 | 42 | 0.0 - 211.2 (19.0) |
Figure S5. Get High-res Image Gene #18: '20q gain mutation analysis' versus Clinical Feature #1: 'Time to Death'
P value = 7.86e-14 (Fisher's exact test), Q value = 2.3e-11
Table S6. Gene #20: '1p loss mutation analysis' versus Clinical Feature #5: 'HISTOLOGICAL.TYPE'
| nPatients | ASTROCYTOMA | OLIGOASTROCYTOMA | OLIGODENDROGLIOMA |
|---|---|---|---|
| ALL | 50 | 36 | 58 |
| 1P LOSS MUTATED | 2 | 3 | 37 |
| 1P LOSS WILD-TYPE | 48 | 33 | 21 |
Figure S6. Get High-res Image Gene #20: '1p loss mutation analysis' versus Clinical Feature #5: 'HISTOLOGICAL.TYPE'
P value = 7.36e-05 (Fisher's exact test), Q value = 0.021
Table S7. Gene #20: '1p loss mutation analysis' versus Clinical Feature #6: 'RADIATIONS.RADIATION.REGIMENINDICATION'
| nPatients | NO | YES |
|---|---|---|
| ALL | 86 | 59 |
| 1P LOSS MUTATED | 14 | 28 |
| 1P LOSS WILD-TYPE | 72 | 31 |
Figure S7. Get High-res Image Gene #20: '1p loss mutation analysis' versus Clinical Feature #6: 'RADIATIONS.RADIATION.REGIMENINDICATION'
P value = 6.5e-10 (logrank test), Q value = 1.9e-07
Table S8. Gene #30: '10p loss mutation analysis' versus Clinical Feature #1: 'Time to Death'
| nPatients | nDeath | Duration Range (Median), Month | |
|---|---|---|---|
| ALL | 145 | 48 | 0.0 - 211.2 (18.0) |
| 10P LOSS MUTATED | 22 | 16 | 4.1 - 134.3 (10.9) |
| 10P LOSS WILD-TYPE | 123 | 32 | 0.0 - 211.2 (22.1) |
Figure S8. Get High-res Image Gene #30: '10p loss mutation analysis' versus Clinical Feature #1: 'Time to Death'
P value = 8.09e-06 (t-test), Q value = 0.0024
Table S9. Gene #30: '10p loss mutation analysis' versus Clinical Feature #2: 'AGE'
| nPatients | Mean (Std.Dev) | |
|---|---|---|
| ALL | 145 | 42.8 (13.0) |
| 10P LOSS MUTATED | 22 | 54.6 (11.0) |
| 10P LOSS WILD-TYPE | 123 | 40.7 (12.3) |
Figure S9. Get High-res Image Gene #30: '10p loss mutation analysis' versus Clinical Feature #2: 'AGE'
P value = 1.37e-09 (logrank test), Q value = 4.1e-07
Table S10. Gene #31: '10q loss mutation analysis' versus Clinical Feature #1: 'Time to Death'
| nPatients | nDeath | Duration Range (Median), Month | |
|---|---|---|---|
| ALL | 145 | 48 | 0.0 - 211.2 (18.0) |
| 10Q LOSS MUTATED | 23 | 16 | 4.1 - 134.3 (11.5) |
| 10Q LOSS WILD-TYPE | 122 | 32 | 0.0 - 211.2 (22.2) |
Figure S10. Get High-res Image Gene #31: '10q loss mutation analysis' versus Clinical Feature #1: 'Time to Death'

P value = 4.04e-06 (t-test), Q value = 0.0012
Table S11. Gene #31: '10q loss mutation analysis' versus Clinical Feature #2: 'AGE'
| nPatients | Mean (Std.Dev) | |
|---|---|---|
| ALL | 145 | 42.8 (13.0) |
| 10Q LOSS MUTATED | 23 | 54.4 (10.8) |
| 10Q LOSS WILD-TYPE | 122 | 40.6 (12.3) |
Figure S11. Get High-res Image Gene #31: '10q loss mutation analysis' versus Clinical Feature #2: 'AGE'
P value = 0.000794 (logrank test), Q value = 0.23
Table S12. Gene #33: '11q loss mutation analysis' versus Clinical Feature #1: 'Time to Death'
| nPatients | nDeath | Duration Range (Median), Month | |
|---|---|---|---|
| ALL | 145 | 48 | 0.0 - 211.2 (18.0) |
| 11Q LOSS MUTATED | 3 | 3 | 11.5 - 41.1 (15.0) |
| 11Q LOSS WILD-TYPE | 142 | 45 | 0.0 - 211.2 (18.4) |
Figure S12. Get High-res Image Gene #33: '11q loss mutation analysis' versus Clinical Feature #1: 'Time to Death'
P value = 3.48e-10 (Fisher's exact test), Q value = 1e-07
Table S13. Gene #42: '19q loss mutation analysis' versus Clinical Feature #5: 'HISTOLOGICAL.TYPE'
| nPatients | ASTROCYTOMA | OLIGOASTROCYTOMA | OLIGODENDROGLIOMA |
|---|---|---|---|
| ALL | 50 | 36 | 58 |
| 19Q LOSS MUTATED | 7 | 4 | 38 |
| 19Q LOSS WILD-TYPE | 43 | 32 | 20 |
Figure S13. Get High-res Image Gene #42: '19q loss mutation analysis' versus Clinical Feature #5: 'HISTOLOGICAL.TYPE'
P value = 0.000602 (Fisher's exact test), Q value = 0.17
Table S14. Gene #42: '19q loss mutation analysis' versus Clinical Feature #6: 'RADIATIONS.RADIATION.REGIMENINDICATION'
| nPatients | NO | YES |
|---|---|---|
| ALL | 86 | 59 |
| 19Q LOSS MUTATED | 19 | 30 |
| 19Q LOSS WILD-TYPE | 67 | 29 |
Figure S14. Get High-res Image Gene #42: '19q loss mutation analysis' versus Clinical Feature #6: 'RADIATIONS.RADIATION.REGIMENINDICATION'
P value = 0.000237 (logrank test), Q value = 0.068
Table S15. Gene #44: '22q loss mutation analysis' versus Clinical Feature #1: 'Time to Death'
| nPatients | nDeath | Duration Range (Median), Month | |
|---|---|---|---|
| ALL | 145 | 48 | 0.0 - 211.2 (18.0) |
| 22Q LOSS MUTATED | 10 | 6 | 6.4 - 46.6 (16.8) |
| 22Q LOSS WILD-TYPE | 135 | 42 | 0.0 - 211.2 (19.0) |
Figure S15. Get High-res Image Gene #44: '22q loss mutation analysis' versus Clinical Feature #1: 'Time to Death'
-
Mutation data file = broad_values_by_arm.mutsig.cluster.txt
-
Clinical data file = LGG.clin.merged.picked.txt
-
Number of patients = 145
-
Number of significantly arm-level cnvs = 45
-
Number of selected clinical features = 7
-
Exclude genes that fewer than K tumors have mutations, K = 3
For survival clinical features, the Kaplan-Meier survival curves of tumors with and without gene mutations were plotted and the statistical significance P values were estimated by logrank test (Bland and Altman 2004) using the 'survdiff' function in R
For continuous numerical clinical features, two-tailed Student's t test with unequal variance (Lehmann and Romano 2005) was applied to compare the clinical values between tumors with and without gene mutations using 't.test' function in R
For binary or multi-class clinical features (nominal or ordinal), two-tailed Fisher's exact tests (Fisher 1922) were used to estimate the P values using the 'fisher.test' function in R
For multiple hypothesis correction, Q value is the False Discovery Rate (FDR) analogue of the P value (Benjamini and Hochberg 1995), defined as the minimum FDR at which the test may be called significant. We used the 'Benjamini and Hochberg' method of 'p.adjust' function in R to convert P values into Q values.
This is an experimental feature. The full results of the analysis summarized in this report can be downloaded from the TCGA Data Coordination Center.