This pipeline computes the correlation between significant arm-level copy number variations (cnvs) and selected clinical features.
Testing the association between copy number variation 79 arm-level results and 11 clinical features across 307 patients, 13 significant findings detected with Q value < 0.25.
-
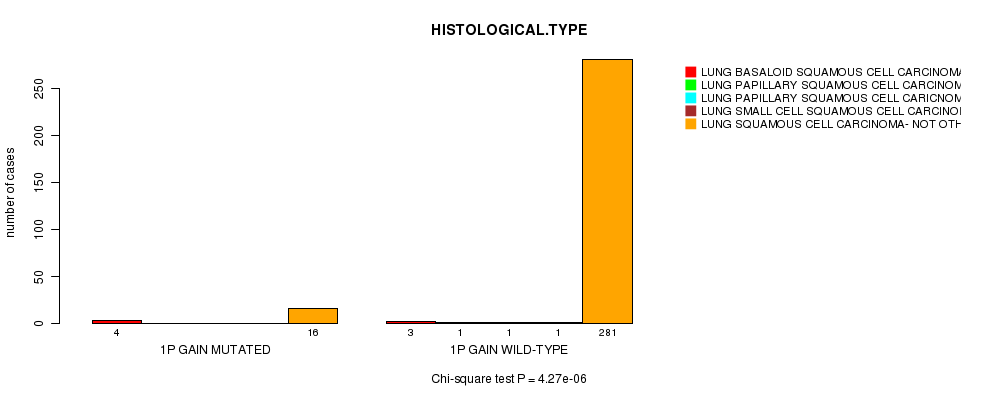
1p gain cnv correlated to 'HISTOLOGICAL.TYPE'.
-
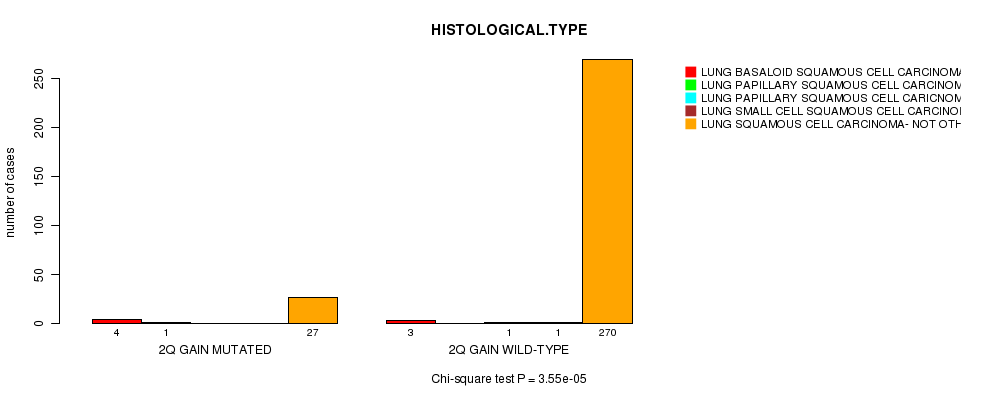
2q gain cnv correlated to 'HISTOLOGICAL.TYPE'.
-
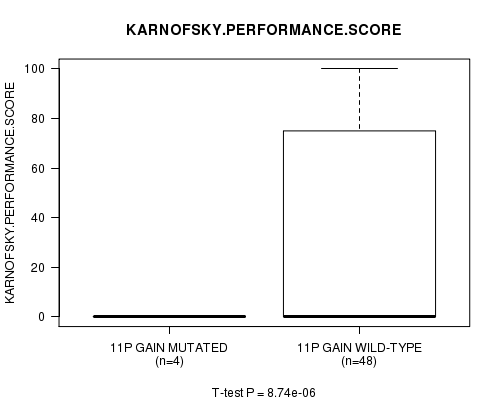
11p gain cnv correlated to 'KARNOFSKY.PERFORMANCE.SCORE'.
-
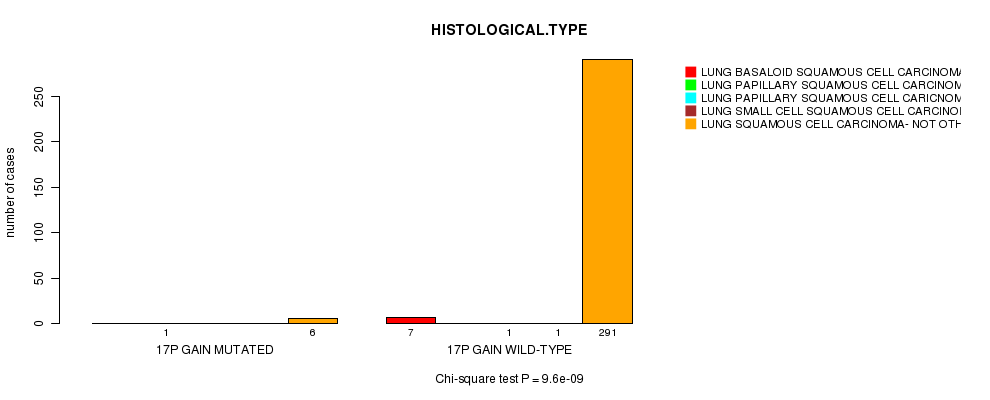
17p gain cnv correlated to 'HISTOLOGICAL.TYPE'.
-
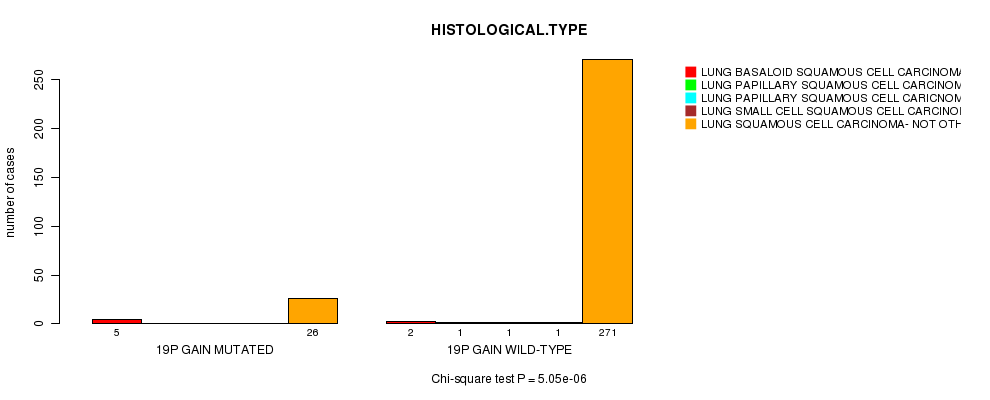
19p gain cnv correlated to 'KARNOFSKY.PERFORMANCE.SCORE' and 'HISTOLOGICAL.TYPE'.
-
21q gain cnv correlated to 'HISTOLOGICAL.TYPE'.
-
12p loss cnv correlated to 'HISTOLOGICAL.TYPE'.
-
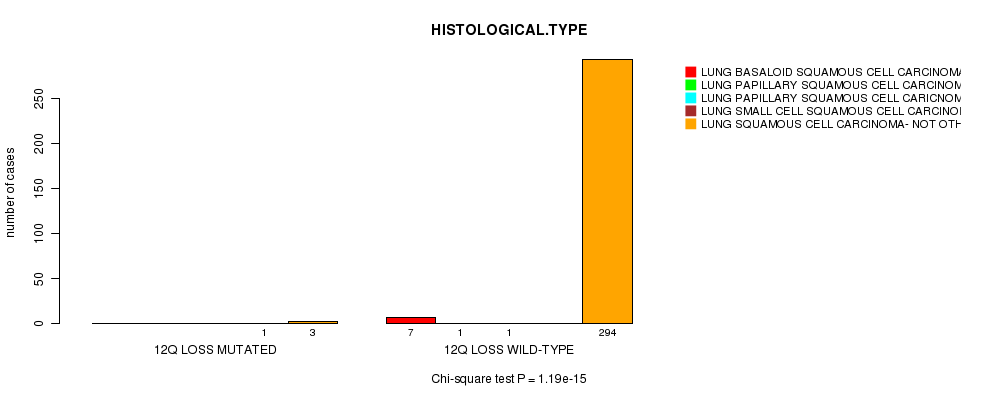
12q loss cnv correlated to 'HISTOLOGICAL.TYPE'.
-
16p loss cnv correlated to 'KARNOFSKY.PERFORMANCE.SCORE'.
-
16q loss cnv correlated to 'KARNOFSKY.PERFORMANCE.SCORE'.
-
17q loss cnv correlated to 'KARNOFSKY.PERFORMANCE.SCORE'.
-
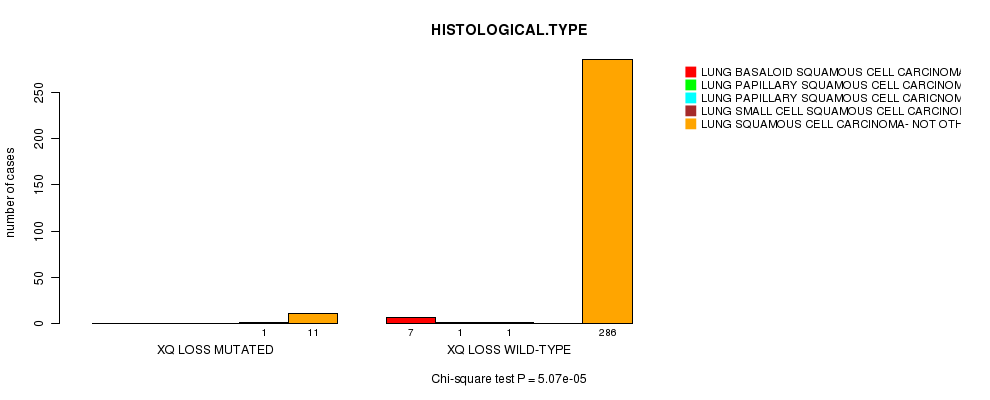
Xq loss cnv correlated to 'HISTOLOGICAL.TYPE'.
Table 1. Get Full Table Overview of the association between significant copy number variation of 79 arm-level results and 11 clinical features. Shown in the table are P values (Q values). Thresholded by Q value < 0.25, 13 significant findings detected.
|
Clinical Features |
Time to Death |
AGE | GENDER |
KARNOFSKY PERFORMANCE SCORE |
HISTOLOGICAL TYPE |
PATHOLOGY T |
PATHOLOGY N |
PATHOLOGICSPREAD(M) |
TUMOR STAGE |
RADIATIONS RADIATION REGIMENINDICATION |
NEOADJUVANT THERAPY |
||
| nCNV (%) | nWild-Type | logrank test | t-test | Fisher's exact test | t-test | Chi-square test | Fisher's exact test | Fisher's exact test | Fisher's exact test | Fisher's exact test | Fisher's exact test | Fisher's exact test | |
| 19p gain | 31 (10%) | 276 |
0.542 (1.00) |
0.414 (1.00) |
0.829 (1.00) |
7.92e-06 (0.00673) |
5.05e-06 (0.0043) |
0.699 (1.00) |
0.391 (1.00) |
0.667 (1.00) |
0.588 (1.00) |
0.307 (1.00) |
1 (1.00) |
| 1p gain | 20 (7%) | 287 |
0.875 (1.00) |
0.592 (1.00) |
0.185 (1.00) |
4.27e-06 (0.00364) |
0.108 (1.00) |
0.83 (1.00) |
0.306 (1.00) |
0.244 (1.00) |
0.529 (1.00) |
0.418 (1.00) |
|
| 2q gain | 32 (10%) | 275 |
0.222 (1.00) |
0.838 (1.00) |
1 (1.00) |
0.95 (1.00) |
3.55e-05 (0.03) |
0.222 (1.00) |
0.59 (1.00) |
0.31 (1.00) |
0.00867 (1.00) |
0.0952 (1.00) |
0.523 (1.00) |
| 11p gain | 17 (6%) | 290 |
0.979 (1.00) |
0.484 (1.00) |
0.255 (1.00) |
8.74e-06 (0.00741) |
0.962 (1.00) |
0.00195 (1.00) |
0.439 (1.00) |
1 (1.00) |
0.584 (1.00) |
0.471 (1.00) |
0.668 (1.00) |
| 17p gain | 7 (2%) | 300 |
0.369 (1.00) |
0.283 (1.00) |
0.196 (1.00) |
9.6e-09 (8.19e-06) |
0.249 (1.00) |
0.367 (1.00) |
0.524 (1.00) |
0.0542 (1.00) |
1 (1.00) |
1 (1.00) |
|
| 21q gain | 18 (6%) | 289 |
0.26 (1.00) |
0.65 (1.00) |
1 (1.00) |
0.996 (1.00) |
0.000122 (0.103) |
0.285 (1.00) |
0.26 (1.00) |
0.711 (1.00) |
0.188 (1.00) |
0.491 (1.00) |
0.0189 (1.00) |
| 12p loss | 5 (2%) | 302 |
0.529 (1.00) |
0.00239 (1.00) |
0.608 (1.00) |
2.07e-12 (1.77e-09) |
0.162 (1.00) |
0.791 (1.00) |
0.411 (1.00) |
0.378 (1.00) |
1 (1.00) |
0.393 (1.00) |
|
| 12q loss | 4 (1%) | 303 |
0.882 (1.00) |
0.2 (1.00) |
0.279 (1.00) |
1.19e-15 (1.01e-12) |
0.186 (1.00) |
0.555 (1.00) |
0.344 (1.00) |
0.292 (1.00) |
1 (1.00) |
0.329 (1.00) |
|
| 16p loss | 45 (15%) | 262 |
0.221 (1.00) |
0.374 (1.00) |
0.856 (1.00) |
8.74e-06 (0.00741) |
0.777 (1.00) |
0.84 (1.00) |
0.685 (1.00) |
0.884 (1.00) |
0.952 (1.00) |
1 (1.00) |
0.278 (1.00) |
| 16q loss | 57 (19%) | 250 |
0.123 (1.00) |
0.0648 (1.00) |
0.182 (1.00) |
7.92e-06 (0.00673) |
0.67 (1.00) |
0.775 (1.00) |
0.352 (1.00) |
0.316 (1.00) |
0.685 (1.00) |
0.434 (1.00) |
0.62 (1.00) |
| 17q loss | 19 (6%) | 288 |
0.576 (1.00) |
0.225 (1.00) |
0.11 (1.00) |
8.74e-06 (0.00741) |
0.954 (1.00) |
0.438 (1.00) |
0.784 (1.00) |
0.0763 (1.00) |
0.26 (1.00) |
0.511 (1.00) |
0.697 (1.00) |
| Xq loss | 12 (4%) | 295 |
0.759 (1.00) |
0.125 (1.00) |
0.518 (1.00) |
5.07e-05 (0.0428) |
0.835 (1.00) |
0.109 (1.00) |
1 (1.00) |
0.607 (1.00) |
1 (1.00) |
0.0188 (1.00) |
|
| 1q gain | 64 (21%) | 243 |
0.611 (1.00) |
0.788 (1.00) |
1 (1.00) |
0.446 (1.00) |
0.00379 (1.00) |
0.158 (1.00) |
0.772 (1.00) |
0.164 (1.00) |
0.525 (1.00) |
1 (1.00) |
0.471 (1.00) |
| 2p gain | 73 (24%) | 234 |
0.592 (1.00) |
0.73 (1.00) |
0.0688 (1.00) |
0.198 (1.00) |
0.0121 (1.00) |
0.133 (1.00) |
0.121 (1.00) |
0.138 (1.00) |
0.121 (1.00) |
0.14 (1.00) |
0.171 (1.00) |
| 3p gain | 33 (11%) | 274 |
0.415 (1.00) |
0.0512 (1.00) |
0.147 (1.00) |
0.264 (1.00) |
0.978 (1.00) |
0.0552 (1.00) |
0.911 (1.00) |
0.476 (1.00) |
0.502 (1.00) |
1 (1.00) |
0.753 (1.00) |
| 3q gain | 136 (44%) | 171 |
0.662 (1.00) |
0.184 (1.00) |
0.897 (1.00) |
0.232 (1.00) |
0.345 (1.00) |
0.584 (1.00) |
0.905 (1.00) |
0.409 (1.00) |
0.688 (1.00) |
1 (1.00) |
0.0761 (1.00) |
| 4p gain | 11 (4%) | 296 |
0.964 (1.00) |
0.628 (1.00) |
0.0726 (1.00) |
0.796 (1.00) |
0.65 (1.00) |
0.0421 (1.00) |
0.833 (1.00) |
1 (1.00) |
0.683 (1.00) |
1 (1.00) |
0.608 (1.00) |
| 4q gain | 5 (2%) | 302 |
0.54 (1.00) |
0.501 (1.00) |
0.332 (1.00) |
0.126 (1.00) |
0.0339 (1.00) |
0.791 (1.00) |
1 (1.00) |
0.118 (1.00) |
1 (1.00) |
1 (1.00) |
|
| 5p gain | 141 (46%) | 166 |
0.482 (1.00) |
0.0936 (1.00) |
0.362 (1.00) |
0.693 (1.00) |
0.315 (1.00) |
0.0499 (1.00) |
0.558 (1.00) |
0.358 (1.00) |
0.695 (1.00) |
1 (1.00) |
0.846 (1.00) |
| 5q gain | 32 (10%) | 275 |
0.795 (1.00) |
0.443 (1.00) |
1 (1.00) |
0.523 (1.00) |
0.977 (1.00) |
0.929 (1.00) |
0.452 (1.00) |
0.383 (1.00) |
0.368 (1.00) |
0.321 (1.00) |
1 (1.00) |
| 6p gain | 29 (9%) | 278 |
0.746 (1.00) |
0.226 (1.00) |
0.826 (1.00) |
0.225 (1.00) |
0.0325 (1.00) |
0.106 (1.00) |
0.919 (1.00) |
0.291 (1.00) |
0.176 (1.00) |
0.279 (1.00) |
1 (1.00) |
| 6q gain | 16 (5%) | 291 |
0.786 (1.00) |
0.257 (1.00) |
1 (1.00) |
0.428 (1.00) |
0.000901 (0.757) |
0.623 (1.00) |
0.667 (1.00) |
1 (1.00) |
0.953 (1.00) |
0.451 (1.00) |
0.654 (1.00) |
| 7p gain | 84 (27%) | 223 |
0.3 (1.00) |
0.445 (1.00) |
0.663 (1.00) |
0.619 (1.00) |
0.74 (1.00) |
0.0109 (1.00) |
0.736 (1.00) |
0.324 (1.00) |
0.451 (1.00) |
0.733 (1.00) |
0.664 (1.00) |
| 7q gain | 81 (26%) | 226 |
0.45 (1.00) |
0.695 (1.00) |
0.381 (1.00) |
0.333 (1.00) |
0.474 (1.00) |
0.0251 (1.00) |
0.759 (1.00) |
0.188 (1.00) |
0.323 (1.00) |
0.734 (1.00) |
0.828 (1.00) |
| 8p gain | 43 (14%) | 264 |
0.888 (1.00) |
0.456 (1.00) |
0.851 (1.00) |
0.0117 (1.00) |
0.1 (1.00) |
0.549 (1.00) |
0.707 (1.00) |
0.0987 (1.00) |
0.248 (1.00) |
0.189 (1.00) |
0.153 (1.00) |
| 8q gain | 85 (28%) | 222 |
0.365 (1.00) |
0.543 (1.00) |
0.564 (1.00) |
0.193 (1.00) |
0.884 (1.00) |
0.116 (1.00) |
0.732 (1.00) |
0.0843 (1.00) |
0.0469 (1.00) |
0.185 (1.00) |
0.389 (1.00) |
| 9p gain | 19 (6%) | 288 |
0.21 (1.00) |
0.688 (1.00) |
0.285 (1.00) |
0.00217 (1.00) |
0.569 (1.00) |
0.685 (1.00) |
1 (1.00) |
0.74 (1.00) |
1 (1.00) |
0.697 (1.00) |
|
| 9q gain | 28 (9%) | 279 |
0.189 (1.00) |
0.372 (1.00) |
0.822 (1.00) |
0.602 (1.00) |
0.471 (1.00) |
0.428 (1.00) |
0.779 (1.00) |
0.214 (1.00) |
0.653 (1.00) |
0.607 (1.00) |
0.319 (1.00) |
| 10p gain | 15 (5%) | 292 |
0.815 (1.00) |
0.977 (1.00) |
0.767 (1.00) |
0.852 (1.00) |
0.97 (1.00) |
0.351 (1.00) |
0.0949 (1.00) |
0.132 (1.00) |
0.0183 (1.00) |
0.429 (1.00) |
0.159 (1.00) |
| 10q gain | 6 (2%) | 301 |
0.353 (1.00) |
0.723 (1.00) |
1 (1.00) |
0.995 (1.00) |
0.494 (1.00) |
0.463 (1.00) |
1 (1.00) |
0.521 (1.00) |
0.198 (1.00) |
0.102 (1.00) |
|
| 11q gain | 20 (7%) | 287 |
0.713 (1.00) |
0.923 (1.00) |
0.302 (1.00) |
0.452 (1.00) |
0.923 (1.00) |
0.0294 (1.00) |
0.233 (1.00) |
0.531 (1.00) |
0.106 (1.00) |
0.529 (1.00) |
0.418 (1.00) |
| 12p gain | 85 (28%) | 222 |
0.805 (1.00) |
0.795 (1.00) |
0.00865 (1.00) |
0.368 (1.00) |
0.884 (1.00) |
0.0819 (1.00) |
0.76 (1.00) |
0.733 (1.00) |
0.861 (1.00) |
0.504 (1.00) |
0.197 (1.00) |
| 12q gain | 38 (12%) | 269 |
0.626 (1.00) |
0.512 (1.00) |
0.0737 (1.00) |
0.958 (1.00) |
0.978 (1.00) |
0.129 (1.00) |
0.156 (1.00) |
0.224 (1.00) |
0.227 (1.00) |
1 (1.00) |
0.148 (1.00) |
| 13q gain | 6 (2%) | 301 |
0.0979 (1.00) |
0.587 (1.00) |
1 (1.00) |
0.995 (1.00) |
0.151 (1.00) |
1 (1.00) |
0.47 (1.00) |
0.761 (1.00) |
1 (1.00) |
1 (1.00) |
|
| 14q gain | 31 (10%) | 276 |
0.0642 (1.00) |
0.0918 (1.00) |
0.517 (1.00) |
0.937 (1.00) |
0.976 (1.00) |
0.323 (1.00) |
0.696 (1.00) |
0.667 (1.00) |
0.939 (1.00) |
1 (1.00) |
0.192 (1.00) |
| 15q gain | 27 (9%) | 280 |
0.684 (1.00) |
0.808 (1.00) |
1 (1.00) |
0.365 (1.00) |
0.44 (1.00) |
0.676 (1.00) |
0.236 (1.00) |
0.649 (1.00) |
0.411 (1.00) |
1 (1.00) |
0.73 (1.00) |
| 16p gain | 14 (5%) | 293 |
0.203 (1.00) |
0.217 (1.00) |
0.533 (1.00) |
0.0584 (1.00) |
0.793 (1.00) |
0.0266 (1.00) |
0.542 (1.00) |
1 (1.00) |
0.431 (1.00) |
1 (1.00) |
0.377 (1.00) |
| 16q gain | 18 (6%) | 289 |
0.622 (1.00) |
0.0661 (1.00) |
0.173 (1.00) |
0.305 (1.00) |
0.958 (1.00) |
0.00784 (1.00) |
0.149 (1.00) |
0.267 (1.00) |
0.083 (1.00) |
1 (1.00) |
0.682 (1.00) |
| 17q gain | 33 (11%) | 274 |
0.513 (1.00) |
0.283 (1.00) |
0.0595 (1.00) |
0.326 (1.00) |
0.608 (1.00) |
0.616 (1.00) |
0.0203 (1.00) |
0.223 (1.00) |
0.0985 (1.00) |
0.335 (1.00) |
0.753 (1.00) |
| 18p gain | 50 (16%) | 257 |
0.162 (1.00) |
0.122 (1.00) |
0.217 (1.00) |
0.396 (1.00) |
0.851 (1.00) |
0.22 (1.00) |
0.0244 (1.00) |
0.161 (1.00) |
0.242 (1.00) |
0.696 (1.00) |
0.441 (1.00) |
| 18q gain | 36 (12%) | 271 |
0.385 (1.00) |
0.406 (1.00) |
0.546 (1.00) |
0.639 (1.00) |
0.674 (1.00) |
0.309 (1.00) |
0.0983 (1.00) |
0.515 (1.00) |
0.824 (1.00) |
0.625 (1.00) |
0.359 (1.00) |
| 19q gain | 45 (15%) | 262 |
0.755 (1.00) |
0.769 (1.00) |
1 (1.00) |
0.183 (1.00) |
0.000827 (0.696) |
0.915 (1.00) |
0.144 (1.00) |
0.109 (1.00) |
0.0725 (1.00) |
0.667 (1.00) |
0.404 (1.00) |
| 20p gain | 86 (28%) | 221 |
0.812 (1.00) |
0.0757 (1.00) |
0.042 (1.00) |
0.19 (1.00) |
0.173 (1.00) |
0.953 (1.00) |
0.74 (1.00) |
0.0843 (1.00) |
0.186 (1.00) |
0.19 (1.00) |
0.67 (1.00) |
| 20q gain | 74 (24%) | 233 |
0.714 (1.00) |
0.209 (1.00) |
0.129 (1.00) |
0.764 (1.00) |
0.0135 (1.00) |
0.891 (1.00) |
0.529 (1.00) |
0.064 (1.00) |
0.105 (1.00) |
0.142 (1.00) |
0.82 (1.00) |
| 22q gain | 72 (23%) | 235 |
0.0866 (1.00) |
0.359 (1.00) |
0.285 (1.00) |
0.674 (1.00) |
0.906 (1.00) |
0.134 (1.00) |
0.665 (1.00) |
0.844 (1.00) |
0.39 (1.00) |
0.724 (1.00) |
0.821 (1.00) |
| Xq gain | 9 (3%) | 298 |
0.903 (1.00) |
0.272 (1.00) |
1 (1.00) |
0.952 (1.00) |
0.989 (1.00) |
0.458 (1.00) |
0.897 (1.00) |
0.617 (1.00) |
0.593 (1.00) |
1 (1.00) |
0.205 (1.00) |
| 1p loss | 46 (15%) | 261 |
0.532 (1.00) |
0.702 (1.00) |
0.00311 (1.00) |
0.541 (1.00) |
0.122 (1.00) |
0.302 (1.00) |
0.494 (1.00) |
0.216 (1.00) |
0.37 (1.00) |
0.218 (1.00) |
1 (1.00) |
| 1q loss | 9 (3%) | 298 |
0.701 (1.00) |
0.258 (1.00) |
0.455 (1.00) |
0.989 (1.00) |
0.349 (1.00) |
0.699 (1.00) |
0.617 (1.00) |
0.916 (1.00) |
0.283 (1.00) |
1 (1.00) |
|
| 2q loss | 8 (3%) | 299 |
0.0522 (1.00) |
0.0748 (1.00) |
1 (1.00) |
0.991 (1.00) |
0.535 (1.00) |
0.66 (1.00) |
1 (1.00) |
0.61 (1.00) |
1 (1.00) |
0.552 (1.00) |
|
| 3p loss | 136 (44%) | 171 |
0.383 (1.00) |
0.141 (1.00) |
0.897 (1.00) |
0.116 (1.00) |
0.404 (1.00) |
0.985 (1.00) |
0.918 (1.00) |
0.883 (1.00) |
0.949 (1.00) |
0.546 (1.00) |
0.242 (1.00) |
| 3q loss | 27 (9%) | 280 |
0.593 (1.00) |
0.273 (1.00) |
1 (1.00) |
0.745 (1.00) |
0.024 (1.00) |
0.445 (1.00) |
0.0973 (1.00) |
0.214 (1.00) |
0.18 (1.00) |
0.607 (1.00) |
0.303 (1.00) |
| 4p loss | 130 (42%) | 177 |
0.152 (1.00) |
0.714 (1.00) |
1 (1.00) |
0.227 (1.00) |
0.406 (1.00) |
0.389 (1.00) |
0.322 (1.00) |
0.257 (1.00) |
0.054 (1.00) |
1 (1.00) |
0.326 (1.00) |
| 4q loss | 112 (36%) | 195 |
0.118 (1.00) |
0.619 (1.00) |
0.137 (1.00) |
0.0968 (1.00) |
0.235 (1.00) |
0.57 (1.00) |
0.859 (1.00) |
0.204 (1.00) |
0.156 (1.00) |
0.538 (1.00) |
0.223 (1.00) |
| 5p loss | 19 (6%) | 288 |
0.0297 (1.00) |
0.301 (1.00) |
0.42 (1.00) |
0.787 (1.00) |
0.00336 (1.00) |
0.184 (1.00) |
0.376 (1.00) |
0.737 (1.00) |
0.503 (1.00) |
0.143 (1.00) |
0.0915 (1.00) |
| 5q loss | 112 (36%) | 195 |
0.148 (1.00) |
0.838 (1.00) |
0.591 (1.00) |
0.285 (1.00) |
0.235 (1.00) |
0.0229 (1.00) |
0.33 (1.00) |
0.28 (1.00) |
0.00761 (1.00) |
0.538 (1.00) |
0.551 (1.00) |
| 6p loss | 33 (11%) | 274 |
0.446 (1.00) |
0.416 (1.00) |
0.147 (1.00) |
0.939 (1.00) |
0.0267 (1.00) |
0.0428 (1.00) |
0.375 (1.00) |
0.692 (1.00) |
0.0886 (1.00) |
0.615 (1.00) |
0.533 (1.00) |
| 6q loss | 35 (11%) | 272 |
0.86 (1.00) |
0.65 (1.00) |
0.687 (1.00) |
0.696 (1.00) |
0.0374 (1.00) |
0.0904 (1.00) |
0.254 (1.00) |
0.712 (1.00) |
0.278 (1.00) |
0.621 (1.00) |
0.552 (1.00) |
| 7p loss | 19 (6%) | 288 |
0.73 (1.00) |
0.503 (1.00) |
0.789 (1.00) |
0.861 (1.00) |
0.954 (1.00) |
0.33 (1.00) |
0.202 (1.00) |
1 (1.00) |
0.587 (1.00) |
0.511 (1.00) |
1 (1.00) |
| 7q loss | 11 (4%) | 296 |
0.637 (1.00) |
0.936 (1.00) |
0.734 (1.00) |
0.984 (1.00) |
0.0893 (1.00) |
0.479 (1.00) |
1 (1.00) |
0.759 (1.00) |
0.335 (1.00) |
0.608 (1.00) |
|
| 8p loss | 93 (30%) | 214 |
0.521 (1.00) |
0.227 (1.00) |
0.573 (1.00) |
0.436 (1.00) |
0.856 (1.00) |
0.184 (1.00) |
0.719 (1.00) |
0.316 (1.00) |
0.696 (1.00) |
0.183 (1.00) |
0.529 (1.00) |
| 8q loss | 9 (3%) | 298 |
0.489 (1.00) |
0.672 (1.00) |
0.455 (1.00) |
0.428 (1.00) |
0.506 (1.00) |
0.764 (1.00) |
0.797 (1.00) |
1 (1.00) |
1 (1.00) |
1 (1.00) |
0.205 (1.00) |
| 9p loss | 125 (41%) | 182 |
0.62 (1.00) |
0.294 (1.00) |
0.358 (1.00) |
0.0888 (1.00) |
0.402 (1.00) |
0.788 (1.00) |
0.466 (1.00) |
0.68 (1.00) |
0.669 (1.00) |
0.763 (1.00) |
0.554 (1.00) |
| 9q loss | 78 (25%) | 229 |
0.986 (1.00) |
0.00378 (1.00) |
0.552 (1.00) |
0.527 (1.00) |
0.154 (1.00) |
0.357 (1.00) |
0.624 (1.00) |
0.57 (1.00) |
0.511 (1.00) |
1 (1.00) |
0.823 (1.00) |
| 10p loss | 66 (21%) | 241 |
0.501 (1.00) |
0.767 (1.00) |
0.208 (1.00) |
0.896 (1.00) |
0.352 (1.00) |
0.708 (1.00) |
0.165 (1.00) |
0.374 (1.00) |
0.158 (1.00) |
0.129 (1.00) |
0.643 (1.00) |
| 10q loss | 66 (21%) | 241 |
0.428 (1.00) |
0.818 (1.00) |
0.754 (1.00) |
0.708 (1.00) |
0.353 (1.00) |
0.899 (1.00) |
0.596 (1.00) |
0.403 (1.00) |
0.132 (1.00) |
0.129 (1.00) |
0.35 (1.00) |
| 11p loss | 47 (15%) | 260 |
0.385 (1.00) |
0.428 (1.00) |
0.721 (1.00) |
0.62 (1.00) |
0.206 (1.00) |
0.587 (1.00) |
0.492 (1.00) |
0.336 (1.00) |
0.825 (1.00) |
0.384 (1.00) |
0.786 (1.00) |
| 11q loss | 30 (10%) | 277 |
0.818 (1.00) |
0.0342 (1.00) |
0.516 (1.00) |
0.915 (1.00) |
0.891 (1.00) |
0.584 (1.00) |
0.239 (1.00) |
0.813 (1.00) |
0.676 (1.00) |
0.293 (1.00) |
0.0925 (1.00) |
| 13q loss | 116 (38%) | 191 |
0.0143 (1.00) |
0.712 (1.00) |
0.503 (1.00) |
0.135 (1.00) |
0.337 (1.00) |
0.977 (1.00) |
0.133 (1.00) |
0.396 (1.00) |
0.0227 (1.00) |
0.753 (1.00) |
0.426 (1.00) |
| 14q loss | 54 (18%) | 253 |
0.132 (1.00) |
0.123 (1.00) |
0.0256 (1.00) |
0.316 (1.00) |
0.157 (1.00) |
0.0252 (1.00) |
0.179 (1.00) |
0.653 (1.00) |
0.451 (1.00) |
0.416 (1.00) |
1 (1.00) |
| 15q loss | 36 (12%) | 271 |
0.787 (1.00) |
0.367 (1.00) |
0.0704 (1.00) |
0.446 (1.00) |
0.0684 (1.00) |
0.0953 (1.00) |
0.0264 (1.00) |
0.604 (1.00) |
0.00948 (1.00) |
1 (1.00) |
1 (1.00) |
| 17p loss | 111 (36%) | 196 |
0.334 (1.00) |
0.794 (1.00) |
0.59 (1.00) |
0.0191 (1.00) |
0.552 (1.00) |
0.425 (1.00) |
0.193 (1.00) |
0.469 (1.00) |
0.941 (1.00) |
0.534 (1.00) |
0.841 (1.00) |
| 18p loss | 30 (10%) | 277 |
0.385 (1.00) |
0.843 (1.00) |
0.516 (1.00) |
0.618 (1.00) |
0.891 (1.00) |
0.824 (1.00) |
0.196 (1.00) |
0.358 (1.00) |
0.171 (1.00) |
0.609 (1.00) |
0.752 (1.00) |
| 18q loss | 60 (20%) | 247 |
0.674 (1.00) |
0.0629 (1.00) |
0.0721 (1.00) |
0.527 (1.00) |
0.317 (1.00) |
0.294 (1.00) |
0.853 (1.00) |
0.412 (1.00) |
0.923 (1.00) |
0.698 (1.00) |
1 (1.00) |
| 19p loss | 50 (16%) | 257 |
0.0635 (1.00) |
0.964 (1.00) |
1 (1.00) |
0.0806 (1.00) |
0.141 (1.00) |
0.432 (1.00) |
0.133 (1.00) |
0.359 (1.00) |
0.202 (1.00) |
0.0202 (1.00) |
0.286 (1.00) |
| 19q loss | 33 (11%) | 274 |
0.445 (1.00) |
0.305 (1.00) |
0.836 (1.00) |
0.405 (1.00) |
0.00148 (1.00) |
0.769 (1.00) |
0.317 (1.00) |
0.683 (1.00) |
0.826 (1.00) |
0.103 (1.00) |
1 (1.00) |
| 20p loss | 15 (5%) | 292 |
0.0775 (1.00) |
0.684 (1.00) |
0.767 (1.00) |
0.97 (1.00) |
0.683 (1.00) |
0.434 (1.00) |
0.698 (1.00) |
0.0894 (1.00) |
1 (1.00) |
1 (1.00) |
|
| 20q loss | 16 (5%) | 291 |
0.378 (1.00) |
0.695 (1.00) |
0.77 (1.00) |
0.967 (1.00) |
0.861 (1.00) |
0.426 (1.00) |
0.711 (1.00) |
0.693 (1.00) |
1 (1.00) |
1 (1.00) |
|
| 21q loss | 97 (32%) | 210 |
0.424 (1.00) |
0.326 (1.00) |
0.0115 (1.00) |
0.747 (1.00) |
0.538 (1.00) |
0.534 (1.00) |
0.806 (1.00) |
0.107 (1.00) |
0.215 (1.00) |
0.747 (1.00) |
0.409 (1.00) |
| 22q loss | 32 (10%) | 275 |
0.657 (1.00) |
0.152 (1.00) |
0.0563 (1.00) |
0.275 (1.00) |
0.00151 (1.00) |
0.268 (1.00) |
0.000381 (0.321) |
0.397 (1.00) |
0.00277 (1.00) |
1 (1.00) |
0.523 (1.00) |
P value = 4.27e-06 (Chi-square test), Q value = 0.0036
Table S1. Gene #1: '1p gain mutation analysis' versus Clinical Feature #5: 'HISTOLOGICAL.TYPE'
| nPatients | LUNG BASALOID SQUAMOUS CELL CARCINOMA | LUNG PAPILLARY SQUAMOUS CELL CARCINOMA | LUNG PAPILLARY SQUAMOUS CELL CARICNOMA | LUNG SMALL CELL SQUAMOUS CELL CARCINOMA | LUNG SQUAMOUS CELL CARCINOMA- NOT OTHERWISE SPECIFIED (NOS) |
|---|---|---|---|---|---|
| ALL | 7 | 1 | 1 | 1 | 297 |
| 1P GAIN MUTATED | 4 | 0 | 0 | 0 | 16 |
| 1P GAIN WILD-TYPE | 3 | 1 | 1 | 1 | 281 |
Figure S1. Get High-res Image Gene #1: '1p gain mutation analysis' versus Clinical Feature #5: 'HISTOLOGICAL.TYPE'
P value = 3.55e-05 (Chi-square test), Q value = 0.03
Table S2. Gene #4: '2q gain mutation analysis' versus Clinical Feature #5: 'HISTOLOGICAL.TYPE'
| nPatients | LUNG BASALOID SQUAMOUS CELL CARCINOMA | LUNG PAPILLARY SQUAMOUS CELL CARCINOMA | LUNG PAPILLARY SQUAMOUS CELL CARICNOMA | LUNG SMALL CELL SQUAMOUS CELL CARCINOMA | LUNG SQUAMOUS CELL CARCINOMA- NOT OTHERWISE SPECIFIED (NOS) |
|---|---|---|---|---|---|
| ALL | 7 | 1 | 1 | 1 | 297 |
| 2Q GAIN MUTATED | 4 | 1 | 0 | 0 | 27 |
| 2Q GAIN WILD-TYPE | 3 | 0 | 1 | 1 | 270 |
Figure S2. Get High-res Image Gene #4: '2q gain mutation analysis' versus Clinical Feature #5: 'HISTOLOGICAL.TYPE'
P value = 8.74e-06 (t-test), Q value = 0.0074
Table S3. Gene #21: '11p gain mutation analysis' versus Clinical Feature #4: 'KARNOFSKY.PERFORMANCE.SCORE'
| nPatients | Mean (Std.Dev) | |
|---|---|---|
| ALL | 52 | 26.5 (39.1) |
| 11P GAIN MUTATED | 4 | 0.0 (0.0) |
| 11P GAIN WILD-TYPE | 48 | 28.8 (39.9) |
Figure S3. Get High-res Image Gene #21: '11p gain mutation analysis' versus Clinical Feature #4: 'KARNOFSKY.PERFORMANCE.SCORE'
P value = 9.6e-09 (Chi-square test), Q value = 8.2e-06
Table S4. Gene #30: '17p gain mutation analysis' versus Clinical Feature #5: 'HISTOLOGICAL.TYPE'
| nPatients | LUNG BASALOID SQUAMOUS CELL CARCINOMA | LUNG PAPILLARY SQUAMOUS CELL CARCINOMA | LUNG PAPILLARY SQUAMOUS CELL CARICNOMA | LUNG SMALL CELL SQUAMOUS CELL CARCINOMA | LUNG SQUAMOUS CELL CARCINOMA- NOT OTHERWISE SPECIFIED (NOS) |
|---|---|---|---|---|---|
| ALL | 7 | 1 | 1 | 1 | 297 |
| 17P GAIN MUTATED | 0 | 1 | 0 | 0 | 6 |
| 17P GAIN WILD-TYPE | 7 | 0 | 1 | 1 | 291 |
Figure S4. Get High-res Image Gene #30: '17p gain mutation analysis' versus Clinical Feature #5: 'HISTOLOGICAL.TYPE'
P value = 7.92e-06 (t-test), Q value = 0.0067
Table S5. Gene #34: '19p gain mutation analysis' versus Clinical Feature #4: 'KARNOFSKY.PERFORMANCE.SCORE'
| nPatients | Mean (Std.Dev) | |
|---|---|---|
| ALL | 52 | 26.5 (39.1) |
| 19P GAIN MUTATED | 6 | 0.0 (0.0) |
| 19P GAIN WILD-TYPE | 46 | 30.0 (40.3) |
Figure S5. Get High-res Image Gene #34: '19p gain mutation analysis' versus Clinical Feature #4: 'KARNOFSKY.PERFORMANCE.SCORE'

P value = 5.05e-06 (Chi-square test), Q value = 0.0043
Table S6. Gene #34: '19p gain mutation analysis' versus Clinical Feature #5: 'HISTOLOGICAL.TYPE'
| nPatients | LUNG BASALOID SQUAMOUS CELL CARCINOMA | LUNG PAPILLARY SQUAMOUS CELL CARCINOMA | LUNG PAPILLARY SQUAMOUS CELL CARICNOMA | LUNG SMALL CELL SQUAMOUS CELL CARCINOMA | LUNG SQUAMOUS CELL CARCINOMA- NOT OTHERWISE SPECIFIED (NOS) |
|---|---|---|---|---|---|
| ALL | 7 | 1 | 1 | 1 | 297 |
| 19P GAIN MUTATED | 5 | 0 | 0 | 0 | 26 |
| 19P GAIN WILD-TYPE | 2 | 1 | 1 | 1 | 271 |
Figure S6. Get High-res Image Gene #34: '19p gain mutation analysis' versus Clinical Feature #5: 'HISTOLOGICAL.TYPE'
P value = 0.000122 (Chi-square test), Q value = 0.1
Table S7. Gene #38: '21q gain mutation analysis' versus Clinical Feature #5: 'HISTOLOGICAL.TYPE'
| nPatients | LUNG BASALOID SQUAMOUS CELL CARCINOMA | LUNG PAPILLARY SQUAMOUS CELL CARCINOMA | LUNG PAPILLARY SQUAMOUS CELL CARICNOMA | LUNG SMALL CELL SQUAMOUS CELL CARCINOMA | LUNG SQUAMOUS CELL CARCINOMA- NOT OTHERWISE SPECIFIED (NOS) |
|---|---|---|---|---|---|
| ALL | 7 | 1 | 1 | 1 | 297 |
| 21Q GAIN MUTATED | 2 | 0 | 0 | 1 | 15 |
| 21Q GAIN WILD-TYPE | 5 | 1 | 1 | 0 | 282 |
Figure S7. Get High-res Image Gene #38: '21q gain mutation analysis' versus Clinical Feature #5: 'HISTOLOGICAL.TYPE'

P value = 2.07e-12 (Chi-square test), Q value = 1.8e-09
Table S8. Gene #62: '12p loss mutation analysis' versus Clinical Feature #5: 'HISTOLOGICAL.TYPE'
| nPatients | LUNG BASALOID SQUAMOUS CELL CARCINOMA | LUNG PAPILLARY SQUAMOUS CELL CARCINOMA | LUNG PAPILLARY SQUAMOUS CELL CARICNOMA | LUNG SMALL CELL SQUAMOUS CELL CARCINOMA | LUNG SQUAMOUS CELL CARCINOMA- NOT OTHERWISE SPECIFIED (NOS) |
|---|---|---|---|---|---|
| ALL | 7 | 1 | 1 | 1 | 297 |
| 12P LOSS MUTATED | 0 | 0 | 0 | 1 | 4 |
| 12P LOSS WILD-TYPE | 7 | 1 | 1 | 0 | 293 |
Figure S8. Get High-res Image Gene #62: '12p loss mutation analysis' versus Clinical Feature #5: 'HISTOLOGICAL.TYPE'

P value = 1.19e-15 (Chi-square test), Q value = 1e-12
Table S9. Gene #63: '12q loss mutation analysis' versus Clinical Feature #5: 'HISTOLOGICAL.TYPE'
| nPatients | LUNG BASALOID SQUAMOUS CELL CARCINOMA | LUNG PAPILLARY SQUAMOUS CELL CARCINOMA | LUNG PAPILLARY SQUAMOUS CELL CARICNOMA | LUNG SMALL CELL SQUAMOUS CELL CARCINOMA | LUNG SQUAMOUS CELL CARCINOMA- NOT OTHERWISE SPECIFIED (NOS) |
|---|---|---|---|---|---|
| ALL | 7 | 1 | 1 | 1 | 297 |
| 12Q LOSS MUTATED | 0 | 0 | 0 | 1 | 3 |
| 12Q LOSS WILD-TYPE | 7 | 1 | 1 | 0 | 294 |
Figure S9. Get High-res Image Gene #63: '12q loss mutation analysis' versus Clinical Feature #5: 'HISTOLOGICAL.TYPE'
P value = 8.74e-06 (t-test), Q value = 0.0074
Table S10. Gene #67: '16p loss mutation analysis' versus Clinical Feature #4: 'KARNOFSKY.PERFORMANCE.SCORE'
| nPatients | Mean (Std.Dev) | |
|---|---|---|
| ALL | 52 | 26.5 (39.1) |
| 16P LOSS MUTATED | 4 | 0.0 (0.0) |
| 16P LOSS WILD-TYPE | 48 | 28.8 (39.9) |
Figure S10. Get High-res Image Gene #67: '16p loss mutation analysis' versus Clinical Feature #4: 'KARNOFSKY.PERFORMANCE.SCORE'

P value = 7.92e-06 (t-test), Q value = 0.0067
Table S11. Gene #68: '16q loss mutation analysis' versus Clinical Feature #4: 'KARNOFSKY.PERFORMANCE.SCORE'
| nPatients | Mean (Std.Dev) | |
|---|---|---|
| ALL | 52 | 26.5 (39.1) |
| 16Q LOSS MUTATED | 6 | 0.0 (0.0) |
| 16Q LOSS WILD-TYPE | 46 | 30.0 (40.3) |
Figure S11. Get High-res Image Gene #68: '16q loss mutation analysis' versus Clinical Feature #4: 'KARNOFSKY.PERFORMANCE.SCORE'

P value = 8.74e-06 (t-test), Q value = 0.0074
Table S12. Gene #70: '17q loss mutation analysis' versus Clinical Feature #4: 'KARNOFSKY.PERFORMANCE.SCORE'
| nPatients | Mean (Std.Dev) | |
|---|---|---|
| ALL | 52 | 26.5 (39.1) |
| 17Q LOSS MUTATED | 4 | 0.0 (0.0) |
| 17Q LOSS WILD-TYPE | 48 | 28.8 (39.9) |
Figure S12. Get High-res Image Gene #70: '17q loss mutation analysis' versus Clinical Feature #4: 'KARNOFSKY.PERFORMANCE.SCORE'

P value = 5.07e-05 (Chi-square test), Q value = 0.043
Table S13. Gene #79: 'Xq loss mutation analysis' versus Clinical Feature #5: 'HISTOLOGICAL.TYPE'
| nPatients | LUNG BASALOID SQUAMOUS CELL CARCINOMA | LUNG PAPILLARY SQUAMOUS CELL CARCINOMA | LUNG PAPILLARY SQUAMOUS CELL CARICNOMA | LUNG SMALL CELL SQUAMOUS CELL CARCINOMA | LUNG SQUAMOUS CELL CARCINOMA- NOT OTHERWISE SPECIFIED (NOS) |
|---|---|---|---|---|---|
| ALL | 7 | 1 | 1 | 1 | 297 |
| XQ LOSS MUTATED | 0 | 0 | 0 | 1 | 11 |
| XQ LOSS WILD-TYPE | 7 | 1 | 1 | 0 | 286 |
Figure S13. Get High-res Image Gene #79: 'Xq loss mutation analysis' versus Clinical Feature #5: 'HISTOLOGICAL.TYPE'
-
Mutation data file = broad_values_by_arm.mutsig.cluster.txt
-
Clinical data file = LUSC.clin.merged.picked.txt
-
Number of patients = 307
-
Number of significantly arm-level cnvs = 79
-
Number of selected clinical features = 11
-
Exclude genes that fewer than K tumors have mutations, K = 3
For survival clinical features, the Kaplan-Meier survival curves of tumors with and without gene mutations were plotted and the statistical significance P values were estimated by logrank test (Bland and Altman 2004) using the 'survdiff' function in R
For continuous numerical clinical features, two-tailed Student's t test with unequal variance (Lehmann and Romano 2005) was applied to compare the clinical values between tumors with and without gene mutations using 't.test' function in R
For binary or multi-class clinical features (nominal or ordinal), two-tailed Fisher's exact tests (Fisher 1922) were used to estimate the P values using the 'fisher.test' function in R
For multi-class clinical features (nominal or ordinal), Chi-square tests (Greenwood and Nikulin 1996) were used to estimate the P values using the 'chisq.test' function in R
For multiple hypothesis correction, Q value is the False Discovery Rate (FDR) analogue of the P value (Benjamini and Hochberg 1995), defined as the minimum FDR at which the test may be called significant. We used the 'Benjamini and Hochberg' method of 'p.adjust' function in R to convert P values into Q values.
This is an experimental feature. The full results of the analysis summarized in this report can be downloaded from the TCGA Data Coordination Center.