This pipeline computes the correlation between significant arm-level copy number variations (cnvs) and selected clinical features.
Testing the association between copy number variation 73 arm-level results and 7 clinical features across 105 patients, 2 significant findings detected with Q value < 0.25.
-
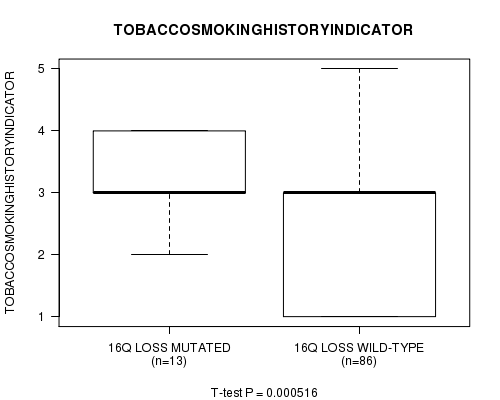
16q loss cnv correlated to 'TOBACCOSMOKINGHISTORYINDICATOR'.
-
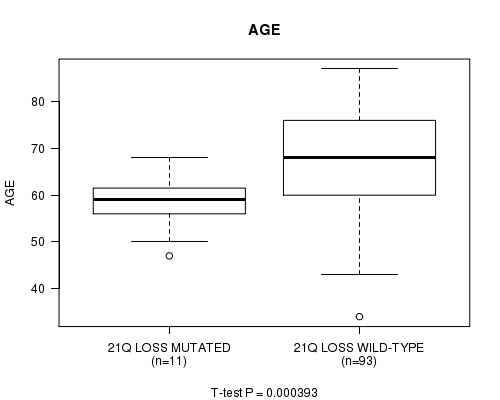
21q loss cnv correlated to 'AGE'.
Table 1. Get Full Table Overview of the association between significant copy number variation of 73 arm-level results and 7 clinical features. Shown in the table are P values (Q values). Thresholded by Q value < 0.25, 2 significant findings detected.
|
Clinical Features |
Time to Death |
AGE | GENDER |
KARNOFSKY PERFORMANCE SCORE |
NUMBERPACKYEARSSMOKED | STOPPEDSMOKINGYEAR | TOBACCOSMOKINGHISTORYINDICATOR | ||
| nCNV (%) | nWild-Type | logrank test | t-test | Fisher's exact test | t-test | t-test | t-test | t-test | |
| 16q loss | 13 (12%) | 92 |
0.817 (1.00) |
0.455 (1.00) |
0.508 (1.00) |
0.288 (1.00) |
0.782 (1.00) |
0.236 (1.00) |
0.000516 (0.247) |
| 21q loss | 11 (10%) | 94 |
0.593 (1.00) |
0.000393 (0.189) |
1 (1.00) |
0.00182 (0.868) |
0.823 (1.00) |
0.191 (1.00) |
0.72 (1.00) |
| 1p gain | 12 (11%) | 93 |
0.134 (1.00) |
0.319 (1.00) |
1 (1.00) |
0.293 (1.00) |
0.539 (1.00) |
0.562 (1.00) |
0.179 (1.00) |
| 1q gain | 21 (20%) | 84 |
0.0246 (1.00) |
0.0153 (1.00) |
1 (1.00) |
0.145 (1.00) |
0.684 (1.00) |
0.0998 (1.00) |
0.0246 (1.00) |
| 2p gain | 22 (21%) | 83 |
0.347 (1.00) |
0.787 (1.00) |
0.000762 (0.365) |
0.35 (1.00) |
0.74 (1.00) |
0.0109 (1.00) |
0.625 (1.00) |
| 2q gain | 8 (8%) | 97 |
0.593 (1.00) |
0.38 (1.00) |
0.682 (1.00) |
0.562 (1.00) |
0.456 (1.00) |
0.00232 (1.00) |
0.599 (1.00) |
| 3p gain | 22 (21%) | 83 |
0.419 (1.00) |
0.697 (1.00) |
0.299 (1.00) |
0.581 (1.00) |
0.656 (1.00) |
0.794 (1.00) |
0.926 (1.00) |
| 3q gain | 30 (29%) | 75 |
0.125 (1.00) |
0.0584 (1.00) |
0.229 (1.00) |
0.95 (1.00) |
0.677 (1.00) |
0.347 (1.00) |
0.88 (1.00) |
| 4p gain | 8 (8%) | 97 |
0.0655 (1.00) |
0.899 (1.00) |
0.44 (1.00) |
0.272 (1.00) |
0.998 (1.00) |
0.639 (1.00) |
|
| 4q gain | 3 (3%) | 102 |
0.288 (1.00) |
0.482 (1.00) |
1 (1.00) |
0.228 (1.00) |
0.915 (1.00) |
||
| 5p gain | 31 (30%) | 74 |
0.627 (1.00) |
0.151 (1.00) |
0.633 (1.00) |
0.0478 (1.00) |
0.67 (1.00) |
0.501 (1.00) |
0.572 (1.00) |
| 5q gain | 14 (13%) | 91 |
0.301 (1.00) |
0.256 (1.00) |
0.34 (1.00) |
0.306 (1.00) |
0.616 (1.00) |
0.538 (1.00) |
0.703 (1.00) |
| 6p gain | 6 (6%) | 99 |
0.0841 (1.00) |
0.795 (1.00) |
0.667 (1.00) |
0.703 (1.00) |
0.587 (1.00) |
0.671 (1.00) |
|
| 6q gain | 4 (4%) | 101 |
0.0887 (1.00) |
0.989 (1.00) |
0.574 (1.00) |
0.877 (1.00) |
0.961 (1.00) |
0.0714 (1.00) |
|
| 7p gain | 31 (30%) | 74 |
0.376 (1.00) |
0.548 (1.00) |
0.485 (1.00) |
0.311 (1.00) |
0.768 (1.00) |
0.899 (1.00) |
0.21 (1.00) |
| 7q gain | 32 (30%) | 73 |
0.705 (1.00) |
0.702 (1.00) |
0.0598 (1.00) |
0.312 (1.00) |
0.206 (1.00) |
0.755 (1.00) |
0.389 (1.00) |
| 8p gain | 14 (13%) | 91 |
0.993 (1.00) |
0.213 (1.00) |
0.753 (1.00) |
0.745 (1.00) |
0.143 (1.00) |
0.0547 (1.00) |
0.139 (1.00) |
| 8q gain | 31 (30%) | 74 |
0.544 (1.00) |
0.42 (1.00) |
1 (1.00) |
0.452 (1.00) |
0.366 (1.00) |
0.498 (1.00) |
0.831 (1.00) |
| 9p gain | 13 (12%) | 92 |
0.022 (1.00) |
0.0308 (1.00) |
0.107 (1.00) |
0.907 (1.00) |
0.0531 (1.00) |
0.677 (1.00) |
0.102 (1.00) |
| 9q gain | 10 (10%) | 95 |
0.0608 (1.00) |
0.141 (1.00) |
1 (1.00) |
0.745 (1.00) |
0.126 (1.00) |
0.434 (1.00) |
0.643 (1.00) |
| 10p gain | 22 (21%) | 83 |
0.41 (1.00) |
0.883 (1.00) |
1 (1.00) |
0.62 (1.00) |
0.512 (1.00) |
0.43 (1.00) |
0.734 (1.00) |
| 10q gain | 6 (6%) | 99 |
0.435 (1.00) |
0.224 (1.00) |
0.667 (1.00) |
0.383 (1.00) |
0.97 (1.00) |
||
| 11p gain | 5 (5%) | 100 |
0.0941 (1.00) |
0.223 (1.00) |
0.319 (1.00) |
0.114 (1.00) |
0.53 (1.00) |
0.437 (1.00) |
|
| 11q gain | 6 (6%) | 99 |
0.406 (1.00) |
0.483 (1.00) |
0.184 (1.00) |
0.745 (1.00) |
0.878 (1.00) |
0.907 (1.00) |
|
| 12p gain | 20 (19%) | 85 |
0.82 (1.00) |
0.942 (1.00) |
1 (1.00) |
0.472 (1.00) |
0.761 (1.00) |
0.434 (1.00) |
0.621 (1.00) |
| 12q gain | 17 (16%) | 88 |
0.262 (1.00) |
0.539 (1.00) |
0.144 (1.00) |
0.285 (1.00) |
0.741 (1.00) |
0.39 (1.00) |
0.931 (1.00) |
| 13q gain | 18 (17%) | 87 |
0.38 (1.00) |
0.626 (1.00) |
1 (1.00) |
0.388 (1.00) |
0.282 (1.00) |
0.916 (1.00) |
0.783 (1.00) |
| 14q gain | 10 (10%) | 95 |
0.592 (1.00) |
0.882 (1.00) |
0.458 (1.00) |
0.403 (1.00) |
0.279 (1.00) |
0.585 (1.00) |
0.408 (1.00) |
| 15q gain | 4 (4%) | 101 |
0.113 (1.00) |
0.788 (1.00) |
1 (1.00) |
0.479 (1.00) |
|||
| 16p gain | 9 (9%) | 96 |
0.00125 (0.597) |
0.434 (1.00) |
0.257 (1.00) |
0.583 (1.00) |
0.206 (1.00) |
0.317 (1.00) |
|
| 16q gain | 11 (10%) | 94 |
0.0285 (1.00) |
0.311 (1.00) |
0.0676 (1.00) |
0.446 (1.00) |
0.389 (1.00) |
0.873 (1.00) |
0.285 (1.00) |
| 17p gain | 8 (8%) | 97 |
0.52 (1.00) |
0.967 (1.00) |
0.682 (1.00) |
0.778 (1.00) |
0.596 (1.00) |
0.998 (1.00) |
|
| 17q gain | 18 (17%) | 87 |
0.616 (1.00) |
0.457 (1.00) |
0.57 (1.00) |
0.293 (1.00) |
0.469 (1.00) |
0.565 (1.00) |
0.377 (1.00) |
| 18p gain | 20 (19%) | 85 |
0.728 (1.00) |
0.829 (1.00) |
0.416 (1.00) |
0.712 (1.00) |
0.261 (1.00) |
0.396 (1.00) |
0.129 (1.00) |
| 18q gain | 7 (7%) | 98 |
0.0519 (1.00) |
0.863 (1.00) |
1 (1.00) |
0.681 (1.00) |
0.542 (1.00) |
0.219 (1.00) |
|
| 19p gain | 12 (11%) | 93 |
0.872 (1.00) |
0.79 (1.00) |
1 (1.00) |
0.35 (1.00) |
0.493 (1.00) |
0.684 (1.00) |
0.747 (1.00) |
| 19q gain | 25 (24%) | 80 |
0.173 (1.00) |
0.765 (1.00) |
0.613 (1.00) |
0.0639 (1.00) |
0.204 (1.00) |
0.528 (1.00) |
0.242 (1.00) |
| 20p gain | 42 (40%) | 63 |
0.671 (1.00) |
0.733 (1.00) |
0.181 (1.00) |
0.734 (1.00) |
0.167 (1.00) |
0.291 (1.00) |
0.866 (1.00) |
| 20q gain | 43 (41%) | 62 |
0.46 (1.00) |
0.626 (1.00) |
1 (1.00) |
0.603 (1.00) |
0.0771 (1.00) |
0.281 (1.00) |
0.106 (1.00) |
| 21q gain | 20 (19%) | 85 |
0.315 (1.00) |
0.143 (1.00) |
0.786 (1.00) |
0.753 (1.00) |
0.372 (1.00) |
0.56 (1.00) |
0.914 (1.00) |
| 22q gain | 10 (10%) | 95 |
0.0663 (1.00) |
0.483 (1.00) |
0.723 (1.00) |
0.712 (1.00) |
0.26 (1.00) |
0.0681 (1.00) |
0.0115 (1.00) |
| Xq gain | 6 (6%) | 99 |
0.6 (1.00) |
0.618 (1.00) |
0.667 (1.00) |
0.349 (1.00) |
0.504 (1.00) |
||
| 2p loss | 6 (6%) | 99 |
0.652 (1.00) |
0.801 (1.00) |
1 (1.00) |
0.806 (1.00) |
0.244 (1.00) |
0.936 (1.00) |
0.425 (1.00) |
| 2q loss | 13 (12%) | 92 |
0.0397 (1.00) |
0.712 (1.00) |
0.508 (1.00) |
0.806 (1.00) |
0.215 (1.00) |
0.89 (1.00) |
0.53 (1.00) |
| 3p loss | 7 (7%) | 98 |
0.975 (1.00) |
0.667 (1.00) |
0.392 (1.00) |
0.0832 (1.00) |
0.89 (1.00) |
0.0132 (1.00) |
|
| 4p loss | 18 (17%) | 87 |
0.542 (1.00) |
0.942 (1.00) |
0.57 (1.00) |
0.0381 (1.00) |
0.661 (1.00) |
0.864 (1.00) |
0.996 (1.00) |
| 4q loss | 17 (16%) | 88 |
0.747 (1.00) |
0.632 (1.00) |
1 (1.00) |
0.0381 (1.00) |
0.785 (1.00) |
0.238 (1.00) |
0.915 (1.00) |
| 5p loss | 11 (10%) | 94 |
0.312 (1.00) |
0.182 (1.00) |
0.172 (1.00) |
0.0019 (0.902) |
0.966 (1.00) |
0.2 (1.00) |
0.174 (1.00) |
| 5q loss | 25 (24%) | 80 |
0.551 (1.00) |
0.449 (1.00) |
0.799 (1.00) |
0.534 (1.00) |
0.0707 (1.00) |
0.526 (1.00) |
0.114 (1.00) |
| 6p loss | 14 (13%) | 91 |
0.984 (1.00) |
0.807 (1.00) |
0.525 (1.00) |
0.0019 (0.902) |
0.758 (1.00) |
0.896 (1.00) |
0.42 (1.00) |
| 6q loss | 23 (22%) | 82 |
0.312 (1.00) |
0.663 (1.00) |
0.794 (1.00) |
0.00165 (0.785) |
0.199 (1.00) |
0.231 (1.00) |
0.0102 (1.00) |
| 8p loss | 34 (32%) | 71 |
0.083 (1.00) |
0.969 (1.00) |
0.643 (1.00) |
0.232 (1.00) |
0.47 (1.00) |
0.248 (1.00) |
0.752 (1.00) |
| 8q loss | 4 (4%) | 101 |
0.546 (1.00) |
0.125 (1.00) |
0.305 (1.00) |
0.87 (1.00) |
0.649 (1.00) |
0.852 (1.00) |
|
| 9p loss | 34 (32%) | 71 |
0.754 (1.00) |
0.51 (1.00) |
0.162 (1.00) |
0.822 (1.00) |
0.377 (1.00) |
0.307 (1.00) |
0.302 (1.00) |
| 9q loss | 31 (30%) | 74 |
0.651 (1.00) |
0.827 (1.00) |
0.1 (1.00) |
0.701 (1.00) |
0.178 (1.00) |
0.793 (1.00) |
0.318 (1.00) |
| 10p loss | 15 (14%) | 90 |
0.547 (1.00) |
0.967 (1.00) |
1 (1.00) |
0.0381 (1.00) |
0.514 (1.00) |
0.808 (1.00) |
0.0361 (1.00) |
| 10q loss | 19 (18%) | 86 |
0.533 (1.00) |
0.136 (1.00) |
1 (1.00) |
0.00182 (0.868) |
0.365 (1.00) |
0.875 (1.00) |
0.115 (1.00) |
| 11p loss | 35 (33%) | 70 |
0.445 (1.00) |
0.21 (1.00) |
0.644 (1.00) |
0.0586 (1.00) |
0.737 (1.00) |
0.578 (1.00) |
0.713 (1.00) |
| 11q loss | 26 (25%) | 79 |
0.843 (1.00) |
0.618 (1.00) |
1 (1.00) |
0.481 (1.00) |
0.254 (1.00) |
0.844 (1.00) |
0.736 (1.00) |
| 12p loss | 4 (4%) | 101 |
0.975 (1.00) |
0.5 (1.00) |
0.574 (1.00) |
0.717 (1.00) |
0.0422 (1.00) |
||
| 12q loss | 6 (6%) | 99 |
0.132 (1.00) |
0.351 (1.00) |
0.184 (1.00) |
0.988 (1.00) |
0.902 (1.00) |
0.34 (1.00) |
|
| 13q loss | 15 (14%) | 90 |
0.794 (1.00) |
0.663 (1.00) |
0.227 (1.00) |
0.00198 (0.933) |
0.677 (1.00) |
0.461 (1.00) |
0.0155 (1.00) |
| 14q loss | 16 (15%) | 89 |
0.228 (1.00) |
0.261 (1.00) |
0.547 (1.00) |
0.907 (1.00) |
0.0401 (1.00) |
0.0382 (1.00) |
0.759 (1.00) |
| 15q loss | 14 (13%) | 91 |
0.191 (1.00) |
0.789 (1.00) |
0.525 (1.00) |
0.883 (1.00) |
0.754 (1.00) |
0.893 (1.00) |
0.252 (1.00) |
| 16p loss | 12 (11%) | 93 |
0.382 (1.00) |
0.295 (1.00) |
0.172 (1.00) |
0.145 (1.00) |
0.581 (1.00) |
0.878 (1.00) |
0.0196 (1.00) |
| 17p loss | 32 (30%) | 73 |
0.223 (1.00) |
0.721 (1.00) |
1 (1.00) |
0.439 (1.00) |
0.278 (1.00) |
0.722 (1.00) |
0.725 (1.00) |
| 17q loss | 4 (4%) | 101 |
0.803 (1.00) |
0.588 (1.00) |
1 (1.00) |
0.663 (1.00) |
|||
| 18p loss | 15 (14%) | 90 |
0.113 (1.00) |
0.0591 (1.00) |
0.756 (1.00) |
0.668 (1.00) |
0.548 (1.00) |
0.251 (1.00) |
0.575 (1.00) |
| 18q loss | 29 (28%) | 76 |
0.0178 (1.00) |
0.0663 (1.00) |
0.153 (1.00) |
0.79 (1.00) |
0.605 (1.00) |
0.127 (1.00) |
0.215 (1.00) |
| 19p loss | 7 (7%) | 98 |
0.947 (1.00) |
0.781 (1.00) |
1 (1.00) |
0.304 (1.00) |
0.193 (1.00) |
0.483 (1.00) |
|
| 19q loss | 4 (4%) | 101 |
0.345 (1.00) |
0.71 (1.00) |
0.574 (1.00) |
0.38 (1.00) |
|||
| 20p loss | 4 (4%) | 101 |
0.906 (1.00) |
0.221 (1.00) |
1 (1.00) |
0.0348 (1.00) |
0.102 (1.00) |
0.668 (1.00) |
|
| 22q loss | 22 (21%) | 83 |
0.203 (1.00) |
0.894 (1.00) |
0.603 (1.00) |
0.298 (1.00) |
0.707 (1.00) |
0.883 (1.00) |
0.123 (1.00) |
P value = 0.000516 (t-test), Q value = 0.25
Table S1. Gene #64: '16q loss mutation analysis' versus Clinical Feature #7: 'TOBACCOSMOKINGHISTORYINDICATOR'
| nPatients | Mean (Std.Dev) | |
|---|---|---|
| ALL | 99 | 2.6 (1.1) |
| 16Q LOSS MUTATED | 13 | 3.4 (0.7) |
| 16Q LOSS WILD-TYPE | 86 | 2.5 (1.2) |
Figure S1. Get High-res Image Gene #64: '16q loss mutation analysis' versus Clinical Feature #7: 'TOBACCOSMOKINGHISTORYINDICATOR'
P value = 0.000393 (t-test), Q value = 0.19
Table S2. Gene #72: '21q loss mutation analysis' versus Clinical Feature #2: 'AGE'
| nPatients | Mean (Std.Dev) | |
|---|---|---|
| ALL | 104 | 66.9 (11.1) |
| 21Q LOSS MUTATED | 11 | 58.5 (6.2) |
| 21Q LOSS WILD-TYPE | 93 | 67.9 (11.2) |
Figure S2. Get High-res Image Gene #72: '21q loss mutation analysis' versus Clinical Feature #2: 'AGE'
-
Mutation data file = broad_values_by_arm.mutsig.cluster.txt
-
Clinical data file = BLCA-TP.clin.merged.picked.txt
-
Number of patients = 105
-
Number of significantly arm-level cnvs = 73
-
Number of selected clinical features = 7
-
Exclude genes that fewer than K tumors have mutations, K = 3
For survival clinical features, the Kaplan-Meier survival curves of tumors with and without gene mutations were plotted and the statistical significance P values were estimated by logrank test (Bland and Altman 2004) using the 'survdiff' function in R
For continuous numerical clinical features, two-tailed Student's t test with unequal variance (Lehmann and Romano 2005) was applied to compare the clinical values between tumors with and without gene mutations using 't.test' function in R
For binary or multi-class clinical features (nominal or ordinal), two-tailed Fisher's exact tests (Fisher 1922) were used to estimate the P values using the 'fisher.test' function in R
For multiple hypothesis correction, Q value is the False Discovery Rate (FDR) analogue of the P value (Benjamini and Hochberg 1995), defined as the minimum FDR at which the test may be called significant. We used the 'Benjamini and Hochberg' method of 'p.adjust' function in R to convert P values into Q values.
This is an experimental feature. The full results of the analysis summarized in this report can be downloaded from the TCGA Data Coordination Center.