This pipeline computes the correlation between significant arm-level copy number variations (cnvs) and selected clinical features.
Testing the association between copy number variation 57 arm-level results and 8 clinical features across 101 patients, 7 significant findings detected with Q value < 0.25.
-
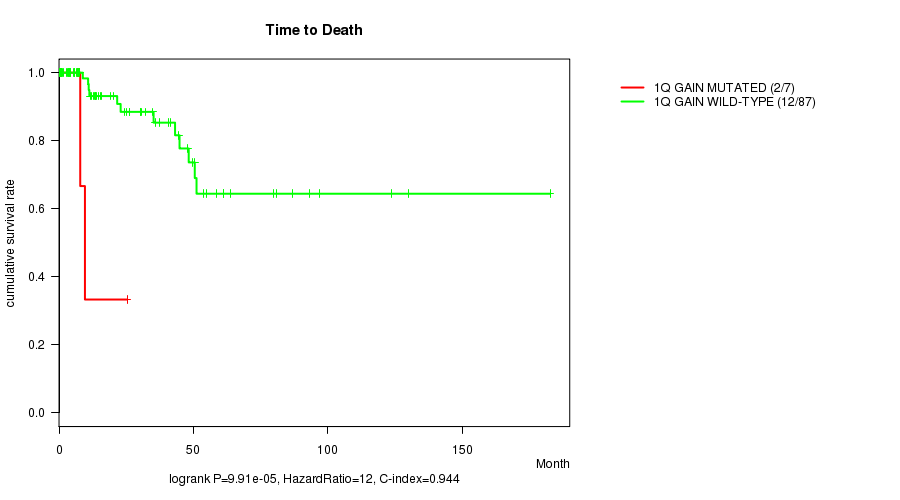
1q gain cnv correlated to 'Time to Death'.
-
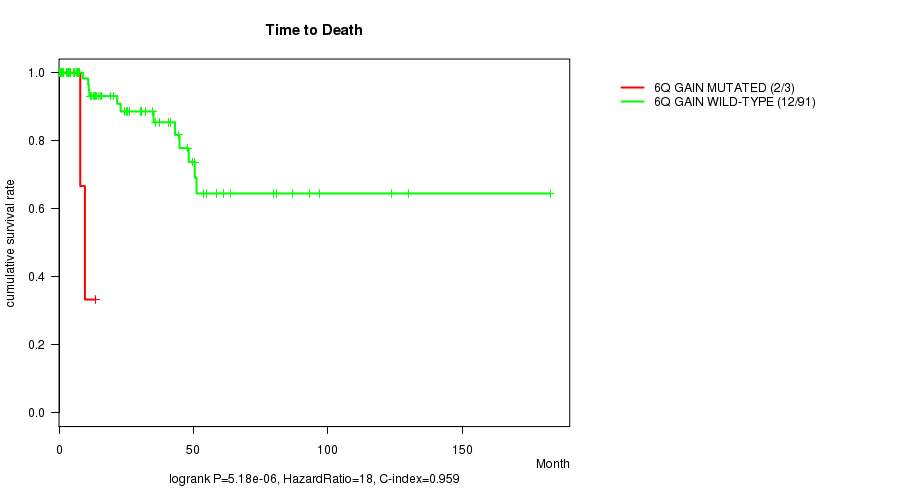
6q gain cnv correlated to 'Time to Death'.
-
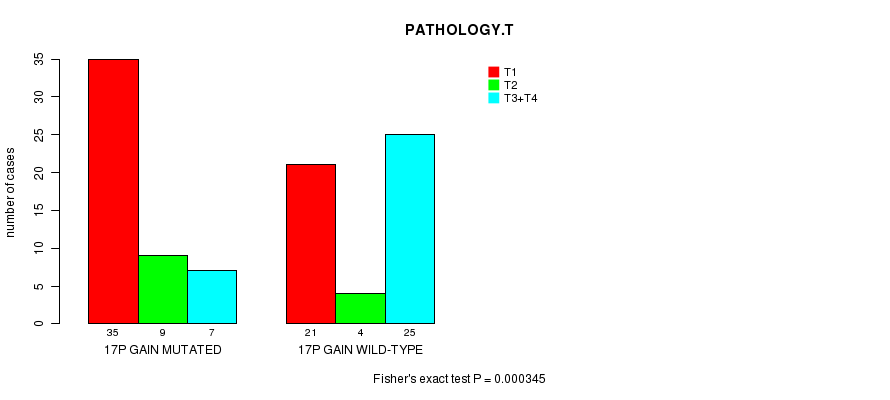
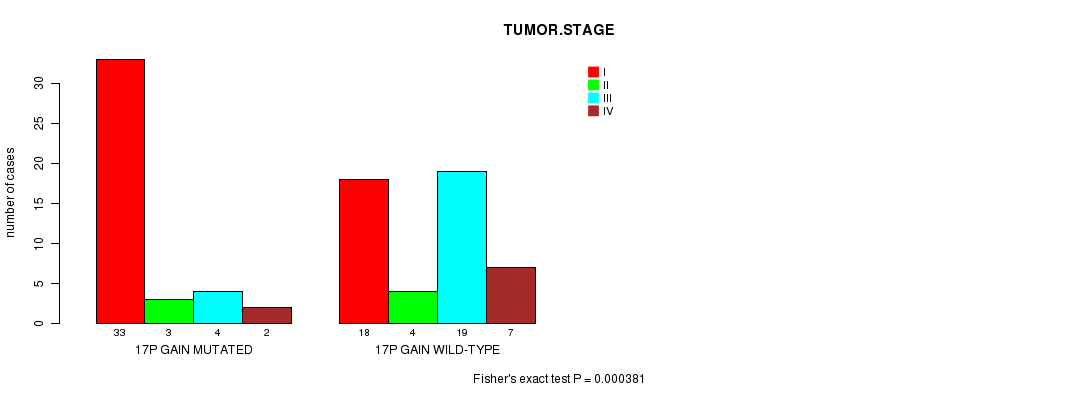
17p gain cnv correlated to 'PATHOLOGY.T' and 'TUMOR.STAGE'.
-
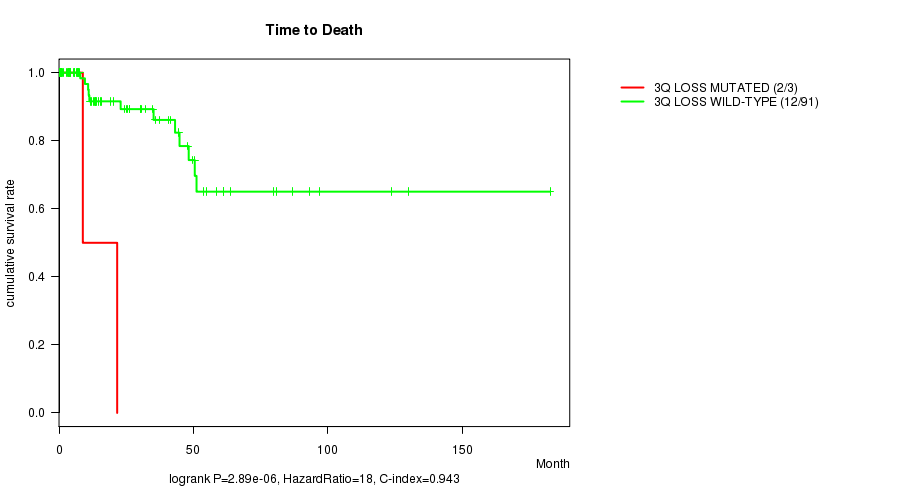
3q loss cnv correlated to 'Time to Death'.
-
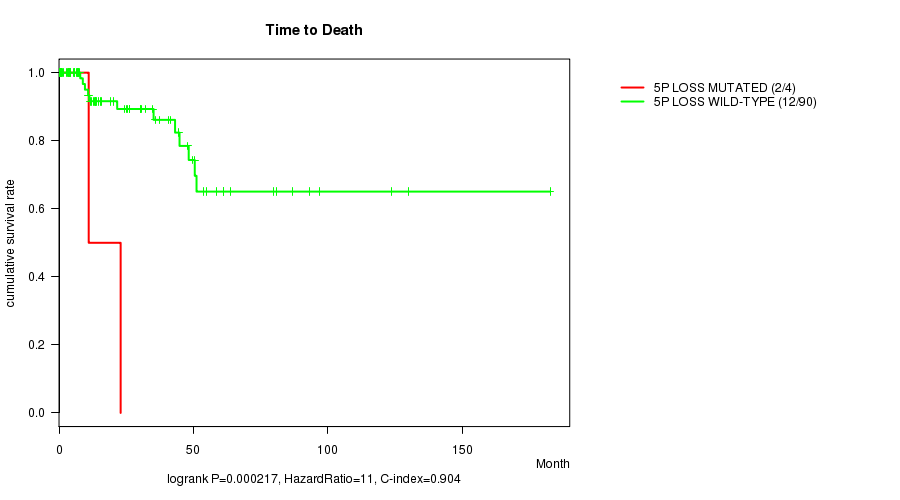
5p loss cnv correlated to 'Time to Death'.
-
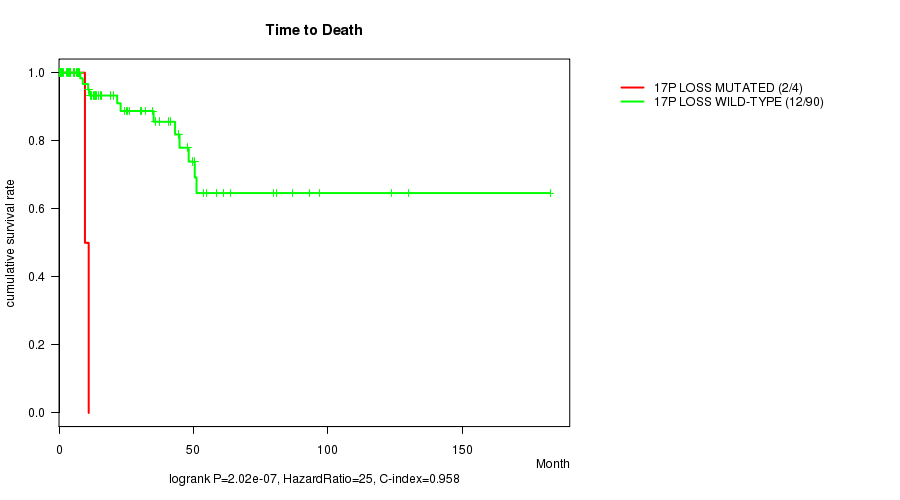
17p loss cnv correlated to 'Time to Death'.
Table 1. Get Full Table Overview of the association between significant copy number variation of 57 arm-level results and 8 clinical features. Shown in the table are P values (Q values). Thresholded by Q value < 0.25, 7 significant findings detected.
|
Clinical Features |
Time to Death |
AGE | GENDER |
KARNOFSKY PERFORMANCE SCORE |
PATHOLOGY T |
PATHOLOGY N |
PATHOLOGICSPREAD(M) |
TUMOR STAGE |
||
| nCNV (%) | nWild-Type | logrank test | t-test | Fisher's exact test | t-test | Fisher's exact test | Fisher's exact test | Fisher's exact test | Fisher's exact test | |
| 17p gain | 51 (50%) | 50 |
0.222 (1.00) |
0.072 (1.00) |
0.0105 (1.00) |
0.201 (1.00) |
0.000345 (0.136) |
0.224 (1.00) |
0.035 (1.00) |
0.000381 (0.15) |
| 1q gain | 8 (8%) | 93 |
9.91e-05 (0.0394) |
0.796 (1.00) |
0.259 (1.00) |
0.0027 (1.00) |
0.836 (1.00) |
0.102 (1.00) |
0.00716 (1.00) |
|
| 6q gain | 3 (3%) | 98 |
5.18e-06 (0.00206) |
0.258 (1.00) |
0.55 (1.00) |
0.704 (1.00) |
0.00701 (1.00) |
0.0832 (1.00) |
||
| 3q loss | 3 (3%) | 98 |
2.89e-06 (0.00115) |
0.324 (1.00) |
1 (1.00) |
0.0727 (1.00) |
0.506 (1.00) |
0.199 (1.00) |
0.103 (1.00) |
|
| 5p loss | 4 (4%) | 97 |
0.000217 (0.0859) |
0.0657 (1.00) |
0.0926 (1.00) |
0.0151 (1.00) |
0.0879 (1.00) |
0.624 (1.00) |
0.103 (1.00) |
|
| 17p loss | 5 (5%) | 96 |
2.02e-07 (8.08e-05) |
0.489 (1.00) |
0.0339 (1.00) |
0.154 (1.00) |
0.338 (1.00) |
0.0613 (1.00) |
0.0453 (1.00) |
|
| 2p gain | 11 (11%) | 90 |
0.191 (1.00) |
0.351 (1.00) |
0.739 (1.00) |
0.54 (1.00) |
0.81 (1.00) |
0.222 (1.00) |
0.0436 (1.00) |
0.0372 (1.00) |
| 2q gain | 13 (13%) | 88 |
0.35 (1.00) |
0.855 (1.00) |
0.544 (1.00) |
0.5 (1.00) |
0.919 (1.00) |
0.055 (1.00) |
0.0532 (1.00) |
0.0101 (1.00) |
| 3p gain | 24 (24%) | 77 |
0.414 (1.00) |
0.93 (1.00) |
0.0827 (1.00) |
0.088 (1.00) |
0.0175 (1.00) |
1 (1.00) |
0.755 (1.00) |
0.232 (1.00) |
| 3q gain | 26 (26%) | 75 |
0.288 (1.00) |
0.871 (1.00) |
0.0502 (1.00) |
0.208 (1.00) |
0.0509 (1.00) |
1 (1.00) |
0.707 (1.00) |
0.381 (1.00) |
| 4p gain | 4 (4%) | 97 |
0.0702 (1.00) |
0.0414 (1.00) |
1 (1.00) |
0.349 (1.00) |
0.338 (1.00) |
0.028 (1.00) |
0.0832 (1.00) |
|
| 4q gain | 3 (3%) | 98 |
0.694 (1.00) |
0.0405 (1.00) |
1 (1.00) |
0.371 (1.00) |
||||
| 5p gain | 9 (9%) | 92 |
0.76 (1.00) |
0.201 (1.00) |
0.459 (1.00) |
0.395 (1.00) |
0.0557 (1.00) |
0.643 (1.00) |
0.529 (1.00) |
0.0743 (1.00) |
| 5q gain | 9 (9%) | 92 |
0.31 (1.00) |
0.307 (1.00) |
0.459 (1.00) |
0.395 (1.00) |
0.205 (1.00) |
0.643 (1.00) |
0.436 (1.00) |
0.305 (1.00) |
| 6p gain | 4 (4%) | 97 |
0.0755 (1.00) |
0.362 (1.00) |
0.304 (1.00) |
0.172 (1.00) |
0.506 (1.00) |
0.00732 (1.00) |
0.08 (1.00) |
|
| 7p gain | 54 (53%) | 47 |
0.0708 (1.00) |
0.925 (1.00) |
0.0337 (1.00) |
0.2 (1.00) |
0.002 (0.785) |
0.454 (1.00) |
0.117 (1.00) |
0.000645 (0.253) |
| 7q gain | 55 (54%) | 46 |
0.0708 (1.00) |
0.925 (1.00) |
0.0852 (1.00) |
0.2 (1.00) |
0.00594 (1.00) |
0.454 (1.00) |
0.142 (1.00) |
0.00233 (0.905) |
| 8p gain | 5 (5%) | 96 |
0.576 (1.00) |
0.242 (1.00) |
0.651 (1.00) |
0.0534 (1.00) |
0.561 (1.00) |
0.734 (1.00) |
0.166 (1.00) |
|
| 8q gain | 7 (7%) | 94 |
0.00501 (1.00) |
0.624 (1.00) |
0.676 (1.00) |
0.0102 (1.00) |
0.205 (1.00) |
0.399 (1.00) |
0.00947 (1.00) |
|
| 10p gain | 3 (3%) | 98 |
1 (1.00) |
0.371 (1.00) |
||||||
| 12p gain | 30 (30%) | 71 |
0.991 (1.00) |
0.857 (1.00) |
0.0381 (1.00) |
0.26 (1.00) |
1 (1.00) |
0.408 (1.00) |
0.333 (1.00) |
0.406 (1.00) |
| 12q gain | 30 (30%) | 71 |
0.991 (1.00) |
0.857 (1.00) |
0.0381 (1.00) |
0.26 (1.00) |
1 (1.00) |
0.408 (1.00) |
0.333 (1.00) |
0.406 (1.00) |
| 13q gain | 10 (10%) | 91 |
0.717 (1.00) |
0.393 (1.00) |
1 (1.00) |
0.208 (1.00) |
0.798 (1.00) |
1 (1.00) |
0.931 (1.00) |
|
| 16p gain | 43 (43%) | 58 |
0.537 (1.00) |
0.336 (1.00) |
0.00493 (1.00) |
0.531 (1.00) |
0.921 (1.00) |
0.366 (1.00) |
0.731 (1.00) |
0.824 (1.00) |
| 16q gain | 40 (40%) | 61 |
0.103 (1.00) |
0.428 (1.00) |
0.0162 (1.00) |
0.264 (1.00) |
0.681 (1.00) |
0.186 (1.00) |
0.276 (1.00) |
0.793 (1.00) |
| 17q gain | 61 (60%) | 40 |
0.768 (1.00) |
0.137 (1.00) |
0.19 (1.00) |
0.556 (1.00) |
0.125 (1.00) |
0.226 (1.00) |
0.0649 (1.00) |
0.169 (1.00) |
| 18p gain | 6 (6%) | 95 |
0.195 (1.00) |
0.594 (1.00) |
0.662 (1.00) |
0.54 (1.00) |
0.856 (1.00) |
0.363 (1.00) |
0.469 (1.00) |
|
| 18q gain | 5 (5%) | 96 |
0.609 (1.00) |
0.967 (1.00) |
1 (1.00) |
0.678 (1.00) |
1 (1.00) |
0.651 (1.00) |
||
| 20p gain | 30 (30%) | 71 |
0.439 (1.00) |
0.031 (1.00) |
0.64 (1.00) |
0.639 (1.00) |
0.276 (1.00) |
1 (1.00) |
0.413 (1.00) |
0.49 (1.00) |
| 20q gain | 31 (31%) | 70 |
0.439 (1.00) |
0.07 (1.00) |
0.49 (1.00) |
0.639 (1.00) |
0.385 (1.00) |
1 (1.00) |
0.693 (1.00) |
0.702 (1.00) |
| Xq gain | 4 (4%) | 97 |
0.416 (1.00) |
0.36 (1.00) |
0.0926 (1.00) |
0.783 (1.00) |
0.624 (1.00) |
0.366 (1.00) |
||
| 1p loss | 10 (10%) | 91 |
0.721 (1.00) |
0.62 (1.00) |
1 (1.00) |
0.349 (1.00) |
0.891 (1.00) |
1 (1.00) |
0.393 (1.00) |
|
| 1q loss | 6 (6%) | 95 |
0.646 (1.00) |
0.821 (1.00) |
1 (1.00) |
0.349 (1.00) |
0.715 (1.00) |
0.521 (1.00) |
0.651 (1.00) |
|
| 3p loss | 6 (6%) | 95 |
0.211 (1.00) |
0.0512 (1.00) |
0.662 (1.00) |
0.0787 (1.00) |
0.55 (1.00) |
0.43 (1.00) |
0.0978 (1.00) |
|
| 4p loss | 8 (8%) | 93 |
0.131 (1.00) |
0.13 (1.00) |
0.0117 (1.00) |
0.135 (1.00) |
0.761 (1.00) |
0.668 (1.00) |
0.0545 (1.00) |
|
| 4q loss | 8 (8%) | 93 |
0.699 (1.00) |
0.476 (1.00) |
0.105 (1.00) |
0.385 (1.00) |
1 (1.00) |
0.668 (1.00) |
0.254 (1.00) |
|
| 5q loss | 4 (4%) | 97 |
0.0275 (1.00) |
0.229 (1.00) |
0.0926 (1.00) |
0.172 (1.00) |
0.624 (1.00) |
0.573 (1.00) |
||
| 6p loss | 9 (9%) | 92 |
0.0312 (1.00) |
0.992 (1.00) |
0.459 (1.00) |
0.26 (1.00) |
0.241 (1.00) |
0.204 (1.00) |
1 (1.00) |
0.345 (1.00) |
| 6q loss | 10 (10%) | 91 |
0.279 (1.00) |
0.364 (1.00) |
0.069 (1.00) |
0.392 (1.00) |
0.138 (1.00) |
0.309 (1.00) |
0.689 (1.00) |
0.493 (1.00) |
| 8p loss | 3 (3%) | 98 |
0.748 (1.00) |
0.402 (1.00) |
0.0298 (1.00) |
0.231 (1.00) |
1 (1.00) |
0.276 (1.00) |
||
| 9p loss | 12 (12%) | 89 |
0.0576 (1.00) |
0.529 (1.00) |
0.0164 (1.00) |
0.424 (1.00) |
0.126 (1.00) |
0.836 (1.00) |
0.518 (1.00) |
0.286 (1.00) |
| 9q loss | 12 (12%) | 89 |
0.0985 (1.00) |
0.501 (1.00) |
0.0481 (1.00) |
0.424 (1.00) |
0.0783 (1.00) |
0.836 (1.00) |
0.646 (1.00) |
0.436 (1.00) |
| 10p loss | 5 (5%) | 96 |
0.129 (1.00) |
0.947 (1.00) |
0.651 (1.00) |
0.532 (1.00) |
0.134 (1.00) |
0.686 (1.00) |
||
| 10q loss | 5 (5%) | 96 |
0.0067 (1.00) |
0.74 (1.00) |
1 (1.00) |
0.407 (1.00) |
0.506 (1.00) |
0.279 (1.00) |
0.575 (1.00) |
|
| 11p loss | 8 (8%) | 93 |
0.00515 (1.00) |
0.0518 (1.00) |
0.706 (1.00) |
0.321 (1.00) |
0.529 (1.00) |
0.181 (1.00) |
||
| 11q loss | 9 (9%) | 92 |
0.0224 (1.00) |
0.0674 (1.00) |
1 (1.00) |
0.0557 (1.00) |
0.561 (1.00) |
0.581 (1.00) |
0.0678 (1.00) |
|
| 13q loss | 9 (9%) | 92 |
0.025 (1.00) |
0.424 (1.00) |
0.00414 (1.00) |
0.205 (1.00) |
0.488 (1.00) |
0.482 (1.00) |
0.275 (1.00) |
|
| 14q loss | 17 (17%) | 84 |
0.974 (1.00) |
0.472 (1.00) |
0.397 (1.00) |
0.396 (1.00) |
0.608 (1.00) |
0.447 (1.00) |
0.437 (1.00) |
0.256 (1.00) |
| 15q loss | 10 (10%) | 91 |
0.0655 (1.00) |
0.362 (1.00) |
0.721 (1.00) |
0.654 (1.00) |
0.138 (1.00) |
1 (1.00) |
1 (1.00) |
0.206 (1.00) |
| 16q loss | 3 (3%) | 98 |
0.0298 (1.00) |
0.704 (1.00) |
0.624 (1.00) |
0.366 (1.00) |
||||
| 18p loss | 15 (15%) | 86 |
0.00216 (0.846) |
0.853 (1.00) |
1 (1.00) |
0.349 (1.00) |
0.11 (1.00) |
0.329 (1.00) |
0.697 (1.00) |
0.275 (1.00) |
| 18q loss | 16 (16%) | 85 |
0.00216 (0.846) |
0.853 (1.00) |
0.572 (1.00) |
0.349 (1.00) |
0.0456 (1.00) |
0.329 (1.00) |
0.9 (1.00) |
0.128 (1.00) |
| 19p loss | 4 (4%) | 97 |
0.646 (1.00) |
0.584 (1.00) |
1 (1.00) |
0.596 (1.00) |
0.624 (1.00) |
0.276 (1.00) |
||
| 19q loss | 3 (3%) | 98 |
0.748 (1.00) |
0.879 (1.00) |
1 (1.00) |
0.371 (1.00) |
||||
| 21q loss | 11 (11%) | 90 |
0.151 (1.00) |
0.435 (1.00) |
0.318 (1.00) |
0.664 (1.00) |
1 (1.00) |
1 (1.00) |
0.206 (1.00) |
|
| 22q loss | 18 (18%) | 83 |
0.704 (1.00) |
0.583 (1.00) |
0.0926 (1.00) |
0.457 (1.00) |
0.212 (1.00) |
0.596 (1.00) |
0.272 (1.00) |
0.219 (1.00) |
| Xq loss | 3 (3%) | 98 |
0.748 (1.00) |
0.919 (1.00) |
1 (1.00) |
1 (1.00) |
1 (1.00) |
P value = 9.91e-05 (logrank test), Q value = 0.039
Table S1. Gene #1: '1q gain mutation analysis' versus Clinical Feature #1: 'Time to Death'
| nPatients | nDeath | Duration Range (Median), Month | |
|---|---|---|---|
| ALL | 94 | 14 | 0.0 - 182.7 (13.9) |
| 1Q GAIN MUTATED | 7 | 2 | 0.7 - 25.4 (7.6) |
| 1Q GAIN WILD-TYPE | 87 | 12 | 0.0 - 182.7 (15.5) |
Figure S1. Get High-res Image Gene #1: '1q gain mutation analysis' versus Clinical Feature #1: 'Time to Death'
P value = 5.18e-06 (logrank test), Q value = 0.0021
Table S2. Gene #11: '6q gain mutation analysis' versus Clinical Feature #1: 'Time to Death'
| nPatients | nDeath | Duration Range (Median), Month | |
|---|---|---|---|
| ALL | 94 | 14 | 0.0 - 182.7 (13.9) |
| 6Q GAIN MUTATED | 3 | 2 | 7.9 - 13.6 (9.6) |
| 6Q GAIN WILD-TYPE | 91 | 12 | 0.0 - 182.7 (14.6) |
Figure S2. Get High-res Image Gene #11: '6q gain mutation analysis' versus Clinical Feature #1: 'Time to Death'
P value = 0.000345 (Fisher's exact test), Q value = 0.14
Table S3. Gene #22: '17p gain mutation analysis' versus Clinical Feature #5: 'PATHOLOGY.T'
| nPatients | T1 | T2 | T3+T4 |
|---|---|---|---|
| ALL | 56 | 13 | 32 |
| 17P GAIN MUTATED | 35 | 9 | 7 |
| 17P GAIN WILD-TYPE | 21 | 4 | 25 |
Figure S3. Get High-res Image Gene #22: '17p gain mutation analysis' versus Clinical Feature #5: 'PATHOLOGY.T'
P value = 0.000381 (Fisher's exact test), Q value = 0.15
Table S4. Gene #22: '17p gain mutation analysis' versus Clinical Feature #8: 'TUMOR.STAGE'
| nPatients | I | II | III | IV |
|---|---|---|---|---|
| ALL | 51 | 7 | 23 | 9 |
| 17P GAIN MUTATED | 33 | 3 | 4 | 2 |
| 17P GAIN WILD-TYPE | 18 | 4 | 19 | 7 |
Figure S4. Get High-res Image Gene #22: '17p gain mutation analysis' versus Clinical Feature #8: 'TUMOR.STAGE'
P value = 2.89e-06 (logrank test), Q value = 0.0012
Table S5. Gene #32: '3q loss mutation analysis' versus Clinical Feature #1: 'Time to Death'
| nPatients | nDeath | Duration Range (Median), Month | |
|---|---|---|---|
| ALL | 94 | 14 | 0.0 - 182.7 (13.9) |
| 3Q LOSS MUTATED | 3 | 2 | 3.7 - 21.6 (8.8) |
| 3Q LOSS WILD-TYPE | 91 | 12 | 0.0 - 182.7 (14.1) |
Figure S5. Get High-res Image Gene #32: '3q loss mutation analysis' versus Clinical Feature #1: 'Time to Death'
P value = 0.000217 (logrank test), Q value = 0.086
Table S6. Gene #35: '5p loss mutation analysis' versus Clinical Feature #1: 'Time to Death'
| nPatients | nDeath | Duration Range (Median), Month | |
|---|---|---|---|
| ALL | 94 | 14 | 0.0 - 182.7 (13.9) |
| 5P LOSS MUTATED | 4 | 2 | 0.0 - 22.9 (7.4) |
| 5P LOSS WILD-TYPE | 90 | 12 | 0.0 - 182.7 (14.4) |
Figure S6. Get High-res Image Gene #35: '5p loss mutation analysis' versus Clinical Feature #1: 'Time to Death'
P value = 2.02e-07 (logrank test), Q value = 8.1e-05
Table S7. Gene #50: '17p loss mutation analysis' versus Clinical Feature #1: 'Time to Death'
| nPatients | nDeath | Duration Range (Median), Month | |
|---|---|---|---|
| ALL | 94 | 14 | 0.0 - 182.7 (13.9) |
| 17P LOSS MUTATED | 4 | 2 | 0.2 - 11.1 (5.2) |
| 17P LOSS WILD-TYPE | 90 | 12 | 0.0 - 182.7 (15.1) |
Figure S7. Get High-res Image Gene #50: '17p loss mutation analysis' versus Clinical Feature #1: 'Time to Death'
-
Mutation data file = broad_values_by_arm.mutsig.cluster.txt
-
Clinical data file = KIRP-TP.clin.merged.picked.txt
-
Number of patients = 101
-
Number of significantly arm-level cnvs = 57
-
Number of selected clinical features = 8
-
Exclude genes that fewer than K tumors have mutations, K = 3
For survival clinical features, the Kaplan-Meier survival curves of tumors with and without gene mutations were plotted and the statistical significance P values were estimated by logrank test (Bland and Altman 2004) using the 'survdiff' function in R
For continuous numerical clinical features, two-tailed Student's t test with unequal variance (Lehmann and Romano 2005) was applied to compare the clinical values between tumors with and without gene mutations using 't.test' function in R
For binary or multi-class clinical features (nominal or ordinal), two-tailed Fisher's exact tests (Fisher 1922) were used to estimate the P values using the 'fisher.test' function in R
For multiple hypothesis correction, Q value is the False Discovery Rate (FDR) analogue of the P value (Benjamini and Hochberg 1995), defined as the minimum FDR at which the test may be called significant. We used the 'Benjamini and Hochberg' method of 'p.adjust' function in R to convert P values into Q values.
This is an experimental feature. The full results of the analysis summarized in this report can be downloaded from the TCGA Data Coordination Center.