This pipeline computes the correlation between significant arm-level copy number variations (cnvs) and selected clinical features.
Testing the association between copy number variation 80 arm-level results and 6 clinical features across 552 patients, 8 significant findings detected with Q value < 0.25.
-
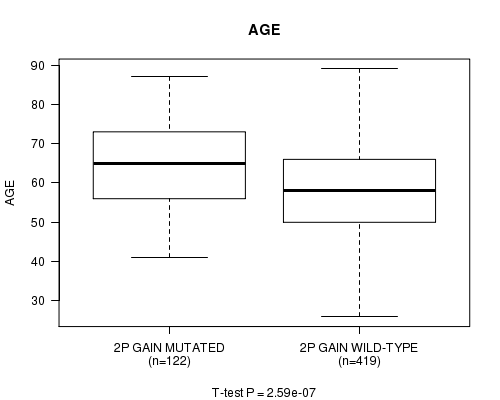
2p gain cnv correlated to 'AGE'.
-
3q gain cnv correlated to 'AGE'.
-
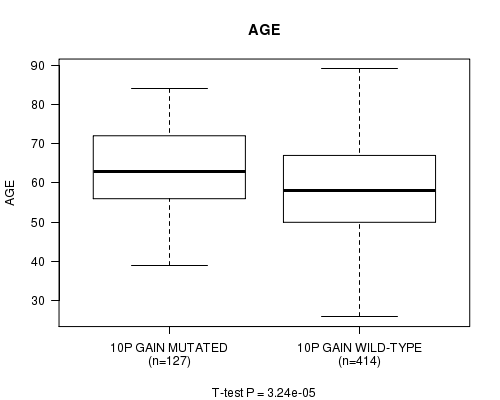
10p gain cnv correlated to 'AGE'.
-
12p gain cnv correlated to 'AGE'.
-
12q gain cnv correlated to 'AGE'.
-
20p gain cnv correlated to 'AGE'.
-
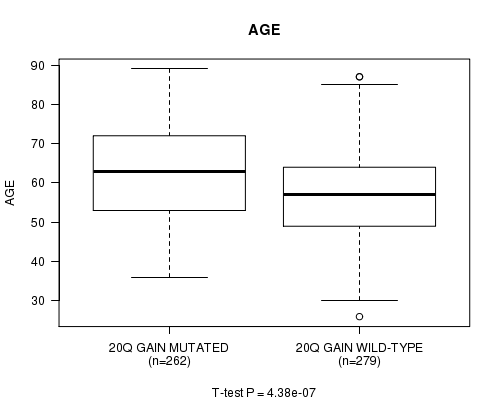
20q gain cnv correlated to 'AGE'.
-
9q loss cnv correlated to 'AGE'.
Table 1. Get Full Table Overview of the association between significant copy number variation of 80 arm-level results and 6 clinical features. Shown in the table are P values (Q values). Thresholded by Q value < 0.25, 8 significant findings detected.
|
Clinical Features |
Time to Death |
AGE |
PRIMARY SITE OF DISEASE |
KARNOFSKY PERFORMANCE SCORE |
TUMOR STAGE |
RADIATIONS RADIATION REGIMENINDICATION |
||
| nCNV (%) | nWild-Type | logrank test | t-test | Fisher's exact test | t-test | Fisher's exact test | Fisher's exact test | |
| 2p gain | 124 (22%) | 428 |
0.0293 (1.00) |
2.59e-07 (0.000123) |
1 (1.00) |
0.956 (1.00) |
0.966 (1.00) |
0.535 (1.00) |
| 3q gain | 203 (37%) | 349 |
0.759 (1.00) |
1.36e-06 (0.000642) |
0.126 (1.00) |
0.671 (1.00) |
0.504 (1.00) |
0.301 (1.00) |
| 10p gain | 131 (24%) | 421 |
0.216 (1.00) |
3.24e-05 (0.0152) |
0.109 (1.00) |
0.152 (1.00) |
0.847 (1.00) |
1 (1.00) |
| 12p gain | 201 (36%) | 351 |
0.26 (1.00) |
3.85e-08 (1.83e-05) |
0.125 (1.00) |
0.0302 (1.00) |
0.00442 (1.00) |
1 (1.00) |
| 12q gain | 116 (21%) | 436 |
0.131 (1.00) |
3.77e-06 (0.00177) |
0.612 (1.00) |
0.0312 (1.00) |
0.0674 (1.00) |
0.508 (1.00) |
| 20p gain | 230 (42%) | 322 |
0.112 (1.00) |
1.44e-06 (0.00068) |
1 (1.00) |
0.105 (1.00) |
0.19 (1.00) |
0.574 (1.00) |
| 20q gain | 267 (48%) | 285 |
0.0787 (1.00) |
4.38e-07 (0.000207) |
1 (1.00) |
0.229 (1.00) |
0.0814 (1.00) |
0.612 (1.00) |
| 9q loss | 235 (43%) | 317 |
0.492 (1.00) |
3.28e-06 (0.00155) |
0.152 (1.00) |
0.779 (1.00) |
0.245 (1.00) |
0.578 (1.00) |
| 1p gain | 101 (18%) | 451 |
0.153 (1.00) |
0.672 (1.00) |
0.155 (1.00) |
0.126 (1.00) |
0.24 (1.00) |
0.0877 (1.00) |
| 1q gain | 153 (28%) | 399 |
0.249 (1.00) |
0.0229 (1.00) |
0.0668 (1.00) |
0.0331 (1.00) |
0.221 (1.00) |
1 (1.00) |
| 2q gain | 98 (18%) | 454 |
0.104 (1.00) |
0.000536 (0.251) |
1 (1.00) |
0.69 (1.00) |
0.664 (1.00) |
0.0829 (1.00) |
| 3p gain | 106 (19%) | 446 |
0.426 (1.00) |
0.0356 (1.00) |
0.575 (1.00) |
0.73 (1.00) |
0.814 (1.00) |
1 (1.00) |
| 4p gain | 30 (5%) | 522 |
0.272 (1.00) |
0.579 (1.00) |
1 (1.00) |
0.921 (1.00) |
0.782 (1.00) |
1 (1.00) |
| 4q gain | 17 (3%) | 535 |
0.522 (1.00) |
0.0845 (1.00) |
1 (1.00) |
0.921 (1.00) |
0.391 (1.00) |
1 (1.00) |
| 5p gain | 139 (25%) | 413 |
0.403 (1.00) |
0.313 (1.00) |
0.122 (1.00) |
0.791 (1.00) |
0.871 (1.00) |
1 (1.00) |
| 5q gain | 31 (6%) | 521 |
0.314 (1.00) |
0.939 (1.00) |
0.207 (1.00) |
0.137 (1.00) |
0.874 (1.00) |
1 (1.00) |
| 6p gain | 121 (22%) | 431 |
0.403 (1.00) |
0.00618 (1.00) |
0.629 (1.00) |
0.0337 (1.00) |
0.0703 (1.00) |
1 (1.00) |
| 6q gain | 61 (11%) | 491 |
0.515 (1.00) |
0.084 (1.00) |
1 (1.00) |
0.195 (1.00) |
0.0138 (1.00) |
1 (1.00) |
| 7p gain | 121 (22%) | 431 |
0.166 (1.00) |
0.00106 (0.497) |
1 (1.00) |
0.292 (1.00) |
0.414 (1.00) |
1 (1.00) |
| 7q gain | 144 (26%) | 408 |
0.129 (1.00) |
0.00887 (1.00) |
0.703 (1.00) |
0.276 (1.00) |
0.297 (1.00) |
0.571 (1.00) |
| 8p gain | 86 (16%) | 466 |
0.0775 (1.00) |
0.678 (1.00) |
1 (1.00) |
0.894 (1.00) |
0.429 (1.00) |
0.399 (1.00) |
| 8q gain | 202 (37%) | 350 |
0.175 (1.00) |
0.547 (1.00) |
0.249 (1.00) |
0.88 (1.00) |
0.224 (1.00) |
1 (1.00) |
| 9p gain | 59 (11%) | 493 |
0.754 (1.00) |
0.77 (1.00) |
1 (1.00) |
0.95 (1.00) |
0.694 (1.00) |
1 (1.00) |
| 9q gain | 26 (5%) | 526 |
0.937 (1.00) |
0.73 (1.00) |
1 (1.00) |
0.446 (1.00) |
1 (1.00) |
|
| 10q gain | 67 (12%) | 485 |
0.573 (1.00) |
0.0505 (1.00) |
0.405 (1.00) |
0.32 (1.00) |
0.393 (1.00) |
1 (1.00) |
| 11p gain | 41 (7%) | 511 |
0.622 (1.00) |
0.918 (1.00) |
1 (1.00) |
0.852 (1.00) |
0.151 (1.00) |
1 (1.00) |
| 11q gain | 59 (11%) | 493 |
0.363 (1.00) |
0.294 (1.00) |
1 (1.00) |
0.566 (1.00) |
0.249 (1.00) |
1 (1.00) |
| 13q gain | 39 (7%) | 513 |
0.719 (1.00) |
0.0197 (1.00) |
1 (1.00) |
0.476 (1.00) |
0.323 (1.00) |
0.198 (1.00) |
| 14q gain | 33 (6%) | 519 |
0.302 (1.00) |
0.792 (1.00) |
1 (1.00) |
0.497 (1.00) |
0.538 (1.00) |
0.169 (1.00) |
| 15q gain | 24 (4%) | 528 |
0.865 (1.00) |
0.356 (1.00) |
1 (1.00) |
0.032 (1.00) |
1 (1.00) |
|
| 16p gain | 32 (6%) | 520 |
0.621 (1.00) |
0.521 (1.00) |
1 (1.00) |
0.232 (1.00) |
0.196 (1.00) |
1 (1.00) |
| 16q gain | 16 (3%) | 536 |
0.672 (1.00) |
0.748 (1.00) |
1 (1.00) |
0.359 (1.00) |
1 (1.00) |
|
| 17p gain | 10 (2%) | 542 |
0.162 (1.00) |
0.0789 (1.00) |
1 (1.00) |
0.767 (1.00) |
0.564 (1.00) |
1 (1.00) |
| 17q gain | 23 (4%) | 529 |
0.0971 (1.00) |
0.177 (1.00) |
1 (1.00) |
0.614 (1.00) |
0.575 (1.00) |
1 (1.00) |
| 18p gain | 73 (13%) | 479 |
0.193 (1.00) |
0.166 (1.00) |
1 (1.00) |
0.341 (1.00) |
0.0086 (1.00) |
1 (1.00) |
| 18q gain | 41 (7%) | 511 |
0.255 (1.00) |
0.341 (1.00) |
1 (1.00) |
0.252 (1.00) |
0.0717 (1.00) |
0.207 (1.00) |
| 19p gain | 98 (18%) | 454 |
0.309 (1.00) |
0.0212 (1.00) |
1 (1.00) |
0.996 (1.00) |
0.258 (1.00) |
0.444 (1.00) |
| 19q gain | 90 (16%) | 462 |
0.139 (1.00) |
0.015 (1.00) |
1 (1.00) |
0.649 (1.00) |
0.286 (1.00) |
0.414 (1.00) |
| 21q gain | 67 (12%) | 485 |
0.00569 (1.00) |
0.0138 (1.00) |
0.405 (1.00) |
0.566 (1.00) |
0.868 (1.00) |
1 (1.00) |
| 22q gain | 9 (2%) | 543 |
0.593 (1.00) |
0.294 (1.00) |
1 (1.00) |
0.391 (1.00) |
1 (1.00) |
|
| Xq gain | 33 (6%) | 519 |
0.0927 (1.00) |
0.358 (1.00) |
1 (1.00) |
0.137 (1.00) |
0.975 (1.00) |
1 (1.00) |
| 1p loss | 34 (6%) | 518 |
0.85 (1.00) |
0.418 (1.00) |
1 (1.00) |
0.296 (1.00) |
0.709 (1.00) |
0.174 (1.00) |
| 1q loss | 22 (4%) | 530 |
0.338 (1.00) |
0.0896 (1.00) |
1 (1.00) |
0.22 (1.00) |
0.361 (1.00) |
0.115 (1.00) |
| 2p loss | 26 (5%) | 526 |
0.587 (1.00) |
0.835 (1.00) |
1 (1.00) |
0.0731 (1.00) |
0.474 (1.00) |
1 (1.00) |
| 2q loss | 30 (5%) | 522 |
0.729 (1.00) |
0.461 (1.00) |
0.201 (1.00) |
0.0731 (1.00) |
0.344 (1.00) |
1 (1.00) |
| 3p loss | 58 (11%) | 494 |
0.34 (1.00) |
0.104 (1.00) |
0.359 (1.00) |
0.321 (1.00) |
0.683 (1.00) |
0.284 (1.00) |
| 3q loss | 23 (4%) | 529 |
0.139 (1.00) |
0.837 (1.00) |
0.157 (1.00) |
0.607 (1.00) |
0.173 (1.00) |
0.12 (1.00) |
| 4p loss | 251 (45%) | 301 |
0.248 (1.00) |
0.325 (1.00) |
0.166 (1.00) |
0.106 (1.00) |
0.472 (1.00) |
0.594 (1.00) |
| 4q loss | 292 (53%) | 260 |
0.394 (1.00) |
0.182 (1.00) |
0.751 (1.00) |
0.952 (1.00) |
0.323 (1.00) |
1 (1.00) |
| 5p loss | 82 (15%) | 470 |
0.222 (1.00) |
0.0164 (1.00) |
0.475 (1.00) |
0.227 (1.00) |
0.332 (1.00) |
1 (1.00) |
| 5q loss | 167 (30%) | 385 |
0.579 (1.00) |
0.0923 (1.00) |
0.353 (1.00) |
0.42 (1.00) |
0.279 (1.00) |
1 (1.00) |
| 6p loss | 120 (22%) | 432 |
0.105 (1.00) |
0.00286 (1.00) |
0.626 (1.00) |
0.647 (1.00) |
0.453 (1.00) |
0.521 (1.00) |
| 6q loss | 188 (34%) | 364 |
0.42 (1.00) |
0.0083 (1.00) |
0.114 (1.00) |
0.309 (1.00) |
0.374 (1.00) |
1 (1.00) |
| 7p loss | 90 (16%) | 462 |
0.0921 (1.00) |
0.977 (1.00) |
0.51 (1.00) |
0.0336 (1.00) |
0.268 (1.00) |
1 (1.00) |
| 7q loss | 48 (9%) | 504 |
0.0369 (1.00) |
0.244 (1.00) |
0.306 (1.00) |
0.00339 (1.00) |
0.939 (1.00) |
0.239 (1.00) |
| 8p loss | 226 (41%) | 326 |
0.346 (1.00) |
0.0251 (1.00) |
0.145 (1.00) |
0.0388 (1.00) |
0.442 (1.00) |
1 (1.00) |
| 8q loss | 61 (11%) | 491 |
0.625 (1.00) |
0.0197 (1.00) |
1 (1.00) |
0.331 (1.00) |
0.0179 (1.00) |
1 (1.00) |
| 9p loss | 207 (38%) | 345 |
0.613 (1.00) |
0.0371 (1.00) |
0.13 (1.00) |
0.479 (1.00) |
0.485 (1.00) |
0.559 (1.00) |
| 10p loss | 62 (11%) | 490 |
0.768 (1.00) |
0.119 (1.00) |
1 (1.00) |
0.753 (1.00) |
0.915 (1.00) |
0.301 (1.00) |
| 10q loss | 87 (16%) | 465 |
0.757 (1.00) |
0.236 (1.00) |
1 (1.00) |
0.72 (1.00) |
0.46 (1.00) |
0.0038 (1.00) |
| 11p loss | 140 (25%) | 412 |
0.635 (1.00) |
0.0358 (1.00) |
1 (1.00) |
0.741 (1.00) |
0.458 (1.00) |
1 (1.00) |
| 11q loss | 105 (19%) | 447 |
0.912 (1.00) |
0.136 (1.00) |
0.571 (1.00) |
0.243 (1.00) |
0.356 (1.00) |
0.47 (1.00) |
| 12p loss | 49 (9%) | 503 |
0.8 (1.00) |
0.115 (1.00) |
1 (1.00) |
0.113 (1.00) |
0.0223 (1.00) |
1 (1.00) |
| 12q loss | 72 (13%) | 480 |
0.304 (1.00) |
0.429 (1.00) |
1 (1.00) |
0.695 (1.00) |
0.00584 (1.00) |
1 (1.00) |
| 13q loss | 251 (45%) | 301 |
0.326 (1.00) |
0.865 (1.00) |
0.458 (1.00) |
0.683 (1.00) |
0.167 (1.00) |
1 (1.00) |
| 14q loss | 160 (29%) | 392 |
0.392 (1.00) |
0.105 (1.00) |
1 (1.00) |
0.706 (1.00) |
0.0424 (1.00) |
0.56 (1.00) |
| 15q loss | 214 (39%) | 338 |
0.834 (1.00) |
0.046 (1.00) |
0.278 (1.00) |
0.65 (1.00) |
0.11 (1.00) |
0.563 (1.00) |
| 16p loss | 260 (47%) | 292 |
0.0794 (1.00) |
0.999 (1.00) |
0.472 (1.00) |
0.295 (1.00) |
0.239 (1.00) |
0.604 (1.00) |
| 16q loss | 346 (63%) | 206 |
0.208 (1.00) |
0.00297 (1.00) |
0.78 (1.00) |
0.0536 (1.00) |
0.372 (1.00) |
1 (1.00) |
| 17p loss | 415 (75%) | 137 |
0.988 (1.00) |
0.0143 (1.00) |
0.258 (1.00) |
0.883 (1.00) |
0.149 (1.00) |
0.576 (1.00) |
| 17q loss | 319 (58%) | 233 |
0.386 (1.00) |
0.0527 (1.00) |
1 (1.00) |
0.0547 (1.00) |
0.672 (1.00) |
0.267 (1.00) |
| 18p loss | 178 (32%) | 374 |
0.514 (1.00) |
0.772 (1.00) |
0.79 (1.00) |
0.752 (1.00) |
0.107 (1.00) |
0.244 (1.00) |
| 18q loss | 225 (41%) | 327 |
0.54 (1.00) |
0.906 (1.00) |
0.766 (1.00) |
0.65 (1.00) |
0.395 (1.00) |
0.57 (1.00) |
| 19p loss | 138 (25%) | 414 |
0.941 (1.00) |
0.082 (1.00) |
0.685 (1.00) |
0.485 (1.00) |
0.513 (1.00) |
1 (1.00) |
| 19q loss | 138 (25%) | 414 |
0.699 (1.00) |
0.613 (1.00) |
0.685 (1.00) |
0.407 (1.00) |
0.662 (1.00) |
0.577 (1.00) |
| 20p loss | 36 (7%) | 516 |
0.0307 (1.00) |
0.203 (1.00) |
1 (1.00) |
0.00339 (1.00) |
0.806 (1.00) |
0.183 (1.00) |
| 20q loss | 21 (4%) | 531 |
0.0406 (1.00) |
0.786 (1.00) |
1 (1.00) |
0.00339 (1.00) |
0.632 (1.00) |
1 (1.00) |
| 21q loss | 145 (26%) | 407 |
0.68 (1.00) |
0.921 (1.00) |
1 (1.00) |
0.508 (1.00) |
0.519 (1.00) |
1 (1.00) |
| 22q loss | 376 (68%) | 176 |
0.246 (1.00) |
0.211 (1.00) |
0.382 (1.00) |
0.954 (1.00) |
0.176 (1.00) |
0.555 (1.00) |
| Xq loss | 101 (18%) | 451 |
0.228 (1.00) |
0.752 (1.00) |
0.555 (1.00) |
0.485 (1.00) |
0.879 (1.00) |
1 (1.00) |
P value = 2.59e-07 (t-test), Q value = 0.00012
Table S1. Gene #3: '2p gain mutation analysis' versus Clinical Feature #2: 'AGE'
| nPatients | Mean (Std.Dev) | |
|---|---|---|
| ALL | 541 | 59.8 (11.6) |
| 2P GAIN MUTATED | 122 | 64.5 (11.0) |
| 2P GAIN WILD-TYPE | 419 | 58.4 (11.4) |
Figure S1. Get High-res Image Gene #3: '2p gain mutation analysis' versus Clinical Feature #2: 'AGE'
P value = 1.36e-06 (t-test), Q value = 0.00064
Table S2. Gene #6: '3q gain mutation analysis' versus Clinical Feature #2: 'AGE'
| nPatients | Mean (Std.Dev) | |
|---|---|---|
| ALL | 541 | 59.8 (11.6) |
| 3Q GAIN MUTATED | 200 | 62.9 (11.1) |
| 3Q GAIN WILD-TYPE | 341 | 58.0 (11.5) |
Figure S2. Get High-res Image Gene #6: '3q gain mutation analysis' versus Clinical Feature #2: 'AGE'

P value = 3.24e-05 (t-test), Q value = 0.015
Table S3. Gene #19: '10p gain mutation analysis' versus Clinical Feature #2: 'AGE'
| nPatients | Mean (Std.Dev) | |
|---|---|---|
| ALL | 541 | 59.8 (11.6) |
| 10P GAIN MUTATED | 127 | 63.4 (10.7) |
| 10P GAIN WILD-TYPE | 414 | 58.7 (11.7) |
Figure S3. Get High-res Image Gene #19: '10p gain mutation analysis' versus Clinical Feature #2: 'AGE'
P value = 3.85e-08 (t-test), Q value = 1.8e-05
Table S4. Gene #23: '12p gain mutation analysis' versus Clinical Feature #2: 'AGE'
| nPatients | Mean (Std.Dev) | |
|---|---|---|
| ALL | 541 | 59.8 (11.6) |
| 12P GAIN MUTATED | 196 | 63.4 (11.2) |
| 12P GAIN WILD-TYPE | 345 | 57.8 (11.4) |
Figure S4. Get High-res Image Gene #23: '12p gain mutation analysis' versus Clinical Feature #2: 'AGE'

P value = 3.77e-06 (t-test), Q value = 0.0018
Table S5. Gene #24: '12q gain mutation analysis' versus Clinical Feature #2: 'AGE'
| nPatients | Mean (Std.Dev) | |
|---|---|---|
| ALL | 541 | 59.8 (11.6) |
| 12Q GAIN MUTATED | 112 | 64.1 (10.5) |
| 12Q GAIN WILD-TYPE | 429 | 58.7 (11.6) |
Figure S5. Get High-res Image Gene #24: '12q gain mutation analysis' versus Clinical Feature #2: 'AGE'

P value = 1.44e-06 (t-test), Q value = 0.00068
Table S6. Gene #36: '20p gain mutation analysis' versus Clinical Feature #2: 'AGE'
| nPatients | Mean (Std.Dev) | |
|---|---|---|
| ALL | 541 | 59.8 (11.6) |
| 20P GAIN MUTATED | 226 | 62.6 (11.4) |
| 20P GAIN WILD-TYPE | 315 | 57.8 (11.3) |
Figure S6. Get High-res Image Gene #36: '20p gain mutation analysis' versus Clinical Feature #2: 'AGE'

P value = 4.38e-07 (t-test), Q value = 0.00021
Table S7. Gene #37: '20q gain mutation analysis' versus Clinical Feature #2: 'AGE'
| nPatients | Mean (Std.Dev) | |
|---|---|---|
| ALL | 541 | 59.8 (11.6) |
| 20Q GAIN MUTATED | 262 | 62.4 (11.8) |
| 20Q GAIN WILD-TYPE | 279 | 57.4 (10.9) |
Figure S7. Get High-res Image Gene #37: '20q gain mutation analysis' versus Clinical Feature #2: 'AGE'
P value = 3.28e-06 (t-test), Q value = 0.0015
Table S8. Gene #58: '9q loss mutation analysis' versus Clinical Feature #2: 'AGE'
| nPatients | Mean (Std.Dev) | |
|---|---|---|
| ALL | 541 | 59.8 (11.6) |
| 9Q LOSS MUTATED | 229 | 62.5 (11.3) |
| 9Q LOSS WILD-TYPE | 312 | 57.8 (11.4) |
Figure S8. Get High-res Image Gene #58: '9q loss mutation analysis' versus Clinical Feature #2: 'AGE'

-
Mutation data file = broad_values_by_arm.mutsig.cluster.txt
-
Clinical data file = OV-TP.clin.merged.picked.txt
-
Number of patients = 552
-
Number of significantly arm-level cnvs = 80
-
Number of selected clinical features = 6
-
Exclude genes that fewer than K tumors have mutations, K = 3
For survival clinical features, the Kaplan-Meier survival curves of tumors with and without gene mutations were plotted and the statistical significance P values were estimated by logrank test (Bland and Altman 2004) using the 'survdiff' function in R
For continuous numerical clinical features, two-tailed Student's t test with unequal variance (Lehmann and Romano 2005) was applied to compare the clinical values between tumors with and without gene mutations using 't.test' function in R
For binary or multi-class clinical features (nominal or ordinal), two-tailed Fisher's exact tests (Fisher 1922) were used to estimate the P values using the 'fisher.test' function in R
For multiple hypothesis correction, Q value is the False Discovery Rate (FDR) analogue of the P value (Benjamini and Hochberg 1995), defined as the minimum FDR at which the test may be called significant. We used the 'Benjamini and Hochberg' method of 'p.adjust' function in R to convert P values into Q values.
This is an experimental feature. The full results of the analysis summarized in this report can be downloaded from the TCGA Data Coordination Center.