(metastatic tumor cohort)
This pipeline computes the correlation between significantly recurrent gene mutations and selected clinical features.
Testing the association between mutation status of 149 genes and 3 clinical features across 139 patients, 2 significant findings detected with Q value < 0.25.
-
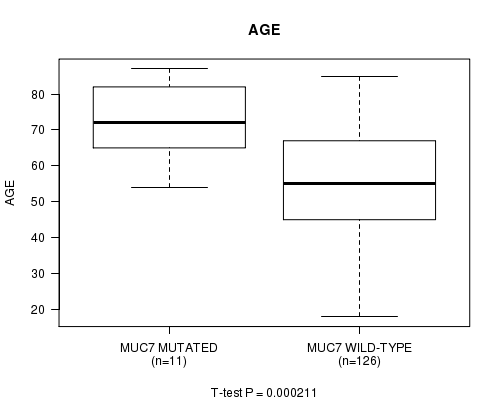
MUC7 mutation correlated to 'AGE'.
-
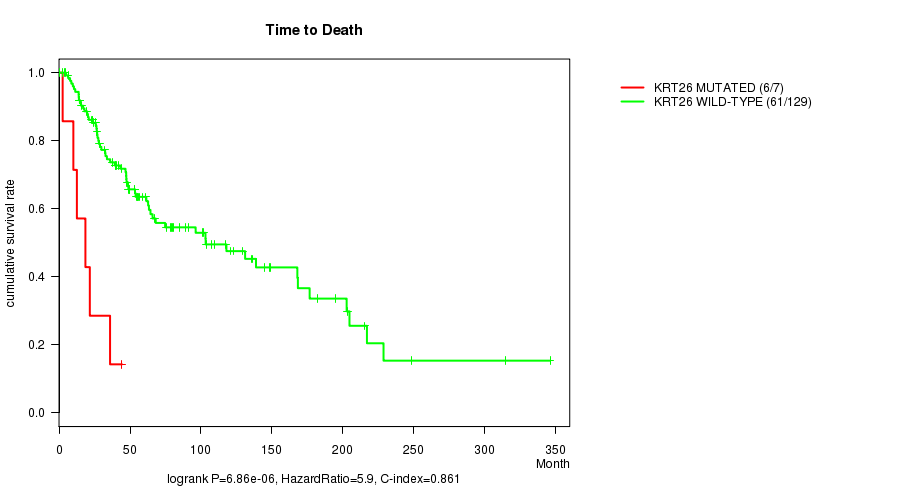
KRT26 mutation correlated to 'Time to Death'.
Table 1. Get Full Table Overview of the association between mutation status of 149 genes and 3 clinical features. Shown in the table are P values (Q values). Thresholded by Q value < 0.25, 2 significant findings detected.
|
Clinical Features |
Time to Death |
AGE | GENDER | ||
| nMutated (%) | nWild-Type | logrank test | t-test | Fisher's exact test | |
| MUC7 | 11 (8%) | 128 |
0.495 (1.00) |
0.000211 (0.0941) |
0.746 (1.00) |
| KRT26 | 7 (5%) | 132 |
6.86e-06 (0.00307) |
0.741 (1.00) |
1 (1.00) |
| BRAF | 69 (50%) | 70 |
0.123 (1.00) |
0.0503 (1.00) |
1 (1.00) |
| NRAS | 43 (31%) | 96 |
0.8 (1.00) |
0.164 (1.00) |
0.85 (1.00) |
| CDKN2A | 21 (15%) | 118 |
0.638 (1.00) |
0.532 (1.00) |
1 (1.00) |
| TP53 | 25 (18%) | 114 |
0.464 (1.00) |
0.0985 (1.00) |
0.819 (1.00) |
| PTEN | 9 (6%) | 130 |
0.857 (1.00) |
0.798 (1.00) |
0.725 (1.00) |
| ACSM2B | 28 (20%) | 111 |
0.146 (1.00) |
0.952 (1.00) |
0.00764 (1.00) |
| LCE1B | 9 (6%) | 130 |
0.586 (1.00) |
0.671 (1.00) |
0.725 (1.00) |
| CADM2 | 15 (11%) | 124 |
0.792 (1.00) |
0.888 (1.00) |
1 (1.00) |
| NAP1L2 | 12 (9%) | 127 |
0.689 (1.00) |
0.0733 (1.00) |
0.759 (1.00) |
| RAC1 | 11 (8%) | 128 |
0.0429 (1.00) |
0.537 (1.00) |
1 (1.00) |
| OR51S1 | 16 (12%) | 123 |
0.415 (1.00) |
0.54 (1.00) |
1 (1.00) |
| FUT9 | 16 (12%) | 123 |
0.954 (1.00) |
0.0278 (1.00) |
1 (1.00) |
| PPP6C | 13 (9%) | 126 |
0.0385 (1.00) |
0.767 (1.00) |
0.768 (1.00) |
| USP29 | 25 (18%) | 114 |
0.0456 (1.00) |
0.092 (1.00) |
0.367 (1.00) |
| RPTN | 22 (16%) | 117 |
0.545 (1.00) |
0.373 (1.00) |
0.81 (1.00) |
| TAF1A | 8 (6%) | 131 |
0.275 (1.00) |
0.577 (1.00) |
0.465 (1.00) |
| CDH9 | 25 (18%) | 114 |
0.333 (1.00) |
0.469 (1.00) |
1 (1.00) |
| GRXCR1 | 14 (10%) | 125 |
0.405 (1.00) |
0.0188 (1.00) |
0.573 (1.00) |
| HIST1H2AA | 7 (5%) | 132 |
0.901 (1.00) |
0.99 (1.00) |
0.707 (1.00) |
| ZNF679 | 14 (10%) | 125 |
0.952 (1.00) |
0.434 (1.00) |
0.573 (1.00) |
| C8A | 17 (12%) | 122 |
0.00454 (1.00) |
0.00429 (1.00) |
0.0299 (1.00) |
| RBM11 | 10 (7%) | 129 |
0.69 (1.00) |
0.288 (1.00) |
0.746 (1.00) |
| ZNF479 | 12 (9%) | 127 |
0.36 (1.00) |
0.0896 (1.00) |
0.759 (1.00) |
| GFRAL | 20 (14%) | 119 |
0.473 (1.00) |
0.643 (1.00) |
1 (1.00) |
| DDX3X | 15 (11%) | 124 |
0.613 (1.00) |
0.467 (1.00) |
0.256 (1.00) |
| OR4M2 | 16 (12%) | 123 |
0.65 (1.00) |
0.0859 (1.00) |
1 (1.00) |
| FRG2B | 10 (7%) | 129 |
0.503 (1.00) |
0.0228 (1.00) |
0.498 (1.00) |
| PDE1A | 23 (17%) | 116 |
0.309 (1.00) |
0.162 (1.00) |
1 (1.00) |
| PRB2 | 21 (15%) | 118 |
0.548 (1.00) |
0.0129 (1.00) |
0.0867 (1.00) |
| LUZP2 | 12 (9%) | 127 |
0.651 (1.00) |
0.908 (1.00) |
0.759 (1.00) |
| NRK | 18 (13%) | 121 |
0.34 (1.00) |
0.821 (1.00) |
0.8 (1.00) |
| PARM1 | 11 (8%) | 128 |
0.00851 (1.00) |
0.214 (1.00) |
1 (1.00) |
| SLC38A4 | 16 (12%) | 123 |
0.786 (1.00) |
0.352 (1.00) |
0.168 (1.00) |
| PRAMEF11 | 12 (9%) | 127 |
0.187 (1.00) |
0.151 (1.00) |
0.759 (1.00) |
| USP17L2 | 13 (9%) | 126 |
0.64 (1.00) |
0.928 (1.00) |
0.373 (1.00) |
| PRB1 | 12 (9%) | 127 |
0.33 (1.00) |
0.554 (1.00) |
0.21 (1.00) |
| CYLC2 | 16 (12%) | 123 |
0.616 (1.00) |
0.104 (1.00) |
0.785 (1.00) |
| DSG3 | 33 (24%) | 106 |
0.649 (1.00) |
0.134 (1.00) |
0.416 (1.00) |
| VEGFC | 11 (8%) | 128 |
0.943 (1.00) |
0.414 (1.00) |
1 (1.00) |
| IL32 | 5 (4%) | 134 |
0.0263 (1.00) |
0.484 (1.00) |
1 (1.00) |
| LILRB4 | 21 (15%) | 118 |
0.24 (1.00) |
0.385 (1.00) |
0.81 (1.00) |
| GLRB | 15 (11%) | 124 |
0.478 (1.00) |
0.114 (1.00) |
1 (1.00) |
| STXBP5L | 29 (21%) | 110 |
0.12 (1.00) |
0.538 (1.00) |
0.523 (1.00) |
| GML | 8 (6%) | 131 |
0.932 (1.00) |
0.117 (1.00) |
0.258 (1.00) |
| TLL1 | 30 (22%) | 109 |
0.373 (1.00) |
0.235 (1.00) |
0.522 (1.00) |
| DEFB118 | 6 (4%) | 133 |
0.141 (1.00) |
0.435 (1.00) |
1 (1.00) |
| GK2 | 17 (12%) | 122 |
0.199 (1.00) |
0.968 (1.00) |
1 (1.00) |
| OR5J2 | 10 (7%) | 129 |
0.824 (1.00) |
0.942 (1.00) |
0.171 (1.00) |
| LIN7A | 8 (6%) | 131 |
0.412 (1.00) |
0.736 (1.00) |
0.71 (1.00) |
| MUM1L1 | 13 (9%) | 126 |
0.357 (1.00) |
0.55 (1.00) |
0.768 (1.00) |
| MARCH11 | 7 (5%) | 132 |
0.336 (1.00) |
0.954 (1.00) |
1 (1.00) |
| PSG4 | 15 (11%) | 124 |
0.969 (1.00) |
0.462 (1.00) |
0.783 (1.00) |
| ZIM3 | 12 (9%) | 127 |
0.0468 (1.00) |
0.968 (1.00) |
0.535 (1.00) |
| CLEC14A | 14 (10%) | 125 |
0.262 (1.00) |
0.905 (1.00) |
0.255 (1.00) |
| OR5H2 | 11 (8%) | 128 |
0.421 (1.00) |
0.032 (1.00) |
0.532 (1.00) |
| TCEB3C | 20 (14%) | 119 |
0.508 (1.00) |
0.148 (1.00) |
0.0429 (1.00) |
| PRB4 | 16 (12%) | 123 |
0.137 (1.00) |
0.263 (1.00) |
0.412 (1.00) |
| KLHL4 | 14 (10%) | 125 |
0.147 (1.00) |
0.666 (1.00) |
0.381 (1.00) |
| OR52J3 | 8 (6%) | 131 |
0.149 (1.00) |
0.425 (1.00) |
1 (1.00) |
| HBD | 8 (6%) | 131 |
0.0833 (1.00) |
0.632 (1.00) |
0.465 (1.00) |
| FAM19A1 | 7 (5%) | 132 |
0.338 (1.00) |
0.978 (1.00) |
0.707 (1.00) |
| LRRIQ4 | 14 (10%) | 125 |
0.449 (1.00) |
0.152 (1.00) |
0.381 (1.00) |
| SPINK13 | 4 (3%) | 135 |
0.182 (1.00) |
0.341 (1.00) |
1 (1.00) |
| SNAP91 | 17 (12%) | 122 |
0.913 (1.00) |
0.0687 (1.00) |
0.289 (1.00) |
| LONRF2 | 10 (7%) | 129 |
0.0751 (1.00) |
0.888 (1.00) |
0.746 (1.00) |
| CLCC1 | 7 (5%) | 132 |
0.127 (1.00) |
0.54 (1.00) |
1 (1.00) |
| KIAA1257 | 7 (5%) | 132 |
0.0824 (1.00) |
0.0293 (1.00) |
0.423 (1.00) |
| SIGLEC14 | 6 (4%) | 133 |
0.872 (1.00) |
0.165 (1.00) |
0.0854 (1.00) |
| SPANXN2 | 12 (9%) | 127 |
0.0283 (1.00) |
0.776 (1.00) |
0.535 (1.00) |
| DEFB112 | 5 (4%) | 134 |
0.307 (1.00) |
0.282 (1.00) |
1 (1.00) |
| CD2 | 14 (10%) | 125 |
0.592 (1.00) |
0.357 (1.00) |
0.771 (1.00) |
| HTR3B | 9 (6%) | 130 |
0.0558 (1.00) |
0.889 (1.00) |
0.154 (1.00) |
| KIR2DL1 | 9 (6%) | 130 |
0.412 (1.00) |
0.354 (1.00) |
0.725 (1.00) |
| OR4N2 | 17 (12%) | 122 |
0.832 (1.00) |
0.373 (1.00) |
0.0299 (1.00) |
| ST18 | 27 (19%) | 112 |
0.791 (1.00) |
0.387 (1.00) |
0.825 (1.00) |
| TUBB8 | 7 (5%) | 132 |
0.898 (1.00) |
0.202 (1.00) |
1 (1.00) |
| C2ORF40 | 4 (3%) | 135 |
0.732 (1.00) |
0.414 (1.00) |
0.624 (1.00) |
| PRR23B | 9 (6%) | 130 |
0.374 (1.00) |
0.421 (1.00) |
0.725 (1.00) |
| TFEC | 12 (9%) | 127 |
0.199 (1.00) |
0.0329 (1.00) |
0.759 (1.00) |
| SGCZ | 15 (11%) | 124 |
0.0793 (1.00) |
0.868 (1.00) |
1 (1.00) |
| TRAT1 | 9 (6%) | 130 |
0.04 (1.00) |
0.681 (1.00) |
0.725 (1.00) |
| TRIM58 | 12 (9%) | 127 |
0.415 (1.00) |
0.00268 (1.00) |
1 (1.00) |
| ANXA10 | 9 (6%) | 130 |
0.346 (1.00) |
0.248 (1.00) |
0.486 (1.00) |
| ZNF844 | 4 (3%) | 135 |
0.426 (1.00) |
0.0198 (1.00) |
0.624 (1.00) |
| SLC14A1 | 10 (7%) | 129 |
0.693 (1.00) |
0.129 (1.00) |
0.0136 (1.00) |
| C9 | 11 (8%) | 128 |
0.462 (1.00) |
0.897 (1.00) |
0.532 (1.00) |
| DSG1 | 21 (15%) | 118 |
0.105 (1.00) |
0.397 (1.00) |
1 (1.00) |
| CCDC11 | 13 (9%) | 126 |
0.783 (1.00) |
0.962 (1.00) |
1 (1.00) |
| MKX | 10 (7%) | 129 |
0.476 (1.00) |
0.837 (1.00) |
0.746 (1.00) |
| OR7D2 | 13 (9%) | 126 |
0.925 (1.00) |
0.522 (1.00) |
0.373 (1.00) |
| STARD6 | 5 (4%) | 134 |
0.848 (1.00) |
0.0446 (1.00) |
1 (1.00) |
| SPATA8 | 5 (4%) | 134 |
0.576 (1.00) |
0.0871 (1.00) |
0.356 (1.00) |
| GRXCR2 | 11 (8%) | 128 |
0.38 (1.00) |
0.756 (1.00) |
1 (1.00) |
| OR4A15 | 14 (10%) | 125 |
0.983 (1.00) |
0.0485 (1.00) |
0.0827 (1.00) |
| C4ORF22 | 8 (6%) | 131 |
0.281 (1.00) |
0.614 (1.00) |
0.71 (1.00) |
| CCDC54 | 10 (7%) | 129 |
0.468 (1.00) |
0.699 (1.00) |
0.325 (1.00) |
| CRISP2 | 8 (6%) | 131 |
0.955 (1.00) |
0.0943 (1.00) |
0.465 (1.00) |
| MOG | 6 (4%) | 133 |
0.866 (1.00) |
0.0659 (1.00) |
0.414 (1.00) |
| NMS | 7 (5%) | 132 |
0.948 (1.00) |
0.169 (1.00) |
0.707 (1.00) |
| DEFB115 | 5 (4%) | 134 |
0.935 (1.00) |
0.515 (1.00) |
0.158 (1.00) |
| UGT2A3 | 12 (9%) | 127 |
0.999 (1.00) |
0.476 (1.00) |
0.535 (1.00) |
| ZNF98 | 12 (9%) | 127 |
0.16 (1.00) |
0.826 (1.00) |
0.759 (1.00) |
| ADH1C | 22 (16%) | 117 |
0.628 (1.00) |
0.242 (1.00) |
0.81 (1.00) |
| HBG2 | 6 (4%) | 133 |
0.626 (1.00) |
0.254 (1.00) |
1 (1.00) |
| HHLA2 | 9 (6%) | 130 |
0.649 (1.00) |
0.333 (1.00) |
1 (1.00) |
| IDH1 | 7 (5%) | 132 |
0.802 (1.00) |
0.0116 (1.00) |
0.261 (1.00) |
| OR2L3 | 10 (7%) | 129 |
0.477 (1.00) |
0.703 (1.00) |
0.746 (1.00) |
| OR4F6 | 10 (7%) | 129 |
0.166 (1.00) |
0.314 (1.00) |
0.325 (1.00) |
| B2M | 4 (3%) | 135 |
0.685 (1.00) |
0.388 (1.00) |
0.296 (1.00) |
| ARID2 | 20 (14%) | 119 |
0.22 (1.00) |
0.151 (1.00) |
0.319 (1.00) |
| LOC649330 | 16 (12%) | 123 |
0.288 (1.00) |
0.0226 (1.00) |
0.785 (1.00) |
| OR5AC2 | 14 (10%) | 125 |
0.916 (1.00) |
0.764 (1.00) |
0.573 (1.00) |
| OR5H14 | 7 (5%) | 132 |
0.357 (1.00) |
0.83 (1.00) |
0.0472 (1.00) |
| SPAG16 | 12 (9%) | 127 |
0.251 (1.00) |
0.511 (1.00) |
0.21 (1.00) |
| SPRY3 | 8 (6%) | 131 |
0.273 (1.00) |
0.289 (1.00) |
1 (1.00) |
| STK31 | 22 (16%) | 117 |
0.825 (1.00) |
0.711 (1.00) |
1 (1.00) |
| TACR3 | 13 (9%) | 126 |
0.178 (1.00) |
0.951 (1.00) |
0.768 (1.00) |
| SERPINB4 | 18 (13%) | 121 |
0.969 (1.00) |
0.153 (1.00) |
0.0695 (1.00) |
| TSGA13 | 6 (4%) | 133 |
0.307 (1.00) |
0.908 (1.00) |
0.414 (1.00) |
| GIMAP7 | 11 (8%) | 128 |
0.816 (1.00) |
0.0828 (1.00) |
0.328 (1.00) |
| SDR16C5 | 18 (13%) | 121 |
0.603 (1.00) |
0.121 (1.00) |
0.446 (1.00) |
| SPOCK3 | 16 (12%) | 123 |
0.739 (1.00) |
0.565 (1.00) |
0.0507 (1.00) |
| TRHR | 15 (11%) | 124 |
0.154 (1.00) |
0.377 (1.00) |
1 (1.00) |
| CD96 | 10 (7%) | 129 |
0.92 (1.00) |
0.451 (1.00) |
1 (1.00) |
| CLEC4E | 10 (7%) | 129 |
0.447 (1.00) |
0.245 (1.00) |
0.498 (1.00) |
| TPTE | 36 (26%) | 103 |
0.702 (1.00) |
0.199 (1.00) |
0.691 (1.00) |
| MCART6 | 7 (5%) | 132 |
0.763 (1.00) |
0.077 (1.00) |
1 (1.00) |
| OR2W1 | 12 (9%) | 127 |
0.726 (1.00) |
0.0799 (1.00) |
0.357 (1.00) |
| MORF4 | 10 (7%) | 129 |
0.527 (1.00) |
0.829 (1.00) |
0.746 (1.00) |
| RGS18 | 7 (5%) | 132 |
0.981 (1.00) |
0.35 (1.00) |
0.0472 (1.00) |
| BAGE2 | 9 (6%) | 130 |
0.806 (1.00) |
0.916 (1.00) |
0.725 (1.00) |
| KIAA1644 | 4 (3%) | 135 |
0.388 (1.00) |
0.24 (1.00) |
1 (1.00) |
| AGXT2 | 14 (10%) | 125 |
0.205 (1.00) |
0.452 (1.00) |
1 (1.00) |
| CLDN4 | 7 (5%) | 132 |
0.914 (1.00) |
0.0532 (1.00) |
0.707 (1.00) |
| CDH10 | 21 (15%) | 118 |
0.0274 (1.00) |
0.99 (1.00) |
0.81 (1.00) |
| VWC2L | 11 (8%) | 128 |
0.777 (1.00) |
0.884 (1.00) |
1 (1.00) |
| ABRA | 10 (7%) | 129 |
0.0738 (1.00) |
0.062 (1.00) |
0.325 (1.00) |
| ARPP21 | 23 (17%) | 116 |
0.126 (1.00) |
0.0809 (1.00) |
0.154 (1.00) |
| NR1H4 | 8 (6%) | 131 |
0.37 (1.00) |
0.287 (1.00) |
0.71 (1.00) |
| GZMA | 8 (6%) | 131 |
0.964 (1.00) |
0.376 (1.00) |
0.71 (1.00) |
| DGAT2L6 | 8 (6%) | 131 |
0.504 (1.00) |
0.459 (1.00) |
1 (1.00) |
| TMCO5A | 6 (4%) | 133 |
0.392 (1.00) |
0.275 (1.00) |
0.414 (1.00) |
| CCNE2 | 7 (5%) | 132 |
0.136 (1.00) |
0.73 (1.00) |
0.707 (1.00) |
| CCK | 5 (4%) | 134 |
0.128 (1.00) |
0.744 (1.00) |
0.652 (1.00) |
| ADAMTS20 | 35 (25%) | 104 |
0.391 (1.00) |
0.13 (1.00) |
0.312 (1.00) |
| MPP7 | 17 (12%) | 122 |
0.86 (1.00) |
0.0249 (1.00) |
0.599 (1.00) |
| FAM155A | 9 (6%) | 130 |
0.193 (1.00) |
0.595 (1.00) |
0.288 (1.00) |
P value = 0.000211 (t-test), Q value = 0.094
Table S1. Gene #11: 'MUC7 MUTATION STATUS' versus Clinical Feature #2: 'AGE'
| nPatients | Mean (Std.Dev) | |
|---|---|---|
| ALL | 137 | 56.5 (16.2) |
| MUC7 MUTATED | 11 | 72.7 (10.9) |
| MUC7 WILD-TYPE | 126 | 55.0 (15.8) |
Figure S1. Get High-res Image Gene #11: 'MUC7 MUTATION STATUS' versus Clinical Feature #2: 'AGE'
P value = 6.86e-06 (logrank test), Q value = 0.0031
Table S2. Gene #144: 'KRT26 MUTATION STATUS' versus Clinical Feature #1: 'Time to Death'
| nPatients | nDeath | Duration Range (Median), Month | |
|---|---|---|---|
| ALL | 136 | 67 | 0.2 - 346.0 (47.5) |
| KRT26 MUTATED | 7 | 6 | 2.6 - 44.4 (18.6) |
| KRT26 WILD-TYPE | 129 | 61 | 0.2 - 346.0 (48.9) |
Figure S2. Get High-res Image Gene #144: 'KRT26 MUTATION STATUS' versus Clinical Feature #1: 'Time to Death'
-
Mutation data file = SKCM-TM.mutsig.cluster.txt
-
Clinical data file = SKCM-TP.clin.merged.picked.txt
-
Number of patients = 139
-
Number of significantly mutated genes = 149
-
Number of selected clinical features = 3
-
Exclude genes that fewer than K tumors have mutations, K = 3
For survival clinical features, the Kaplan-Meier survival curves of tumors with and without gene mutations were plotted and the statistical significance P values were estimated by logrank test (Bland and Altman 2004) using the 'survdiff' function in R
For continuous numerical clinical features, two-tailed Student's t test with unequal variance (Lehmann and Romano 2005) was applied to compare the clinical values between tumors with and without gene mutations using 't.test' function in R
For binary or multi-class clinical features (nominal or ordinal), two-tailed Fisher's exact tests (Fisher 1922) were used to estimate the P values using the 'fisher.test' function in R
For multiple hypothesis correction, Q value is the False Discovery Rate (FDR) analogue of the P value (Benjamini and Hochberg 1995), defined as the minimum FDR at which the test may be called significant. We used the 'Benjamini and Hochberg' method of 'p.adjust' function in R to convert P values into Q values.
This is an experimental feature. The full results of the analysis summarized in this report can be downloaded from the TCGA Data Coordination Center.