This pipeline computes the correlation between significant arm-level copy number variations (cnvs) and subtypes.
Testing the association between copy number variation 79 arm-level results and 8 molecular subtypes across 322 patients, 59 significant findings detected with Q value < 0.25.
-
2p gain cnv correlated to 'CN_CNMF' and 'METHLYATION_CNMF'.
-
3p gain cnv correlated to 'CN_CNMF' and 'METHLYATION_CNMF'.
-
3q gain cnv correlated to 'CN_CNMF' and 'METHLYATION_CNMF'.
-
5p gain cnv correlated to 'CN_CNMF'.
-
7p gain cnv correlated to 'CN_CNMF' and 'METHLYATION_CNMF'.
-
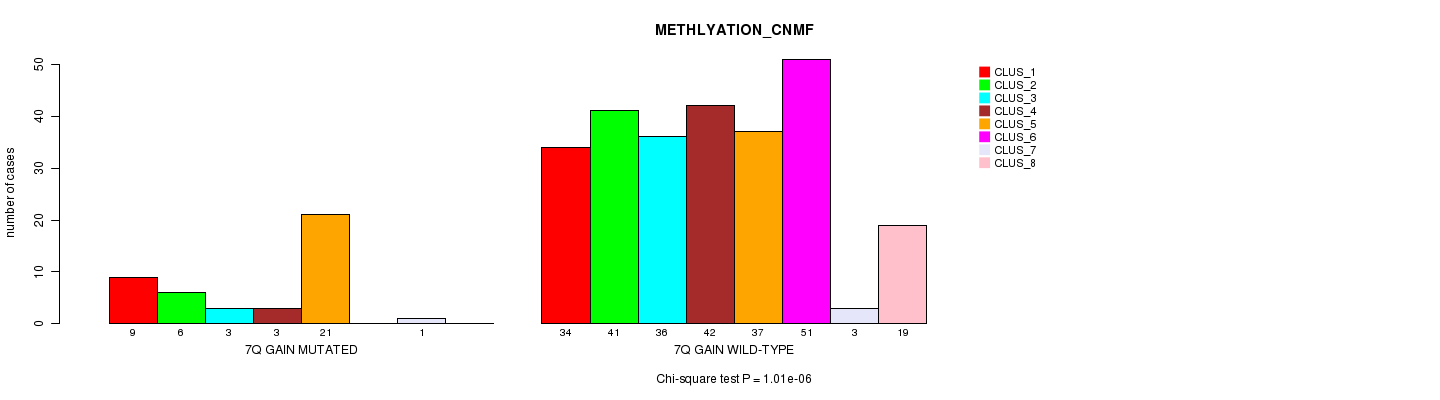
7q gain cnv correlated to 'CN_CNMF' and 'METHLYATION_CNMF'.
-
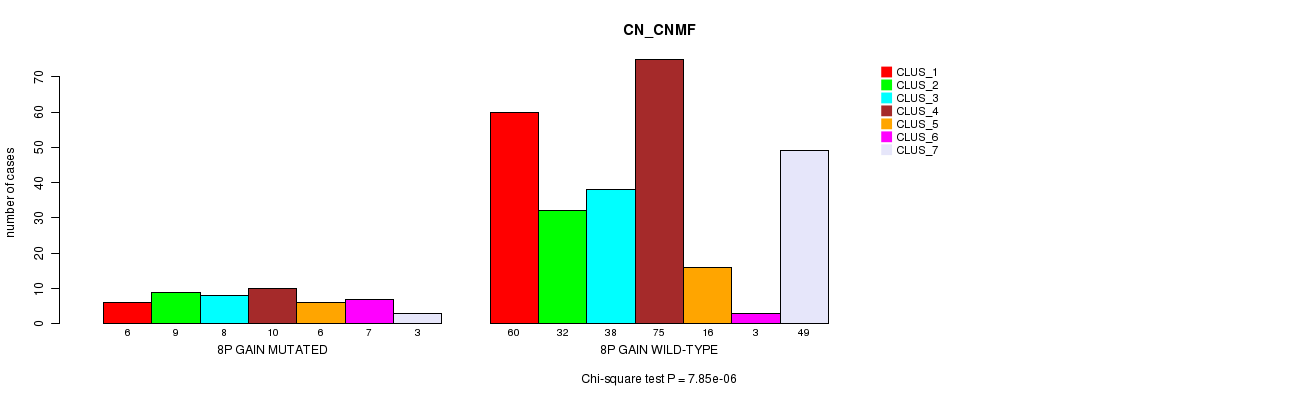
8p gain cnv correlated to 'CN_CNMF'.
-
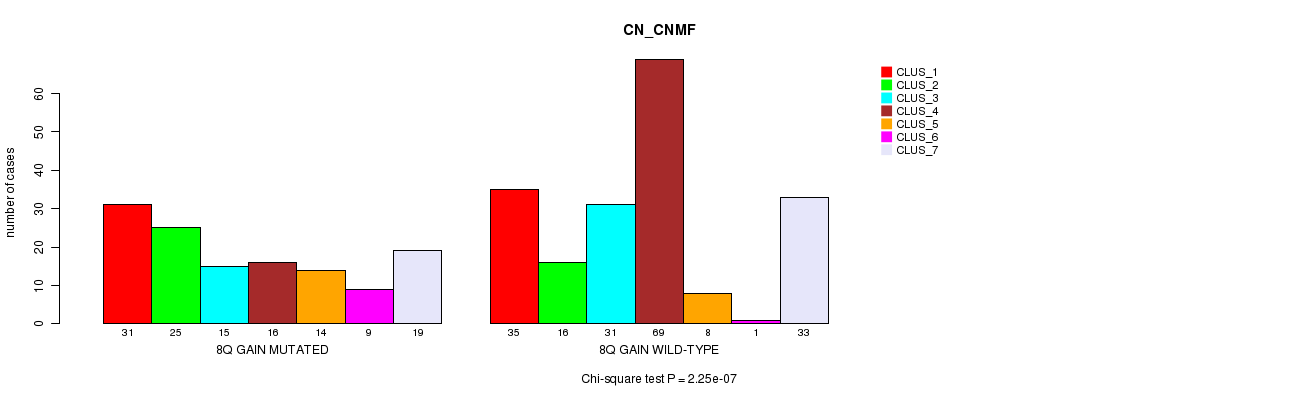
8q gain cnv correlated to 'CN_CNMF' and 'METHLYATION_CNMF'.
-
9p gain cnv correlated to 'CN_CNMF'.
-
9q gain cnv correlated to 'CN_CNMF'.
-
12p gain cnv correlated to 'CN_CNMF', 'METHLYATION_CNMF', and 'MIRSEQ_CNMF'.
-
14q gain cnv correlated to 'CN_CNMF'.
-
16p gain cnv correlated to 'METHLYATION_CNMF'.
-
18p gain cnv correlated to 'CN_CNMF'.
-
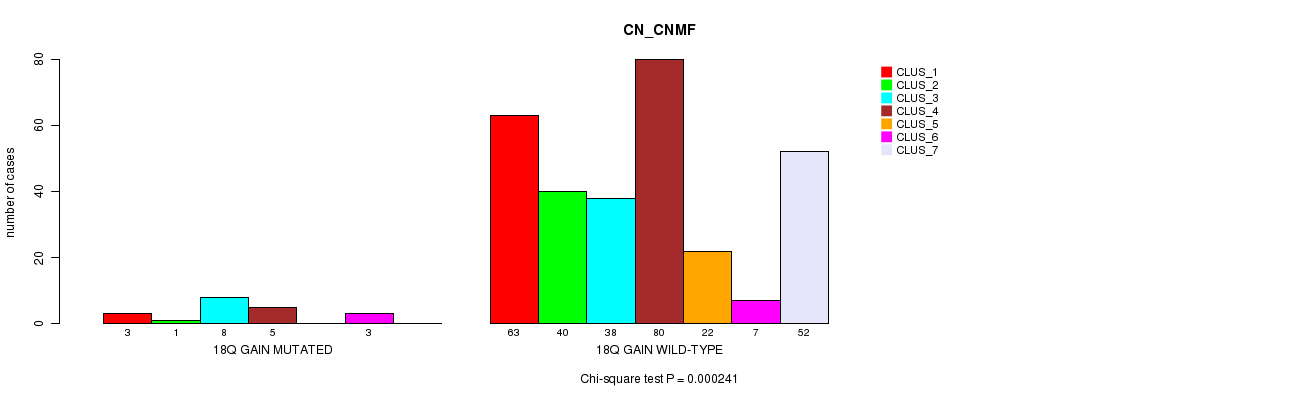
18q gain cnv correlated to 'CN_CNMF' and 'METHLYATION_CNMF'.
-
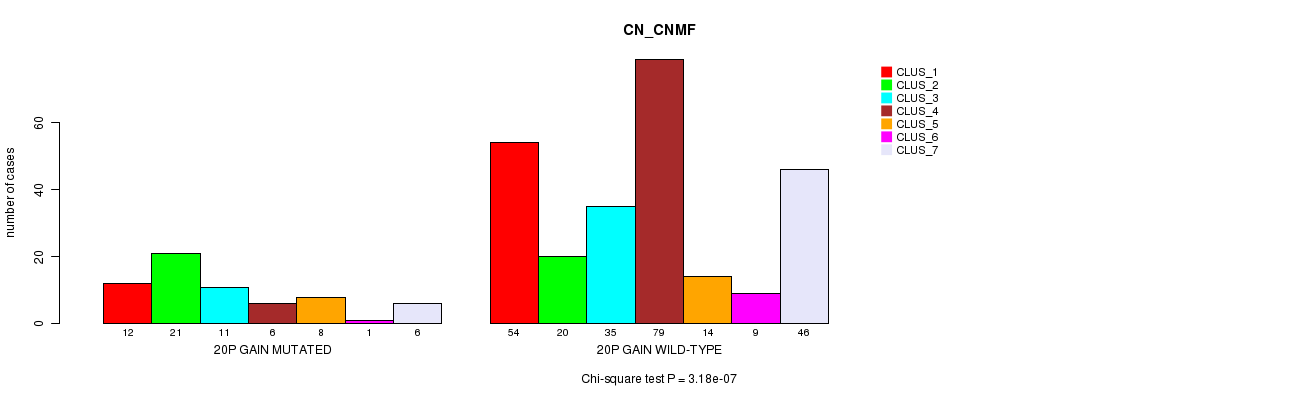
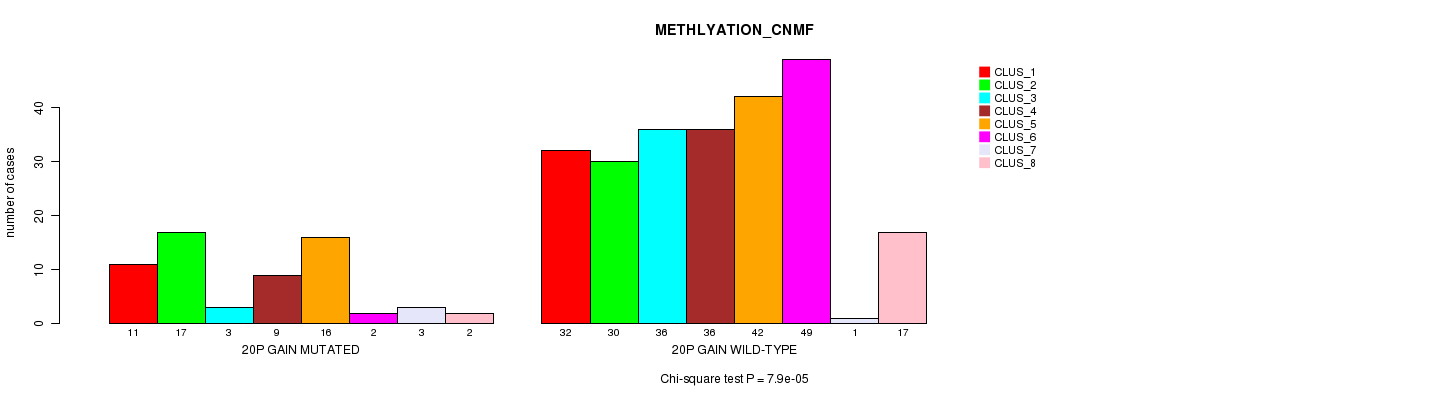
20p gain cnv correlated to 'CN_CNMF' and 'METHLYATION_CNMF'.
-
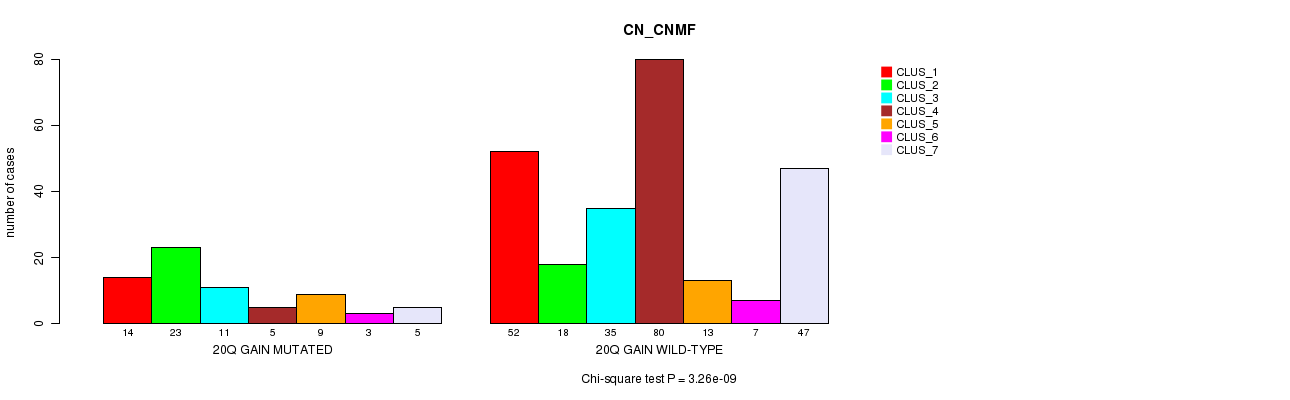
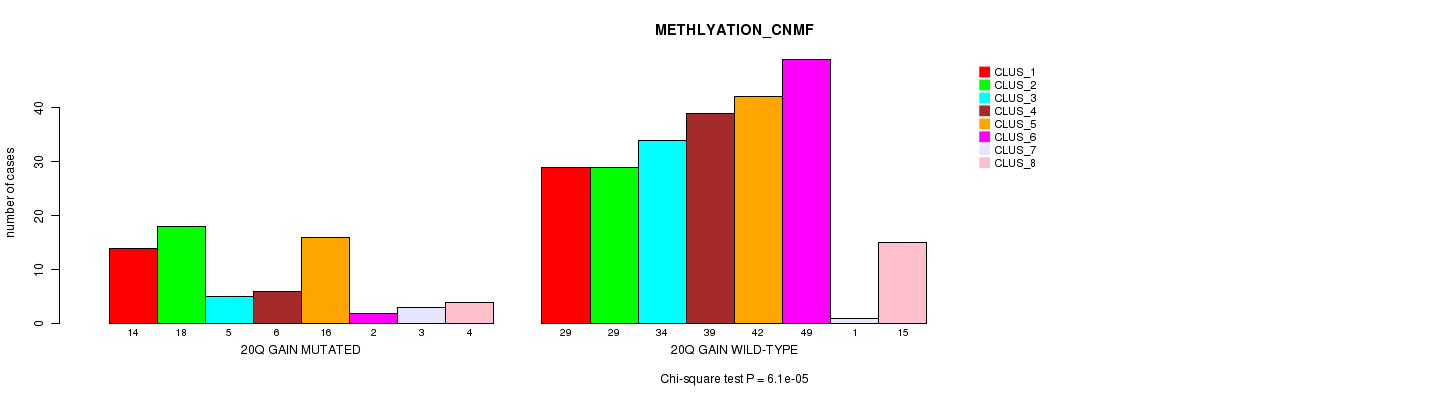
20q gain cnv correlated to 'CN_CNMF' and 'METHLYATION_CNMF'.
-
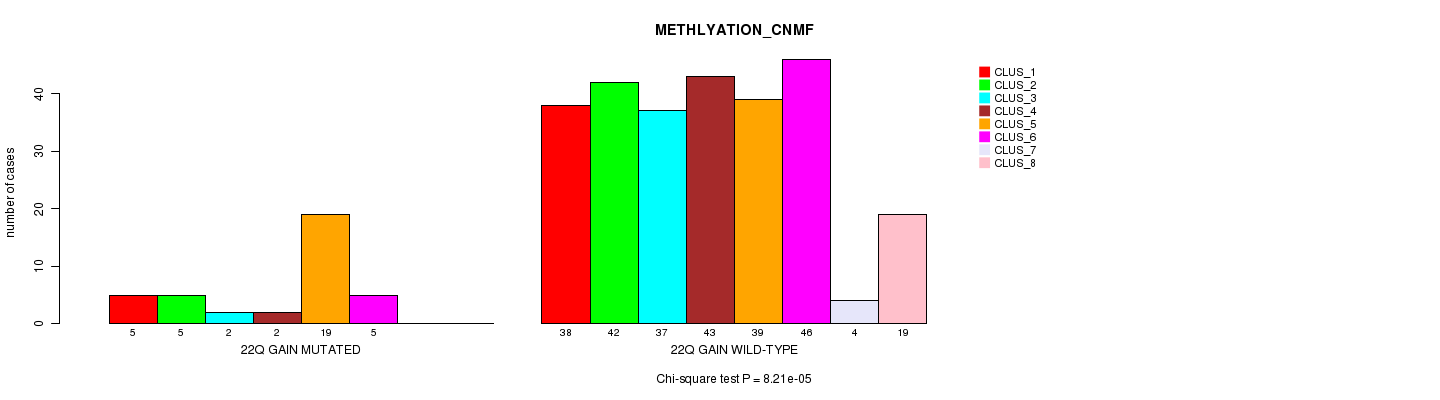
22q gain cnv correlated to 'METHLYATION_CNMF'.
-
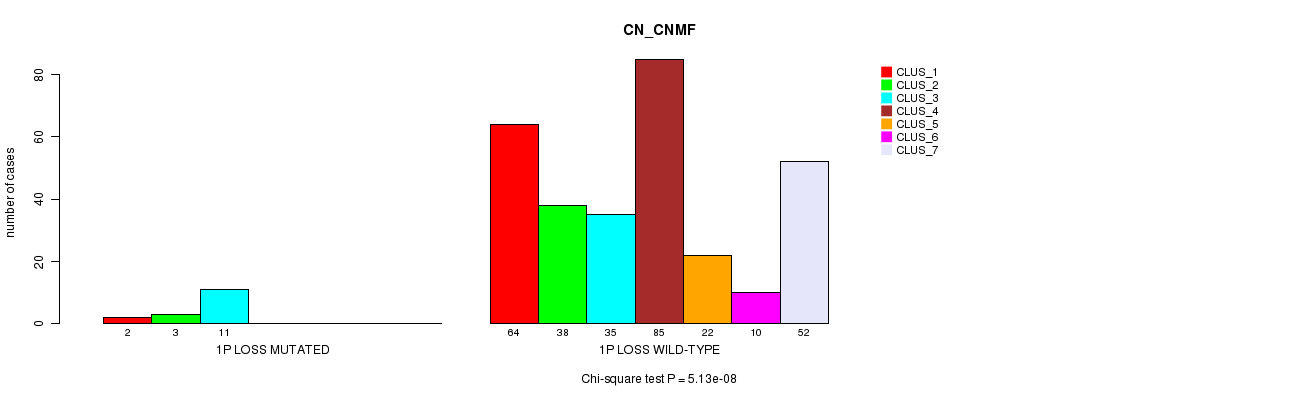
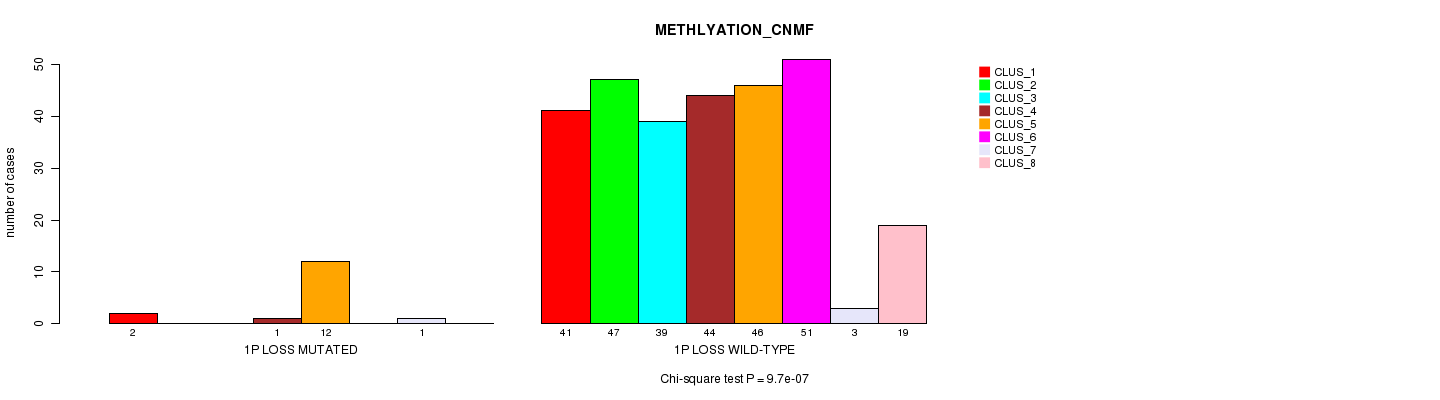
1p loss cnv correlated to 'CN_CNMF' and 'METHLYATION_CNMF'.
-
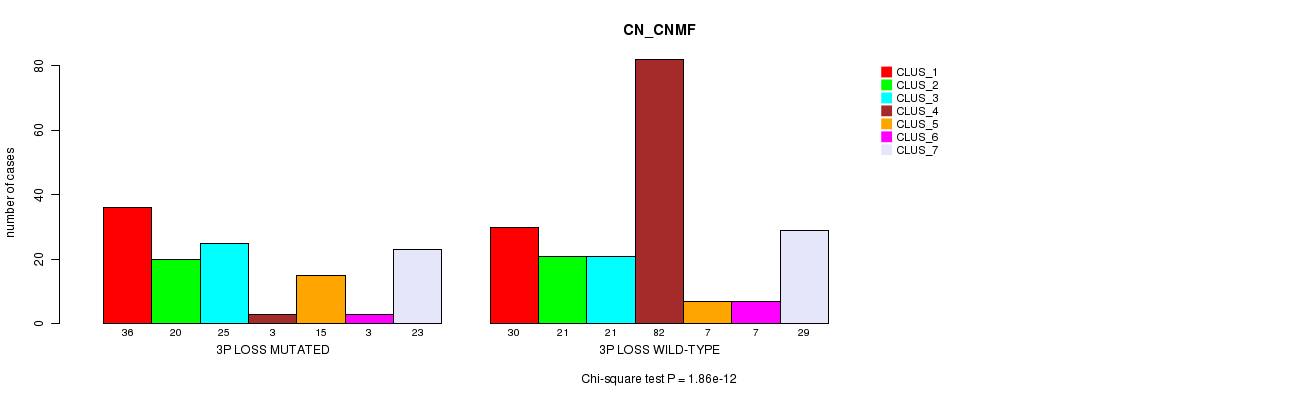
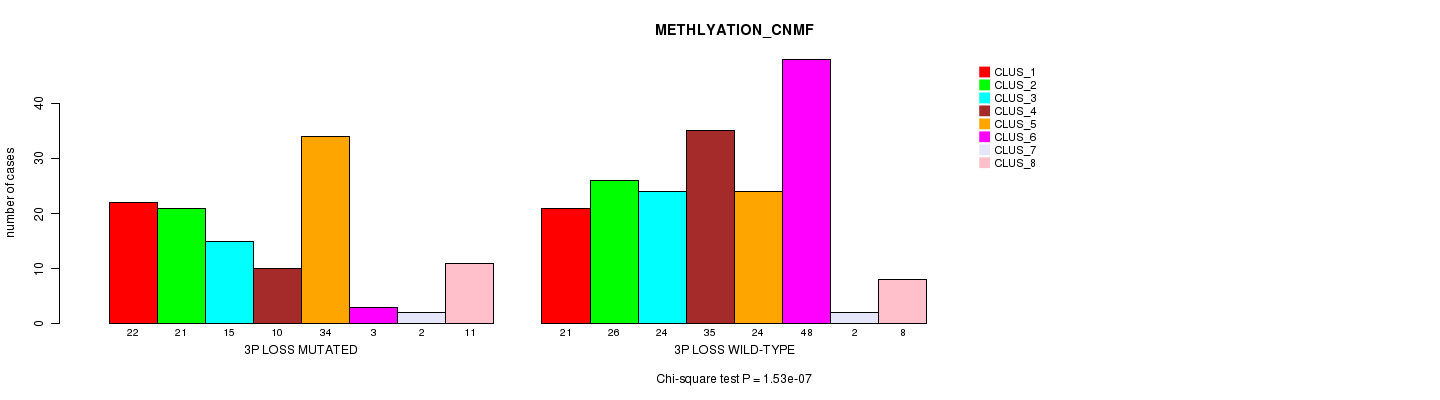
3p loss cnv correlated to 'CN_CNMF' and 'METHLYATION_CNMF'.
-
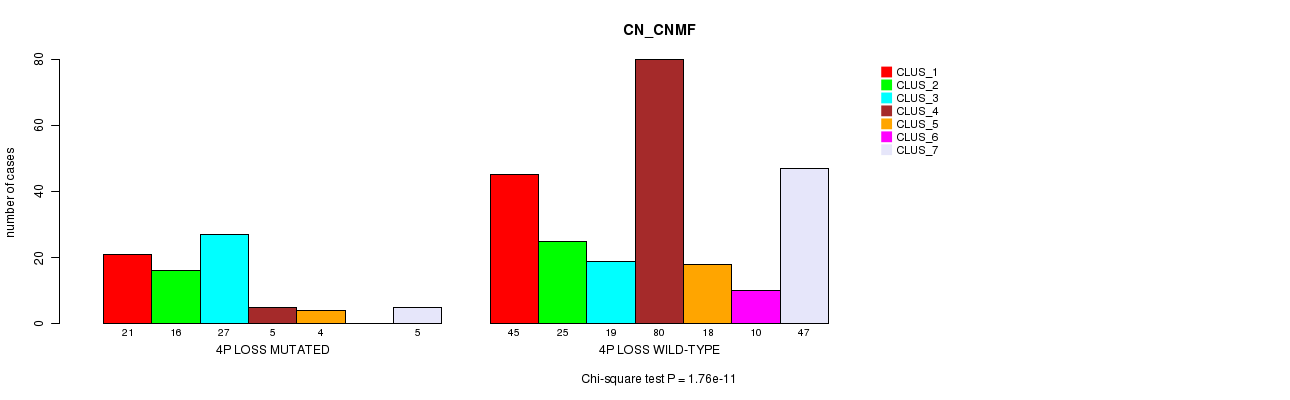
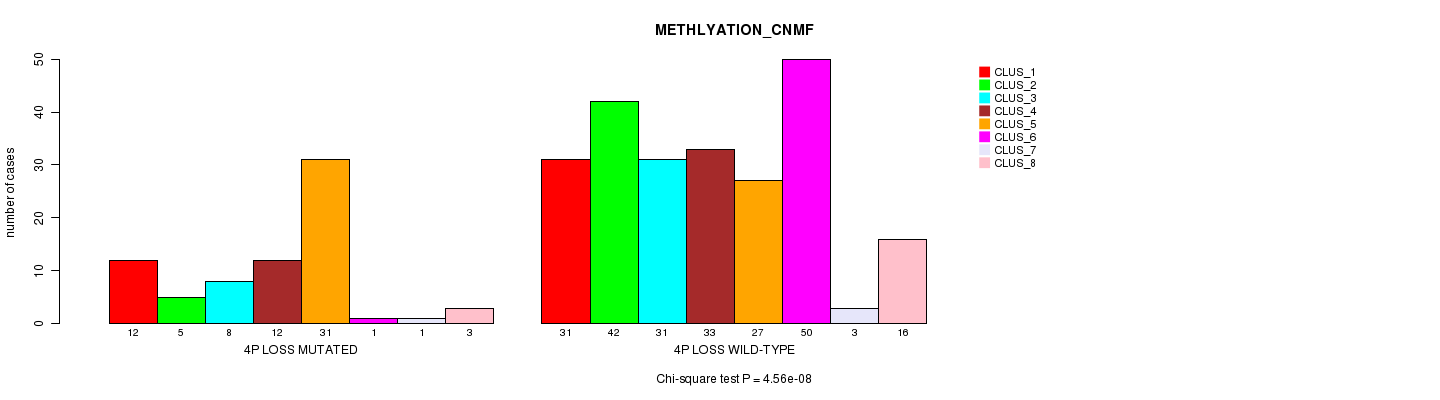
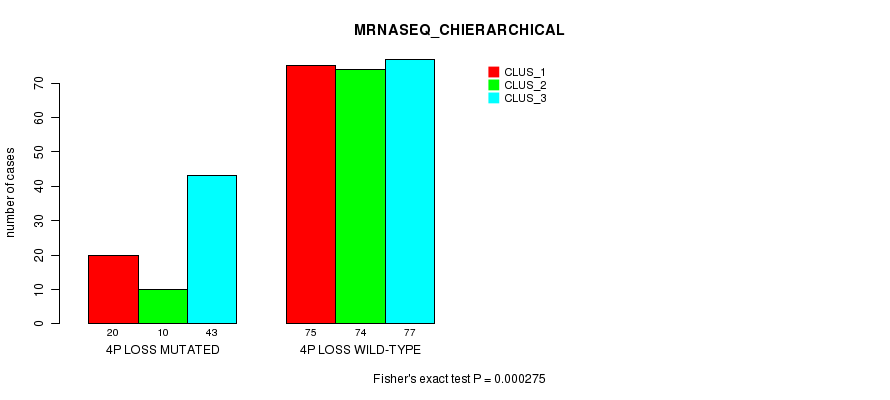
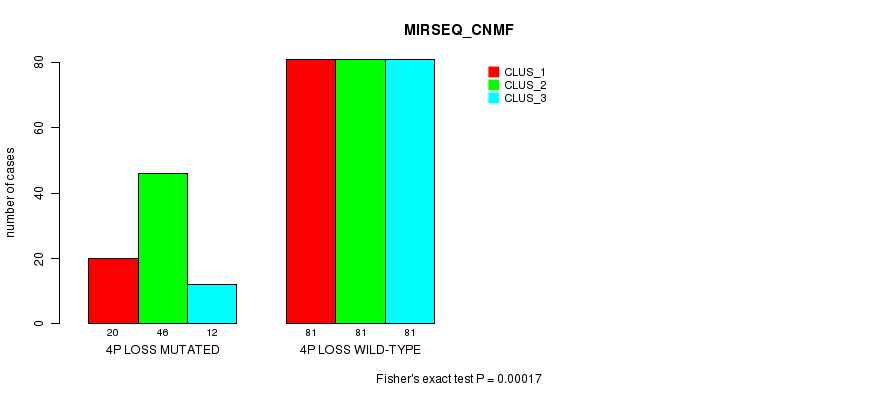
4p loss cnv correlated to 'CN_CNMF', 'METHLYATION_CNMF', 'MRNASEQ_CHIERARCHICAL', and 'MIRSEQ_CNMF'.
-
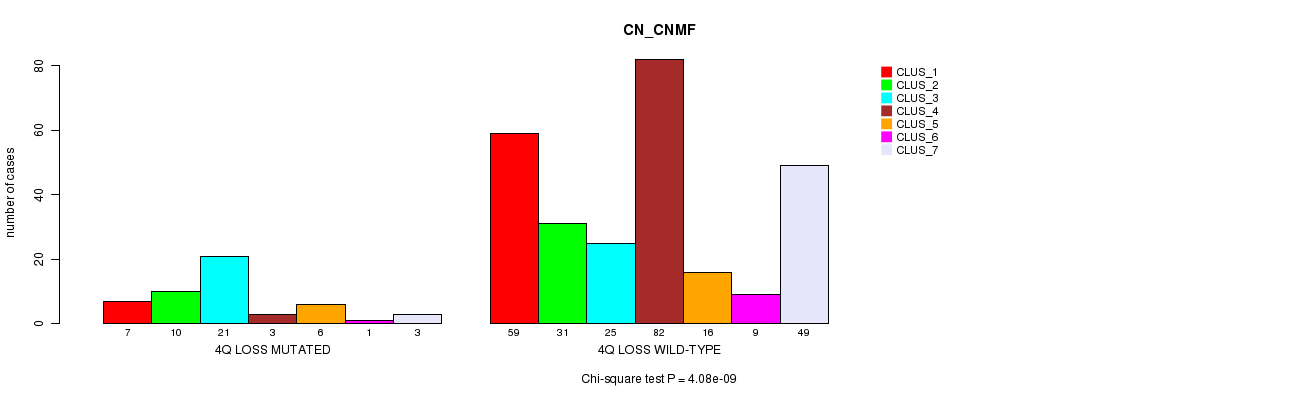
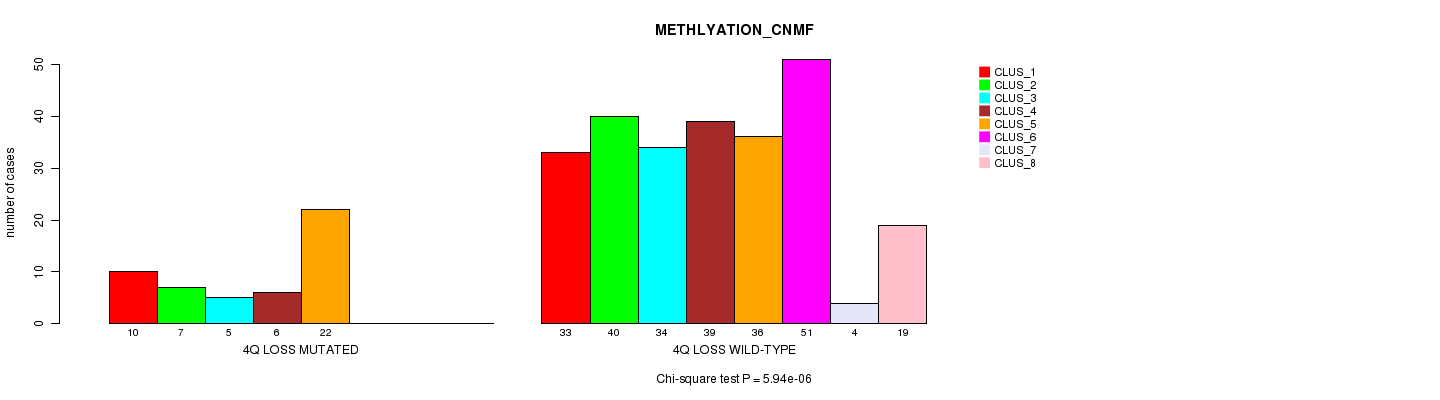
4q loss cnv correlated to 'CN_CNMF' and 'METHLYATION_CNMF'.
-
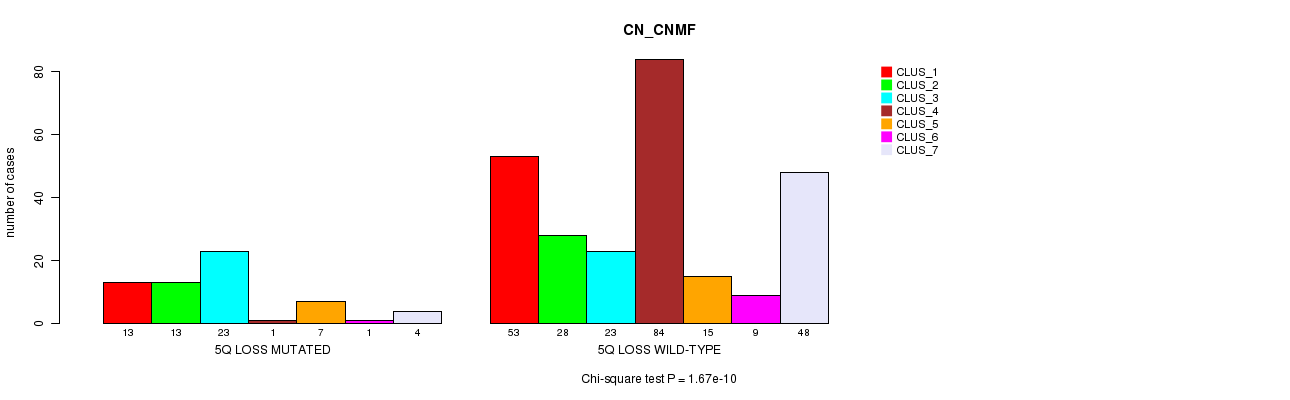
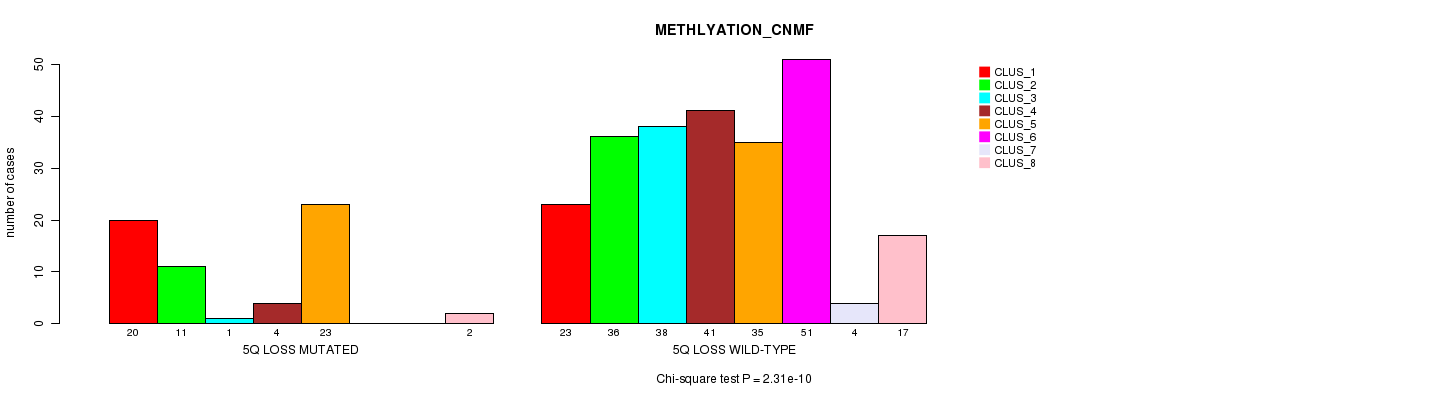
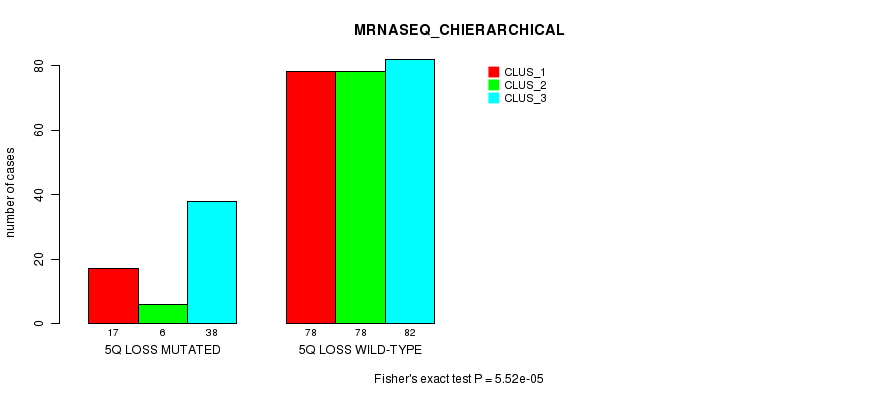
5q loss cnv correlated to 'CN_CNMF', 'METHLYATION_CNMF', and 'MRNASEQ_CHIERARCHICAL'.
-
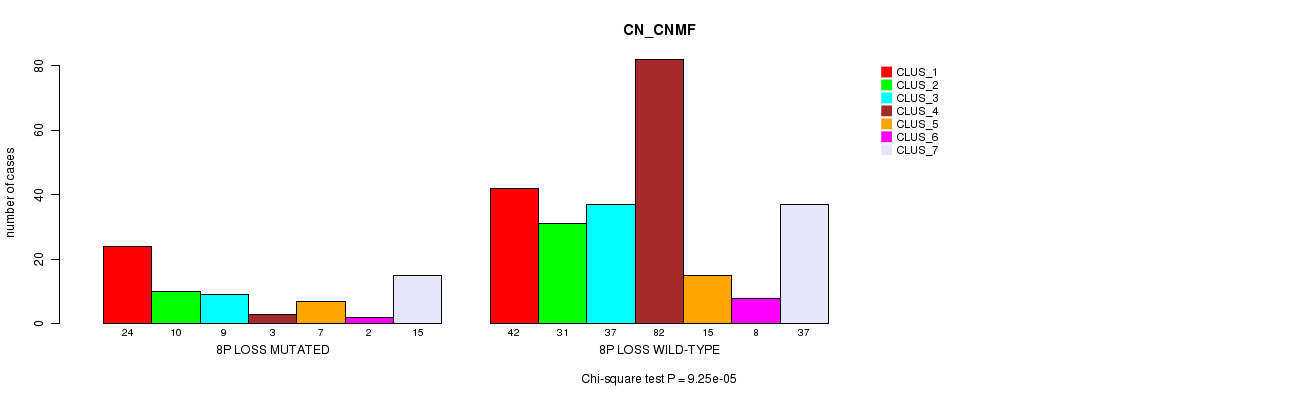
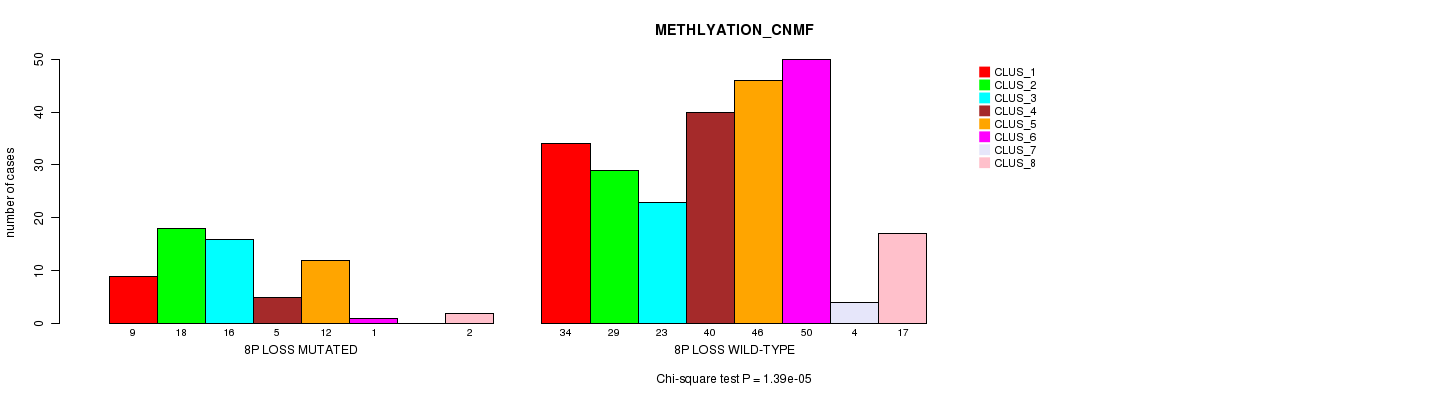
8p loss cnv correlated to 'CN_CNMF' and 'METHLYATION_CNMF'.
-
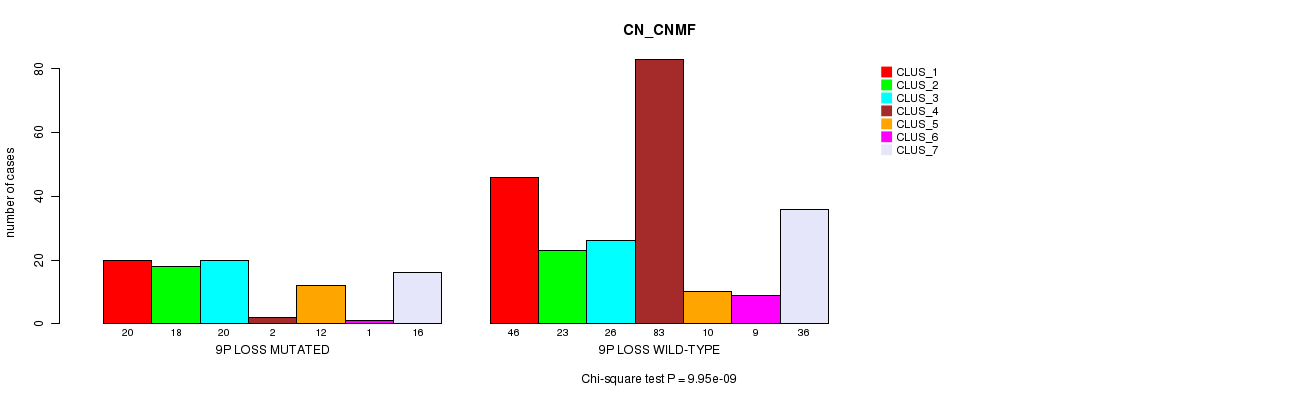
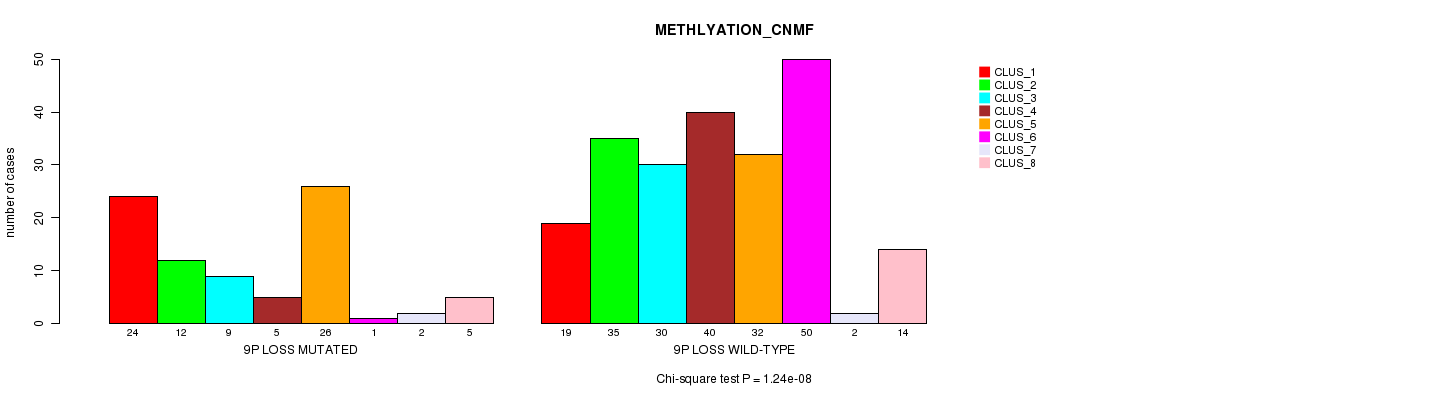
9p loss cnv correlated to 'CN_CNMF' and 'METHLYATION_CNMF'.
-
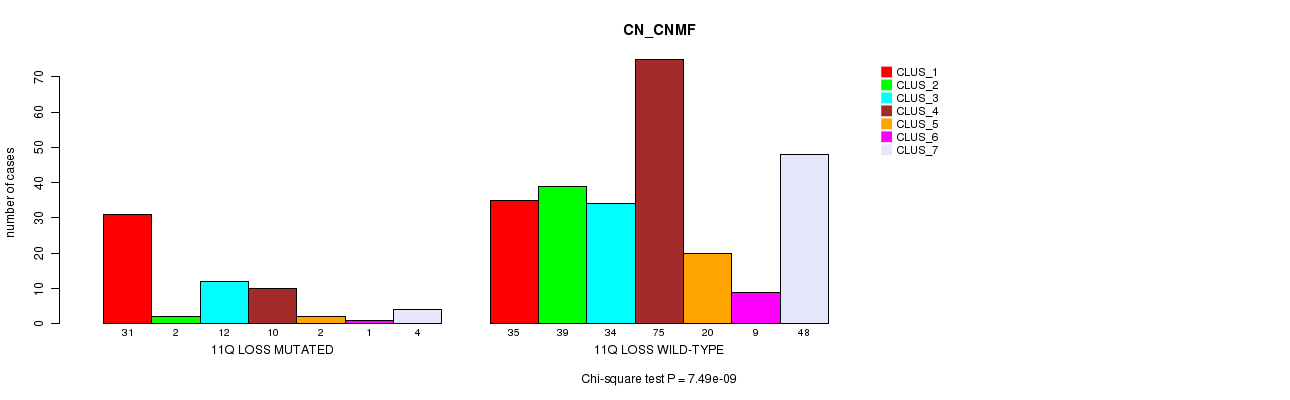
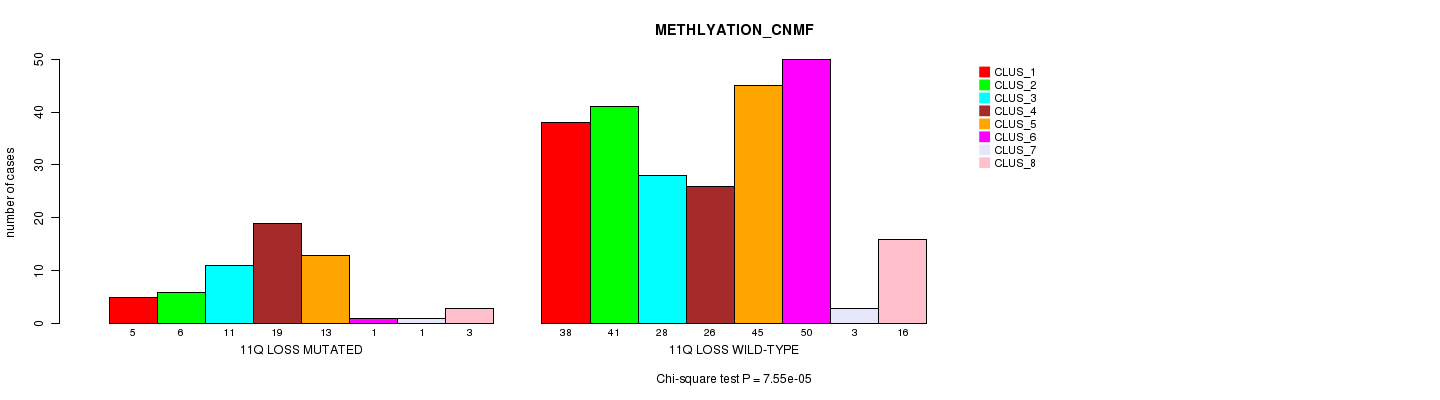
11q loss cnv correlated to 'CN_CNMF' and 'METHLYATION_CNMF'.
-
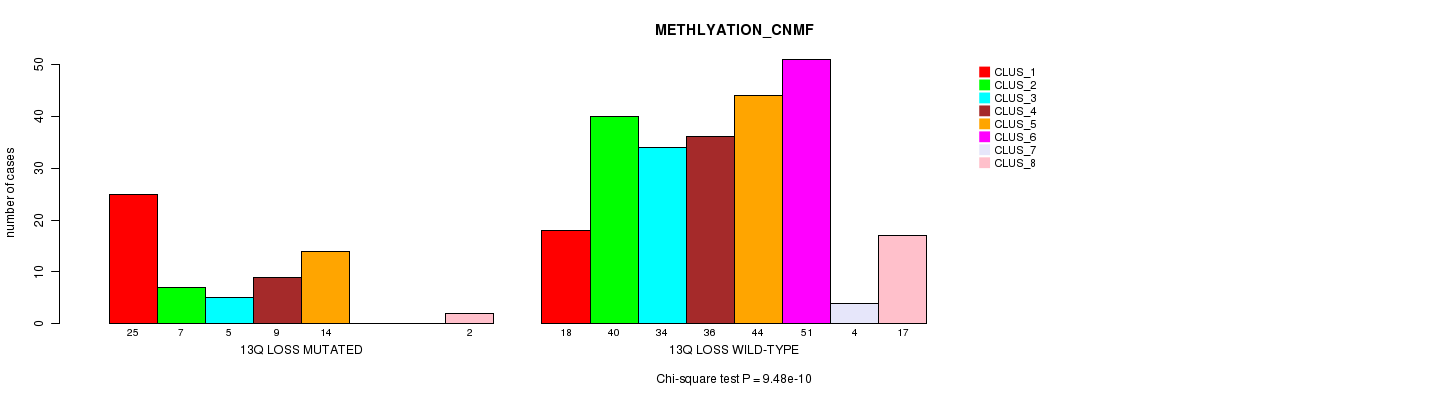
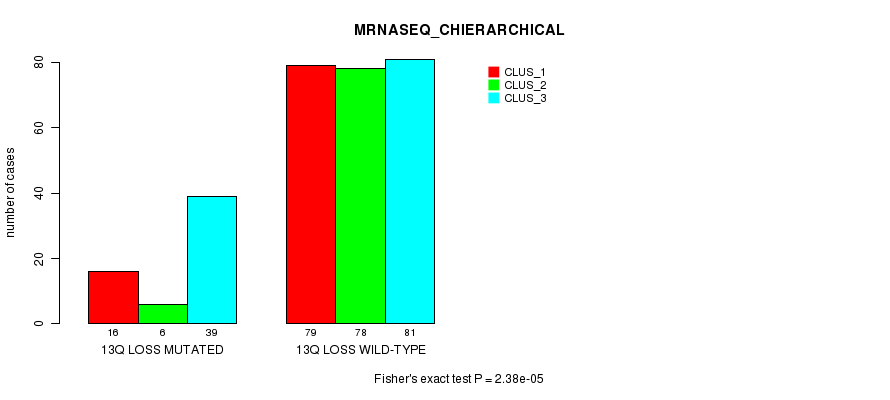
13q loss cnv correlated to 'CN_CNMF', 'METHLYATION_CNMF', and 'MRNASEQ_CHIERARCHICAL'.
-
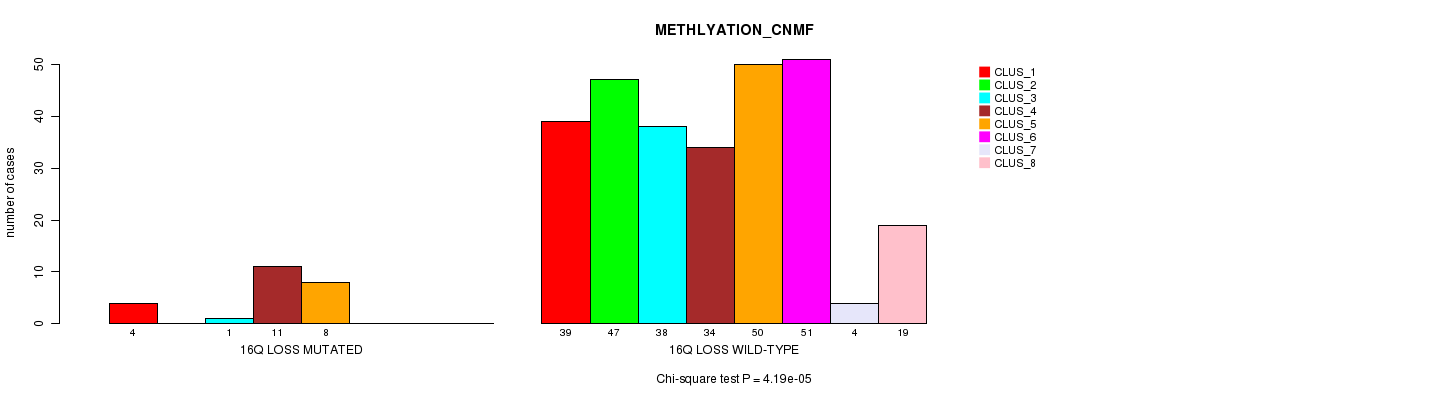
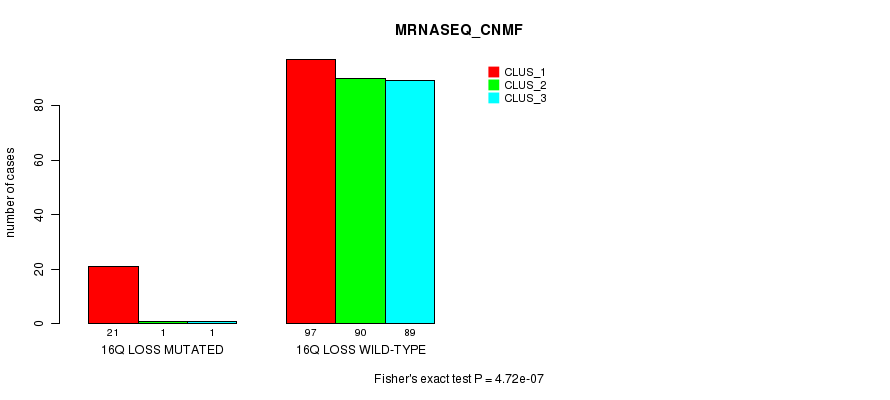
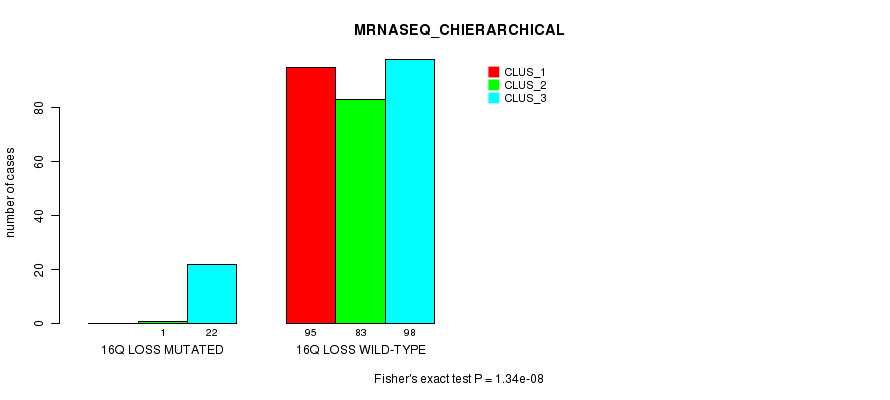
16q loss cnv correlated to 'METHLYATION_CNMF', 'MRNASEQ_CNMF', and 'MRNASEQ_CHIERARCHICAL'.
-
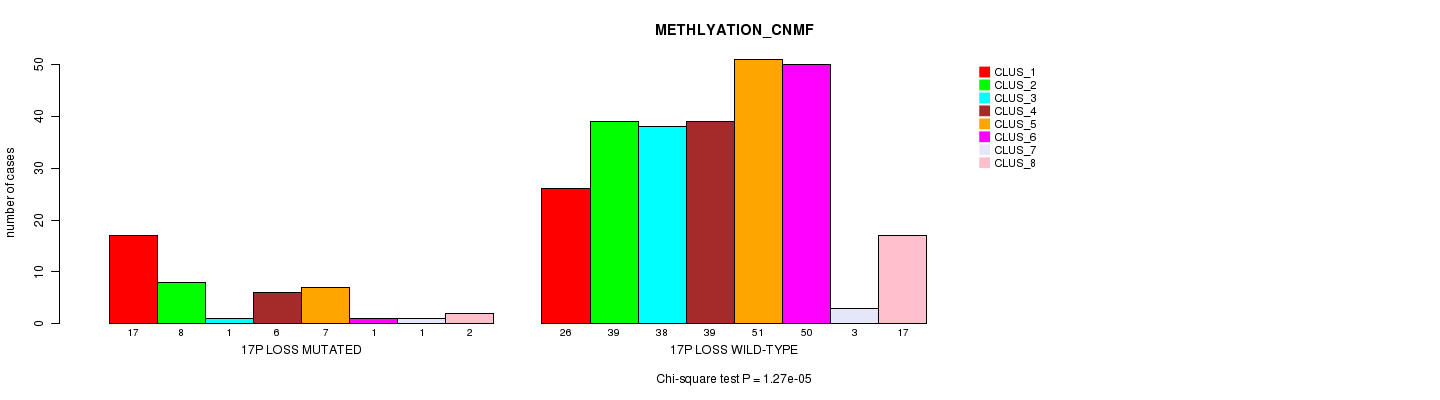
17p loss cnv correlated to 'METHLYATION_CNMF'.
-
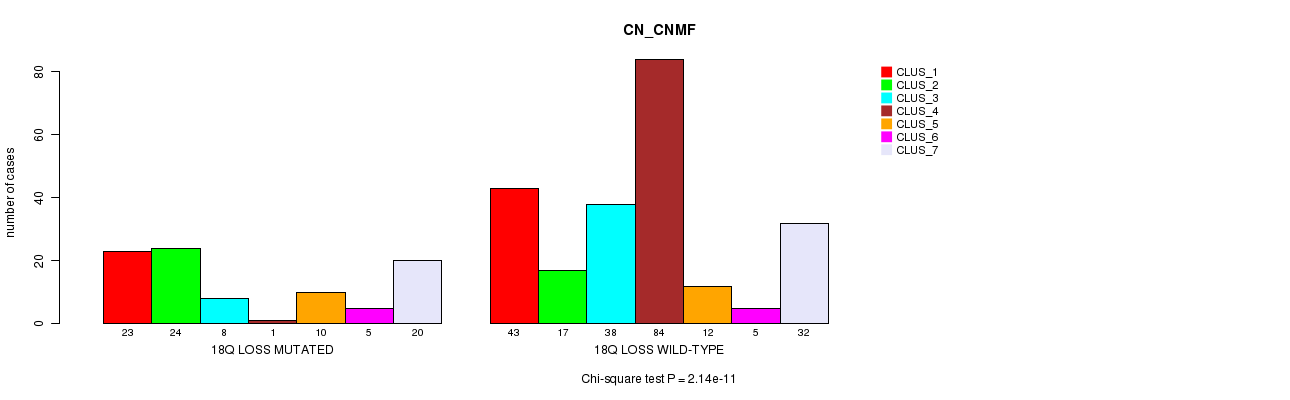
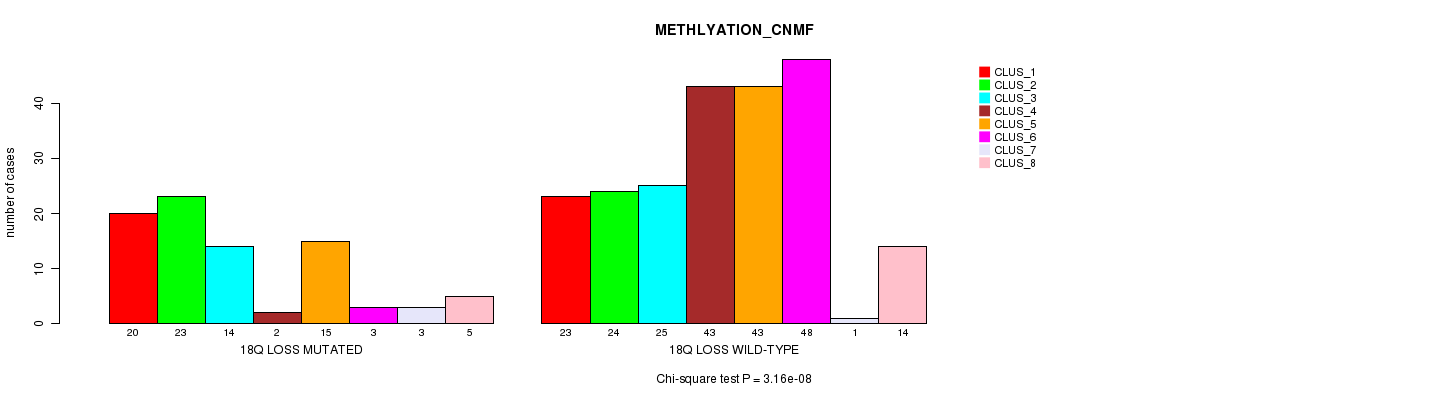
18q loss cnv correlated to 'CN_CNMF' and 'METHLYATION_CNMF'.
-
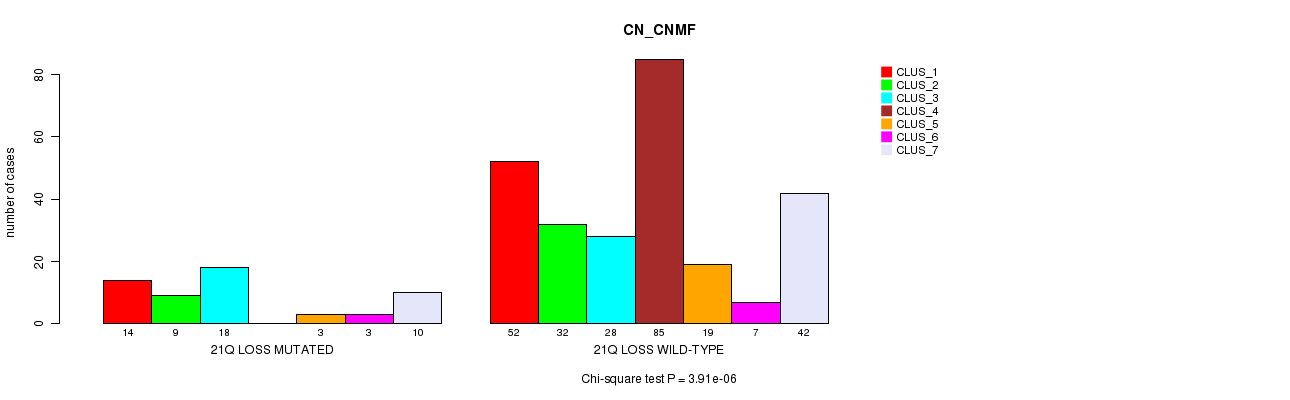
21q loss cnv correlated to 'CN_CNMF'.
-
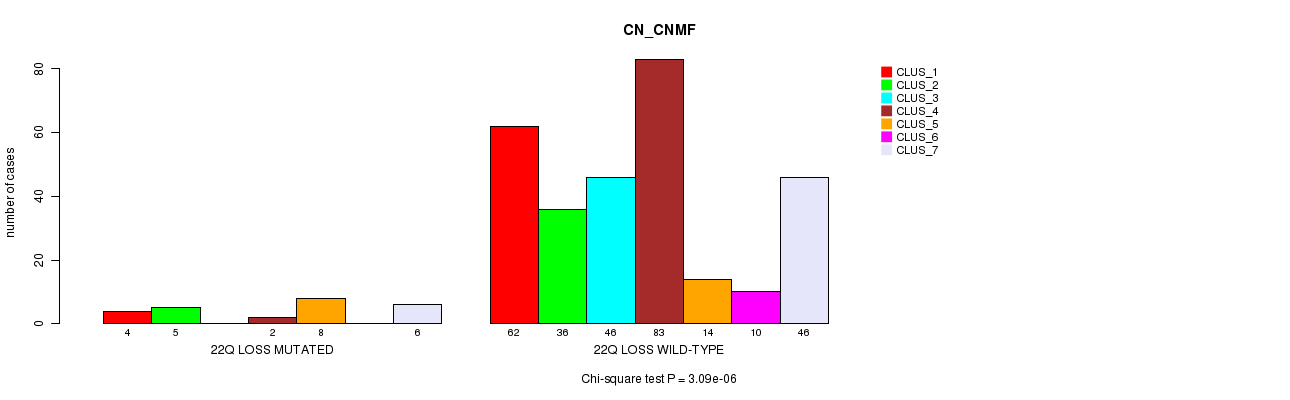
22q loss cnv correlated to 'CN_CNMF'.
Table 1. Get Full Table Overview of the association between significant copy number variation of 79 arm-level results and 8 molecular subtypes. Shown in the table are P values (Q values). Thresholded by Q value < 0.25, 59 significant findings detected.
|
Molecular subtypes |
CN CNMF |
METHLYATION CNMF |
RPPA CNMF |
RPPA CHIERARCHICAL |
MRNASEQ CNMF |
MRNASEQ CHIERARCHICAL |
MIRSEQ CNMF |
MIRSEQ CHIERARCHICAL |
||
| nCNV (%) | nWild-Type | Chi-square test | Chi-square test | Fisher's exact test | Fisher's exact test | Fisher's exact test | Fisher's exact test | Fisher's exact test | Fisher's exact test | |
| 4p loss | 78 (24%) | 244 |
1.76e-11 (1.11e-08) |
4.56e-08 (2.81e-05) |
0.33 (1.00) |
0.17 (1.00) |
0.00457 (1.00) |
0.000275 (0.158) |
0.00017 (0.0985) |
0.0977 (1.00) |
| 12p gain | 61 (19%) | 261 |
1.97e-07 (0.00012) |
1.89e-05 (0.0113) |
0.949 (1.00) |
0.688 (1.00) |
0.00399 (1.00) |
0.000612 (0.349) |
0.000125 (0.0726) |
0.0687 (1.00) |
| 5q loss | 62 (19%) | 260 |
1.67e-10 (1.05e-07) |
2.31e-10 (1.44e-07) |
0.0485 (1.00) |
0.327 (1.00) |
0.0111 (1.00) |
5.52e-05 (0.0325) |
0.00506 (1.00) |
0.55 (1.00) |
| 13q loss | 65 (20%) | 257 |
9e-10 (5.62e-07) |
9.48e-10 (5.91e-07) |
0.857 (1.00) |
0.692 (1.00) |
0.0286 (1.00) |
2.38e-05 (0.0141) |
0.0289 (1.00) |
0.0613 (1.00) |
| 16q loss | 26 (8%) | 296 |
0.0371 (1.00) |
4.19e-05 (0.0247) |
0.0558 (1.00) |
0.00532 (1.00) |
4.72e-07 (0.000287) |
1.34e-08 (8.26e-06) |
0.0034 (1.00) |
0.0116 (1.00) |
| 2p gain | 30 (9%) | 292 |
0.000188 (0.108) |
0.000213 (0.122) |
0.756 (1.00) |
0.946 (1.00) |
0.0219 (1.00) |
0.0361 (1.00) |
0.415 (1.00) |
0.654 (1.00) |
| 3p gain | 27 (8%) | 295 |
3.7e-05 (0.0219) |
3.66e-05 (0.0217) |
0.672 (1.00) |
0.182 (1.00) |
0.00158 (0.89) |
0.00182 (1.00) |
0.00414 (1.00) |
0.0814 (1.00) |
| 3q gain | 104 (32%) | 218 |
0.000352 (0.201) |
4.03e-05 (0.0238) |
0.201 (1.00) |
0.131 (1.00) |
0.012 (1.00) |
0.0018 (1.00) |
0.000681 (0.388) |
0.149 (1.00) |
| 7p gain | 72 (22%) | 250 |
1.12e-06 (0.000679) |
0.000155 (0.0902) |
0.89 (1.00) |
0.875 (1.00) |
0.868 (1.00) |
0.895 (1.00) |
0.485 (1.00) |
0.472 (1.00) |
| 7q gain | 45 (14%) | 277 |
6.97e-06 (0.00417) |
1.01e-06 (0.000612) |
0.81 (1.00) |
0.805 (1.00) |
0.275 (1.00) |
0.112 (1.00) |
0.143 (1.00) |
0.186 (1.00) |
| 8q gain | 129 (40%) | 193 |
2.25e-07 (0.000137) |
0.00028 (0.16) |
0.798 (1.00) |
0.431 (1.00) |
0.568 (1.00) |
0.651 (1.00) |
0.57 (1.00) |
0.0905 (1.00) |
| 18q gain | 20 (6%) | 302 |
0.000241 (0.138) |
0.000177 (0.103) |
0.157 (1.00) |
0.323 (1.00) |
0.0192 (1.00) |
0.0171 (1.00) |
0.00912 (1.00) |
1 (1.00) |
| 20p gain | 65 (20%) | 257 |
3.18e-07 (0.000194) |
7.9e-05 (0.0463) |
0.296 (1.00) |
0.149 (1.00) |
0.617 (1.00) |
0.365 (1.00) |
0.535 (1.00) |
0.726 (1.00) |
| 20q gain | 70 (22%) | 252 |
3.26e-09 (2.03e-06) |
6.1e-05 (0.0358) |
0.876 (1.00) |
0.753 (1.00) |
0.483 (1.00) |
0.789 (1.00) |
0.985 (1.00) |
0.447 (1.00) |
| 1p loss | 16 (5%) | 306 |
5.13e-08 (3.15e-05) |
9.7e-07 (0.000589) |
0.173 (1.00) |
0.0662 (1.00) |
0.0129 (1.00) |
0.0156 (1.00) |
0.0635 (1.00) |
0.338 (1.00) |
| 3p loss | 125 (39%) | 197 |
1.86e-12 (1.17e-09) |
1.53e-07 (9.34e-05) |
0.682 (1.00) |
0.861 (1.00) |
0.353 (1.00) |
0.149 (1.00) |
0.0518 (1.00) |
0.472 (1.00) |
| 4q loss | 51 (16%) | 271 |
4.08e-09 (2.54e-06) |
5.94e-06 (0.00356) |
0.378 (1.00) |
0.243 (1.00) |
0.0281 (1.00) |
0.00522 (1.00) |
0.00213 (1.00) |
0.036 (1.00) |
| 8p loss | 70 (22%) | 252 |
9.25e-05 (0.0539) |
1.39e-05 (0.0083) |
0.976 (1.00) |
1 (1.00) |
0.726 (1.00) |
0.59 (1.00) |
0.131 (1.00) |
0.275 (1.00) |
| 9p loss | 89 (28%) | 233 |
9.95e-09 (6.17e-06) |
1.24e-08 (7.7e-06) |
0.384 (1.00) |
0.945 (1.00) |
0.252 (1.00) |
0.0529 (1.00) |
0.00243 (1.00) |
0.077 (1.00) |
| 11q loss | 62 (19%) | 260 |
7.49e-09 (4.65e-06) |
7.55e-05 (0.0443) |
0.945 (1.00) |
0.589 (1.00) |
0.0112 (1.00) |
0.0622 (1.00) |
0.302 (1.00) |
0.897 (1.00) |
| 18q loss | 91 (28%) | 231 |
2.14e-11 (1.34e-08) |
3.16e-08 (1.95e-05) |
0.29 (1.00) |
0.107 (1.00) |
0.0134 (1.00) |
0.442 (1.00) |
0.106 (1.00) |
0.75 (1.00) |
| 5p gain | 82 (25%) | 240 |
2.54e-08 (1.56e-05) |
0.0437 (1.00) |
0.622 (1.00) |
0.562 (1.00) |
0.399 (1.00) |
0.409 (1.00) |
0.71 (1.00) |
0.513 (1.00) |
| 8p gain | 49 (15%) | 273 |
7.85e-06 (0.00469) |
0.002 (1.00) |
0.67 (1.00) |
0.18 (1.00) |
0.381 (1.00) |
0.313 (1.00) |
0.287 (1.00) |
0.166 (1.00) |
| 9p gain | 38 (12%) | 284 |
0.000203 (0.117) |
0.0595 (1.00) |
0.343 (1.00) |
0.438 (1.00) |
0.288 (1.00) |
0.643 (1.00) |
0.441 (1.00) |
0.946 (1.00) |
| 9q gain | 47 (15%) | 275 |
4.33e-06 (0.00261) |
0.0103 (1.00) |
0.355 (1.00) |
0.301 (1.00) |
0.383 (1.00) |
0.191 (1.00) |
0.22 (1.00) |
0.524 (1.00) |
| 14q gain | 52 (16%) | 270 |
9.96e-08 (6.11e-05) |
0.0159 (1.00) |
0.19 (1.00) |
0.116 (1.00) |
0.0271 (1.00) |
0.027 (1.00) |
0.0219 (1.00) |
0.113 (1.00) |
| 16p gain | 21 (7%) | 301 |
0.00109 (0.614) |
8.45e-05 (0.0493) |
0.0286 (1.00) |
0.123 (1.00) |
0.241 (1.00) |
0.958 (1.00) |
0.706 (1.00) |
0.662 (1.00) |
| 18p gain | 52 (16%) | 270 |
4.85e-06 (0.00291) |
0.0581 (1.00) |
0.907 (1.00) |
0.252 (1.00) |
0.114 (1.00) |
0.0049 (1.00) |
0.504 (1.00) |
0.414 (1.00) |
| 22q gain | 39 (12%) | 283 |
0.00665 (1.00) |
8.21e-05 (0.0481) |
0.569 (1.00) |
0.417 (1.00) |
0.0775 (1.00) |
0.019 (1.00) |
0.257 (1.00) |
0.527 (1.00) |
| 17p loss | 45 (14%) | 277 |
0.249 (1.00) |
1.27e-05 (0.00761) |
0.577 (1.00) |
0.677 (1.00) |
0.637 (1.00) |
0.0218 (1.00) |
0.492 (1.00) |
0.44 (1.00) |
| 21q loss | 57 (18%) | 265 |
3.91e-06 (0.00236) |
0.0109 (1.00) |
0.92 (1.00) |
0.318 (1.00) |
0.892 (1.00) |
0.512 (1.00) |
0.181 (1.00) |
0.213 (1.00) |
| 22q loss | 25 (8%) | 297 |
3.09e-06 (0.00187) |
0.0305 (1.00) |
0.396 (1.00) |
1 (1.00) |
0.391 (1.00) |
0.772 (1.00) |
0.00213 (1.00) |
0.857 (1.00) |
| 1p gain | 12 (4%) | 310 |
0.714 (1.00) |
0.486 (1.00) |
0.229 (1.00) |
0.76 (1.00) |
0.1 (1.00) |
0.221 (1.00) |
0.812 (1.00) |
0.573 (1.00) |
| 1q gain | 41 (13%) | 281 |
0.00686 (1.00) |
0.000755 (0.43) |
0.966 (1.00) |
0.234 (1.00) |
0.00748 (1.00) |
0.00279 (1.00) |
0.00692 (1.00) |
0.121 (1.00) |
| 2q gain | 20 (6%) | 302 |
0.0152 (1.00) |
0.00347 (1.00) |
0.898 (1.00) |
1 (1.00) |
0.109 (1.00) |
0.157 (1.00) |
0.833 (1.00) |
0.582 (1.00) |
| 4p gain | 13 (4%) | 309 |
0.00391 (1.00) |
0.064 (1.00) |
0.292 (1.00) |
1 (1.00) |
0.166 (1.00) |
0.228 (1.00) |
0.35 (1.00) |
0.268 (1.00) |
| 4q gain | 9 (3%) | 313 |
0.233 (1.00) |
0.103 (1.00) |
0.295 (1.00) |
1 (1.00) |
0.576 (1.00) |
0.63 (1.00) |
0.917 (1.00) |
0.624 (1.00) |
| 5q gain | 28 (9%) | 294 |
0.106 (1.00) |
0.693 (1.00) |
0.825 (1.00) |
0.828 (1.00) |
0.819 (1.00) |
0.461 (1.00) |
0.968 (1.00) |
0.261 (1.00) |
| 6p gain | 26 (8%) | 296 |
0.0652 (1.00) |
0.0466 (1.00) |
0.762 (1.00) |
0.496 (1.00) |
0.902 (1.00) |
0.871 (1.00) |
0.9 (1.00) |
1 (1.00) |
| 6q gain | 19 (6%) | 303 |
0.0198 (1.00) |
0.0821 (1.00) |
0.46 (1.00) |
0.828 (1.00) |
0.727 (1.00) |
0.378 (1.00) |
0.827 (1.00) |
0.79 (1.00) |
| 10p gain | 12 (4%) | 310 |
0.51 (1.00) |
0.00278 (1.00) |
0.189 (1.00) |
0.521 (1.00) |
0.055 (1.00) |
0.0689 (1.00) |
0.256 (1.00) |
0.162 (1.00) |
| 10q gain | 6 (2%) | 316 |
0.445 (1.00) |
0.338 (1.00) |
0.737 (1.00) |
0.768 (1.00) |
1 (1.00) |
1 (1.00) |
0.673 (1.00) |
0.75 (1.00) |
| 11p gain | 16 (5%) | 306 |
0.00758 (1.00) |
0.67 (1.00) |
1 (1.00) |
0.323 (1.00) |
0.754 (1.00) |
0.845 (1.00) |
0.853 (1.00) |
0.765 (1.00) |
| 11q gain | 16 (5%) | 306 |
0.103 (1.00) |
0.407 (1.00) |
0.624 (1.00) |
1 (1.00) |
0.159 (1.00) |
0.295 (1.00) |
0.653 (1.00) |
1 (1.00) |
| 12q gain | 25 (8%) | 297 |
0.0107 (1.00) |
0.0021 (1.00) |
1 (1.00) |
0.396 (1.00) |
0.0398 (1.00) |
0.000869 (0.493) |
0.00387 (1.00) |
0.051 (1.00) |
| 13q gain | 17 (5%) | 305 |
0.00117 (0.661) |
0.0352 (1.00) |
0.172 (1.00) |
0.805 (1.00) |
0.603 (1.00) |
0.904 (1.00) |
0.498 (1.00) |
0.289 (1.00) |
| 15q gain | 13 (4%) | 309 |
0.37 (1.00) |
0.275 (1.00) |
1 (1.00) |
0.433 (1.00) |
0.727 (1.00) |
0.124 (1.00) |
0.489 (1.00) |
0.381 (1.00) |
| 16q gain | 28 (9%) | 294 |
0.00831 (1.00) |
0.00423 (1.00) |
0.391 (1.00) |
1 (1.00) |
0.0266 (1.00) |
0.437 (1.00) |
0.607 (1.00) |
0.0884 (1.00) |
| 17p gain | 19 (6%) | 303 |
0.00396 (1.00) |
0.0824 (1.00) |
0.888 (1.00) |
0.408 (1.00) |
0.18 (1.00) |
0.561 (1.00) |
0.295 (1.00) |
0.384 (1.00) |
| 17q gain | 23 (7%) | 299 |
0.151 (1.00) |
0.0963 (1.00) |
0.275 (1.00) |
0.5 (1.00) |
0.19 (1.00) |
0.0519 (1.00) |
0.256 (1.00) |
0.581 (1.00) |
| 19p gain | 12 (4%) | 310 |
0.00306 (1.00) |
0.00495 (1.00) |
0.184 (1.00) |
0.0962 (1.00) |
0.389 (1.00) |
0.0231 (1.00) |
0.194 (1.00) |
0.162 (1.00) |
| 19q gain | 21 (7%) | 301 |
0.00591 (1.00) |
0.0581 (1.00) |
0.879 (1.00) |
0.381 (1.00) |
0.158 (1.00) |
0.319 (1.00) |
0.227 (1.00) |
0.389 (1.00) |
| 21q gain | 9 (3%) | 313 |
0.089 (1.00) |
0.773 (1.00) |
0.682 (1.00) |
1 (1.00) |
0.0193 (1.00) |
0.0552 (1.00) |
0.269 (1.00) |
0.805 (1.00) |
| Xq gain | 21 (7%) | 301 |
0.00897 (1.00) |
0.109 (1.00) |
0.187 (1.00) |
0.162 (1.00) |
0.333 (1.00) |
0.77 (1.00) |
1 (1.00) |
0.823 (1.00) |
| 2p loss | 5 (2%) | 317 |
0.692 (1.00) |
0.0118 (1.00) |
0.12 (1.00) |
1 (1.00) |
0.054 (1.00) |
0.0361 (1.00) |
0.0708 (1.00) |
0.213 (1.00) |
| 2q loss | 9 (3%) | 313 |
0.573 (1.00) |
0.0662 (1.00) |
0.0644 (1.00) |
0.424 (1.00) |
0.0313 (1.00) |
0.0258 (1.00) |
0.107 (1.00) |
0.0105 (1.00) |
| 3q loss | 21 (7%) | 301 |
0.0665 (1.00) |
0.115 (1.00) |
0.642 (1.00) |
0.453 (1.00) |
0.881 (1.00) |
0.959 (1.00) |
0.174 (1.00) |
0.549 (1.00) |
| 5p loss | 10 (3%) | 312 |
0.00274 (1.00) |
0.00367 (1.00) |
0.727 (1.00) |
1 (1.00) |
0.287 (1.00) |
0.399 (1.00) |
0.0371 (1.00) |
1 (1.00) |
| 6p loss | 19 (6%) | 303 |
0.135 (1.00) |
0.0127 (1.00) |
0.1 (1.00) |
0.116 (1.00) |
0.0317 (1.00) |
0.111 (1.00) |
0.0286 (1.00) |
0.106 (1.00) |
| 6q loss | 21 (7%) | 301 |
0.237 (1.00) |
0.0701 (1.00) |
0.0474 (1.00) |
0.0529 (1.00) |
0.379 (1.00) |
0.392 (1.00) |
0.107 (1.00) |
0.0875 (1.00) |
| 7p loss | 5 (2%) | 317 |
0.121 (1.00) |
0.388 (1.00) |
0.391 (1.00) |
0.452 (1.00) |
0.014 (1.00) |
1 (1.00) |
||
| 7q loss | 9 (3%) | 313 |
0.0454 (1.00) |
0.161 (1.00) |
1 (1.00) |
0.74 (1.00) |
0.363 (1.00) |
0.694 (1.00) |
0.0878 (1.00) |
0.0692 (1.00) |
| 8q loss | 6 (2%) | 316 |
0.153 (1.00) |
0.105 (1.00) |
0.638 (1.00) |
0.768 (1.00) |
1 (1.00) |
0.515 (1.00) |
0.881 (1.00) |
1 (1.00) |
| 9q loss | 31 (10%) | 291 |
0.00846 (1.00) |
0.0679 (1.00) |
0.785 (1.00) |
0.496 (1.00) |
0.829 (1.00) |
0.855 (1.00) |
0.704 (1.00) |
0.00233 (1.00) |
| 10p loss | 47 (15%) | 275 |
0.0107 (1.00) |
0.0719 (1.00) |
0.605 (1.00) |
0.446 (1.00) |
0.858 (1.00) |
0.751 (1.00) |
0.27 (1.00) |
0.393 (1.00) |
| 10q loss | 26 (8%) | 296 |
0.0113 (1.00) |
0.00296 (1.00) |
0.893 (1.00) |
0.475 (1.00) |
0.0306 (1.00) |
0.00107 (0.607) |
0.00713 (1.00) |
0.258 (1.00) |
| 11p loss | 41 (13%) | 281 |
0.000893 (0.506) |
0.0444 (1.00) |
0.688 (1.00) |
0.807 (1.00) |
0.00173 (0.974) |
0.00598 (1.00) |
0.0392 (1.00) |
0.406 (1.00) |
| 12p loss | 12 (4%) | 310 |
0.0418 (1.00) |
0.139 (1.00) |
0.338 (1.00) |
0.199 (1.00) |
0.468 (1.00) |
0.459 (1.00) |
0.342 (1.00) |
0.41 (1.00) |
| 12q loss | 8 (2%) | 314 |
0.197 (1.00) |
0.073 (1.00) |
0.614 (1.00) |
0.666 (1.00) |
0.201 (1.00) |
0.308 (1.00) |
0.605 (1.00) |
0.0107 (1.00) |
| 14q loss | 16 (5%) | 306 |
0.121 (1.00) |
0.0415 (1.00) |
0.37 (1.00) |
0.726 (1.00) |
0.0108 (1.00) |
0.0154 (1.00) |
0.144 (1.00) |
0.338 (1.00) |
| 15q loss | 23 (7%) | 299 |
0.1 (1.00) |
0.136 (1.00) |
0.42 (1.00) |
0.15 (1.00) |
0.708 (1.00) |
0.36 (1.00) |
0.325 (1.00) |
0.522 (1.00) |
| 16p loss | 12 (4%) | 310 |
0.597 (1.00) |
0.0294 (1.00) |
0.078 (1.00) |
0.274 (1.00) |
0.0414 (1.00) |
0.014 (1.00) |
0.1 (1.00) |
0.106 (1.00) |
| 17q loss | 5 (2%) | 317 |
0.21 (1.00) |
0.00402 (1.00) |
0.119 (1.00) |
0.666 (1.00) |
0.148 (1.00) |
0.386 (1.00) |
0.524 (1.00) |
0.108 (1.00) |
| 18p loss | 29 (9%) | 293 |
0.007 (1.00) |
0.0243 (1.00) |
0.764 (1.00) |
0.492 (1.00) |
0.578 (1.00) |
0.747 (1.00) |
0.225 (1.00) |
0.654 (1.00) |
| 19p loss | 27 (8%) | 295 |
0.0198 (1.00) |
0.113 (1.00) |
0.598 (1.00) |
0.875 (1.00) |
0.118 (1.00) |
0.416 (1.00) |
0.549 (1.00) |
0.488 (1.00) |
| 19q loss | 20 (6%) | 302 |
0.0314 (1.00) |
0.18 (1.00) |
0.531 (1.00) |
0.519 (1.00) |
0.694 (1.00) |
0.833 (1.00) |
0.277 (1.00) |
0.814 (1.00) |
| 20p loss | 21 (7%) | 301 |
0.0544 (1.00) |
0.319 (1.00) |
0.518 (1.00) |
0.815 (1.00) |
0.224 (1.00) |
0.0904 (1.00) |
0.333 (1.00) |
0.204 (1.00) |
| 20q loss | 10 (3%) | 312 |
0.0389 (1.00) |
0.212 (1.00) |
0.638 (1.00) |
0.601 (1.00) |
0.0359 (1.00) |
0.0468 (1.00) |
0.512 (1.00) |
0.659 (1.00) |
| Xq loss | 8 (2%) | 314 |
0.328 (1.00) |
0.122 (1.00) |
0.194 (1.00) |
0.341 (1.00) |
0.499 (1.00) |
1 (1.00) |
0.497 (1.00) |
0.221 (1.00) |
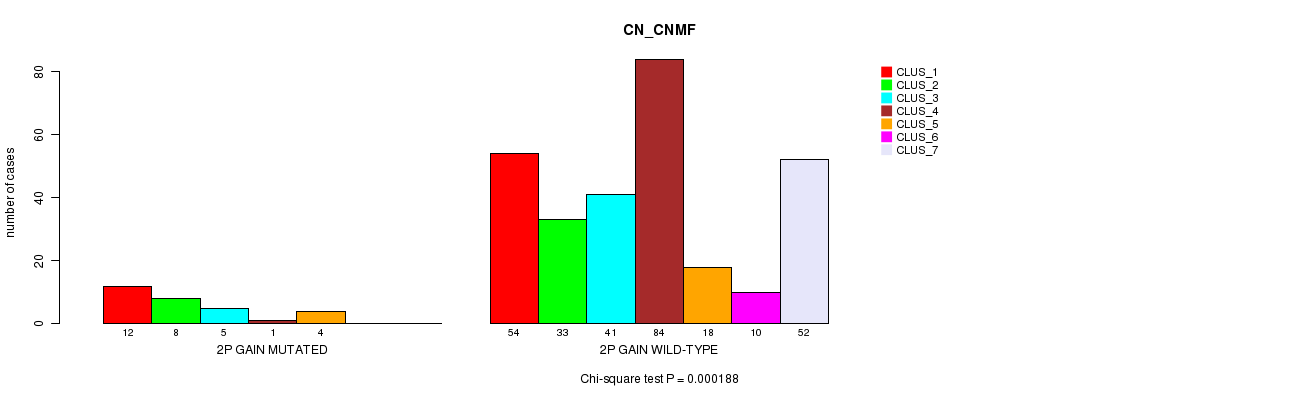
P value = 0.000188 (Chi-square test), Q value = 0.11
Table S1. Gene #3: '2p gain mutation analysis' versus Clinical Feature #1: 'CN_CNMF'
| nPatients | CLUS_1 | CLUS_2 | CLUS_3 | CLUS_4 | CLUS_5 | CLUS_6 | CLUS_7 |
|---|---|---|---|---|---|---|---|
| ALL | 66 | 41 | 46 | 85 | 22 | 10 | 52 |
| 2P GAIN MUTATED | 12 | 8 | 5 | 1 | 4 | 0 | 0 |
| 2P GAIN WILD-TYPE | 54 | 33 | 41 | 84 | 18 | 10 | 52 |
Figure S1. Get High-res Image Gene #3: '2p gain mutation analysis' versus Clinical Feature #1: 'CN_CNMF'
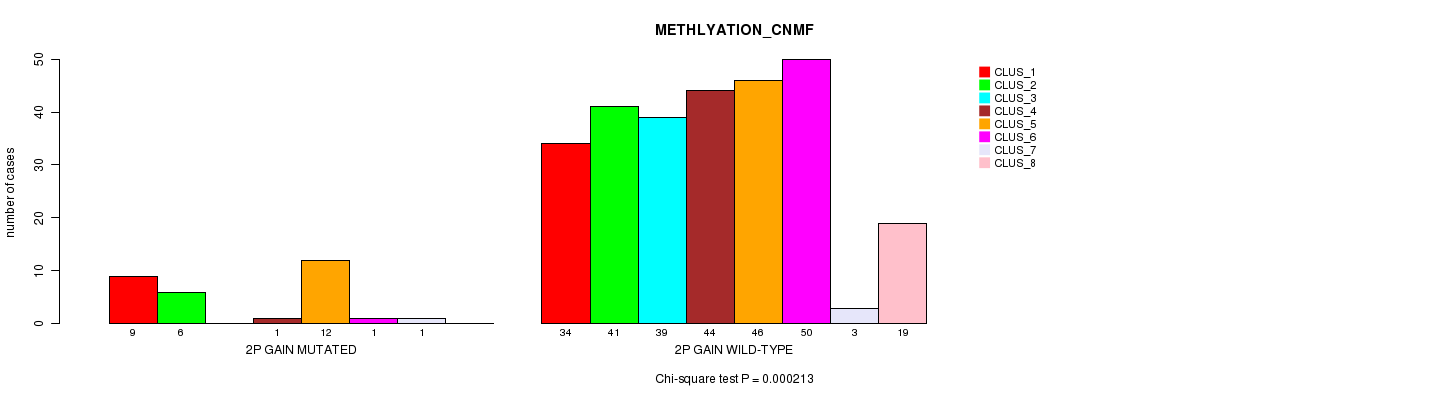
P value = 0.000213 (Chi-square test), Q value = 0.12
Table S2. Gene #3: '2p gain mutation analysis' versus Clinical Feature #2: 'METHLYATION_CNMF'
| nPatients | CLUS_1 | CLUS_2 | CLUS_3 | CLUS_4 | CLUS_5 | CLUS_6 | CLUS_7 | CLUS_8 |
|---|---|---|---|---|---|---|---|---|
| ALL | 43 | 47 | 39 | 45 | 58 | 51 | 4 | 19 |
| 2P GAIN MUTATED | 9 | 6 | 0 | 1 | 12 | 1 | 1 | 0 |
| 2P GAIN WILD-TYPE | 34 | 41 | 39 | 44 | 46 | 50 | 3 | 19 |
Figure S2. Get High-res Image Gene #3: '2p gain mutation analysis' versus Clinical Feature #2: 'METHLYATION_CNMF'
P value = 3.7e-05 (Chi-square test), Q value = 0.022
Table S3. Gene #5: '3p gain mutation analysis' versus Clinical Feature #1: 'CN_CNMF'
| nPatients | CLUS_1 | CLUS_2 | CLUS_3 | CLUS_4 | CLUS_5 | CLUS_6 | CLUS_7 |
|---|---|---|---|---|---|---|---|
| ALL | 66 | 41 | 46 | 85 | 22 | 10 | 52 |
| 3P GAIN MUTATED | 3 | 2 | 7 | 5 | 3 | 5 | 2 |
| 3P GAIN WILD-TYPE | 63 | 39 | 39 | 80 | 19 | 5 | 50 |
Figure S3. Get High-res Image Gene #5: '3p gain mutation analysis' versus Clinical Feature #1: 'CN_CNMF'

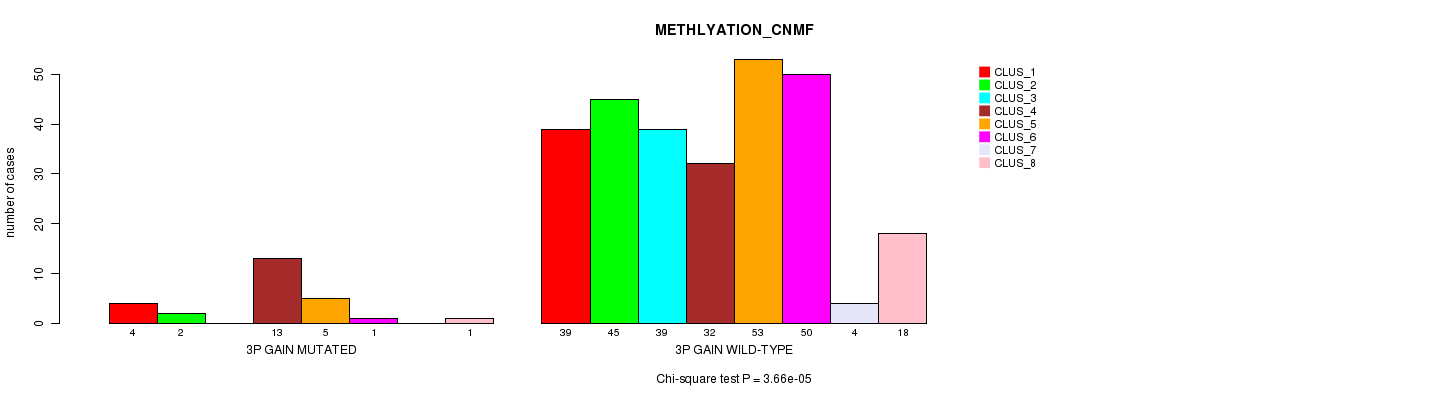
P value = 3.66e-05 (Chi-square test), Q value = 0.022
Table S4. Gene #5: '3p gain mutation analysis' versus Clinical Feature #2: 'METHLYATION_CNMF'
| nPatients | CLUS_1 | CLUS_2 | CLUS_3 | CLUS_4 | CLUS_5 | CLUS_6 | CLUS_7 | CLUS_8 |
|---|---|---|---|---|---|---|---|---|
| ALL | 43 | 47 | 39 | 45 | 58 | 51 | 4 | 19 |
| 3P GAIN MUTATED | 4 | 2 | 0 | 13 | 5 | 1 | 0 | 1 |
| 3P GAIN WILD-TYPE | 39 | 45 | 39 | 32 | 53 | 50 | 4 | 18 |
Figure S4. Get High-res Image Gene #5: '3p gain mutation analysis' versus Clinical Feature #2: 'METHLYATION_CNMF'
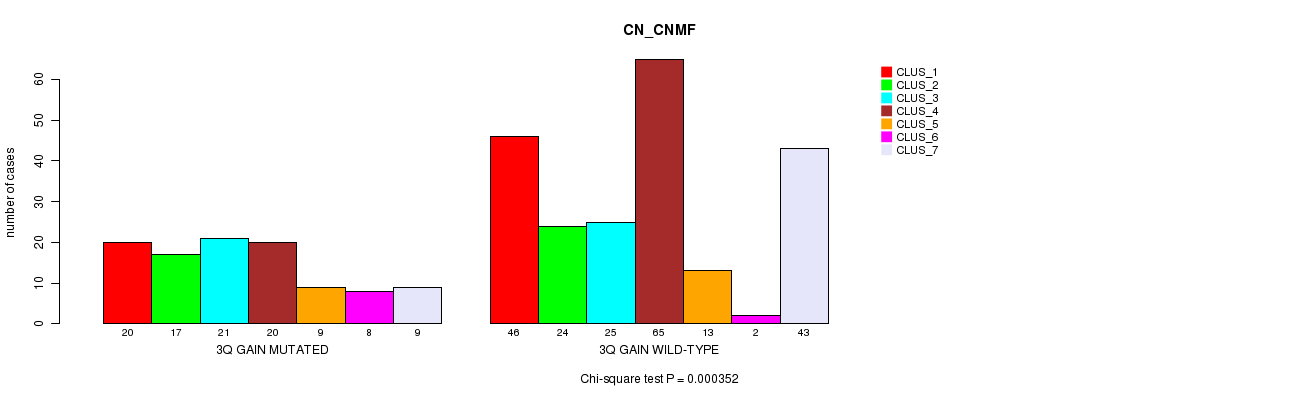
P value = 0.000352 (Chi-square test), Q value = 0.2
Table S5. Gene #6: '3q gain mutation analysis' versus Clinical Feature #1: 'CN_CNMF'
| nPatients | CLUS_1 | CLUS_2 | CLUS_3 | CLUS_4 | CLUS_5 | CLUS_6 | CLUS_7 |
|---|---|---|---|---|---|---|---|
| ALL | 66 | 41 | 46 | 85 | 22 | 10 | 52 |
| 3Q GAIN MUTATED | 20 | 17 | 21 | 20 | 9 | 8 | 9 |
| 3Q GAIN WILD-TYPE | 46 | 24 | 25 | 65 | 13 | 2 | 43 |
Figure S5. Get High-res Image Gene #6: '3q gain mutation analysis' versus Clinical Feature #1: 'CN_CNMF'
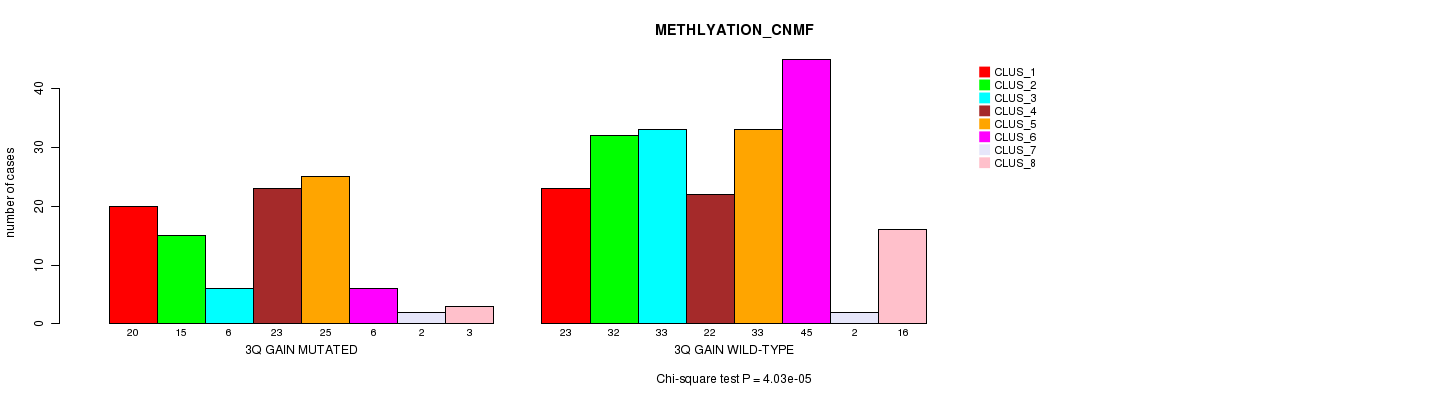
P value = 4.03e-05 (Chi-square test), Q value = 0.024
Table S6. Gene #6: '3q gain mutation analysis' versus Clinical Feature #2: 'METHLYATION_CNMF'
| nPatients | CLUS_1 | CLUS_2 | CLUS_3 | CLUS_4 | CLUS_5 | CLUS_6 | CLUS_7 | CLUS_8 |
|---|---|---|---|---|---|---|---|---|
| ALL | 43 | 47 | 39 | 45 | 58 | 51 | 4 | 19 |
| 3Q GAIN MUTATED | 20 | 15 | 6 | 23 | 25 | 6 | 2 | 3 |
| 3Q GAIN WILD-TYPE | 23 | 32 | 33 | 22 | 33 | 45 | 2 | 16 |
Figure S6. Get High-res Image Gene #6: '3q gain mutation analysis' versus Clinical Feature #2: 'METHLYATION_CNMF'
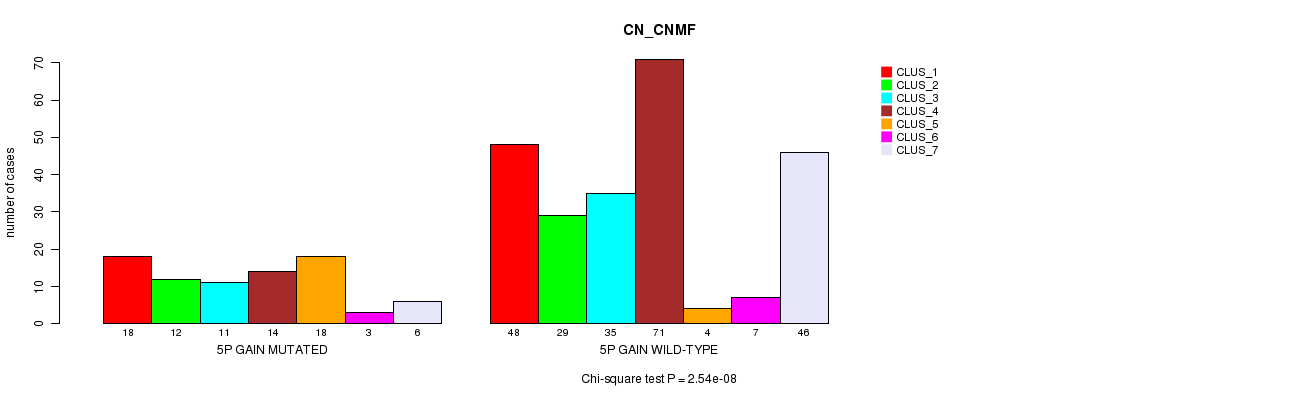
P value = 2.54e-08 (Chi-square test), Q value = 1.6e-05
Table S7. Gene #9: '5p gain mutation analysis' versus Clinical Feature #1: 'CN_CNMF'
| nPatients | CLUS_1 | CLUS_2 | CLUS_3 | CLUS_4 | CLUS_5 | CLUS_6 | CLUS_7 |
|---|---|---|---|---|---|---|---|
| ALL | 66 | 41 | 46 | 85 | 22 | 10 | 52 |
| 5P GAIN MUTATED | 18 | 12 | 11 | 14 | 18 | 3 | 6 |
| 5P GAIN WILD-TYPE | 48 | 29 | 35 | 71 | 4 | 7 | 46 |
Figure S7. Get High-res Image Gene #9: '5p gain mutation analysis' versus Clinical Feature #1: 'CN_CNMF'
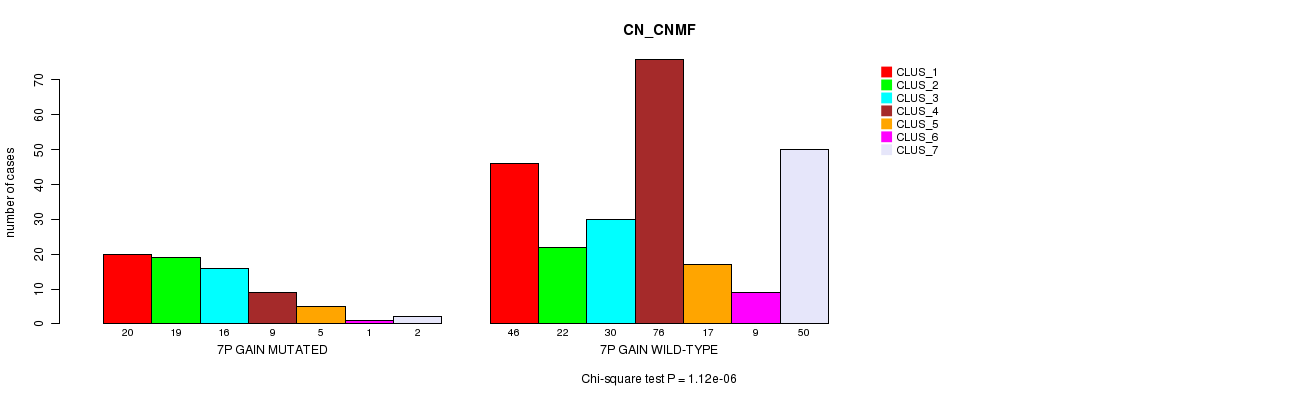
P value = 1.12e-06 (Chi-square test), Q value = 0.00068
Table S8. Gene #13: '7p gain mutation analysis' versus Clinical Feature #1: 'CN_CNMF'
| nPatients | CLUS_1 | CLUS_2 | CLUS_3 | CLUS_4 | CLUS_5 | CLUS_6 | CLUS_7 |
|---|---|---|---|---|---|---|---|
| ALL | 66 | 41 | 46 | 85 | 22 | 10 | 52 |
| 7P GAIN MUTATED | 20 | 19 | 16 | 9 | 5 | 1 | 2 |
| 7P GAIN WILD-TYPE | 46 | 22 | 30 | 76 | 17 | 9 | 50 |
Figure S8. Get High-res Image Gene #13: '7p gain mutation analysis' versus Clinical Feature #1: 'CN_CNMF'
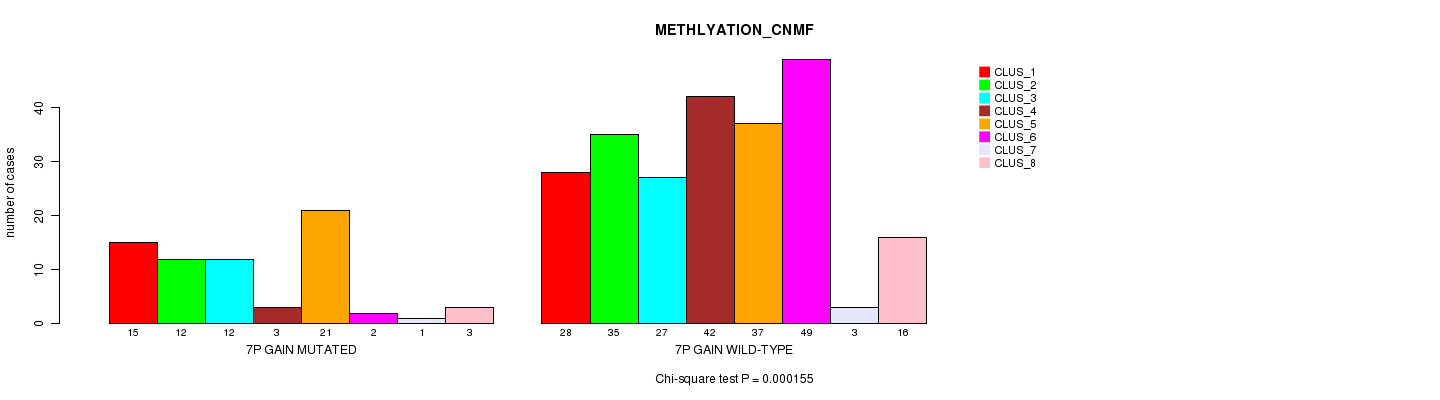
P value = 0.000155 (Chi-square test), Q value = 0.09
Table S9. Gene #13: '7p gain mutation analysis' versus Clinical Feature #2: 'METHLYATION_CNMF'
| nPatients | CLUS_1 | CLUS_2 | CLUS_3 | CLUS_4 | CLUS_5 | CLUS_6 | CLUS_7 | CLUS_8 |
|---|---|---|---|---|---|---|---|---|
| ALL | 43 | 47 | 39 | 45 | 58 | 51 | 4 | 19 |
| 7P GAIN MUTATED | 15 | 12 | 12 | 3 | 21 | 2 | 1 | 3 |
| 7P GAIN WILD-TYPE | 28 | 35 | 27 | 42 | 37 | 49 | 3 | 16 |
Figure S9. Get High-res Image Gene #13: '7p gain mutation analysis' versus Clinical Feature #2: 'METHLYATION_CNMF'
P value = 6.97e-06 (Chi-square test), Q value = 0.0042
Table S10. Gene #14: '7q gain mutation analysis' versus Clinical Feature #1: 'CN_CNMF'
| nPatients | CLUS_1 | CLUS_2 | CLUS_3 | CLUS_4 | CLUS_5 | CLUS_6 | CLUS_7 |
|---|---|---|---|---|---|---|---|
| ALL | 66 | 41 | 46 | 85 | 22 | 10 | 52 |
| 7Q GAIN MUTATED | 13 | 10 | 15 | 5 | 2 | 0 | 0 |
| 7Q GAIN WILD-TYPE | 53 | 31 | 31 | 80 | 20 | 10 | 52 |
Figure S10. Get High-res Image Gene #14: '7q gain mutation analysis' versus Clinical Feature #1: 'CN_CNMF'
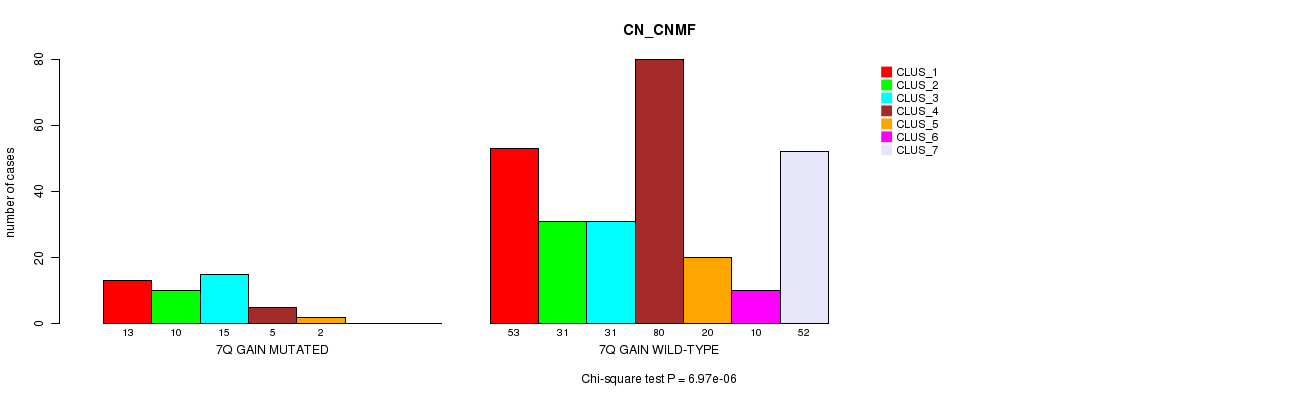
P value = 1.01e-06 (Chi-square test), Q value = 0.00061
Table S11. Gene #14: '7q gain mutation analysis' versus Clinical Feature #2: 'METHLYATION_CNMF'
| nPatients | CLUS_1 | CLUS_2 | CLUS_3 | CLUS_4 | CLUS_5 | CLUS_6 | CLUS_7 | CLUS_8 |
|---|---|---|---|---|---|---|---|---|
| ALL | 43 | 47 | 39 | 45 | 58 | 51 | 4 | 19 |
| 7Q GAIN MUTATED | 9 | 6 | 3 | 3 | 21 | 0 | 1 | 0 |
| 7Q GAIN WILD-TYPE | 34 | 41 | 36 | 42 | 37 | 51 | 3 | 19 |
Figure S11. Get High-res Image Gene #14: '7q gain mutation analysis' versus Clinical Feature #2: 'METHLYATION_CNMF'
P value = 7.85e-06 (Chi-square test), Q value = 0.0047
Table S12. Gene #15: '8p gain mutation analysis' versus Clinical Feature #1: 'CN_CNMF'
| nPatients | CLUS_1 | CLUS_2 | CLUS_3 | CLUS_4 | CLUS_5 | CLUS_6 | CLUS_7 |
|---|---|---|---|---|---|---|---|
| ALL | 66 | 41 | 46 | 85 | 22 | 10 | 52 |
| 8P GAIN MUTATED | 6 | 9 | 8 | 10 | 6 | 7 | 3 |
| 8P GAIN WILD-TYPE | 60 | 32 | 38 | 75 | 16 | 3 | 49 |
Figure S12. Get High-res Image Gene #15: '8p gain mutation analysis' versus Clinical Feature #1: 'CN_CNMF'
P value = 2.25e-07 (Chi-square test), Q value = 0.00014
Table S13. Gene #16: '8q gain mutation analysis' versus Clinical Feature #1: 'CN_CNMF'
| nPatients | CLUS_1 | CLUS_2 | CLUS_3 | CLUS_4 | CLUS_5 | CLUS_6 | CLUS_7 |
|---|---|---|---|---|---|---|---|
| ALL | 66 | 41 | 46 | 85 | 22 | 10 | 52 |
| 8Q GAIN MUTATED | 31 | 25 | 15 | 16 | 14 | 9 | 19 |
| 8Q GAIN WILD-TYPE | 35 | 16 | 31 | 69 | 8 | 1 | 33 |
Figure S13. Get High-res Image Gene #16: '8q gain mutation analysis' versus Clinical Feature #1: 'CN_CNMF'
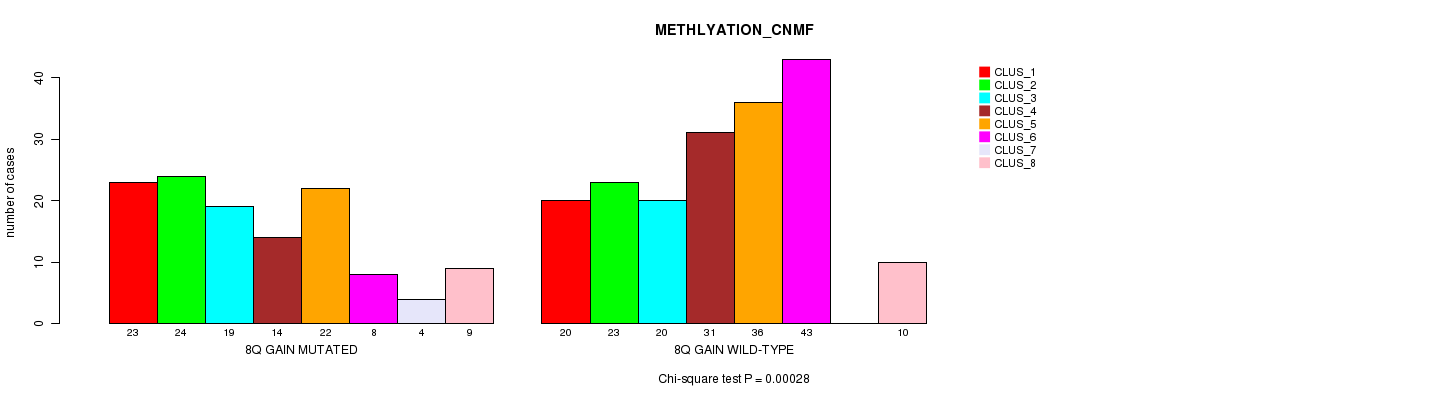
P value = 0.00028 (Chi-square test), Q value = 0.16
Table S14. Gene #16: '8q gain mutation analysis' versus Clinical Feature #2: 'METHLYATION_CNMF'
| nPatients | CLUS_1 | CLUS_2 | CLUS_3 | CLUS_4 | CLUS_5 | CLUS_6 | CLUS_7 | CLUS_8 |
|---|---|---|---|---|---|---|---|---|
| ALL | 43 | 47 | 39 | 45 | 58 | 51 | 4 | 19 |
| 8Q GAIN MUTATED | 23 | 24 | 19 | 14 | 22 | 8 | 4 | 9 |
| 8Q GAIN WILD-TYPE | 20 | 23 | 20 | 31 | 36 | 43 | 0 | 10 |
Figure S14. Get High-res Image Gene #16: '8q gain mutation analysis' versus Clinical Feature #2: 'METHLYATION_CNMF'
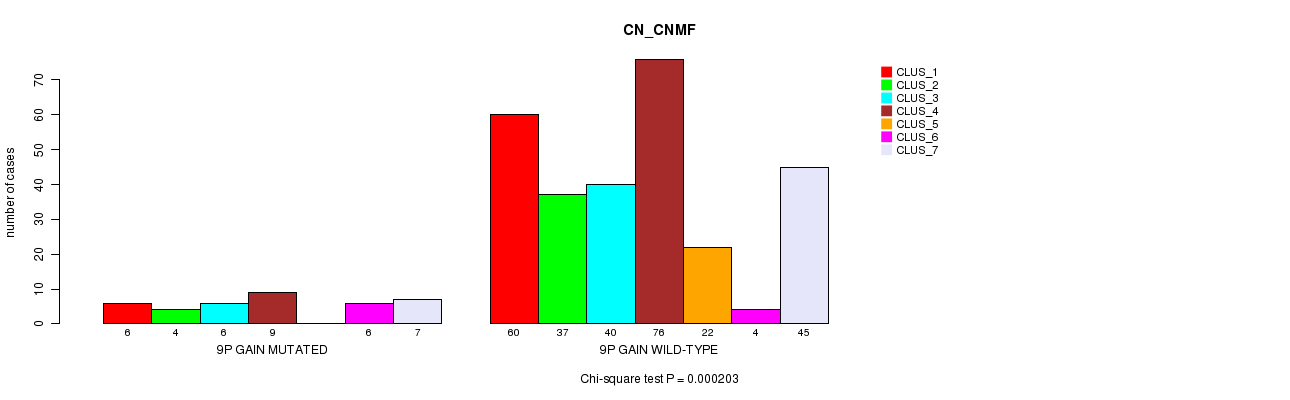
P value = 0.000203 (Chi-square test), Q value = 0.12
Table S15. Gene #17: '9p gain mutation analysis' versus Clinical Feature #1: 'CN_CNMF'
| nPatients | CLUS_1 | CLUS_2 | CLUS_3 | CLUS_4 | CLUS_5 | CLUS_6 | CLUS_7 |
|---|---|---|---|---|---|---|---|
| ALL | 66 | 41 | 46 | 85 | 22 | 10 | 52 |
| 9P GAIN MUTATED | 6 | 4 | 6 | 9 | 0 | 6 | 7 |
| 9P GAIN WILD-TYPE | 60 | 37 | 40 | 76 | 22 | 4 | 45 |
Figure S15. Get High-res Image Gene #17: '9p gain mutation analysis' versus Clinical Feature #1: 'CN_CNMF'
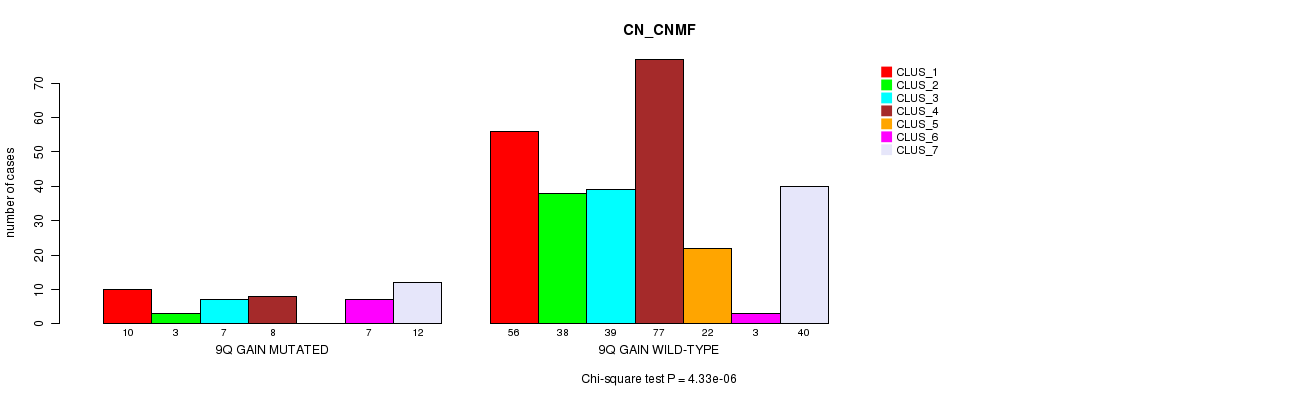
P value = 4.33e-06 (Chi-square test), Q value = 0.0026
Table S16. Gene #18: '9q gain mutation analysis' versus Clinical Feature #1: 'CN_CNMF'
| nPatients | CLUS_1 | CLUS_2 | CLUS_3 | CLUS_4 | CLUS_5 | CLUS_6 | CLUS_7 |
|---|---|---|---|---|---|---|---|
| ALL | 66 | 41 | 46 | 85 | 22 | 10 | 52 |
| 9Q GAIN MUTATED | 10 | 3 | 7 | 8 | 0 | 7 | 12 |
| 9Q GAIN WILD-TYPE | 56 | 38 | 39 | 77 | 22 | 3 | 40 |
Figure S16. Get High-res Image Gene #18: '9q gain mutation analysis' versus Clinical Feature #1: 'CN_CNMF'
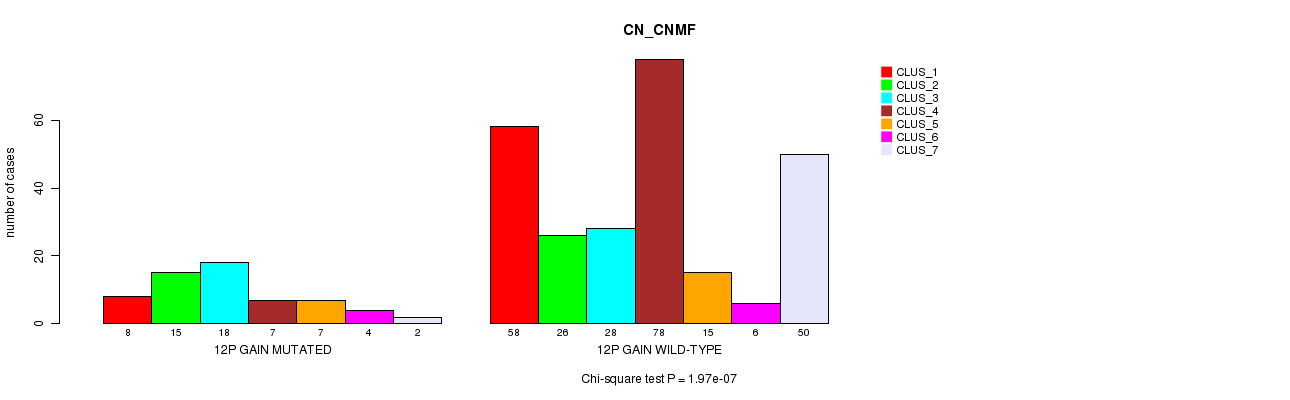
P value = 1.97e-07 (Chi-square test), Q value = 0.00012
Table S17. Gene #23: '12p gain mutation analysis' versus Clinical Feature #1: 'CN_CNMF'
| nPatients | CLUS_1 | CLUS_2 | CLUS_3 | CLUS_4 | CLUS_5 | CLUS_6 | CLUS_7 |
|---|---|---|---|---|---|---|---|
| ALL | 66 | 41 | 46 | 85 | 22 | 10 | 52 |
| 12P GAIN MUTATED | 8 | 15 | 18 | 7 | 7 | 4 | 2 |
| 12P GAIN WILD-TYPE | 58 | 26 | 28 | 78 | 15 | 6 | 50 |
Figure S17. Get High-res Image Gene #23: '12p gain mutation analysis' versus Clinical Feature #1: 'CN_CNMF'
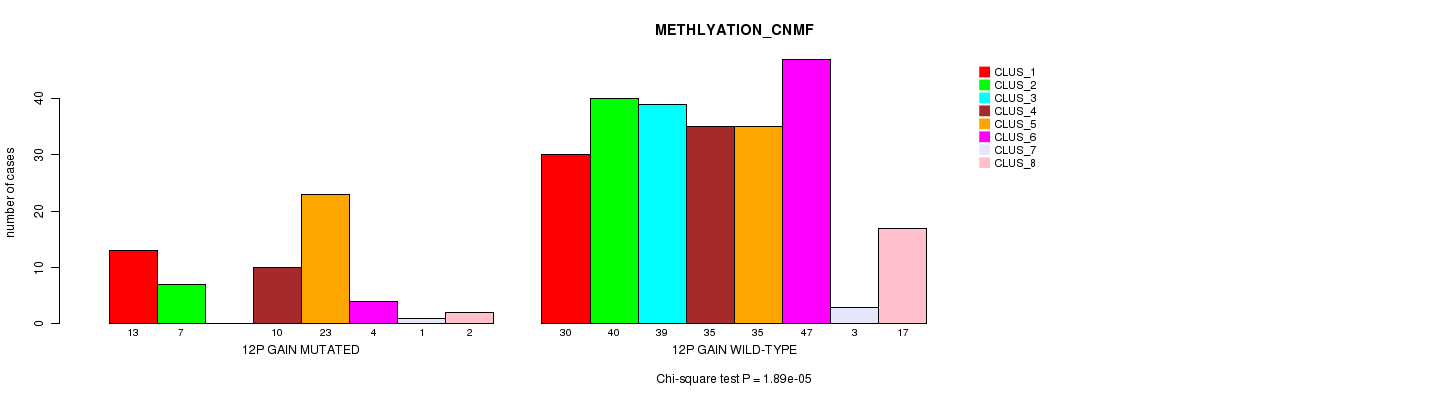
P value = 1.89e-05 (Chi-square test), Q value = 0.011
Table S18. Gene #23: '12p gain mutation analysis' versus Clinical Feature #2: 'METHLYATION_CNMF'
| nPatients | CLUS_1 | CLUS_2 | CLUS_3 | CLUS_4 | CLUS_5 | CLUS_6 | CLUS_7 | CLUS_8 |
|---|---|---|---|---|---|---|---|---|
| ALL | 43 | 47 | 39 | 45 | 58 | 51 | 4 | 19 |
| 12P GAIN MUTATED | 13 | 7 | 0 | 10 | 23 | 4 | 1 | 2 |
| 12P GAIN WILD-TYPE | 30 | 40 | 39 | 35 | 35 | 47 | 3 | 17 |
Figure S18. Get High-res Image Gene #23: '12p gain mutation analysis' versus Clinical Feature #2: 'METHLYATION_CNMF'
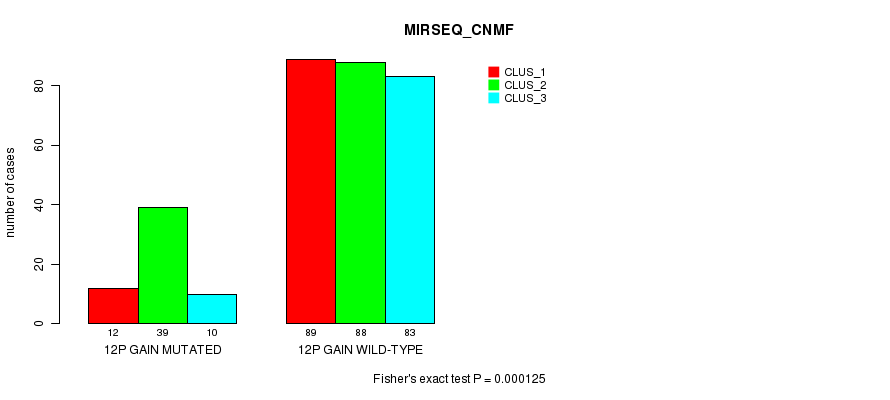
P value = 0.000125 (Fisher's exact test), Q value = 0.073
Table S19. Gene #23: '12p gain mutation analysis' versus Clinical Feature #7: 'MIRSEQ_CNMF'
| nPatients | CLUS_1 | CLUS_2 | CLUS_3 |
|---|---|---|---|
| ALL | 101 | 127 | 93 |
| 12P GAIN MUTATED | 12 | 39 | 10 |
| 12P GAIN WILD-TYPE | 89 | 88 | 83 |
Figure S19. Get High-res Image Gene #23: '12p gain mutation analysis' versus Clinical Feature #7: 'MIRSEQ_CNMF'
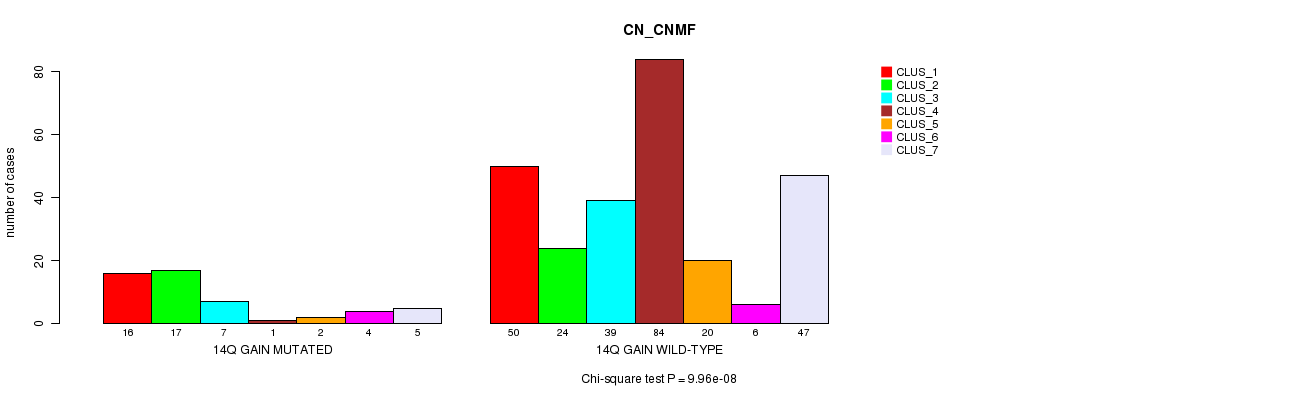
P value = 9.96e-08 (Chi-square test), Q value = 6.1e-05
Table S20. Gene #26: '14q gain mutation analysis' versus Clinical Feature #1: 'CN_CNMF'
| nPatients | CLUS_1 | CLUS_2 | CLUS_3 | CLUS_4 | CLUS_5 | CLUS_6 | CLUS_7 |
|---|---|---|---|---|---|---|---|
| ALL | 66 | 41 | 46 | 85 | 22 | 10 | 52 |
| 14Q GAIN MUTATED | 16 | 17 | 7 | 1 | 2 | 4 | 5 |
| 14Q GAIN WILD-TYPE | 50 | 24 | 39 | 84 | 20 | 6 | 47 |
Figure S20. Get High-res Image Gene #26: '14q gain mutation analysis' versus Clinical Feature #1: 'CN_CNMF'
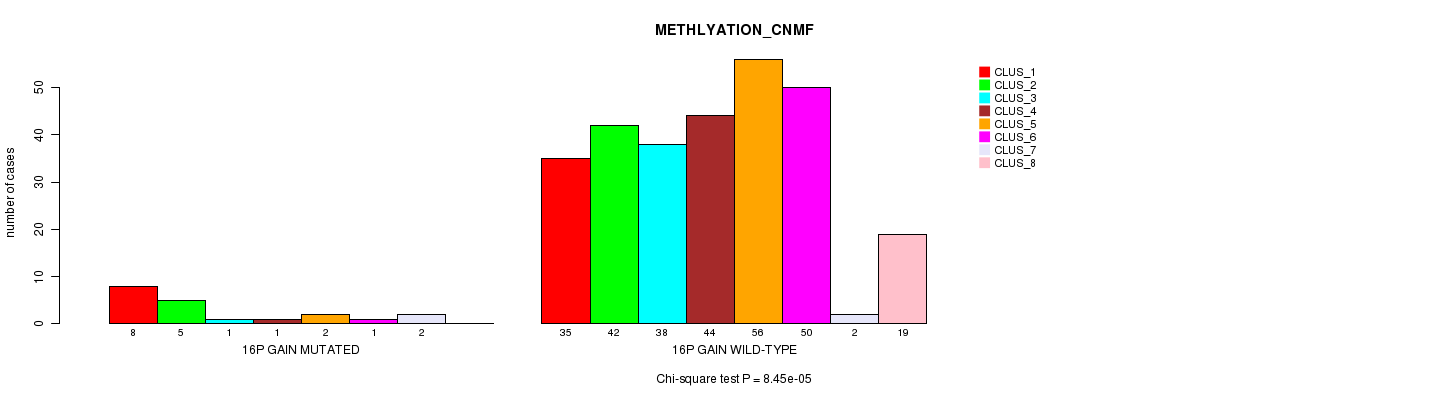
P value = 8.45e-05 (Chi-square test), Q value = 0.049
Table S21. Gene #28: '16p gain mutation analysis' versus Clinical Feature #2: 'METHLYATION_CNMF'
| nPatients | CLUS_1 | CLUS_2 | CLUS_3 | CLUS_4 | CLUS_5 | CLUS_6 | CLUS_7 | CLUS_8 |
|---|---|---|---|---|---|---|---|---|
| ALL | 43 | 47 | 39 | 45 | 58 | 51 | 4 | 19 |
| 16P GAIN MUTATED | 8 | 5 | 1 | 1 | 2 | 1 | 2 | 0 |
| 16P GAIN WILD-TYPE | 35 | 42 | 38 | 44 | 56 | 50 | 2 | 19 |
Figure S21. Get High-res Image Gene #28: '16p gain mutation analysis' versus Clinical Feature #2: 'METHLYATION_CNMF'
P value = 4.85e-06 (Chi-square test), Q value = 0.0029
Table S22. Gene #32: '18p gain mutation analysis' versus Clinical Feature #1: 'CN_CNMF'
| nPatients | CLUS_1 | CLUS_2 | CLUS_3 | CLUS_4 | CLUS_5 | CLUS_6 | CLUS_7 |
|---|---|---|---|---|---|---|---|
| ALL | 66 | 41 | 46 | 85 | 22 | 10 | 52 |
| 18P GAIN MUTATED | 11 | 10 | 11 | 5 | 7 | 6 | 2 |
| 18P GAIN WILD-TYPE | 55 | 31 | 35 | 80 | 15 | 4 | 50 |
Figure S22. Get High-res Image Gene #32: '18p gain mutation analysis' versus Clinical Feature #1: 'CN_CNMF'
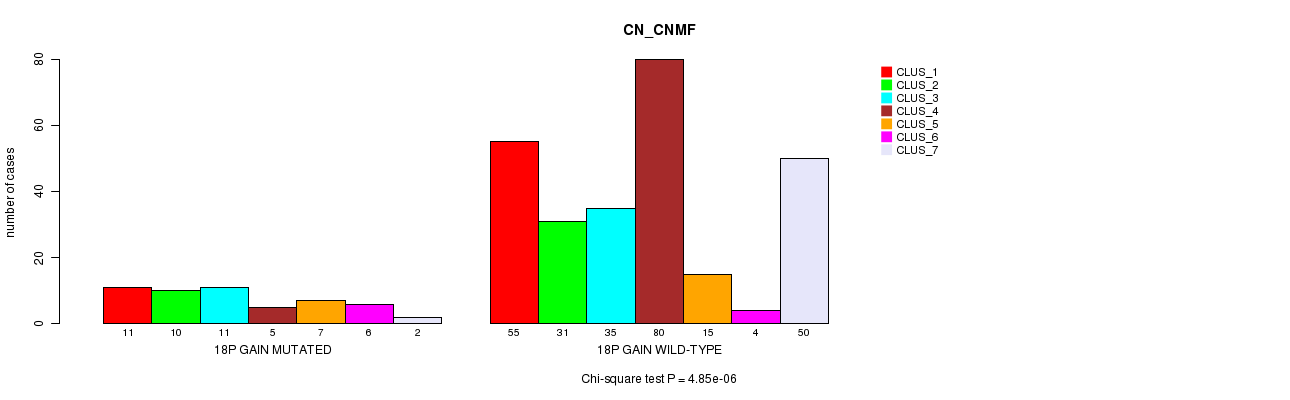
P value = 0.000241 (Chi-square test), Q value = 0.14
Table S23. Gene #33: '18q gain mutation analysis' versus Clinical Feature #1: 'CN_CNMF'
| nPatients | CLUS_1 | CLUS_2 | CLUS_3 | CLUS_4 | CLUS_5 | CLUS_6 | CLUS_7 |
|---|---|---|---|---|---|---|---|
| ALL | 66 | 41 | 46 | 85 | 22 | 10 | 52 |
| 18Q GAIN MUTATED | 3 | 1 | 8 | 5 | 0 | 3 | 0 |
| 18Q GAIN WILD-TYPE | 63 | 40 | 38 | 80 | 22 | 7 | 52 |
Figure S23. Get High-res Image Gene #33: '18q gain mutation analysis' versus Clinical Feature #1: 'CN_CNMF'
P value = 0.000177 (Chi-square test), Q value = 0.1
Table S24. Gene #33: '18q gain mutation analysis' versus Clinical Feature #2: 'METHLYATION_CNMF'
| nPatients | CLUS_1 | CLUS_2 | CLUS_3 | CLUS_4 | CLUS_5 | CLUS_6 | CLUS_7 | CLUS_8 |
|---|---|---|---|---|---|---|---|---|
| ALL | 43 | 47 | 39 | 45 | 58 | 51 | 4 | 19 |
| 18Q GAIN MUTATED | 2 | 0 | 0 | 9 | 8 | 0 | 0 | 1 |
| 18Q GAIN WILD-TYPE | 41 | 47 | 39 | 36 | 50 | 51 | 4 | 18 |
Figure S24. Get High-res Image Gene #33: '18q gain mutation analysis' versus Clinical Feature #2: 'METHLYATION_CNMF'

P value = 3.18e-07 (Chi-square test), Q value = 0.00019
Table S25. Gene #36: '20p gain mutation analysis' versus Clinical Feature #1: 'CN_CNMF'
| nPatients | CLUS_1 | CLUS_2 | CLUS_3 | CLUS_4 | CLUS_5 | CLUS_6 | CLUS_7 |
|---|---|---|---|---|---|---|---|
| ALL | 66 | 41 | 46 | 85 | 22 | 10 | 52 |
| 20P GAIN MUTATED | 12 | 21 | 11 | 6 | 8 | 1 | 6 |
| 20P GAIN WILD-TYPE | 54 | 20 | 35 | 79 | 14 | 9 | 46 |
Figure S25. Get High-res Image Gene #36: '20p gain mutation analysis' versus Clinical Feature #1: 'CN_CNMF'
P value = 7.9e-05 (Chi-square test), Q value = 0.046
Table S26. Gene #36: '20p gain mutation analysis' versus Clinical Feature #2: 'METHLYATION_CNMF'
| nPatients | CLUS_1 | CLUS_2 | CLUS_3 | CLUS_4 | CLUS_5 | CLUS_6 | CLUS_7 | CLUS_8 |
|---|---|---|---|---|---|---|---|---|
| ALL | 43 | 47 | 39 | 45 | 58 | 51 | 4 | 19 |
| 20P GAIN MUTATED | 11 | 17 | 3 | 9 | 16 | 2 | 3 | 2 |
| 20P GAIN WILD-TYPE | 32 | 30 | 36 | 36 | 42 | 49 | 1 | 17 |
Figure S26. Get High-res Image Gene #36: '20p gain mutation analysis' versus Clinical Feature #2: 'METHLYATION_CNMF'
P value = 3.26e-09 (Chi-square test), Q value = 2e-06
Table S27. Gene #37: '20q gain mutation analysis' versus Clinical Feature #1: 'CN_CNMF'
| nPatients | CLUS_1 | CLUS_2 | CLUS_3 | CLUS_4 | CLUS_5 | CLUS_6 | CLUS_7 |
|---|---|---|---|---|---|---|---|
| ALL | 66 | 41 | 46 | 85 | 22 | 10 | 52 |
| 20Q GAIN MUTATED | 14 | 23 | 11 | 5 | 9 | 3 | 5 |
| 20Q GAIN WILD-TYPE | 52 | 18 | 35 | 80 | 13 | 7 | 47 |
Figure S27. Get High-res Image Gene #37: '20q gain mutation analysis' versus Clinical Feature #1: 'CN_CNMF'
P value = 6.1e-05 (Chi-square test), Q value = 0.036
Table S28. Gene #37: '20q gain mutation analysis' versus Clinical Feature #2: 'METHLYATION_CNMF'
| nPatients | CLUS_1 | CLUS_2 | CLUS_3 | CLUS_4 | CLUS_5 | CLUS_6 | CLUS_7 | CLUS_8 |
|---|---|---|---|---|---|---|---|---|
| ALL | 43 | 47 | 39 | 45 | 58 | 51 | 4 | 19 |
| 20Q GAIN MUTATED | 14 | 18 | 5 | 6 | 16 | 2 | 3 | 4 |
| 20Q GAIN WILD-TYPE | 29 | 29 | 34 | 39 | 42 | 49 | 1 | 15 |
Figure S28. Get High-res Image Gene #37: '20q gain mutation analysis' versus Clinical Feature #2: 'METHLYATION_CNMF'
P value = 8.21e-05 (Chi-square test), Q value = 0.048
Table S29. Gene #39: '22q gain mutation analysis' versus Clinical Feature #2: 'METHLYATION_CNMF'
| nPatients | CLUS_1 | CLUS_2 | CLUS_3 | CLUS_4 | CLUS_5 | CLUS_6 | CLUS_7 | CLUS_8 |
|---|---|---|---|---|---|---|---|---|
| ALL | 43 | 47 | 39 | 45 | 58 | 51 | 4 | 19 |
| 22Q GAIN MUTATED | 5 | 5 | 2 | 2 | 19 | 5 | 0 | 0 |
| 22Q GAIN WILD-TYPE | 38 | 42 | 37 | 43 | 39 | 46 | 4 | 19 |
Figure S29. Get High-res Image Gene #39: '22q gain mutation analysis' versus Clinical Feature #2: 'METHLYATION_CNMF'
P value = 5.13e-08 (Chi-square test), Q value = 3.1e-05
Table S30. Gene #41: '1p loss mutation analysis' versus Clinical Feature #1: 'CN_CNMF'
| nPatients | CLUS_1 | CLUS_2 | CLUS_3 | CLUS_4 | CLUS_5 | CLUS_6 | CLUS_7 |
|---|---|---|---|---|---|---|---|
| ALL | 66 | 41 | 46 | 85 | 22 | 10 | 52 |
| 1P LOSS MUTATED | 2 | 3 | 11 | 0 | 0 | 0 | 0 |
| 1P LOSS WILD-TYPE | 64 | 38 | 35 | 85 | 22 | 10 | 52 |
Figure S30. Get High-res Image Gene #41: '1p loss mutation analysis' versus Clinical Feature #1: 'CN_CNMF'
P value = 9.7e-07 (Chi-square test), Q value = 0.00059
Table S31. Gene #41: '1p loss mutation analysis' versus Clinical Feature #2: 'METHLYATION_CNMF'
| nPatients | CLUS_1 | CLUS_2 | CLUS_3 | CLUS_4 | CLUS_5 | CLUS_6 | CLUS_7 | CLUS_8 |
|---|---|---|---|---|---|---|---|---|
| ALL | 43 | 47 | 39 | 45 | 58 | 51 | 4 | 19 |
| 1P LOSS MUTATED | 2 | 0 | 0 | 1 | 12 | 0 | 1 | 0 |
| 1P LOSS WILD-TYPE | 41 | 47 | 39 | 44 | 46 | 51 | 3 | 19 |
Figure S31. Get High-res Image Gene #41: '1p loss mutation analysis' versus Clinical Feature #2: 'METHLYATION_CNMF'
P value = 1.86e-12 (Chi-square test), Q value = 1.2e-09
Table S32. Gene #44: '3p loss mutation analysis' versus Clinical Feature #1: 'CN_CNMF'
| nPatients | CLUS_1 | CLUS_2 | CLUS_3 | CLUS_4 | CLUS_5 | CLUS_6 | CLUS_7 |
|---|---|---|---|---|---|---|---|
| ALL | 66 | 41 | 46 | 85 | 22 | 10 | 52 |
| 3P LOSS MUTATED | 36 | 20 | 25 | 3 | 15 | 3 | 23 |
| 3P LOSS WILD-TYPE | 30 | 21 | 21 | 82 | 7 | 7 | 29 |
Figure S32. Get High-res Image Gene #44: '3p loss mutation analysis' versus Clinical Feature #1: 'CN_CNMF'
P value = 1.53e-07 (Chi-square test), Q value = 9.3e-05
Table S33. Gene #44: '3p loss mutation analysis' versus Clinical Feature #2: 'METHLYATION_CNMF'
| nPatients | CLUS_1 | CLUS_2 | CLUS_3 | CLUS_4 | CLUS_5 | CLUS_6 | CLUS_7 | CLUS_8 |
|---|---|---|---|---|---|---|---|---|
| ALL | 43 | 47 | 39 | 45 | 58 | 51 | 4 | 19 |
| 3P LOSS MUTATED | 22 | 21 | 15 | 10 | 34 | 3 | 2 | 11 |
| 3P LOSS WILD-TYPE | 21 | 26 | 24 | 35 | 24 | 48 | 2 | 8 |
Figure S33. Get High-res Image Gene #44: '3p loss mutation analysis' versus Clinical Feature #2: 'METHLYATION_CNMF'
P value = 1.76e-11 (Chi-square test), Q value = 1.1e-08
Table S34. Gene #46: '4p loss mutation analysis' versus Clinical Feature #1: 'CN_CNMF'
| nPatients | CLUS_1 | CLUS_2 | CLUS_3 | CLUS_4 | CLUS_5 | CLUS_6 | CLUS_7 |
|---|---|---|---|---|---|---|---|
| ALL | 66 | 41 | 46 | 85 | 22 | 10 | 52 |
| 4P LOSS MUTATED | 21 | 16 | 27 | 5 | 4 | 0 | 5 |
| 4P LOSS WILD-TYPE | 45 | 25 | 19 | 80 | 18 | 10 | 47 |
Figure S34. Get High-res Image Gene #46: '4p loss mutation analysis' versus Clinical Feature #1: 'CN_CNMF'
P value = 4.56e-08 (Chi-square test), Q value = 2.8e-05
Table S35. Gene #46: '4p loss mutation analysis' versus Clinical Feature #2: 'METHLYATION_CNMF'
| nPatients | CLUS_1 | CLUS_2 | CLUS_3 | CLUS_4 | CLUS_5 | CLUS_6 | CLUS_7 | CLUS_8 |
|---|---|---|---|---|---|---|---|---|
| ALL | 43 | 47 | 39 | 45 | 58 | 51 | 4 | 19 |
| 4P LOSS MUTATED | 12 | 5 | 8 | 12 | 31 | 1 | 1 | 3 |
| 4P LOSS WILD-TYPE | 31 | 42 | 31 | 33 | 27 | 50 | 3 | 16 |
Figure S35. Get High-res Image Gene #46: '4p loss mutation analysis' versus Clinical Feature #2: 'METHLYATION_CNMF'
P value = 0.000275 (Fisher's exact test), Q value = 0.16
Table S36. Gene #46: '4p loss mutation analysis' versus Clinical Feature #6: 'MRNASEQ_CHIERARCHICAL'
| nPatients | CLUS_1 | CLUS_2 | CLUS_3 |
|---|---|---|---|
| ALL | 95 | 84 | 120 |
| 4P LOSS MUTATED | 20 | 10 | 43 |
| 4P LOSS WILD-TYPE | 75 | 74 | 77 |
Figure S36. Get High-res Image Gene #46: '4p loss mutation analysis' versus Clinical Feature #6: 'MRNASEQ_CHIERARCHICAL'
P value = 0.00017 (Fisher's exact test), Q value = 0.098
Table S37. Gene #46: '4p loss mutation analysis' versus Clinical Feature #7: 'MIRSEQ_CNMF'
| nPatients | CLUS_1 | CLUS_2 | CLUS_3 |
|---|---|---|---|
| ALL | 101 | 127 | 93 |
| 4P LOSS MUTATED | 20 | 46 | 12 |
| 4P LOSS WILD-TYPE | 81 | 81 | 81 |
Figure S37. Get High-res Image Gene #46: '4p loss mutation analysis' versus Clinical Feature #7: 'MIRSEQ_CNMF'
P value = 4.08e-09 (Chi-square test), Q value = 2.5e-06
Table S38. Gene #47: '4q loss mutation analysis' versus Clinical Feature #1: 'CN_CNMF'
| nPatients | CLUS_1 | CLUS_2 | CLUS_3 | CLUS_4 | CLUS_5 | CLUS_6 | CLUS_7 |
|---|---|---|---|---|---|---|---|
| ALL | 66 | 41 | 46 | 85 | 22 | 10 | 52 |
| 4Q LOSS MUTATED | 7 | 10 | 21 | 3 | 6 | 1 | 3 |
| 4Q LOSS WILD-TYPE | 59 | 31 | 25 | 82 | 16 | 9 | 49 |
Figure S38. Get High-res Image Gene #47: '4q loss mutation analysis' versus Clinical Feature #1: 'CN_CNMF'
P value = 5.94e-06 (Chi-square test), Q value = 0.0036
Table S39. Gene #47: '4q loss mutation analysis' versus Clinical Feature #2: 'METHLYATION_CNMF'
| nPatients | CLUS_1 | CLUS_2 | CLUS_3 | CLUS_4 | CLUS_5 | CLUS_6 | CLUS_7 | CLUS_8 |
|---|---|---|---|---|---|---|---|---|
| ALL | 43 | 47 | 39 | 45 | 58 | 51 | 4 | 19 |
| 4Q LOSS MUTATED | 10 | 7 | 5 | 6 | 22 | 0 | 0 | 0 |
| 4Q LOSS WILD-TYPE | 33 | 40 | 34 | 39 | 36 | 51 | 4 | 19 |
Figure S39. Get High-res Image Gene #47: '4q loss mutation analysis' versus Clinical Feature #2: 'METHLYATION_CNMF'
P value = 1.67e-10 (Chi-square test), Q value = 1e-07
Table S40. Gene #49: '5q loss mutation analysis' versus Clinical Feature #1: 'CN_CNMF'
| nPatients | CLUS_1 | CLUS_2 | CLUS_3 | CLUS_4 | CLUS_5 | CLUS_6 | CLUS_7 |
|---|---|---|---|---|---|---|---|
| ALL | 66 | 41 | 46 | 85 | 22 | 10 | 52 |
| 5Q LOSS MUTATED | 13 | 13 | 23 | 1 | 7 | 1 | 4 |
| 5Q LOSS WILD-TYPE | 53 | 28 | 23 | 84 | 15 | 9 | 48 |
Figure S40. Get High-res Image Gene #49: '5q loss mutation analysis' versus Clinical Feature #1: 'CN_CNMF'
P value = 2.31e-10 (Chi-square test), Q value = 1.4e-07
Table S41. Gene #49: '5q loss mutation analysis' versus Clinical Feature #2: 'METHLYATION_CNMF'
| nPatients | CLUS_1 | CLUS_2 | CLUS_3 | CLUS_4 | CLUS_5 | CLUS_6 | CLUS_7 | CLUS_8 |
|---|---|---|---|---|---|---|---|---|
| ALL | 43 | 47 | 39 | 45 | 58 | 51 | 4 | 19 |
| 5Q LOSS MUTATED | 20 | 11 | 1 | 4 | 23 | 0 | 0 | 2 |
| 5Q LOSS WILD-TYPE | 23 | 36 | 38 | 41 | 35 | 51 | 4 | 17 |
Figure S41. Get High-res Image Gene #49: '5q loss mutation analysis' versus Clinical Feature #2: 'METHLYATION_CNMF'
P value = 5.52e-05 (Fisher's exact test), Q value = 0.033
Table S42. Gene #49: '5q loss mutation analysis' versus Clinical Feature #6: 'MRNASEQ_CHIERARCHICAL'
| nPatients | CLUS_1 | CLUS_2 | CLUS_3 |
|---|---|---|---|
| ALL | 95 | 84 | 120 |
| 5Q LOSS MUTATED | 17 | 6 | 38 |
| 5Q LOSS WILD-TYPE | 78 | 78 | 82 |
Figure S42. Get High-res Image Gene #49: '5q loss mutation analysis' versus Clinical Feature #6: 'MRNASEQ_CHIERARCHICAL'
P value = 9.25e-05 (Chi-square test), Q value = 0.054
Table S43. Gene #54: '8p loss mutation analysis' versus Clinical Feature #1: 'CN_CNMF'
| nPatients | CLUS_1 | CLUS_2 | CLUS_3 | CLUS_4 | CLUS_5 | CLUS_6 | CLUS_7 |
|---|---|---|---|---|---|---|---|
| ALL | 66 | 41 | 46 | 85 | 22 | 10 | 52 |
| 8P LOSS MUTATED | 24 | 10 | 9 | 3 | 7 | 2 | 15 |
| 8P LOSS WILD-TYPE | 42 | 31 | 37 | 82 | 15 | 8 | 37 |
Figure S43. Get High-res Image Gene #54: '8p loss mutation analysis' versus Clinical Feature #1: 'CN_CNMF'
P value = 1.39e-05 (Chi-square test), Q value = 0.0083
Table S44. Gene #54: '8p loss mutation analysis' versus Clinical Feature #2: 'METHLYATION_CNMF'
| nPatients | CLUS_1 | CLUS_2 | CLUS_3 | CLUS_4 | CLUS_5 | CLUS_6 | CLUS_7 | CLUS_8 |
|---|---|---|---|---|---|---|---|---|
| ALL | 43 | 47 | 39 | 45 | 58 | 51 | 4 | 19 |
| 8P LOSS MUTATED | 9 | 18 | 16 | 5 | 12 | 1 | 0 | 2 |
| 8P LOSS WILD-TYPE | 34 | 29 | 23 | 40 | 46 | 50 | 4 | 17 |
Figure S44. Get High-res Image Gene #54: '8p loss mutation analysis' versus Clinical Feature #2: 'METHLYATION_CNMF'
P value = 9.95e-09 (Chi-square test), Q value = 6.2e-06
Table S45. Gene #56: '9p loss mutation analysis' versus Clinical Feature #1: 'CN_CNMF'
| nPatients | CLUS_1 | CLUS_2 | CLUS_3 | CLUS_4 | CLUS_5 | CLUS_6 | CLUS_7 |
|---|---|---|---|---|---|---|---|
| ALL | 66 | 41 | 46 | 85 | 22 | 10 | 52 |
| 9P LOSS MUTATED | 20 | 18 | 20 | 2 | 12 | 1 | 16 |
| 9P LOSS WILD-TYPE | 46 | 23 | 26 | 83 | 10 | 9 | 36 |
Figure S45. Get High-res Image Gene #56: '9p loss mutation analysis' versus Clinical Feature #1: 'CN_CNMF'
P value = 1.24e-08 (Chi-square test), Q value = 7.7e-06
Table S46. Gene #56: '9p loss mutation analysis' versus Clinical Feature #2: 'METHLYATION_CNMF'
| nPatients | CLUS_1 | CLUS_2 | CLUS_3 | CLUS_4 | CLUS_5 | CLUS_6 | CLUS_7 | CLUS_8 |
|---|---|---|---|---|---|---|---|---|
| ALL | 43 | 47 | 39 | 45 | 58 | 51 | 4 | 19 |
| 9P LOSS MUTATED | 24 | 12 | 9 | 5 | 26 | 1 | 2 | 5 |
| 9P LOSS WILD-TYPE | 19 | 35 | 30 | 40 | 32 | 50 | 2 | 14 |
Figure S46. Get High-res Image Gene #56: '9p loss mutation analysis' versus Clinical Feature #2: 'METHLYATION_CNMF'
P value = 7.49e-09 (Chi-square test), Q value = 4.7e-06
Table S47. Gene #61: '11q loss mutation analysis' versus Clinical Feature #1: 'CN_CNMF'
| nPatients | CLUS_1 | CLUS_2 | CLUS_3 | CLUS_4 | CLUS_5 | CLUS_6 | CLUS_7 |
|---|---|---|---|---|---|---|---|
| ALL | 66 | 41 | 46 | 85 | 22 | 10 | 52 |
| 11Q LOSS MUTATED | 31 | 2 | 12 | 10 | 2 | 1 | 4 |
| 11Q LOSS WILD-TYPE | 35 | 39 | 34 | 75 | 20 | 9 | 48 |
Figure S47. Get High-res Image Gene #61: '11q loss mutation analysis' versus Clinical Feature #1: 'CN_CNMF'
P value = 7.55e-05 (Chi-square test), Q value = 0.044
Table S48. Gene #61: '11q loss mutation analysis' versus Clinical Feature #2: 'METHLYATION_CNMF'
| nPatients | CLUS_1 | CLUS_2 | CLUS_3 | CLUS_4 | CLUS_5 | CLUS_6 | CLUS_7 | CLUS_8 |
|---|---|---|---|---|---|---|---|---|
| ALL | 43 | 47 | 39 | 45 | 58 | 51 | 4 | 19 |
| 11Q LOSS MUTATED | 5 | 6 | 11 | 19 | 13 | 1 | 1 | 3 |
| 11Q LOSS WILD-TYPE | 38 | 41 | 28 | 26 | 45 | 50 | 3 | 16 |
Figure S48. Get High-res Image Gene #61: '11q loss mutation analysis' versus Clinical Feature #2: 'METHLYATION_CNMF'
P value = 9e-10 (Chi-square test), Q value = 5.6e-07
Table S49. Gene #64: '13q loss mutation analysis' versus Clinical Feature #1: 'CN_CNMF'
| nPatients | CLUS_1 | CLUS_2 | CLUS_3 | CLUS_4 | CLUS_5 | CLUS_6 | CLUS_7 |
|---|---|---|---|---|---|---|---|
| ALL | 66 | 41 | 46 | 85 | 22 | 10 | 52 |
| 13Q LOSS MUTATED | 13 | 9 | 26 | 7 | 6 | 0 | 4 |
| 13Q LOSS WILD-TYPE | 53 | 32 | 20 | 78 | 16 | 10 | 48 |
Figure S49. Get High-res Image Gene #64: '13q loss mutation analysis' versus Clinical Feature #1: 'CN_CNMF'

P value = 9.48e-10 (Chi-square test), Q value = 5.9e-07
Table S50. Gene #64: '13q loss mutation analysis' versus Clinical Feature #2: 'METHLYATION_CNMF'
| nPatients | CLUS_1 | CLUS_2 | CLUS_3 | CLUS_4 | CLUS_5 | CLUS_6 | CLUS_7 | CLUS_8 |
|---|---|---|---|---|---|---|---|---|
| ALL | 43 | 47 | 39 | 45 | 58 | 51 | 4 | 19 |
| 13Q LOSS MUTATED | 25 | 7 | 5 | 9 | 14 | 0 | 0 | 2 |
| 13Q LOSS WILD-TYPE | 18 | 40 | 34 | 36 | 44 | 51 | 4 | 17 |
Figure S50. Get High-res Image Gene #64: '13q loss mutation analysis' versus Clinical Feature #2: 'METHLYATION_CNMF'
P value = 2.38e-05 (Fisher's exact test), Q value = 0.014
Table S51. Gene #64: '13q loss mutation analysis' versus Clinical Feature #6: 'MRNASEQ_CHIERARCHICAL'
| nPatients | CLUS_1 | CLUS_2 | CLUS_3 |
|---|---|---|---|
| ALL | 95 | 84 | 120 |
| 13Q LOSS MUTATED | 16 | 6 | 39 |
| 13Q LOSS WILD-TYPE | 79 | 78 | 81 |
Figure S51. Get High-res Image Gene #64: '13q loss mutation analysis' versus Clinical Feature #6: 'MRNASEQ_CHIERARCHICAL'
P value = 4.19e-05 (Chi-square test), Q value = 0.025
Table S52. Gene #68: '16q loss mutation analysis' versus Clinical Feature #2: 'METHLYATION_CNMF'
| nPatients | CLUS_1 | CLUS_2 | CLUS_3 | CLUS_4 | CLUS_5 | CLUS_6 | CLUS_7 | CLUS_8 |
|---|---|---|---|---|---|---|---|---|
| ALL | 43 | 47 | 39 | 45 | 58 | 51 | 4 | 19 |
| 16Q LOSS MUTATED | 4 | 0 | 1 | 11 | 8 | 0 | 0 | 0 |
| 16Q LOSS WILD-TYPE | 39 | 47 | 38 | 34 | 50 | 51 | 4 | 19 |
Figure S52. Get High-res Image Gene #68: '16q loss mutation analysis' versus Clinical Feature #2: 'METHLYATION_CNMF'
P value = 4.72e-07 (Fisher's exact test), Q value = 0.00029
Table S53. Gene #68: '16q loss mutation analysis' versus Clinical Feature #5: 'MRNASEQ_CNMF'
| nPatients | CLUS_1 | CLUS_2 | CLUS_3 |
|---|---|---|---|
| ALL | 118 | 91 | 90 |
| 16Q LOSS MUTATED | 21 | 1 | 1 |
| 16Q LOSS WILD-TYPE | 97 | 90 | 89 |
Figure S53. Get High-res Image Gene #68: '16q loss mutation analysis' versus Clinical Feature #5: 'MRNASEQ_CNMF'
P value = 1.34e-08 (Fisher's exact test), Q value = 8.3e-06
Table S54. Gene #68: '16q loss mutation analysis' versus Clinical Feature #6: 'MRNASEQ_CHIERARCHICAL'
| nPatients | CLUS_1 | CLUS_2 | CLUS_3 |
|---|---|---|---|
| ALL | 95 | 84 | 120 |
| 16Q LOSS MUTATED | 0 | 1 | 22 |
| 16Q LOSS WILD-TYPE | 95 | 83 | 98 |
Figure S54. Get High-res Image Gene #68: '16q loss mutation analysis' versus Clinical Feature #6: 'MRNASEQ_CHIERARCHICAL'
P value = 1.27e-05 (Chi-square test), Q value = 0.0076
Table S55. Gene #69: '17p loss mutation analysis' versus Clinical Feature #2: 'METHLYATION_CNMF'
| nPatients | CLUS_1 | CLUS_2 | CLUS_3 | CLUS_4 | CLUS_5 | CLUS_6 | CLUS_7 | CLUS_8 |
|---|---|---|---|---|---|---|---|---|
| ALL | 43 | 47 | 39 | 45 | 58 | 51 | 4 | 19 |
| 17P LOSS MUTATED | 17 | 8 | 1 | 6 | 7 | 1 | 1 | 2 |
| 17P LOSS WILD-TYPE | 26 | 39 | 38 | 39 | 51 | 50 | 3 | 17 |
Figure S55. Get High-res Image Gene #69: '17p loss mutation analysis' versus Clinical Feature #2: 'METHLYATION_CNMF'
P value = 2.14e-11 (Chi-square test), Q value = 1.3e-08
Table S56. Gene #72: '18q loss mutation analysis' versus Clinical Feature #1: 'CN_CNMF'
| nPatients | CLUS_1 | CLUS_2 | CLUS_3 | CLUS_4 | CLUS_5 | CLUS_6 | CLUS_7 |
|---|---|---|---|---|---|---|---|
| ALL | 66 | 41 | 46 | 85 | 22 | 10 | 52 |
| 18Q LOSS MUTATED | 23 | 24 | 8 | 1 | 10 | 5 | 20 |
| 18Q LOSS WILD-TYPE | 43 | 17 | 38 | 84 | 12 | 5 | 32 |
Figure S56. Get High-res Image Gene #72: '18q loss mutation analysis' versus Clinical Feature #1: 'CN_CNMF'
P value = 3.16e-08 (Chi-square test), Q value = 1.9e-05
Table S57. Gene #72: '18q loss mutation analysis' versus Clinical Feature #2: 'METHLYATION_CNMF'
| nPatients | CLUS_1 | CLUS_2 | CLUS_3 | CLUS_4 | CLUS_5 | CLUS_6 | CLUS_7 | CLUS_8 |
|---|---|---|---|---|---|---|---|---|
| ALL | 43 | 47 | 39 | 45 | 58 | 51 | 4 | 19 |
| 18Q LOSS MUTATED | 20 | 23 | 14 | 2 | 15 | 3 | 3 | 5 |
| 18Q LOSS WILD-TYPE | 23 | 24 | 25 | 43 | 43 | 48 | 1 | 14 |
Figure S57. Get High-res Image Gene #72: '18q loss mutation analysis' versus Clinical Feature #2: 'METHLYATION_CNMF'
P value = 3.91e-06 (Chi-square test), Q value = 0.0024
Table S58. Gene #77: '21q loss mutation analysis' versus Clinical Feature #1: 'CN_CNMF'
| nPatients | CLUS_1 | CLUS_2 | CLUS_3 | CLUS_4 | CLUS_5 | CLUS_6 | CLUS_7 |
|---|---|---|---|---|---|---|---|
| ALL | 66 | 41 | 46 | 85 | 22 | 10 | 52 |
| 21Q LOSS MUTATED | 14 | 9 | 18 | 0 | 3 | 3 | 10 |
| 21Q LOSS WILD-TYPE | 52 | 32 | 28 | 85 | 19 | 7 | 42 |
Figure S58. Get High-res Image Gene #77: '21q loss mutation analysis' versus Clinical Feature #1: 'CN_CNMF'
P value = 3.09e-06 (Chi-square test), Q value = 0.0019
Table S59. Gene #78: '22q loss mutation analysis' versus Clinical Feature #1: 'CN_CNMF'
| nPatients | CLUS_1 | CLUS_2 | CLUS_3 | CLUS_4 | CLUS_5 | CLUS_6 | CLUS_7 |
|---|---|---|---|---|---|---|---|
| ALL | 66 | 41 | 46 | 85 | 22 | 10 | 52 |
| 22Q LOSS MUTATED | 4 | 5 | 0 | 2 | 8 | 0 | 6 |
| 22Q LOSS WILD-TYPE | 62 | 36 | 46 | 83 | 14 | 10 | 46 |
Figure S59. Get High-res Image Gene #78: '22q loss mutation analysis' versus Clinical Feature #1: 'CN_CNMF'
-
Mutation data file = broad_values_by_arm.mutsig.cluster.txt
-
Molecular subtypes file = HNSC-TP.transferedmergedcluster.txt
-
Number of patients = 322
-
Number of significantly arm-level cnvs = 79
-
Number of molecular subtypes = 8
-
Exclude genes that fewer than K tumors have mutations, K = 3
For multi-class clinical features (nominal or ordinal), Chi-square tests (Greenwood and Nikulin 1996) were used to estimate the P values using the 'chisq.test' function in R
For binary or multi-class clinical features (nominal or ordinal), two-tailed Fisher's exact tests (Fisher 1922) were used to estimate the P values using the 'fisher.test' function in R
For multiple hypothesis correction, Q value is the False Discovery Rate (FDR) analogue of the P value (Benjamini and Hochberg 1995), defined as the minimum FDR at which the test may be called significant. We used the 'Benjamini and Hochberg' method of 'p.adjust' function in R to convert P values into Q values.
This is an experimental feature. The full results of the analysis summarized in this report can be downloaded from the TCGA Data Coordination Center.