This pipeline computes the correlation between significantly recurrent gene mutations and molecular subtypes.
Testing the association between mutation status of 28 genes and 10 molecular subtypes across 293 patients, 8 significant findings detected with P value < 0.05 and Q value < 0.25.
-
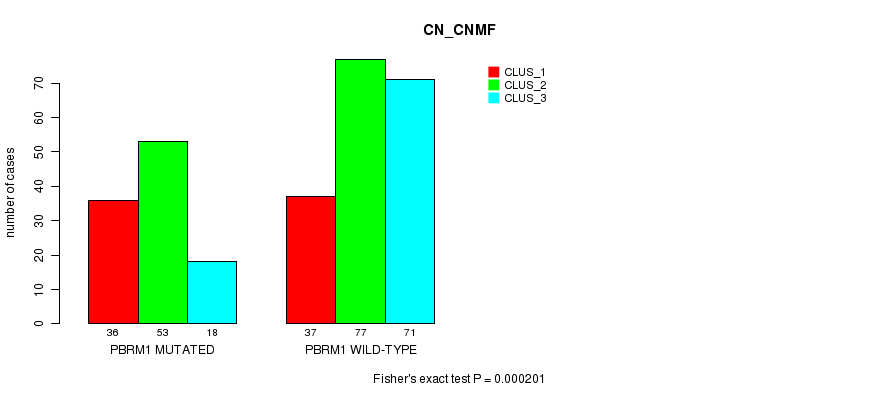
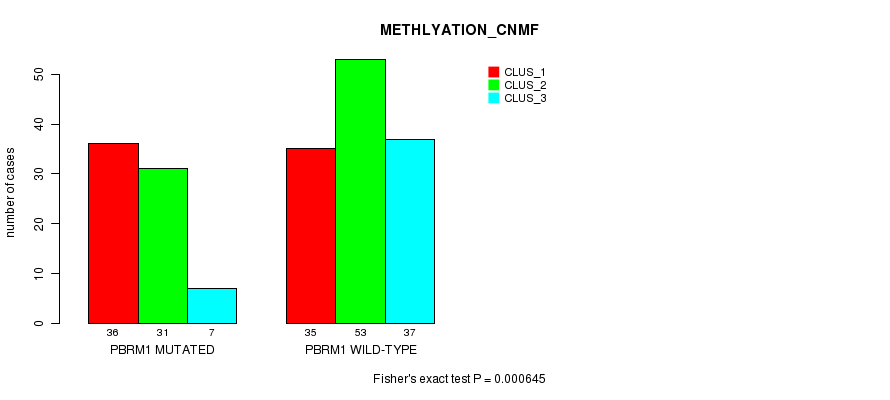
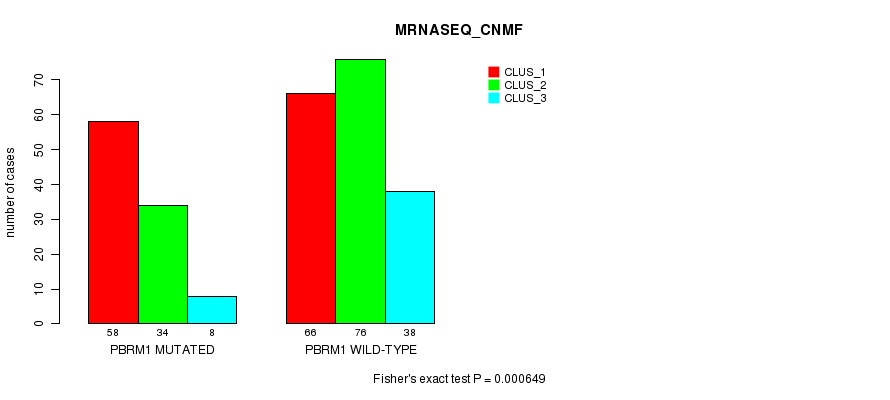
PBRM1 mutation correlated to 'CN_CNMF', 'METHLYATION_CNMF', and 'MRNASEQ_CNMF'.
-
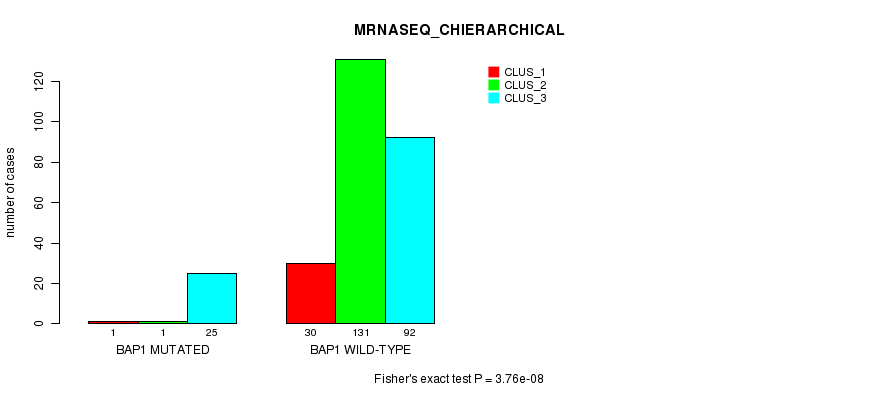
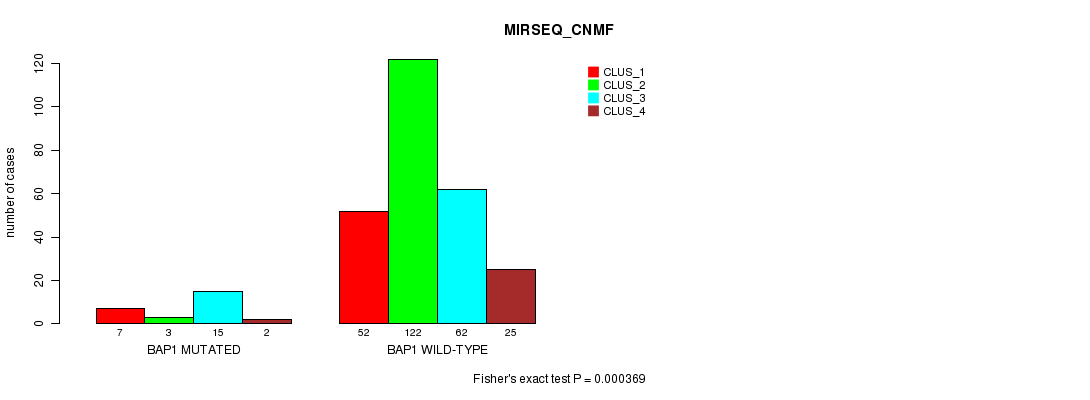
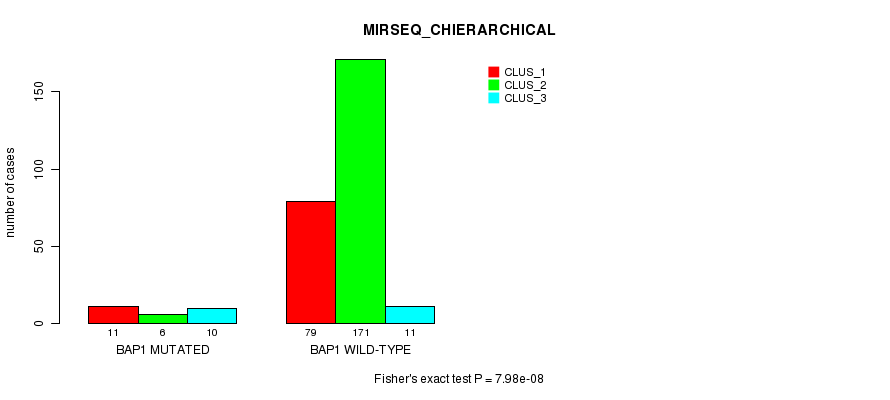
BAP1 mutation correlated to 'MRNASEQ_CHIERARCHICAL', 'MIRSEQ_CNMF', and 'MIRSEQ_CHIERARCHICAL'.
-
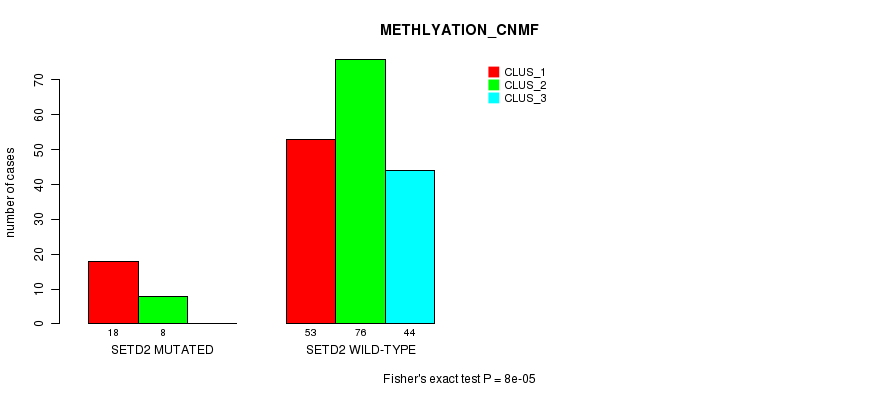
SETD2 mutation correlated to 'METHLYATION_CNMF'.
-
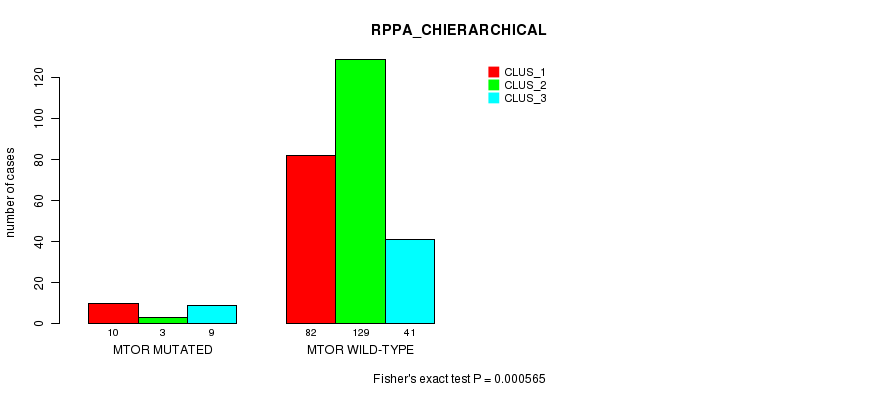
MTOR mutation correlated to 'RPPA_CHIERARCHICAL'.
Table 1. Get Full Table Overview of the association between mutation status of 28 genes and 10 molecular subtypes. Shown in the table are P values (Q values). Thresholded by P value < 0.05 and Q value < 0.25, 8 significant findings detected.
|
Clinical Features |
MRNA CNMF |
MRNA CHIERARCHICAL |
CN CNMF |
METHLYATION CNMF |
RPPA CNMF |
RPPA CHIERARCHICAL |
MRNASEQ CNMF |
MRNASEQ CHIERARCHICAL |
MIRSEQ CNMF |
MIRSEQ CHIERARCHICAL |
||
| nMutated (%) | nWild-Type | Fisher's exact test | Fisher's exact test | Fisher's exact test | Fisher's exact test | Fisher's exact test | Fisher's exact test | Fisher's exact test | Fisher's exact test | Fisher's exact test | Fisher's exact test | |
| PBRM1 | 107 (37%) | 186 |
0.0211 (1.00) |
0.0735 (1.00) |
0.000201 (0.0454) |
0.000645 (0.144) |
0.168 (1.00) |
0.487 (1.00) |
0.000649 (0.144) |
0.0822 (1.00) |
0.0365 (1.00) |
0.0153 (1.00) |
| BAP1 | 27 (9%) | 266 |
0.0212 (1.00) |
0.0111 (1.00) |
0.0883 (1.00) |
0.00376 (0.827) |
0.0383 (1.00) |
1 (1.00) |
0.00145 (0.32) |
3.76e-08 (8.61e-06) |
0.000369 (0.083) |
7.98e-08 (1.82e-05) |
| SETD2 | 34 (12%) | 259 |
0.747 (1.00) |
1 (1.00) |
0.0992 (1.00) |
8e-05 (0.0182) |
0.115 (1.00) |
0.128 (1.00) |
0.338 (1.00) |
0.655 (1.00) |
0.13 (1.00) |
0.23 (1.00) |
| MTOR | 24 (8%) | 269 |
0.631 (1.00) |
0.043 (1.00) |
0.0106 (1.00) |
0.000565 (0.126) |
0.707 (1.00) |
0.323 (1.00) |
0.488 (1.00) |
0.682 (1.00) |
||
| VHL | 138 (47%) | 155 |
0.0307 (1.00) |
0.0514 (1.00) |
0.582 (1.00) |
0.397 (1.00) |
0.864 (1.00) |
0.314 (1.00) |
0.00744 (1.00) |
0.0654 (1.00) |
0.2 (1.00) |
0.0959 (1.00) |
| SV2C | 3 (1%) | 290 |
0.169 (1.00) |
0.0102 (1.00) |
0.384 (1.00) |
0.423 (1.00) |
0.191 (1.00) |
0.234 (1.00) |
||||
| KDM5C | 18 (6%) | 275 |
0.351 (1.00) |
0.261 (1.00) |
0.285 (1.00) |
0.0523 (1.00) |
0.105 (1.00) |
0.671 (1.00) |
0.471 (1.00) |
0.737 (1.00) |
||
| TP53 | 6 (2%) | 287 |
0.875 (1.00) |
0.535 (1.00) |
0.334 (1.00) |
0.406 (1.00) |
0.481 (1.00) |
0.245 (1.00) |
0.579 (1.00) |
0.283 (1.00) |
||
| PTEN | 9 (3%) | 284 |
0.163 (1.00) |
0.665 (1.00) |
1 (1.00) |
0.317 (1.00) |
0.0375 (1.00) |
0.739 (1.00) |
0.00835 (1.00) |
0.0437 (1.00) |
0.251 (1.00) |
0.0996 (1.00) |
| EBPL | 6 (2%) | 287 |
0.769 (1.00) |
0.797 (1.00) |
0.836 (1.00) |
0.519 (1.00) |
0.318 (1.00) |
0.174 (1.00) |
0.478 (1.00) |
0.23 (1.00) |
||
| PIK3CA | 10 (3%) | 283 |
0.319 (1.00) |
0.205 (1.00) |
0.0308 (1.00) |
0.837 (1.00) |
0.914 (1.00) |
0.586 (1.00) |
0.557 (1.00) |
0.41 (1.00) |
||
| TSPAN19 | 4 (1%) | 289 |
0.473 (1.00) |
0.101 (1.00) |
0.399 (1.00) |
0.391 (1.00) |
0.454 (1.00) |
0.13 (1.00) |
0.0988 (1.00) |
|||
| NBPF10 | 19 (6%) | 274 |
0.537 (1.00) |
0.602 (1.00) |
0.594 (1.00) |
0.872 (1.00) |
0.375 (1.00) |
0.555 (1.00) |
0.35 (1.00) |
0.0484 (1.00) |
0.175 (1.00) |
1 (1.00) |
| TOR1A | 3 (1%) | 290 |
0.464 (1.00) |
0.501 (1.00) |
0.296 (1.00) |
0.563 (1.00) |
1 (1.00) |
0.849 (1.00) |
0.414 (1.00) |
|||
| MUC4 | 41 (14%) | 252 |
0.786 (1.00) |
0.892 (1.00) |
0.0839 (1.00) |
0.044 (1.00) |
0.164 (1.00) |
0.942 (1.00) |
0.0476 (1.00) |
0.114 (1.00) |
0.0794 (1.00) |
0.0117 (1.00) |
| UQCRFS1 | 3 (1%) | 290 |
0.253 (1.00) |
0.293 (1.00) |
0.341 (1.00) |
0.496 (1.00) |
0.644 (1.00) |
|||||
| WDR52 | 9 (3%) | 284 |
0.283 (1.00) |
0.482 (1.00) |
0.745 (1.00) |
0.893 (1.00) |
0.448 (1.00) |
0.506 (1.00) |
0.705 (1.00) |
0.264 (1.00) |
||
| BAGE2 | 4 (1%) | 289 |
0.816 (1.00) |
0.117 (1.00) |
0.147 (1.00) |
0.245 (1.00) |
0.171 (1.00) |
0.0914 (1.00) |
0.0979 (1.00) |
0.0131 (1.00) |
||
| CNTNAP4 | 9 (3%) | 284 |
0.758 (1.00) |
0.369 (1.00) |
0.745 (1.00) |
0.457 (1.00) |
0.815 (1.00) |
0.625 (1.00) |
1 (1.00) |
0.326 (1.00) |
||
| CR1 | 10 (3%) | 283 |
1 (1.00) |
0.279 (1.00) |
0.0924 (1.00) |
0.908 (1.00) |
0.0978 (1.00) |
0.483 (1.00) |
0.557 (1.00) |
0.105 (1.00) |
||
| STAG2 | 9 (3%) | 284 |
0.0789 (1.00) |
0.0119 (1.00) |
0.0375 (1.00) |
0.908 (1.00) |
0.355 (1.00) |
0.13 (1.00) |
0.251 (1.00) |
0.438 (1.00) |
||
| MSN | 4 (1%) | 289 |
0.581 (1.00) |
0.444 (1.00) |
0.262 (1.00) |
0.669 (1.00) |
0.284 (1.00) |
0.17 (1.00) |
0.199 (1.00) |
1 (1.00) |
||
| ABCB1 | 8 (3%) | 285 |
0.333 (1.00) |
0.608 (1.00) |
0.14 (1.00) |
0.0305 (1.00) |
0.265 (1.00) |
0.161 (1.00) |
0.514 (1.00) |
0.0772 (1.00) |
||
| ADCY8 | 5 (2%) | 288 |
0.527 (1.00) |
0.106 (1.00) |
0.742 (1.00) |
1 (1.00) |
0.848 (1.00) |
1 (1.00) |
0.702 (1.00) |
0.434 (1.00) |
||
| NPNT | 6 (2%) | 287 |
0.667 (1.00) |
0.502 (1.00) |
0.246 (1.00) |
1 (1.00) |
0.333 (1.00) |
0.382 (1.00) |
0.927 (1.00) |
0.79 (1.00) |
||
| OR5H1 | 3 (1%) | 290 |
1 (1.00) |
0.384 (1.00) |
0.039 (1.00) |
0.768 (1.00) |
0.721 (1.00) |
0.191 (1.00) |
0.0359 (1.00) |
|||
| SPAM1 | 5 (2%) | 288 |
0.386 (1.00) |
0.269 (1.00) |
0.589 (1.00) |
0.116 (1.00) |
0.11 (1.00) |
0.441 (1.00) |
0.772 (1.00) |
|||
| TPTE2 | 7 (2%) | 286 |
0.549 (1.00) |
0.63 (1.00) |
0.797 (1.00) |
0.881 (1.00) |
0.876 (1.00) |
0.873 (1.00) |
0.276 (1.00) |
0.819 (1.00) |
P value = 0.000201 (Fisher's exact test), Q value = 0.045
Table S1. Gene #3: 'PBRM1 MUTATION STATUS' versus Clinical Feature #3: 'CN_CNMF'
| nPatients | CLUS_1 | CLUS_2 | CLUS_3 |
|---|---|---|---|
| ALL | 73 | 130 | 89 |
| PBRM1 MUTATED | 36 | 53 | 18 |
| PBRM1 WILD-TYPE | 37 | 77 | 71 |
Figure S1. Get High-res Image Gene #3: 'PBRM1 MUTATION STATUS' versus Clinical Feature #3: 'CN_CNMF'
P value = 0.000645 (Fisher's exact test), Q value = 0.14
Table S2. Gene #3: 'PBRM1 MUTATION STATUS' versus Clinical Feature #4: 'METHLYATION_CNMF'
| nPatients | CLUS_1 | CLUS_2 | CLUS_3 |
|---|---|---|---|
| ALL | 71 | 84 | 44 |
| PBRM1 MUTATED | 36 | 31 | 7 |
| PBRM1 WILD-TYPE | 35 | 53 | 37 |
Figure S2. Get High-res Image Gene #3: 'PBRM1 MUTATION STATUS' versus Clinical Feature #4: 'METHLYATION_CNMF'
P value = 0.000649 (Fisher's exact test), Q value = 0.14
Table S3. Gene #3: 'PBRM1 MUTATION STATUS' versus Clinical Feature #7: 'MRNASEQ_CNMF'
| nPatients | CLUS_1 | CLUS_2 | CLUS_3 |
|---|---|---|---|
| ALL | 124 | 110 | 46 |
| PBRM1 MUTATED | 58 | 34 | 8 |
| PBRM1 WILD-TYPE | 66 | 76 | 38 |
Figure S3. Get High-res Image Gene #3: 'PBRM1 MUTATION STATUS' versus Clinical Feature #7: 'MRNASEQ_CNMF'
P value = 3.76e-08 (Fisher's exact test), Q value = 8.6e-06
Table S4. Gene #4: 'BAP1 MUTATION STATUS' versus Clinical Feature #8: 'MRNASEQ_CHIERARCHICAL'
| nPatients | CLUS_1 | CLUS_2 | CLUS_3 |
|---|---|---|---|
| ALL | 31 | 132 | 117 |
| BAP1 MUTATED | 1 | 1 | 25 |
| BAP1 WILD-TYPE | 30 | 131 | 92 |
Figure S4. Get High-res Image Gene #4: 'BAP1 MUTATION STATUS' versus Clinical Feature #8: 'MRNASEQ_CHIERARCHICAL'
P value = 0.000369 (Fisher's exact test), Q value = 0.083
Table S5. Gene #4: 'BAP1 MUTATION STATUS' versus Clinical Feature #9: 'MIRSEQ_CNMF'
| nPatients | CLUS_1 | CLUS_2 | CLUS_3 | CLUS_4 |
|---|---|---|---|---|
| ALL | 59 | 125 | 77 | 27 |
| BAP1 MUTATED | 7 | 3 | 15 | 2 |
| BAP1 WILD-TYPE | 52 | 122 | 62 | 25 |
Figure S5. Get High-res Image Gene #4: 'BAP1 MUTATION STATUS' versus Clinical Feature #9: 'MIRSEQ_CNMF'
P value = 7.98e-08 (Fisher's exact test), Q value = 1.8e-05
Table S6. Gene #4: 'BAP1 MUTATION STATUS' versus Clinical Feature #10: 'MIRSEQ_CHIERARCHICAL'
| nPatients | CLUS_1 | CLUS_2 | CLUS_3 |
|---|---|---|---|
| ALL | 90 | 177 | 21 |
| BAP1 MUTATED | 11 | 6 | 10 |
| BAP1 WILD-TYPE | 79 | 171 | 11 |
Figure S6. Get High-res Image Gene #4: 'BAP1 MUTATION STATUS' versus Clinical Feature #10: 'MIRSEQ_CHIERARCHICAL'
P value = 8e-05 (Fisher's exact test), Q value = 0.018
Table S7. Gene #5: 'SETD2 MUTATION STATUS' versus Clinical Feature #4: 'METHLYATION_CNMF'
| nPatients | CLUS_1 | CLUS_2 | CLUS_3 |
|---|---|---|---|
| ALL | 71 | 84 | 44 |
| SETD2 MUTATED | 18 | 8 | 0 |
| SETD2 WILD-TYPE | 53 | 76 | 44 |
Figure S7. Get High-res Image Gene #5: 'SETD2 MUTATION STATUS' versus Clinical Feature #4: 'METHLYATION_CNMF'
P value = 0.000565 (Fisher's exact test), Q value = 0.13
Table S8. Gene #7: 'MTOR MUTATION STATUS' versus Clinical Feature #6: 'RPPA_CHIERARCHICAL'
| nPatients | CLUS_1 | CLUS_2 | CLUS_3 |
|---|---|---|---|
| ALL | 92 | 132 | 50 |
| MTOR MUTATED | 10 | 3 | 9 |
| MTOR WILD-TYPE | 82 | 129 | 41 |
Figure S8. Get High-res Image Gene #7: 'MTOR MUTATION STATUS' versus Clinical Feature #6: 'RPPA_CHIERARCHICAL'
-
Mutation data file = KIRC-TP.mutsig.cluster.txt
-
Molecular subtypes file = KIRC-TP.transferedmergedcluster.txt
-
Number of patients = 293
-
Number of significantly mutated genes = 28
-
Number of Molecular subtypes = 10
-
Exclude genes that fewer than K tumors have mutations, K = 3
For binary or multi-class clinical features (nominal or ordinal), two-tailed Fisher's exact tests (Fisher 1922) were used to estimate the P values using the 'fisher.test' function in R
For multiple hypothesis correction, Q value is the False Discovery Rate (FDR) analogue of the P value (Benjamini and Hochberg 1995), defined as the minimum FDR at which the test may be called significant. We used the 'Benjamini and Hochberg' method of 'p.adjust' function in R to convert P values into Q values.
This is an experimental feature. The full results of the analysis summarized in this report can be downloaded from the TCGA Data Coordination Center.