This pipeline computes the correlation between significant arm-level copy number variations (cnvs) and subtypes.
Testing the association between copy number variation 26 arm-level results and 6 molecular subtypes across 177 patients, 8 significant findings detected with Q value < 0.25.
-
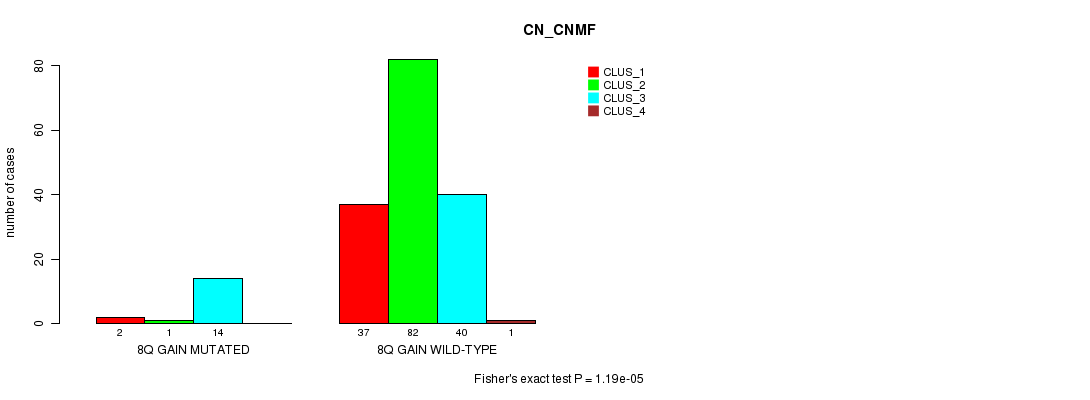
8q gain cnv correlated to 'CN_CNMF'.
-
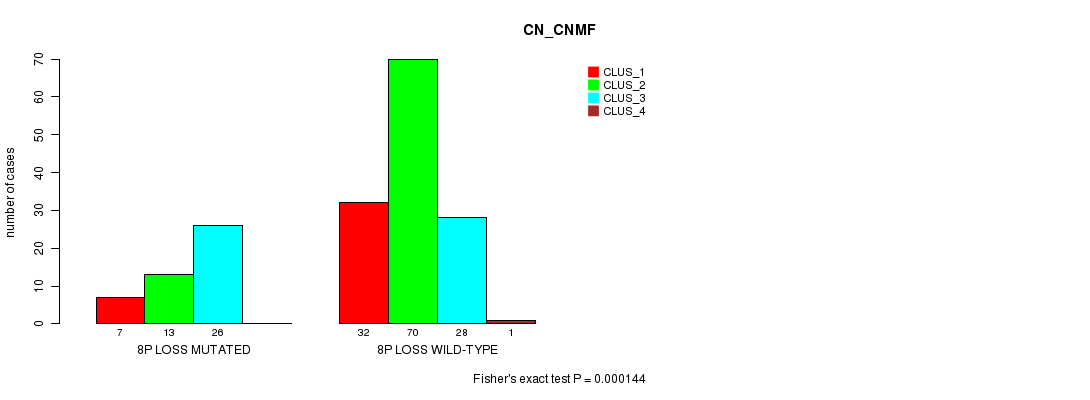
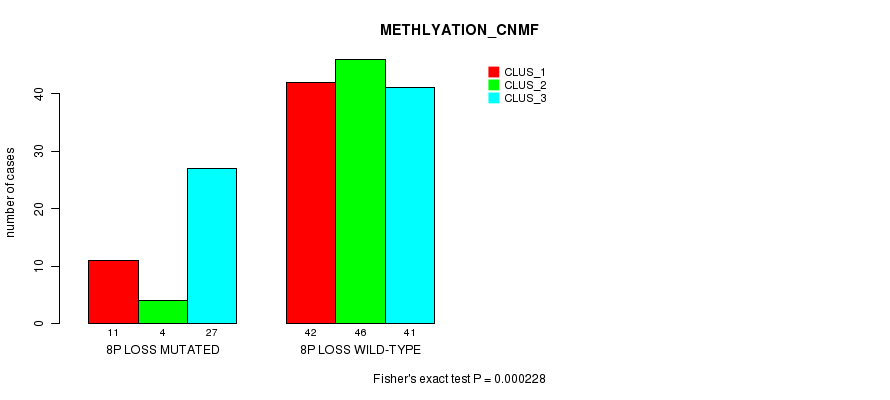
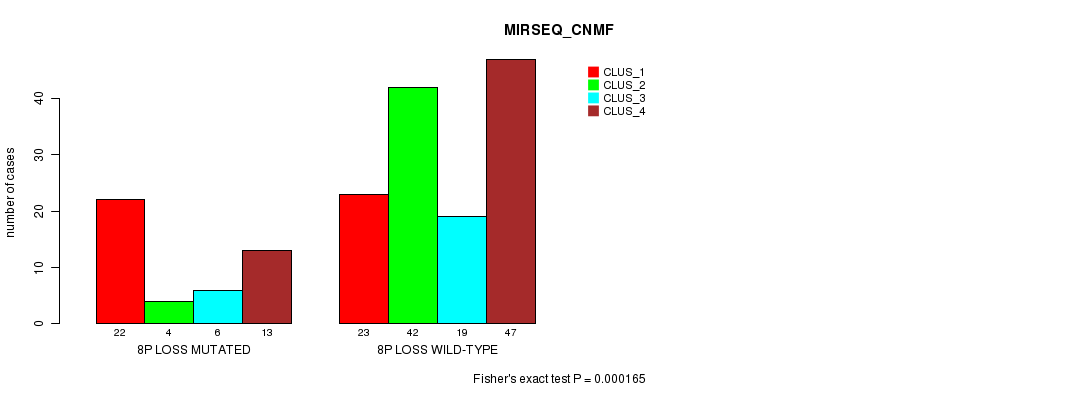
8p loss cnv correlated to 'CN_CNMF', 'METHLYATION_CNMF', and 'MIRSEQ_CNMF'.
-
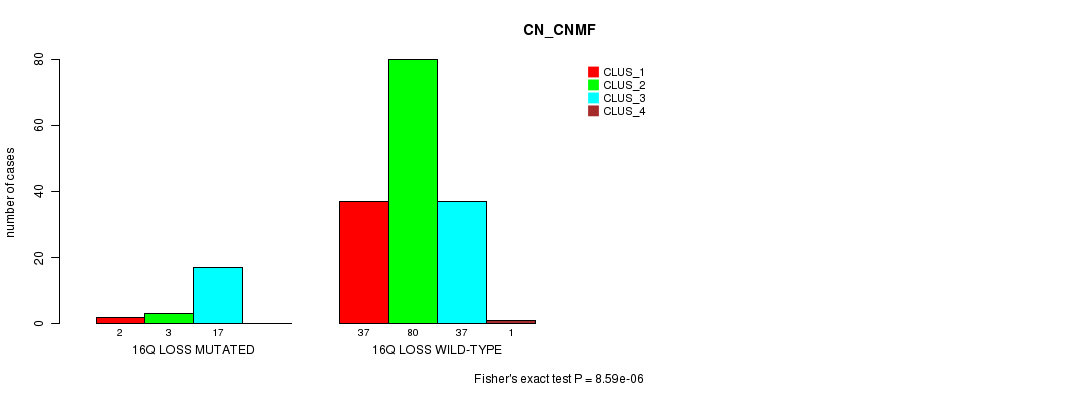
16q loss cnv correlated to 'CN_CNMF'.
-
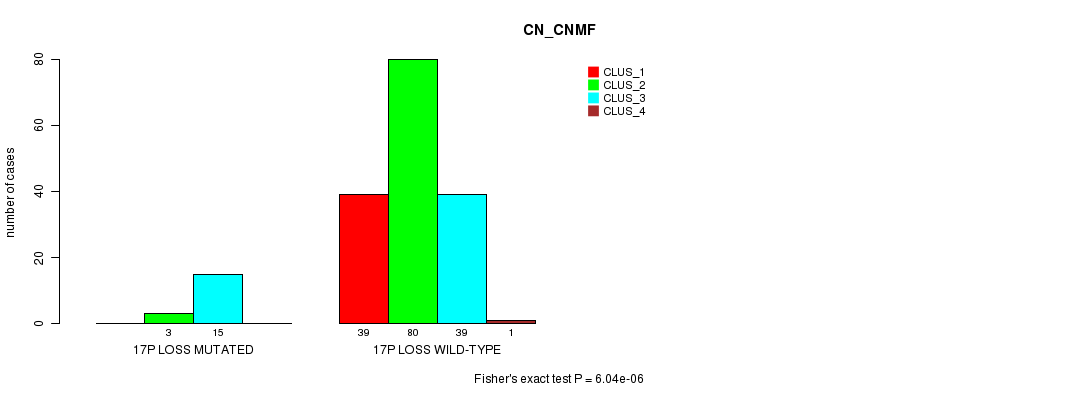
17p loss cnv correlated to 'CN_CNMF'.
-
18p loss cnv correlated to 'CN_CNMF'.
-
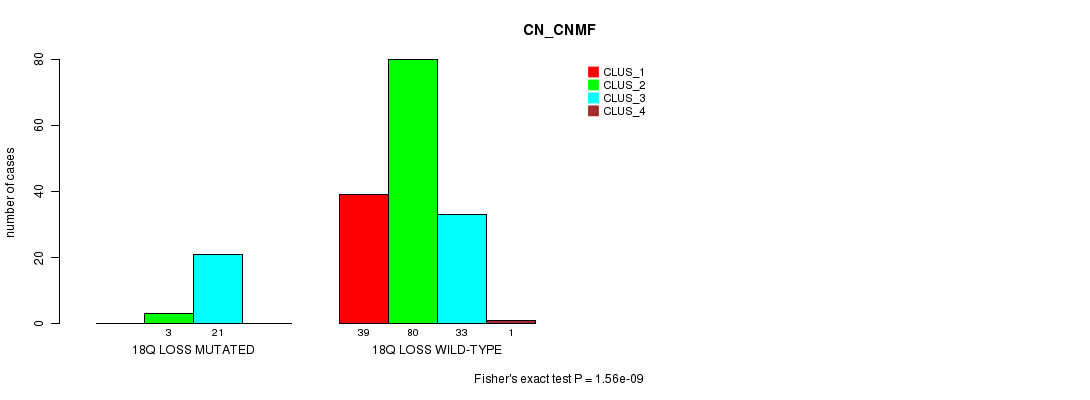
18q loss cnv correlated to 'CN_CNMF'.
Table 1. Get Full Table Overview of the association between significant copy number variation of 26 arm-level results and 6 molecular subtypes. Shown in the table are P values (Q values). Thresholded by Q value < 0.25, 8 significant findings detected.
|
Molecular subtypes |
CN CNMF |
METHLYATION CNMF |
MRNASEQ CNMF |
MRNASEQ CHIERARCHICAL |
MIRSEQ CNMF |
MIRSEQ CHIERARCHICAL |
||
| nCNV (%) | nWild-Type | Fisher's exact test | Fisher's exact test | Fisher's exact test | Fisher's exact test | Fisher's exact test | Fisher's exact test | |
| 8p loss | 46 (26%) | 131 |
0.000144 (0.0196) |
0.000228 (0.0305) |
0.0164 (1.00) |
0.00406 (0.535) |
0.000165 (0.0222) |
0.681 (1.00) |
| 8q gain | 17 (10%) | 160 |
1.19e-05 (0.00163) |
0.57 (1.00) |
0.438 (1.00) |
0.284 (1.00) |
0.262 (1.00) |
0.112 (1.00) |
| 16q loss | 22 (12%) | 155 |
8.59e-06 (0.00119) |
0.112 (1.00) |
0.189 (1.00) |
0.078 (1.00) |
0.173 (1.00) |
0.615 (1.00) |
| 17p loss | 18 (10%) | 159 |
6.04e-06 (0.00084) |
0.156 (1.00) |
0.299 (1.00) |
0.0355 (1.00) |
0.499 (1.00) |
0.604 (1.00) |
| 18p loss | 19 (11%) | 158 |
2.66e-06 (0.000373) |
0.201 (1.00) |
0.661 (1.00) |
0.186 (1.00) |
0.0486 (1.00) |
0.0116 (1.00) |
| 18q loss | 24 (14%) | 153 |
1.56e-09 (2.2e-07) |
0.419 (1.00) |
0.32 (1.00) |
0.0681 (1.00) |
0.087 (1.00) |
0.0668 (1.00) |
| 1q gain | 4 (2%) | 173 |
0.214 (1.00) |
0.56 (1.00) |
0.53 (1.00) |
0.822 (1.00) |
||
| 3p gain | 4 (2%) | 173 |
0.362 (1.00) |
0.824 (1.00) |
0.15 (1.00) |
0.29 (1.00) |
||
| 3q gain | 6 (3%) | 171 |
0.19 (1.00) |
0.668 (1.00) |
0.109 (1.00) |
0.0238 (1.00) |
0.288 (1.00) |
0.1 (1.00) |
| 7p gain | 15 (8%) | 162 |
0.0195 (1.00) |
0.09 (1.00) |
0.138 (1.00) |
0.637 (1.00) |
0.787 (1.00) |
0.573 (1.00) |
| 7q gain | 12 (7%) | 165 |
0.0989 (1.00) |
0.171 (1.00) |
0.275 (1.00) |
0.926 (1.00) |
0.663 (1.00) |
0.376 (1.00) |
| 8p gain | 8 (5%) | 169 |
0.0501 (1.00) |
1 (1.00) |
0.738 (1.00) |
0.44 (1.00) |
1 (1.00) |
0.707 (1.00) |
| 9q gain | 5 (3%) | 172 |
0.0904 (1.00) |
0.387 (1.00) |
0.266 (1.00) |
0.823 (1.00) |
0.651 (1.00) |
0.845 (1.00) |
| 12q gain | 3 (2%) | 174 |
0.16 (1.00) |
0.0331 (1.00) |
0.0756 (1.00) |
|||
| 16p gain | 3 (2%) | 174 |
0.459 (1.00) |
0.78 (1.00) |
0.458 (1.00) |
0.774 (1.00) |
||
| 16q gain | 3 (2%) | 174 |
0.459 (1.00) |
0.78 (1.00) |
0.458 (1.00) |
0.774 (1.00) |
||
| 5q loss | 3 (2%) | 174 |
0.0543 (1.00) |
0.0525 (1.00) |
0.114 (1.00) |
1 (1.00) |
||
| 6q loss | 7 (4%) | 170 |
0.0278 (1.00) |
0.156 (1.00) |
0.132 (1.00) |
0.0111 (1.00) |
0.365 (1.00) |
0.125 (1.00) |
| 8q loss | 4 (2%) | 173 |
0.0327 (1.00) |
0.387 (1.00) |
0.266 (1.00) |
0.102 (1.00) |
0.0423 (1.00) |
0.395 (1.00) |
| 10p loss | 6 (3%) | 171 |
0.162 (1.00) |
0.285 (1.00) |
0.377 (1.00) |
0.448 (1.00) |
0.288 (1.00) |
0.122 (1.00) |
| 10q loss | 5 (3%) | 172 |
0.387 (1.00) |
0.735 (1.00) |
0.53 (1.00) |
1 (1.00) |
0.57 (1.00) |
1 (1.00) |
| 12p loss | 9 (5%) | 168 |
0.161 (1.00) |
0.073 (1.00) |
0.664 (1.00) |
1 (1.00) |
0.0539 (1.00) |
0.246 (1.00) |
| 13q loss | 12 (7%) | 165 |
0.00359 (0.478) |
0.204 (1.00) |
0.0256 (1.00) |
0.302 (1.00) |
0.167 (1.00) |
0.375 (1.00) |
| 20p loss | 4 (2%) | 173 |
0.57 (1.00) |
0.188 (1.00) |
0.329 (1.00) |
0.14 (1.00) |
0.00575 (0.753) |
0.0161 (1.00) |
| 21q loss | 4 (2%) | 173 |
0.214 (1.00) |
0.493 (1.00) |
0.266 (1.00) |
1 (1.00) |
||
| 22q loss | 6 (3%) | 171 |
0.0262 (1.00) |
0.388 (1.00) |
0.322 (1.00) |
0.113 (1.00) |
0.388 (1.00) |
1 (1.00) |
P value = 1.19e-05 (Fisher's exact test), Q value = 0.0016
Table S1. Gene #7: '8q gain mutation analysis' versus Clinical Feature #1: 'CN_CNMF'
| nPatients | CLUS_1 | CLUS_2 | CLUS_3 | CLUS_4 |
|---|---|---|---|---|
| ALL | 39 | 83 | 54 | 1 |
| 8Q GAIN MUTATED | 2 | 1 | 14 | 0 |
| 8Q GAIN WILD-TYPE | 37 | 82 | 40 | 1 |
Figure S1. Get High-res Image Gene #7: '8q gain mutation analysis' versus Clinical Feature #1: 'CN_CNMF'
P value = 0.000144 (Fisher's exact test), Q value = 0.02
Table S2. Gene #14: '8p loss mutation analysis' versus Clinical Feature #1: 'CN_CNMF'
| nPatients | CLUS_1 | CLUS_2 | CLUS_3 | CLUS_4 |
|---|---|---|---|---|
| ALL | 39 | 83 | 54 | 1 |
| 8P LOSS MUTATED | 7 | 13 | 26 | 0 |
| 8P LOSS WILD-TYPE | 32 | 70 | 28 | 1 |
Figure S2. Get High-res Image Gene #14: '8p loss mutation analysis' versus Clinical Feature #1: 'CN_CNMF'
P value = 0.000228 (Fisher's exact test), Q value = 0.03
Table S3. Gene #14: '8p loss mutation analysis' versus Clinical Feature #2: 'METHLYATION_CNMF'
| nPatients | CLUS_1 | CLUS_2 | CLUS_3 |
|---|---|---|---|
| ALL | 53 | 50 | 68 |
| 8P LOSS MUTATED | 11 | 4 | 27 |
| 8P LOSS WILD-TYPE | 42 | 46 | 41 |
Figure S3. Get High-res Image Gene #14: '8p loss mutation analysis' versus Clinical Feature #2: 'METHLYATION_CNMF'
P value = 0.000165 (Fisher's exact test), Q value = 0.022
Table S4. Gene #14: '8p loss mutation analysis' versus Clinical Feature #5: 'MIRSEQ_CNMF'
| nPatients | CLUS_1 | CLUS_2 | CLUS_3 | CLUS_4 |
|---|---|---|---|---|
| ALL | 45 | 46 | 25 | 60 |
| 8P LOSS MUTATED | 22 | 4 | 6 | 13 |
| 8P LOSS WILD-TYPE | 23 | 42 | 19 | 47 |
Figure S4. Get High-res Image Gene #14: '8p loss mutation analysis' versus Clinical Feature #5: 'MIRSEQ_CNMF'
P value = 8.59e-06 (Fisher's exact test), Q value = 0.0012
Table S5. Gene #20: '16q loss mutation analysis' versus Clinical Feature #1: 'CN_CNMF'
| nPatients | CLUS_1 | CLUS_2 | CLUS_3 | CLUS_4 |
|---|---|---|---|---|
| ALL | 39 | 83 | 54 | 1 |
| 16Q LOSS MUTATED | 2 | 3 | 17 | 0 |
| 16Q LOSS WILD-TYPE | 37 | 80 | 37 | 1 |
Figure S5. Get High-res Image Gene #20: '16q loss mutation analysis' versus Clinical Feature #1: 'CN_CNMF'
P value = 6.04e-06 (Fisher's exact test), Q value = 0.00084
Table S6. Gene #21: '17p loss mutation analysis' versus Clinical Feature #1: 'CN_CNMF'
| nPatients | CLUS_1 | CLUS_2 | CLUS_3 | CLUS_4 |
|---|---|---|---|---|
| ALL | 39 | 83 | 54 | 1 |
| 17P LOSS MUTATED | 0 | 3 | 15 | 0 |
| 17P LOSS WILD-TYPE | 39 | 80 | 39 | 1 |
Figure S6. Get High-res Image Gene #21: '17p loss mutation analysis' versus Clinical Feature #1: 'CN_CNMF'
P value = 2.66e-06 (Fisher's exact test), Q value = 0.00037
Table S7. Gene #22: '18p loss mutation analysis' versus Clinical Feature #1: 'CN_CNMF'
| nPatients | CLUS_1 | CLUS_2 | CLUS_3 | CLUS_4 |
|---|---|---|---|---|
| ALL | 39 | 83 | 54 | 1 |
| 18P LOSS MUTATED | 1 | 2 | 16 | 0 |
| 18P LOSS WILD-TYPE | 38 | 81 | 38 | 1 |
Figure S7. Get High-res Image Gene #22: '18p loss mutation analysis' versus Clinical Feature #1: 'CN_CNMF'

P value = 1.56e-09 (Fisher's exact test), Q value = 2.2e-07
Table S8. Gene #23: '18q loss mutation analysis' versus Clinical Feature #1: 'CN_CNMF'
| nPatients | CLUS_1 | CLUS_2 | CLUS_3 | CLUS_4 |
|---|---|---|---|---|
| ALL | 39 | 83 | 54 | 1 |
| 18Q LOSS MUTATED | 0 | 3 | 21 | 0 |
| 18Q LOSS WILD-TYPE | 39 | 80 | 33 | 1 |
Figure S8. Get High-res Image Gene #23: '18q loss mutation analysis' versus Clinical Feature #1: 'CN_CNMF'
-
Mutation data file = broad_values_by_arm.mutsig.cluster.txt
-
Molecular subtypes file = PRAD-TP.transferedmergedcluster.txt
-
Number of patients = 177
-
Number of significantly arm-level cnvs = 26
-
Number of molecular subtypes = 6
-
Exclude genes that fewer than K tumors have mutations, K = 3
For binary or multi-class clinical features (nominal or ordinal), two-tailed Fisher's exact tests (Fisher 1922) were used to estimate the P values using the 'fisher.test' function in R
For multiple hypothesis correction, Q value is the False Discovery Rate (FDR) analogue of the P value (Benjamini and Hochberg 1995), defined as the minimum FDR at which the test may be called significant. We used the 'Benjamini and Hochberg' method of 'p.adjust' function in R to convert P values into Q values.
This is an experimental feature. The full results of the analysis summarized in this report can be downloaded from the TCGA Data Coordination Center.