This pipeline computes the correlation between significantly recurrent gene mutations and molecular subtypes.
Testing the association between mutation status of 47 genes and 6 molecular subtypes across 116 patients, 14 significant findings detected with P value < 0.05 and Q value < 0.25.
-
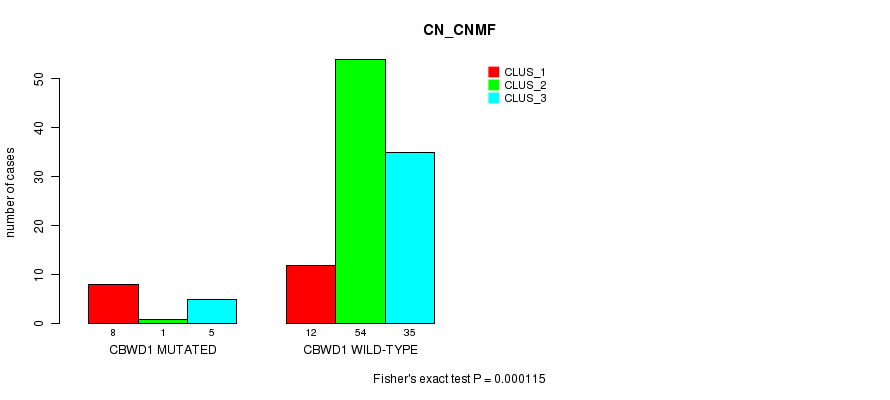
CBWD1 mutation correlated to 'CN_CNMF'.
-
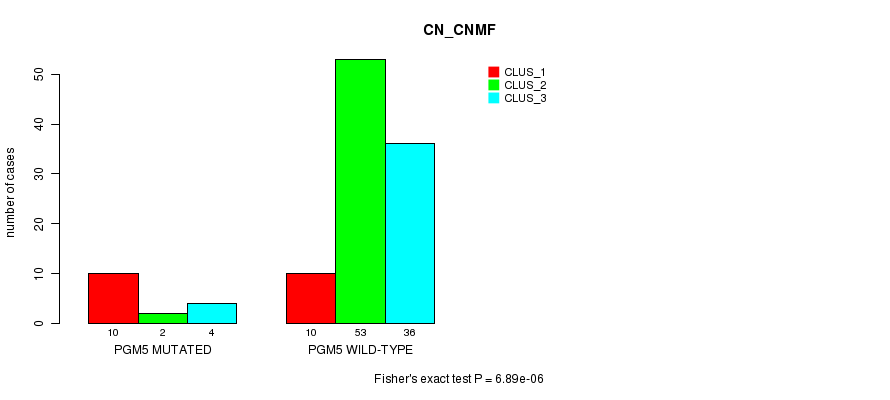
PGM5 mutation correlated to 'CN_CNMF'.
-
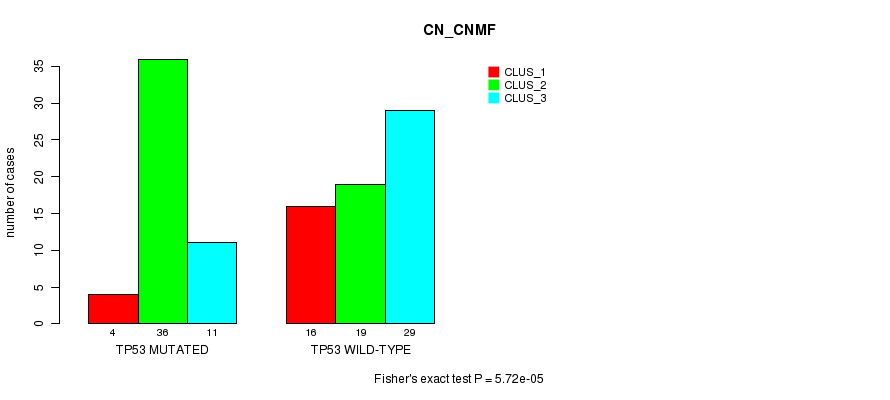
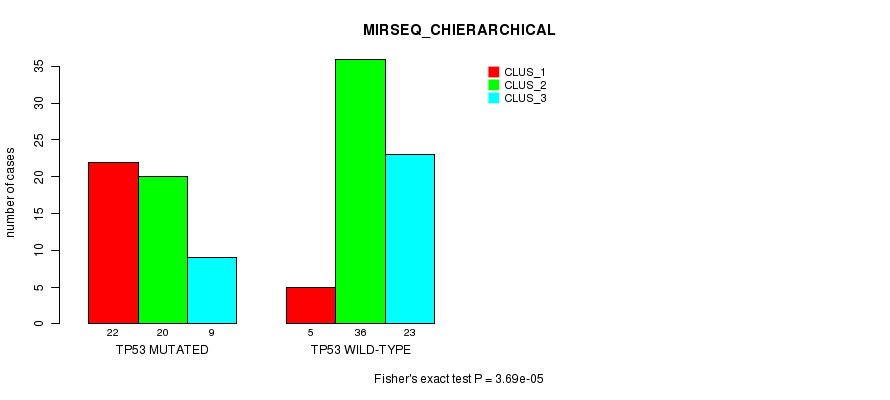
TP53 mutation correlated to 'CN_CNMF' and 'MIRSEQ_CHIERARCHICAL'.
-
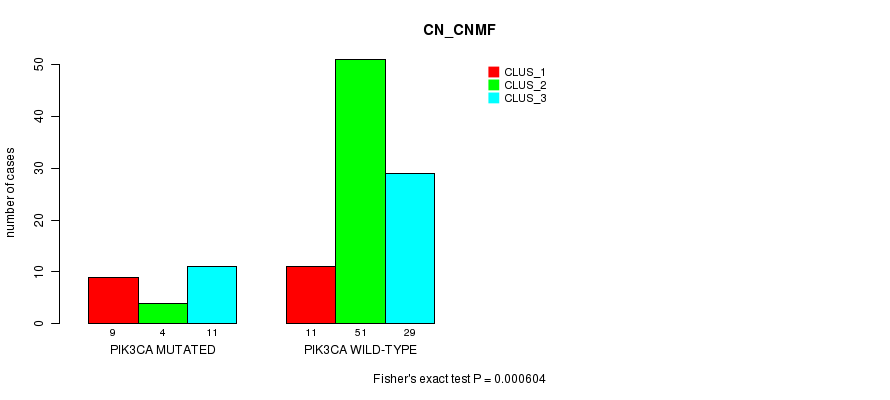
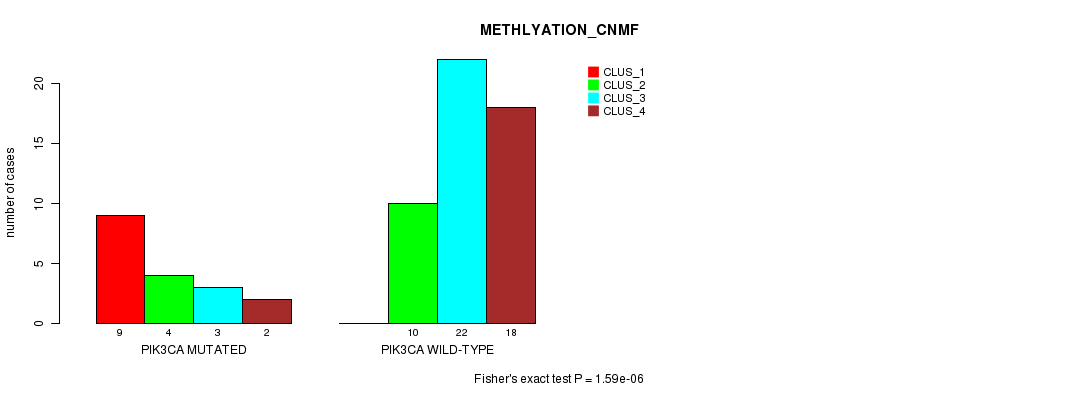
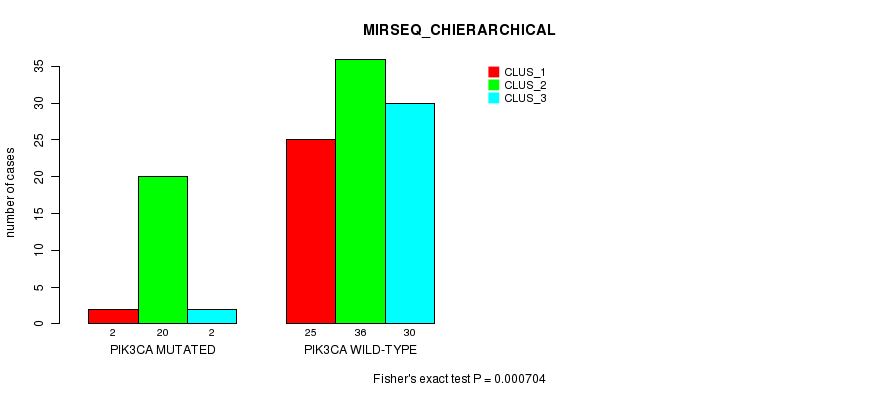
PIK3CA mutation correlated to 'CN_CNMF', 'METHLYATION_CNMF', and 'MIRSEQ_CHIERARCHICAL'.
-
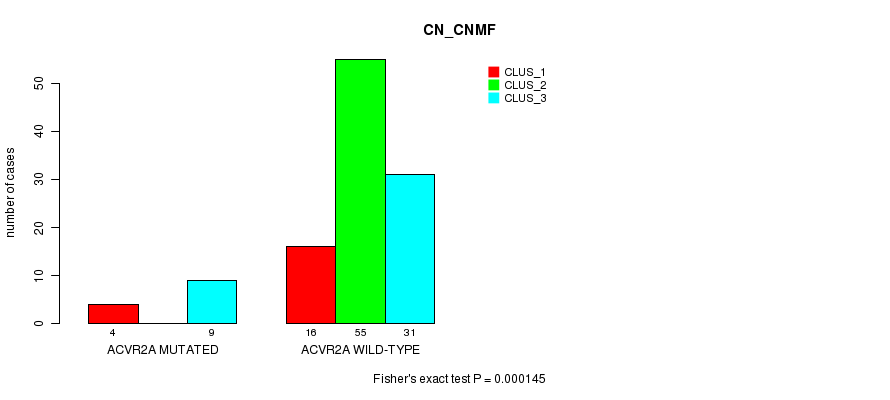
ACVR2A mutation correlated to 'CN_CNMF'.
-
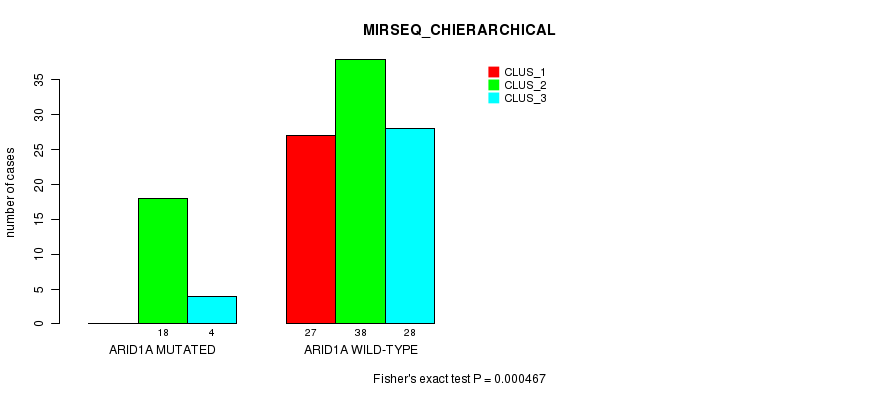
ARID1A mutation correlated to 'CN_CNMF' and 'MIRSEQ_CHIERARCHICAL'.
-
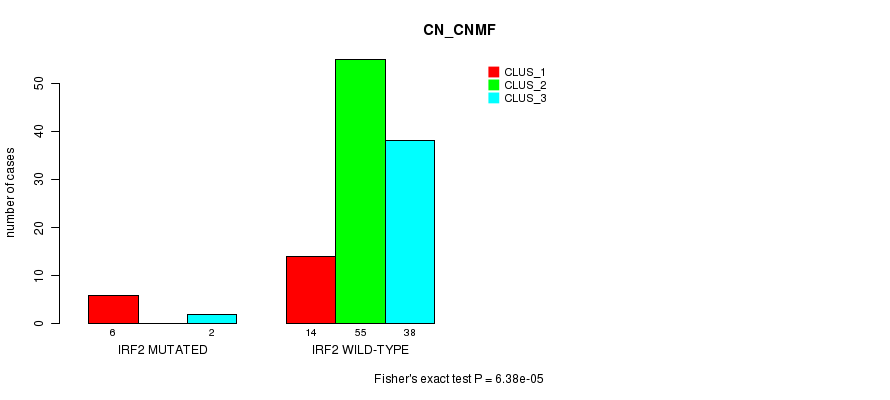
IRF2 mutation correlated to 'CN_CNMF'.
-
RNF43 mutation correlated to 'CN_CNMF'.
-
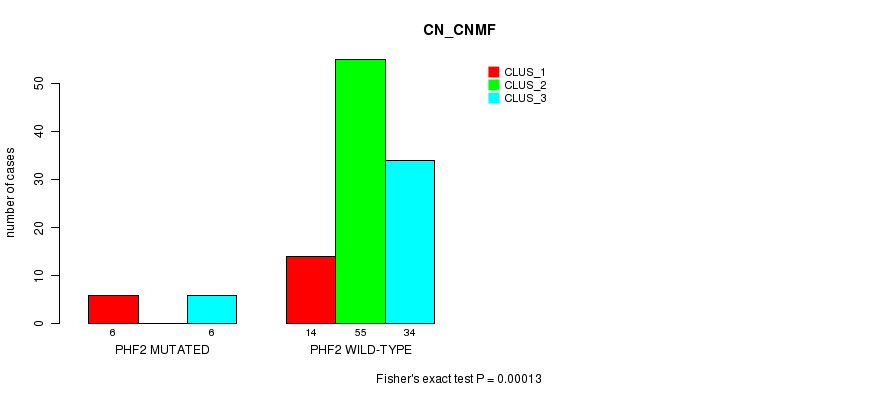
PHF2 mutation correlated to 'CN_CNMF'.
-
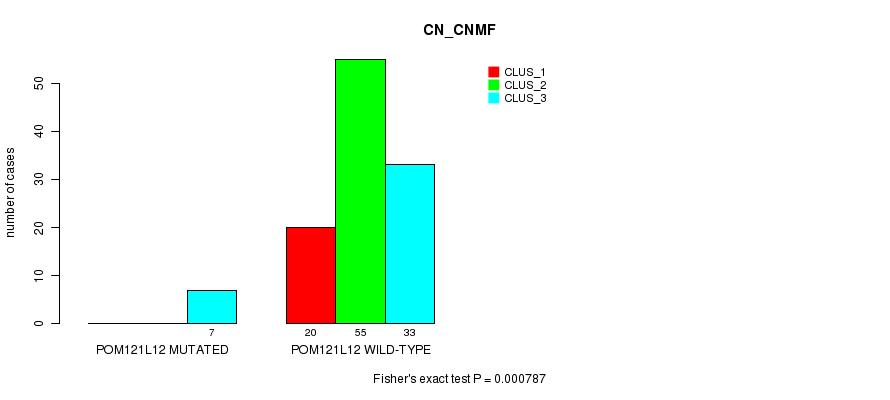
POM121L12 mutation correlated to 'CN_CNMF'.
Table 1. Get Full Table Overview of the association between mutation status of 47 genes and 6 molecular subtypes. Shown in the table are P values (Q values). Thresholded by P value < 0.05 and Q value < 0.25, 14 significant findings detected.
|
Clinical Features |
CN CNMF |
METHLYATION CNMF |
MRNASEQ CNMF |
MRNASEQ CHIERARCHICAL |
MIRSEQ CNMF |
MIRSEQ CHIERARCHICAL |
||
| nMutated (%) | nWild-Type | Fisher's exact test | Fisher's exact test | Fisher's exact test | Fisher's exact test | Fisher's exact test | Fisher's exact test | |
| PIK3CA | 24 (21%) | 92 |
0.000604 (0.15) |
1.59e-06 (0.000411) |
0.412 (1.00) |
0.84 (1.00) |
0.0857 (1.00) |
0.000704 (0.174) |
| TP53 | 52 (45%) | 64 |
5.72e-05 (0.0146) |
0.0203 (1.00) |
1 (1.00) |
0.236 (1.00) |
0.00526 (1.00) |
3.69e-05 (0.00947) |
| ARID1A | 22 (19%) | 94 |
7.73e-05 (0.0196) |
0.0145 (1.00) |
0.488 (1.00) |
0.274 (1.00) |
0.00562 (1.00) |
0.000467 (0.116) |
| CBWD1 | 14 (12%) | 102 |
0.000115 (0.0289) |
0.0773 (1.00) |
0.457 (1.00) |
0.213 (1.00) |
0.0561 (1.00) |
0.193 (1.00) |
| PGM5 | 16 (14%) | 100 |
6.89e-06 (0.00178) |
0.00344 (0.843) |
0.281 (1.00) |
0.157 (1.00) |
0.262 (1.00) |
0.162 (1.00) |
| ACVR2A | 13 (11%) | 103 |
0.000145 (0.0363) |
0.0238 (1.00) |
0.698 (1.00) |
0.424 (1.00) |
0.0246 (1.00) |
0.0563 (1.00) |
| IRF2 | 8 (7%) | 108 |
6.38e-05 (0.0162) |
0.0497 (1.00) |
1 (1.00) |
0.279 (1.00) |
0.197 (1.00) |
0.278 (1.00) |
| RNF43 | 13 (11%) | 103 |
5.9e-05 (0.015) |
0.0289 (1.00) |
0.698 (1.00) |
0.732 (1.00) |
0.184 (1.00) |
0.0507 (1.00) |
| PHF2 | 12 (10%) | 104 |
0.00013 (0.0327) |
0.0238 (1.00) |
0.664 (1.00) |
0.0472 (1.00) |
0.0414 (1.00) |
0.0272 (1.00) |
| POM121L12 | 7 (6%) | 109 |
0.000787 (0.194) |
0.253 (1.00) |
1 (1.00) |
0.745 (1.00) |
0.85 (1.00) |
0.309 (1.00) |
| KRAS | 14 (12%) | 102 |
0.107 (1.00) |
0.411 (1.00) |
1 (1.00) |
0.299 (1.00) |
0.271 (1.00) |
0.706 (1.00) |
| RPL22 | 9 (8%) | 107 |
0.0234 (1.00) |
0.412 (1.00) |
0.0729 (1.00) |
0.282 (1.00) |
0.28 (1.00) |
|
| TRIM48 | 10 (9%) | 106 |
0.0137 (1.00) |
0.206 (1.00) |
1 (1.00) |
1 (1.00) |
0.103 (1.00) |
0.173 (1.00) |
| XPOT | 6 (5%) | 110 |
0.0136 (1.00) |
0.345 (1.00) |
1 (1.00) |
0.327 (1.00) |
0.0539 (1.00) |
|
| RHOA | 7 (6%) | 109 |
0.146 (1.00) |
0.851 (1.00) |
0.488 (1.00) |
0.383 (1.00) |
0.683 (1.00) |
|
| OR8H3 | 10 (9%) | 106 |
0.611 (1.00) |
0.0907 (1.00) |
0.108 (1.00) |
0.101 (1.00) |
0.873 (1.00) |
0.205 (1.00) |
| EDNRB | 12 (10%) | 104 |
0.33 (1.00) |
0.545 (1.00) |
0.412 (1.00) |
0.84 (1.00) |
0.405 (1.00) |
0.162 (1.00) |
| ZNF804B | 18 (16%) | 98 |
0.202 (1.00) |
0.0568 (1.00) |
0.281 (1.00) |
0.885 (1.00) |
0.177 (1.00) |
0.209 (1.00) |
| IAPP | 4 (3%) | 112 |
0.385 (1.00) |
1 (1.00) |
0.131 (1.00) |
0.569 (1.00) |
||
| PCDH15 | 22 (19%) | 94 |
0.766 (1.00) |
0.916 (1.00) |
0.721 (1.00) |
0.885 (1.00) |
0.71 (1.00) |
0.952 (1.00) |
| SPRYD5 | 8 (7%) | 108 |
0.166 (1.00) |
0.05 (1.00) |
1 (1.00) |
0.643 (1.00) |
0.307 (1.00) |
0.805 (1.00) |
| TUSC3 | 9 (8%) | 107 |
0.237 (1.00) |
0.547 (1.00) |
0.488 (1.00) |
1 (1.00) |
0.815 (1.00) |
|
| FGF22 | 3 (3%) | 113 |
0.0354 (1.00) |
1 (1.00) |
1 (1.00) |
0.324 (1.00) |
||
| HLA-B | 9 (8%) | 107 |
0.0491 (1.00) |
0.00377 (0.92) |
0.607 (1.00) |
1 (1.00) |
0.869 (1.00) |
0.666 (1.00) |
| PTH2 | 3 (3%) | 113 |
1 (1.00) |
0.125 (1.00) |
0.143 (1.00) |
0.8 (1.00) |
||
| C17ORF63 | 3 (3%) | 113 |
0.759 (1.00) |
1 (1.00) |
1 (1.00) |
1 (1.00) |
||
| SMAD4 | 7 (6%) | 109 |
0.406 (1.00) |
0.741 (1.00) |
1 (1.00) |
0.745 (1.00) |
0.85 (1.00) |
1 (1.00) |
| POTEG | 6 (5%) | 110 |
0.183 (1.00) |
0.556 (1.00) |
1 (1.00) |
1 (1.00) |
0.662 (1.00) |
0.36 (1.00) |
| WBSCR17 | 12 (10%) | 104 |
0.0529 (1.00) |
0.00743 (1.00) |
0.607 (1.00) |
0.643 (1.00) |
0.241 (1.00) |
0.451 (1.00) |
| TPTE | 14 (12%) | 102 |
0.868 (1.00) |
0.895 (1.00) |
0.412 (1.00) |
0.84 (1.00) |
0.212 (1.00) |
0.498 (1.00) |
| CDH1 | 11 (9%) | 105 |
0.112 (1.00) |
0.531 (1.00) |
0.607 (1.00) |
0.745 (1.00) |
0.0812 (1.00) |
0.0936 (1.00) |
| CPS1 | 13 (11%) | 103 |
0.447 (1.00) |
0.296 (1.00) |
1 (1.00) |
0.863 (1.00) |
0.902 (1.00) |
0.132 (1.00) |
| INO80E | 5 (4%) | 111 |
0.25 (1.00) |
0.607 (1.00) |
0.279 (1.00) |
0.348 (1.00) |
1 (1.00) |
|
| ELF3 | 5 (4%) | 111 |
0.0484 (1.00) |
0.227 (1.00) |
1 (1.00) |
0.622 (1.00) |
0.077 (1.00) |
|
| PARK2 | 9 (8%) | 107 |
0.0755 (1.00) |
0.0388 (1.00) |
1 (1.00) |
0.45 (1.00) |
0.869 (1.00) |
0.28 (1.00) |
| LARP4B | 5 (4%) | 111 |
0.0132 (1.00) |
0.206 (1.00) |
1 (1.00) |
0.622 (1.00) |
0.077 (1.00) |
|
| OR6K3 | 6 (5%) | 110 |
0.0756 (1.00) |
0.472 (1.00) |
1 (1.00) |
0.387 (1.00) |
0.522 (1.00) |
0.868 (1.00) |
| TM7SF4 | 7 (6%) | 109 |
0.146 (1.00) |
0.296 (1.00) |
0.488 (1.00) |
0.85 (1.00) |
0.267 (1.00) |
|
| UPF3A | 6 (5%) | 110 |
0.22 (1.00) |
0.206 (1.00) |
0.607 (1.00) |
0.745 (1.00) |
0.522 (1.00) |
0.222 (1.00) |
| C7ORF63 | 5 (4%) | 111 |
0.0132 (1.00) |
1 (1.00) |
1 (1.00) |
0.622 (1.00) |
0.507 (1.00) |
|
| KDM4B | 10 (9%) | 106 |
0.00512 (1.00) |
0.05 (1.00) |
0.345 (1.00) |
0.45 (1.00) |
0.873 (1.00) |
0.627 (1.00) |
| KIAA0748 | 7 (6%) | 109 |
0.344 (1.00) |
0.507 (1.00) |
1 (1.00) |
0.256 (1.00) |
0.599 (1.00) |
|
| OR8B4 | 3 (3%) | 113 |
0.407 (1.00) |
0.00894 (1.00) |
1 (1.00) |
0.604 (1.00) |
||
| RASA1 | 9 (8%) | 107 |
0.0654 (1.00) |
0.355 (1.00) |
0.664 (1.00) |
0.73 (1.00) |
0.175 (1.00) |
0.495 (1.00) |
| SLITRK6 | 10 (9%) | 106 |
0.553 (1.00) |
0.934 (1.00) |
0.108 (1.00) |
0.745 (1.00) |
0.174 (1.00) |
0.835 (1.00) |
| TP53TG5 | 4 (3%) | 112 |
0.12 (1.00) |
1 (1.00) |
1 (1.00) |
0.808 (1.00) |
||
| LHCGR | 7 (6%) | 109 |
0.76 (1.00) |
0.815 (1.00) |
0.488 (1.00) |
0.709 (1.00) |
0.267 (1.00) |
P value = 0.000115 (Fisher's exact test), Q value = 0.029
Table S1. Gene #1: 'CBWD1 MUTATION STATUS' versus Clinical Feature #1: 'CN_CNMF'
| nPatients | CLUS_1 | CLUS_2 | CLUS_3 |
|---|---|---|---|
| ALL | 20 | 55 | 40 |
| CBWD1 MUTATED | 8 | 1 | 5 |
| CBWD1 WILD-TYPE | 12 | 54 | 35 |
Figure S1. Get High-res Image Gene #1: 'CBWD1 MUTATION STATUS' versus Clinical Feature #1: 'CN_CNMF'
P value = 6.89e-06 (Fisher's exact test), Q value = 0.0018
Table S2. Gene #3: 'PGM5 MUTATION STATUS' versus Clinical Feature #1: 'CN_CNMF'
| nPatients | CLUS_1 | CLUS_2 | CLUS_3 |
|---|---|---|---|
| ALL | 20 | 55 | 40 |
| PGM5 MUTATED | 10 | 2 | 4 |
| PGM5 WILD-TYPE | 10 | 53 | 36 |
Figure S2. Get High-res Image Gene #3: 'PGM5 MUTATION STATUS' versus Clinical Feature #1: 'CN_CNMF'
P value = 5.72e-05 (Fisher's exact test), Q value = 0.015
Table S3. Gene #5: 'TP53 MUTATION STATUS' versus Clinical Feature #1: 'CN_CNMF'
| nPatients | CLUS_1 | CLUS_2 | CLUS_3 |
|---|---|---|---|
| ALL | 20 | 55 | 40 |
| TP53 MUTATED | 4 | 36 | 11 |
| TP53 WILD-TYPE | 16 | 19 | 29 |
Figure S3. Get High-res Image Gene #5: 'TP53 MUTATION STATUS' versus Clinical Feature #1: 'CN_CNMF'
P value = 3.69e-05 (Fisher's exact test), Q value = 0.0095
Table S4. Gene #5: 'TP53 MUTATION STATUS' versus Clinical Feature #6: 'MIRSEQ_CHIERARCHICAL'
| nPatients | CLUS_1 | CLUS_2 | CLUS_3 |
|---|---|---|---|
| ALL | 27 | 56 | 32 |
| TP53 MUTATED | 22 | 20 | 9 |
| TP53 WILD-TYPE | 5 | 36 | 23 |
Figure S4. Get High-res Image Gene #5: 'TP53 MUTATION STATUS' versus Clinical Feature #6: 'MIRSEQ_CHIERARCHICAL'
P value = 0.000604 (Fisher's exact test), Q value = 0.15
Table S5. Gene #8: 'PIK3CA MUTATION STATUS' versus Clinical Feature #1: 'CN_CNMF'
| nPatients | CLUS_1 | CLUS_2 | CLUS_3 |
|---|---|---|---|
| ALL | 20 | 55 | 40 |
| PIK3CA MUTATED | 9 | 4 | 11 |
| PIK3CA WILD-TYPE | 11 | 51 | 29 |
Figure S5. Get High-res Image Gene #8: 'PIK3CA MUTATION STATUS' versus Clinical Feature #1: 'CN_CNMF'
P value = 1.59e-06 (Fisher's exact test), Q value = 0.00041
Table S6. Gene #8: 'PIK3CA MUTATION STATUS' versus Clinical Feature #2: 'METHLYATION_CNMF'
| nPatients | CLUS_1 | CLUS_2 | CLUS_3 | CLUS_4 |
|---|---|---|---|---|
| ALL | 9 | 14 | 25 | 20 |
| PIK3CA MUTATED | 9 | 4 | 3 | 2 |
| PIK3CA WILD-TYPE | 0 | 10 | 22 | 18 |
Figure S6. Get High-res Image Gene #8: 'PIK3CA MUTATION STATUS' versus Clinical Feature #2: 'METHLYATION_CNMF'
P value = 0.000704 (Fisher's exact test), Q value = 0.17
Table S7. Gene #8: 'PIK3CA MUTATION STATUS' versus Clinical Feature #6: 'MIRSEQ_CHIERARCHICAL'
| nPatients | CLUS_1 | CLUS_2 | CLUS_3 |
|---|---|---|---|
| ALL | 27 | 56 | 32 |
| PIK3CA MUTATED | 2 | 20 | 2 |
| PIK3CA WILD-TYPE | 25 | 36 | 30 |
Figure S7. Get High-res Image Gene #8: 'PIK3CA MUTATION STATUS' versus Clinical Feature #6: 'MIRSEQ_CHIERARCHICAL'
P value = 0.000145 (Fisher's exact test), Q value = 0.036
Table S8. Gene #9: 'ACVR2A MUTATION STATUS' versus Clinical Feature #1: 'CN_CNMF'
| nPatients | CLUS_1 | CLUS_2 | CLUS_3 |
|---|---|---|---|
| ALL | 20 | 55 | 40 |
| ACVR2A MUTATED | 4 | 0 | 9 |
| ACVR2A WILD-TYPE | 16 | 55 | 31 |
Figure S8. Get High-res Image Gene #9: 'ACVR2A MUTATION STATUS' versus Clinical Feature #1: 'CN_CNMF'
P value = 7.73e-05 (Fisher's exact test), Q value = 0.02
Table S9. Gene #11: 'ARID1A MUTATION STATUS' versus Clinical Feature #1: 'CN_CNMF'
| nPatients | CLUS_1 | CLUS_2 | CLUS_3 |
|---|---|---|---|
| ALL | 20 | 55 | 40 |
| ARID1A MUTATED | 10 | 3 | 9 |
| ARID1A WILD-TYPE | 10 | 52 | 31 |
Figure S9. Get High-res Image Gene #11: 'ARID1A MUTATION STATUS' versus Clinical Feature #1: 'CN_CNMF'
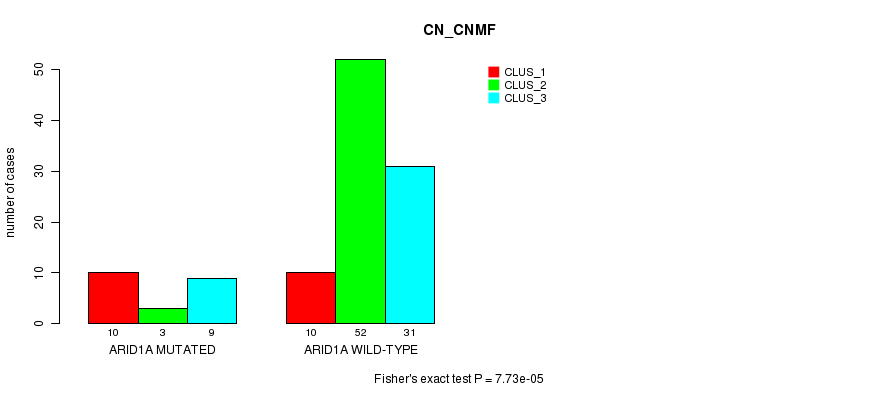
P value = 0.000467 (Fisher's exact test), Q value = 0.12
Table S10. Gene #11: 'ARID1A MUTATION STATUS' versus Clinical Feature #6: 'MIRSEQ_CHIERARCHICAL'
| nPatients | CLUS_1 | CLUS_2 | CLUS_3 |
|---|---|---|---|
| ALL | 27 | 56 | 32 |
| ARID1A MUTATED | 0 | 18 | 4 |
| ARID1A WILD-TYPE | 27 | 38 | 28 |
Figure S10. Get High-res Image Gene #11: 'ARID1A MUTATION STATUS' versus Clinical Feature #6: 'MIRSEQ_CHIERARCHICAL'
P value = 6.38e-05 (Fisher's exact test), Q value = 0.016
Table S11. Gene #15: 'IRF2 MUTATION STATUS' versus Clinical Feature #1: 'CN_CNMF'
| nPatients | CLUS_1 | CLUS_2 | CLUS_3 |
|---|---|---|---|
| ALL | 20 | 55 | 40 |
| IRF2 MUTATED | 6 | 0 | 2 |
| IRF2 WILD-TYPE | 14 | 55 | 38 |
Figure S11. Get High-res Image Gene #15: 'IRF2 MUTATION STATUS' versus Clinical Feature #1: 'CN_CNMF'
P value = 5.9e-05 (Fisher's exact test), Q value = 0.015
Table S12. Gene #26: 'RNF43 MUTATION STATUS' versus Clinical Feature #1: 'CN_CNMF'
| nPatients | CLUS_1 | CLUS_2 | CLUS_3 |
|---|---|---|---|
| ALL | 20 | 55 | 40 |
| RNF43 MUTATED | 8 | 1 | 4 |
| RNF43 WILD-TYPE | 12 | 54 | 36 |
Figure S12. Get High-res Image Gene #26: 'RNF43 MUTATION STATUS' versus Clinical Feature #1: 'CN_CNMF'

P value = 0.00013 (Fisher's exact test), Q value = 0.033
Table S13. Gene #28: 'PHF2 MUTATION STATUS' versus Clinical Feature #1: 'CN_CNMF'
| nPatients | CLUS_1 | CLUS_2 | CLUS_3 |
|---|---|---|---|
| ALL | 20 | 55 | 40 |
| PHF2 MUTATED | 6 | 0 | 6 |
| PHF2 WILD-TYPE | 14 | 55 | 34 |
Figure S13. Get High-res Image Gene #28: 'PHF2 MUTATION STATUS' versus Clinical Feature #1: 'CN_CNMF'
P value = 0.000787 (Fisher's exact test), Q value = 0.19
Table S14. Gene #43: 'POM121L12 MUTATION STATUS' versus Clinical Feature #1: 'CN_CNMF'
| nPatients | CLUS_1 | CLUS_2 | CLUS_3 |
|---|---|---|---|
| ALL | 20 | 55 | 40 |
| POM121L12 MUTATED | 0 | 0 | 7 |
| POM121L12 WILD-TYPE | 20 | 55 | 33 |
Figure S14. Get High-res Image Gene #43: 'POM121L12 MUTATION STATUS' versus Clinical Feature #1: 'CN_CNMF'
-
Mutation data file = STAD-TP.mutsig.cluster.txt
-
Molecular subtypes file = STAD-TP.transferedmergedcluster.txt
-
Number of patients = 116
-
Number of significantly mutated genes = 47
-
Number of Molecular subtypes = 6
-
Exclude genes that fewer than K tumors have mutations, K = 3
For binary or multi-class clinical features (nominal or ordinal), two-tailed Fisher's exact tests (Fisher 1922) were used to estimate the P values using the 'fisher.test' function in R
For multiple hypothesis correction, Q value is the False Discovery Rate (FDR) analogue of the P value (Benjamini and Hochberg 1995), defined as the minimum FDR at which the test may be called significant. We used the 'Benjamini and Hochberg' method of 'p.adjust' function in R to convert P values into Q values.
This is an experimental feature. The full results of the analysis summarized in this report can be downloaded from the TCGA Data Coordination Center.