(primary solid tumor cohort)
This pipeline computes the correlation between significant arm-level copy number variations (cnvs) and subtypes.
Testing the association between copy number variation 73 arm-level results and 6 molecular subtypes across 126 patients, 6 significant findings detected with Q value < 0.25.
-
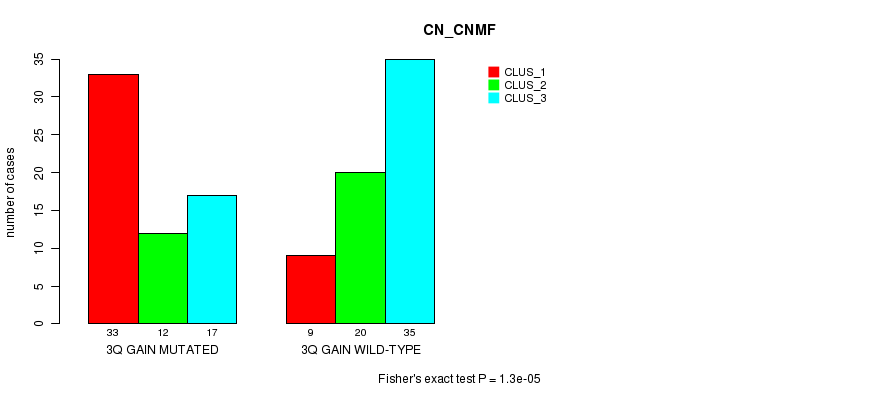
3q gain cnv correlated to 'CN_CNMF'.
-
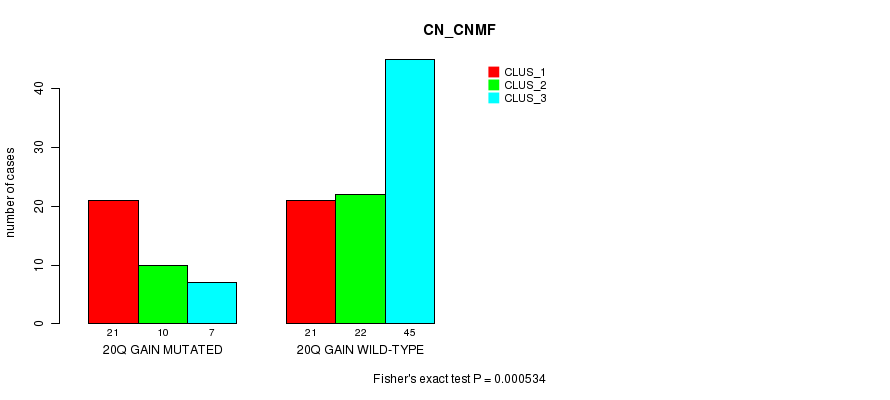
20q gain cnv correlated to 'CN_CNMF'.
-
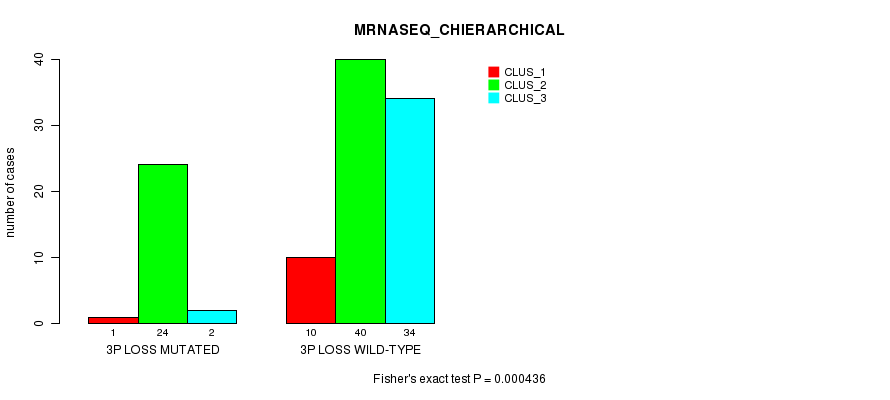
3p loss cnv correlated to 'MRNASEQ_CHIERARCHICAL'.
-
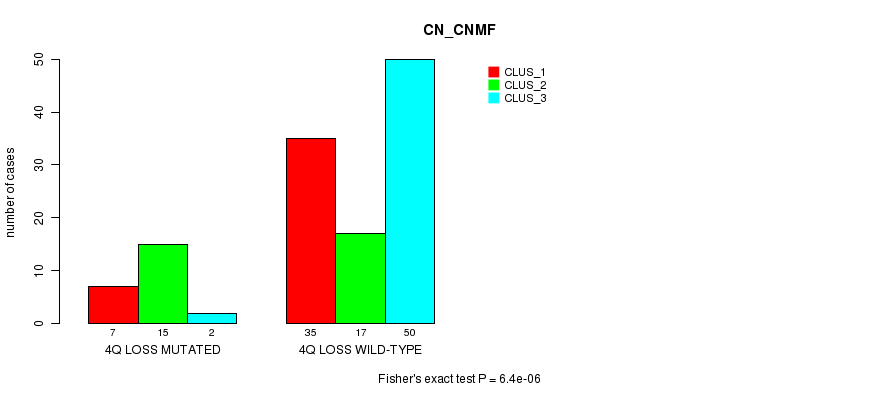
4q loss cnv correlated to 'CN_CNMF'.
-
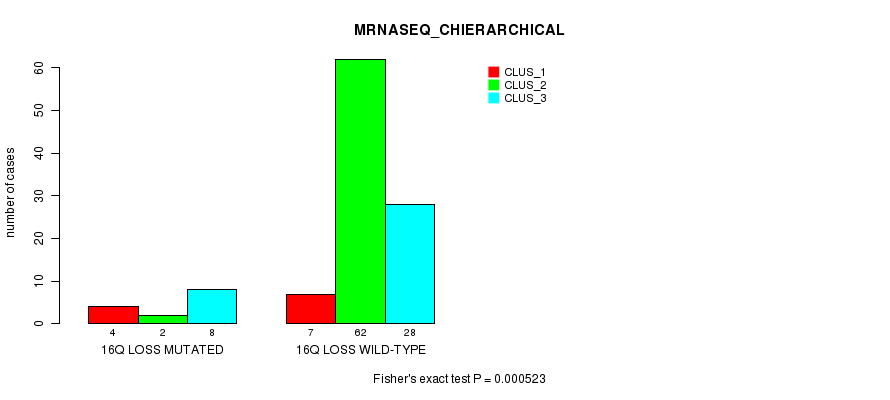
16q loss cnv correlated to 'MRNASEQ_CHIERARCHICAL'.
-
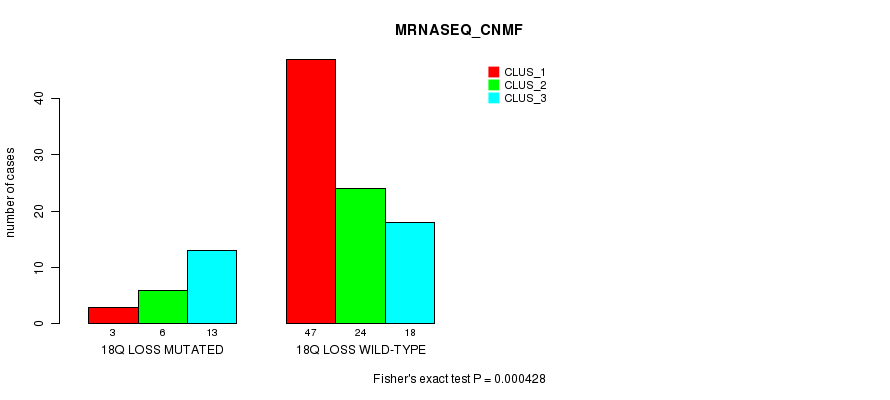
18q loss cnv correlated to 'MRNASEQ_CNMF'.
Table 1. Get Full Table Overview of the association between significant copy number variation of 73 arm-level results and 6 molecular subtypes. Shown in the table are P values (Q values). Thresholded by Q value < 0.25, 6 significant findings detected.
|
Molecular subtypes |
CN CNMF |
METHLYATION CNMF |
MRNASEQ CNMF |
MRNASEQ CHIERARCHICAL |
MIRSEQ CNMF |
MIRSEQ CHIERARCHICAL |
||
| nCNV (%) | nWild-Type | Fisher's exact test | Fisher's exact test | Fisher's exact test | Fisher's exact test | Fisher's exact test | Fisher's exact test | |
| 3q gain | 62 (49%) | 64 |
1.3e-05 (0.0057) |
0.362 (1.00) |
0.0191 (1.00) |
0.0478 (1.00) |
0.73 (1.00) |
0.03 (1.00) |
| 20q gain | 38 (30%) | 88 |
0.000534 (0.231) |
0.362 (1.00) |
0.512 (1.00) |
0.167 (1.00) |
0.548 (1.00) |
0.432 (1.00) |
| 3p loss | 27 (21%) | 99 |
0.32 (1.00) |
0.0016 (0.685) |
0.198 (1.00) |
0.000436 (0.19) |
0.0127 (1.00) |
0.00406 (1.00) |
| 4q loss | 24 (19%) | 102 |
6.4e-06 (0.0028) |
0.773 (1.00) |
0.0976 (1.00) |
0.297 (1.00) |
0.474 (1.00) |
0.501 (1.00) |
| 16q loss | 14 (11%) | 112 |
0.821 (1.00) |
0.0237 (1.00) |
0.00107 (0.46) |
0.000523 (0.227) |
0.614 (1.00) |
0.00792 (1.00) |
| 18q loss | 24 (19%) | 102 |
0.112 (1.00) |
0.0214 (1.00) |
0.000428 (0.187) |
0.00334 (1.00) |
0.103 (1.00) |
0.00237 (1.00) |
| 1p gain | 34 (27%) | 92 |
0.415 (1.00) |
0.764 (1.00) |
0.274 (1.00) |
0.904 (1.00) |
0.668 (1.00) |
0.655 (1.00) |
| 1q gain | 48 (38%) | 78 |
0.0208 (1.00) |
0.479 (1.00) |
0.345 (1.00) |
0.568 (1.00) |
0.107 (1.00) |
0.435 (1.00) |
| 2p gain | 17 (13%) | 109 |
0.0833 (1.00) |
0.303 (1.00) |
0.1 (1.00) |
0.0951 (1.00) |
0.0943 (1.00) |
0.0418 (1.00) |
| 2q gain | 5 (4%) | 121 |
0.0843 (1.00) |
0.611 (1.00) |
0.0694 (1.00) |
0.153 (1.00) |
1 (1.00) |
1 (1.00) |
| 3p gain | 21 (17%) | 105 |
0.568 (1.00) |
0.685 (1.00) |
0.717 (1.00) |
0.0367 (1.00) |
0.748 (1.00) |
0.667 (1.00) |
| 4q gain | 3 (2%) | 123 |
0.115 (1.00) |
0.11 (1.00) |
0.453 (1.00) |
0.485 (1.00) |
0.203 (1.00) |
0.343 (1.00) |
| 5p gain | 41 (33%) | 85 |
0.0204 (1.00) |
1 (1.00) |
0.935 (1.00) |
0.728 (1.00) |
0.0792 (1.00) |
0.221 (1.00) |
| 5q gain | 13 (10%) | 113 |
0.572 (1.00) |
0.394 (1.00) |
1 (1.00) |
1 (1.00) |
0.534 (1.00) |
0.383 (1.00) |
| 6p gain | 18 (14%) | 108 |
0.108 (1.00) |
0.00399 (1.00) |
0.0262 (1.00) |
0.0987 (1.00) |
0.0237 (1.00) |
0.0619 (1.00) |
| 6q gain | 9 (7%) | 117 |
0.501 (1.00) |
0.00852 (1.00) |
0.0536 (1.00) |
0.00601 (1.00) |
0.309 (1.00) |
0.0708 (1.00) |
| 7p gain | 7 (6%) | 119 |
0.48 (1.00) |
0.195 (1.00) |
0.198 (1.00) |
0.41 (1.00) |
0.215 (1.00) |
0.315 (1.00) |
| 7q gain | 11 (9%) | 115 |
0.109 (1.00) |
0.34 (1.00) |
0.285 (1.00) |
1 (1.00) |
0.576 (1.00) |
1 (1.00) |
| 8p gain | 10 (8%) | 116 |
0.644 (1.00) |
0.41 (1.00) |
0.12 (1.00) |
0.167 (1.00) |
0.416 (1.00) |
0.761 (1.00) |
| 8q gain | 22 (17%) | 104 |
0.0349 (1.00) |
0.0253 (1.00) |
0.104 (1.00) |
0.383 (1.00) |
0.48 (1.00) |
0.441 (1.00) |
| 9p gain | 12 (10%) | 114 |
0.32 (1.00) |
0.748 (1.00) |
0.47 (1.00) |
0.0148 (1.00) |
0.926 (1.00) |
0.312 (1.00) |
| 9q gain | 11 (9%) | 115 |
0.669 (1.00) |
0.239 (1.00) |
0.434 (1.00) |
0.0361 (1.00) |
0.772 (1.00) |
0.272 (1.00) |
| 10p gain | 8 (6%) | 118 |
0.653 (1.00) |
0.901 (1.00) |
0.883 (1.00) |
0.725 (1.00) |
0.296 (1.00) |
1 (1.00) |
| 10q gain | 4 (3%) | 122 |
0.457 (1.00) |
0.568 (1.00) |
0.81 (1.00) |
0.145 (1.00) |
0.387 (1.00) |
0.693 (1.00) |
| 12p gain | 14 (11%) | 112 |
0.0103 (1.00) |
0.418 (1.00) |
0.385 (1.00) |
0.00322 (1.00) |
0.163 (1.00) |
0.334 (1.00) |
| 12q gain | 10 (8%) | 116 |
0.0213 (1.00) |
0.841 (1.00) |
0.637 (1.00) |
0.0515 (1.00) |
0.545 (1.00) |
0.838 (1.00) |
| 13q gain | 6 (5%) | 120 |
0.0397 (1.00) |
0.491 (1.00) |
0.168 (1.00) |
0.488 (1.00) |
0.464 (1.00) |
0.693 (1.00) |
| 14q gain | 10 (8%) | 116 |
0.305 (1.00) |
1 (1.00) |
0.201 (1.00) |
0.124 (1.00) |
0.289 (1.00) |
0.739 (1.00) |
| 15q gain | 13 (10%) | 113 |
0.00184 (0.785) |
1 (1.00) |
0.313 (1.00) |
0.794 (1.00) |
0.933 (1.00) |
0.931 (1.00) |
| 16p gain | 14 (11%) | 112 |
0.0456 (1.00) |
0.171 (1.00) |
0.506 (1.00) |
0.0615 (1.00) |
0.38 (1.00) |
0.455 (1.00) |
| 16q gain | 10 (8%) | 116 |
0.92 (1.00) |
0.546 (1.00) |
0.364 (1.00) |
0.0122 (1.00) |
0.387 (1.00) |
0.361 (1.00) |
| 17p gain | 5 (4%) | 121 |
0.616 (1.00) |
0.214 (1.00) |
0.269 (1.00) |
0.0126 (1.00) |
0.159 (1.00) |
0.029 (1.00) |
| 17q gain | 13 (10%) | 113 |
0.0157 (1.00) |
0.0131 (1.00) |
0.0253 (1.00) |
0.0148 (1.00) |
0.348 (1.00) |
0.099 (1.00) |
| 18p gain | 12 (10%) | 114 |
0.408 (1.00) |
0.692 (1.00) |
0.606 (1.00) |
0.0271 (1.00) |
0.23 (1.00) |
0.19 (1.00) |
| 18q gain | 7 (6%) | 119 |
0.0757 (1.00) |
1 (1.00) |
0.486 (1.00) |
0.00832 (1.00) |
0.316 (1.00) |
0.136 (1.00) |
| 19p gain | 8 (6%) | 118 |
0.53 (1.00) |
0.727 (1.00) |
0.547 (1.00) |
0.331 (1.00) |
0.146 (1.00) |
0.894 (1.00) |
| 19q gain | 23 (18%) | 103 |
0.218 (1.00) |
0.672 (1.00) |
0.409 (1.00) |
0.0309 (1.00) |
0.0068 (1.00) |
0.094 (1.00) |
| 20p gain | 32 (25%) | 94 |
0.000689 (0.297) |
0.478 (1.00) |
0.856 (1.00) |
0.083 (1.00) |
0.413 (1.00) |
0.562 (1.00) |
| 21q gain | 14 (11%) | 112 |
0.556 (1.00) |
0.938 (1.00) |
0.266 (1.00) |
0.905 (1.00) |
0.163 (1.00) |
0.504 (1.00) |
| 22q gain | 8 (6%) | 118 |
0.0403 (1.00) |
0.901 (1.00) |
0.326 (1.00) |
0.00377 (1.00) |
0.0298 (1.00) |
0.884 (1.00) |
| Xq gain | 6 (5%) | 120 |
0.435 (1.00) |
0.199 (1.00) |
0.763 (1.00) |
0.332 (1.00) |
0.322 (1.00) |
0.721 (1.00) |
| 1q loss | 3 (2%) | 123 |
0.262 (1.00) |
0.786 (1.00) |
1 (1.00) |
0.485 (1.00) |
0.647 (1.00) |
1 (1.00) |
| 2p loss | 3 (2%) | 123 |
0.115 (1.00) |
0.182 (1.00) |
0.251 (1.00) |
0.673 (1.00) |
0.773 (1.00) |
0.792 (1.00) |
| 2q loss | 5 (4%) | 121 |
0.0843 (1.00) |
0.0295 (1.00) |
0.0859 (1.00) |
0.267 (1.00) |
1 (1.00) |
1 (1.00) |
| 4p loss | 41 (33%) | 85 |
0.00186 (0.79) |
0.0459 (1.00) |
0.279 (1.00) |
0.956 (1.00) |
0.11 (1.00) |
0.763 (1.00) |
| 5p loss | 3 (2%) | 123 |
0.346 (1.00) |
0.786 (1.00) |
0.79 (1.00) |
1 (1.00) |
1 (1.00) |
0.616 (1.00) |
| 5q loss | 20 (16%) | 106 |
0.0316 (1.00) |
0.0535 (1.00) |
0.527 (1.00) |
0.0345 (1.00) |
0.0572 (1.00) |
0.0239 (1.00) |
| 6p loss | 12 (10%) | 114 |
0.926 (1.00) |
0.0536 (1.00) |
0.384 (1.00) |
0.432 (1.00) |
0.478 (1.00) |
0.926 (1.00) |
| 6q loss | 23 (18%) | 103 |
0.208 (1.00) |
0.587 (1.00) |
0.287 (1.00) |
0.777 (1.00) |
0.366 (1.00) |
0.652 (1.00) |
| 7p loss | 6 (5%) | 120 |
0.0625 (1.00) |
0.875 (1.00) |
0.558 (1.00) |
0.332 (1.00) |
0.0958 (1.00) |
0.483 (1.00) |
| 7q loss | 13 (10%) | 113 |
0.0129 (1.00) |
0.707 (1.00) |
0.0352 (1.00) |
0.188 (1.00) |
0.0136 (1.00) |
0.0909 (1.00) |
| 8p loss | 27 (21%) | 99 |
0.435 (1.00) |
0.259 (1.00) |
0.445 (1.00) |
0.795 (1.00) |
0.925 (1.00) |
0.921 (1.00) |
| 8q loss | 6 (5%) | 120 |
1 (1.00) |
0.491 (1.00) |
0.326 (1.00) |
0.332 (1.00) |
0.596 (1.00) |
0.0163 (1.00) |
| 9p loss | 12 (10%) | 114 |
0.32 (1.00) |
0.864 (1.00) |
0.74 (1.00) |
0.776 (1.00) |
0.289 (1.00) |
0.287 (1.00) |
| 9q loss | 11 (9%) | 115 |
0.669 (1.00) |
0.288 (1.00) |
0.0145 (1.00) |
0.275 (1.00) |
0.844 (1.00) |
0.0534 (1.00) |
| 10p loss | 22 (17%) | 104 |
0.0152 (1.00) |
0.795 (1.00) |
0.139 (1.00) |
0.102 (1.00) |
0.583 (1.00) |
0.397 (1.00) |
| 10q loss | 24 (19%) | 102 |
0.0129 (1.00) |
0.958 (1.00) |
0.79 (1.00) |
0.181 (1.00) |
0.279 (1.00) |
1 (1.00) |
| 11p loss | 27 (21%) | 99 |
0.0822 (1.00) |
0.332 (1.00) |
0.874 (1.00) |
0.941 (1.00) |
0.312 (1.00) |
0.66 (1.00) |
| 11q loss | 30 (24%) | 96 |
0.00965 (1.00) |
0.748 (1.00) |
0.771 (1.00) |
0.177 (1.00) |
0.345 (1.00) |
0.53 (1.00) |
| 12p loss | 19 (15%) | 107 |
0.00218 (0.924) |
0.209 (1.00) |
0.739 (1.00) |
0.72 (1.00) |
0.326 (1.00) |
0.355 (1.00) |
| 12q loss | 4 (3%) | 122 |
0.0356 (1.00) |
0.46 (1.00) |
0.286 (1.00) |
0.298 (1.00) |
1 (1.00) |
0.809 (1.00) |
| 13q loss | 23 (18%) | 103 |
0.43 (1.00) |
0.0341 (1.00) |
0.489 (1.00) |
0.0659 (1.00) |
0.911 (1.00) |
0.191 (1.00) |
| 14q loss | 7 (6%) | 119 |
0.424 (1.00) |
0.143 (1.00) |
0.0234 (1.00) |
0.00355 (1.00) |
0.0373 (1.00) |
0.00487 (1.00) |
| 15q loss | 8 (6%) | 118 |
0.00157 (0.674) |
1 (1.00) |
0.316 (1.00) |
0.116 (1.00) |
0.905 (1.00) |
0.807 (1.00) |
| 16p loss | 8 (6%) | 118 |
0.415 (1.00) |
0.144 (1.00) |
0.129 (1.00) |
0.00638 (1.00) |
0.794 (1.00) |
0.169 (1.00) |
| 17p loss | 27 (21%) | 99 |
0.0148 (1.00) |
0.00444 (1.00) |
0.0411 (1.00) |
0.0596 (1.00) |
0.0282 (1.00) |
0.111 (1.00) |
| 17q loss | 5 (4%) | 121 |
0.616 (1.00) |
0.0295 (1.00) |
0.0859 (1.00) |
0.267 (1.00) |
0.37 (1.00) |
0.519 (1.00) |
| 18p loss | 16 (13%) | 110 |
0.55 (1.00) |
0.465 (1.00) |
0.0389 (1.00) |
0.0988 (1.00) |
0.367 (1.00) |
0.0642 (1.00) |
| 19p loss | 12 (10%) | 114 |
0.44 (1.00) |
0.375 (1.00) |
0.258 (1.00) |
0.397 (1.00) |
0.195 (1.00) |
0.00108 (0.465) |
| 19q loss | 6 (5%) | 120 |
0.495 (1.00) |
0.569 (1.00) |
0.486 (1.00) |
0.173 (1.00) |
0.596 (1.00) |
0.0298 (1.00) |
| 20p loss | 8 (6%) | 118 |
0.53 (1.00) |
0.418 (1.00) |
0.596 (1.00) |
0.376 (1.00) |
1 (1.00) |
0.595 (1.00) |
| 21q loss | 13 (10%) | 113 |
0.000976 (0.421) |
0.53 (1.00) |
0.858 (1.00) |
0.81 (1.00) |
1 (1.00) |
0.868 (1.00) |
| 22q loss | 13 (10%) | 113 |
0.87 (1.00) |
1 (1.00) |
0.867 (1.00) |
0.512 (1.00) |
1 (1.00) |
0.926 (1.00) |
P value = 1.3e-05 (Fisher's exact test), Q value = 0.0057
Table S1. Gene #6: '3q gain mutation analysis' versus Clinical Feature #1: 'CN_CNMF'
| nPatients | CLUS_1 | CLUS_2 | CLUS_3 |
|---|---|---|---|
| ALL | 42 | 32 | 52 |
| 3Q GAIN MUTATED | 33 | 12 | 17 |
| 3Q GAIN WILD-TYPE | 9 | 20 | 35 |
Figure S1. Get High-res Image Gene #6: '3q gain mutation analysis' versus Clinical Feature #1: 'CN_CNMF'
P value = 0.000534 (Fisher's exact test), Q value = 0.23
Table S2. Gene #34: '20q gain mutation analysis' versus Clinical Feature #1: 'CN_CNMF'
| nPatients | CLUS_1 | CLUS_2 | CLUS_3 |
|---|---|---|---|
| ALL | 42 | 32 | 52 |
| 20Q GAIN MUTATED | 21 | 10 | 7 |
| 20Q GAIN WILD-TYPE | 21 | 22 | 45 |
Figure S2. Get High-res Image Gene #34: '20q gain mutation analysis' versus Clinical Feature #1: 'CN_CNMF'
P value = 0.000436 (Fisher's exact test), Q value = 0.19
Table S3. Gene #41: '3p loss mutation analysis' versus Clinical Feature #4: 'MRNASEQ_CHIERARCHICAL'
| nPatients | CLUS_1 | CLUS_2 | CLUS_3 |
|---|---|---|---|
| ALL | 11 | 64 | 36 |
| 3P LOSS MUTATED | 1 | 24 | 2 |
| 3P LOSS WILD-TYPE | 10 | 40 | 34 |
Figure S3. Get High-res Image Gene #41: '3p loss mutation analysis' versus Clinical Feature #4: 'MRNASEQ_CHIERARCHICAL'
P value = 6.4e-06 (Fisher's exact test), Q value = 0.0028
Table S4. Gene #43: '4q loss mutation analysis' versus Clinical Feature #1: 'CN_CNMF'
| nPatients | CLUS_1 | CLUS_2 | CLUS_3 |
|---|---|---|---|
| ALL | 42 | 32 | 52 |
| 4Q LOSS MUTATED | 7 | 15 | 2 |
| 4Q LOSS WILD-TYPE | 35 | 17 | 50 |
Figure S4. Get High-res Image Gene #43: '4q loss mutation analysis' versus Clinical Feature #1: 'CN_CNMF'
P value = 0.000523 (Fisher's exact test), Q value = 0.23
Table S5. Gene #64: '16q loss mutation analysis' versus Clinical Feature #4: 'MRNASEQ_CHIERARCHICAL'
| nPatients | CLUS_1 | CLUS_2 | CLUS_3 |
|---|---|---|---|
| ALL | 11 | 64 | 36 |
| 16Q LOSS MUTATED | 4 | 2 | 8 |
| 16Q LOSS WILD-TYPE | 7 | 62 | 28 |
Figure S5. Get High-res Image Gene #64: '16q loss mutation analysis' versus Clinical Feature #4: 'MRNASEQ_CHIERARCHICAL'
P value = 0.000428 (Fisher's exact test), Q value = 0.19
Table S6. Gene #68: '18q loss mutation analysis' versus Clinical Feature #3: 'MRNASEQ_CNMF'
| nPatients | CLUS_1 | CLUS_2 | CLUS_3 |
|---|---|---|---|
| ALL | 50 | 30 | 31 |
| 18Q LOSS MUTATED | 3 | 6 | 13 |
| 18Q LOSS WILD-TYPE | 47 | 24 | 18 |
Figure S6. Get High-res Image Gene #68: '18q loss mutation analysis' versus Clinical Feature #3: 'MRNASEQ_CNMF'
-
Mutation data file = broad_values_by_arm.mutsig.cluster.txt
-
Molecular subtypes file = CESC-TP.transferedmergedcluster.txt
-
Number of patients = 126
-
Number of significantly arm-level cnvs = 73
-
Number of molecular subtypes = 6
-
Exclude genes that fewer than K tumors have mutations, K = 3
For binary or multi-class clinical features (nominal or ordinal), two-tailed Fisher's exact tests (Fisher 1922) were used to estimate the P values using the 'fisher.test' function in R
For multiple hypothesis correction, Q value is the False Discovery Rate (FDR) analogue of the P value (Benjamini and Hochberg 1995), defined as the minimum FDR at which the test may be called significant. We used the 'Benjamini and Hochberg' method of 'p.adjust' function in R to convert P values into Q values.
This is an experimental feature. The full results of the analysis summarized in this report can be downloaded from the TCGA Data Coordination Center.