(primary solid tumor cohort)
This pipeline computes the correlation between significantly recurrent gene mutations and molecular subtypes.
Testing the association between mutation status of 16 genes and 7 molecular subtypes across 69 patients, 3 significant findings detected with P value < 0.05 and Q value < 0.25.
-
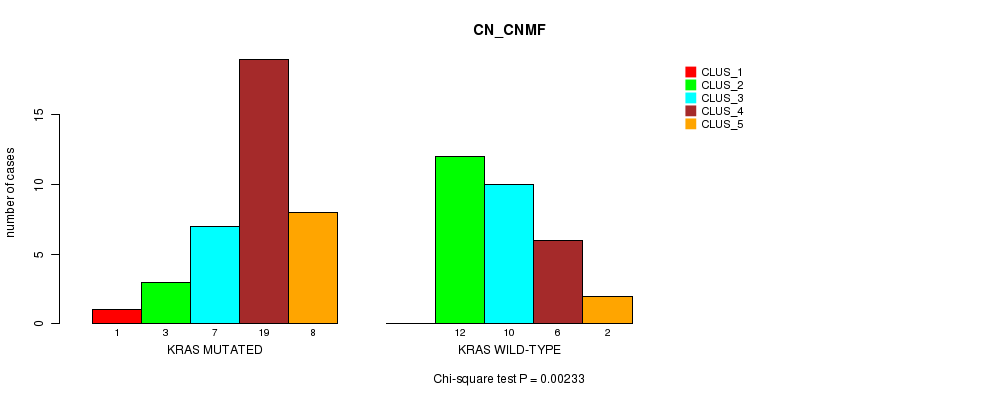
KRAS mutation correlated to 'CN_CNMF'.
-
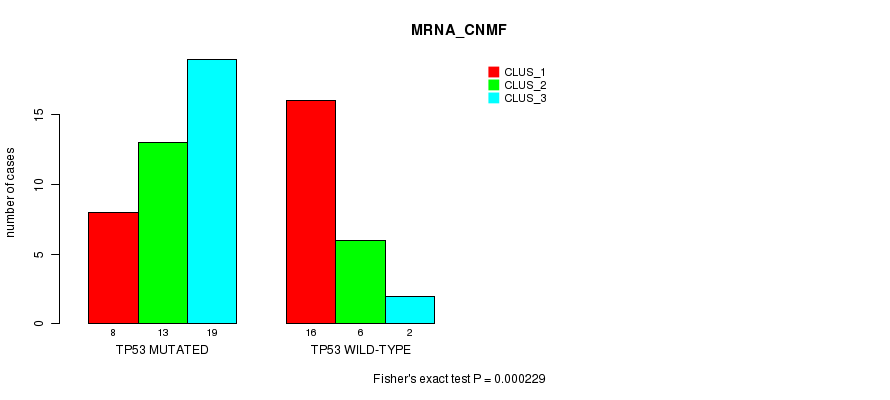
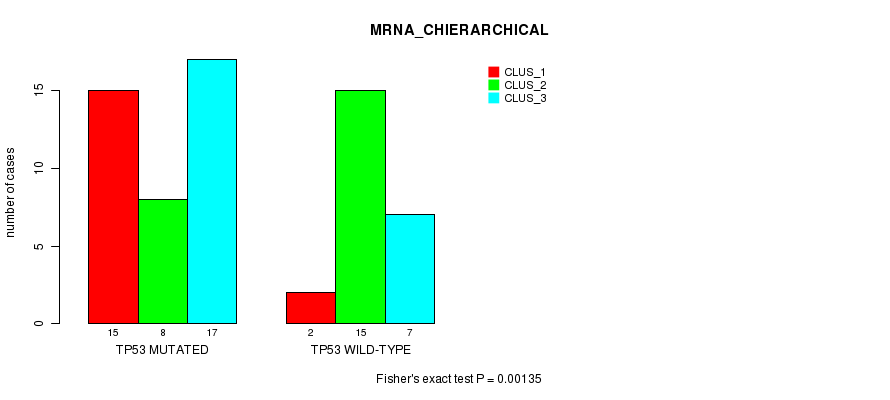
TP53 mutation correlated to 'MRNA_CNMF' and 'MRNA_CHIERARCHICAL'.
Table 1. Get Full Table Overview of the association between mutation status of 16 genes and 7 molecular subtypes. Shown in the table are P values (Q values). Thresholded by P value < 0.05 and Q value < 0.25, 3 significant findings detected.
|
Clinical Features |
MRNA CNMF |
MRNA CHIERARCHICAL |
CN CNMF |
RPPA CNMF |
RPPA CHIERARCHICAL |
MIRSEQ CNMF |
MIRSEQ CHIERARCHICAL |
||
| nMutated (%) | nWild-Type | Fisher's exact test | Fisher's exact test | Chi-square test | Fisher's exact test | Chi-square test | Fisher's exact test | Fisher's exact test | |
| TP53 | 45 (65%) | 24 |
0.000229 (0.0238) |
0.00135 (0.139) |
0.21 (1.00) |
0.16 (1.00) |
0.603 (1.00) |
0.812 (1.00) |
0.288 (1.00) |
| KRAS | 38 (55%) | 31 |
0.342 (1.00) |
0.18 (1.00) |
0.00233 (0.238) |
0.83 (1.00) |
0.817 (1.00) |
0.292 (1.00) |
0.0465 (1.00) |
| APC | 57 (83%) | 12 |
0.85 (1.00) |
0.78 (1.00) |
0.0561 (1.00) |
0.362 (1.00) |
0.598 (1.00) |
0.337 (1.00) |
1 (1.00) |
| SMAD4 | 8 (12%) | 61 |
0.105 (1.00) |
0.361 (1.00) |
0.914 (1.00) |
0.152 (1.00) |
0.18 (1.00) |
0.309 (1.00) |
1 (1.00) |
| KIAA1804 | 9 (13%) | 60 |
0.322 (1.00) |
0.578 (1.00) |
0.0997 (1.00) |
1 (1.00) |
0.82 (1.00) |
0.805 (1.00) |
1 (1.00) |
| FBXW7 | 9 (13%) | 60 |
0.148 (1.00) |
0.0962 (1.00) |
0.409 (1.00) |
0.688 (1.00) |
0.585 (1.00) |
0.805 (1.00) |
1 (1.00) |
| NRAS | 5 (7%) | 64 |
0.856 (1.00) |
1 (1.00) |
0.675 (1.00) |
0.0969 (1.00) |
1 (1.00) |
||
| TCF7L2 | 7 (10%) | 62 |
0.883 (1.00) |
0.683 (1.00) |
0.709 (1.00) |
0.152 (1.00) |
0.528 (1.00) |
1 (1.00) |
1 (1.00) |
| PIK3CA | 7 (10%) | 62 |
1 (1.00) |
0.731 (1.00) |
0.814 (1.00) |
0.465 (1.00) |
0.488 (1.00) |
0.343 (1.00) |
0.328 (1.00) |
| OPCML | 6 (9%) | 63 |
0.228 (1.00) |
0.0972 (1.00) |
0.508 (1.00) |
0.675 (1.00) |
0.13 (1.00) |
1 (1.00) |
1 (1.00) |
| SMAD2 | 5 (7%) | 64 |
1 (1.00) |
1 (1.00) |
0.29 (1.00) |
0.607 (1.00) |
0.0281 (1.00) |
1 (1.00) |
1 (1.00) |
| SPATA8 | 3 (4%) | 66 |
0.388 (1.00) |
0.432 (1.00) |
0.176 (1.00) |
||||
| ERBB2 | 4 (6%) | 65 |
0.54 (1.00) |
1 (1.00) |
0.576 (1.00) |
0.675 (1.00) |
0.13 (1.00) |
1 (1.00) |
1 (1.00) |
| IL1RAPL2 | 5 (7%) | 64 |
0.613 (1.00) |
0.519 (1.00) |
0.785 (1.00) |
0.273 (1.00) |
1 (1.00) |
||
| FAM123B | 6 (9%) | 63 |
1 (1.00) |
0.731 (1.00) |
0.463 (1.00) |
0.159 (1.00) |
0.906 (1.00) |
1 (1.00) |
1 (1.00) |
| ZIM3 | 5 (7%) | 64 |
0.827 (1.00) |
0.668 (1.00) |
0.433 (1.00) |
0.36 (1.00) |
0.337 (1.00) |
0.387 (1.00) |
0.28 (1.00) |
P value = 0.00233 (Chi-square test), Q value = 0.24
Table S1. Gene #2: 'KRAS MUTATION STATUS' versus Clinical Feature #3: 'CN_CNMF'
| nPatients | CLUS_1 | CLUS_2 | CLUS_3 | CLUS_4 | CLUS_5 |
|---|---|---|---|---|---|
| ALL | 1 | 15 | 17 | 25 | 10 |
| KRAS MUTATED | 1 | 3 | 7 | 19 | 8 |
| KRAS WILD-TYPE | 0 | 12 | 10 | 6 | 2 |
Figure S1. Get High-res Image Gene #2: 'KRAS MUTATION STATUS' versus Clinical Feature #3: 'CN_CNMF'
P value = 0.000229 (Fisher's exact test), Q value = 0.024
Table S2. Gene #3: 'TP53 MUTATION STATUS' versus Clinical Feature #1: 'MRNA_CNMF'
| nPatients | CLUS_1 | CLUS_2 | CLUS_3 |
|---|---|---|---|
| ALL | 24 | 19 | 21 |
| TP53 MUTATED | 8 | 13 | 19 |
| TP53 WILD-TYPE | 16 | 6 | 2 |
Figure S2. Get High-res Image Gene #3: 'TP53 MUTATION STATUS' versus Clinical Feature #1: 'MRNA_CNMF'
P value = 0.00135 (Fisher's exact test), Q value = 0.14
Table S3. Gene #3: 'TP53 MUTATION STATUS' versus Clinical Feature #2: 'MRNA_CHIERARCHICAL'
| nPatients | CLUS_1 | CLUS_2 | CLUS_3 |
|---|---|---|---|
| ALL | 17 | 23 | 24 |
| TP53 MUTATED | 15 | 8 | 17 |
| TP53 WILD-TYPE | 2 | 15 | 7 |
Figure S3. Get High-res Image Gene #3: 'TP53 MUTATION STATUS' versus Clinical Feature #2: 'MRNA_CHIERARCHICAL'
-
Mutation data file = READ-TP.mutsig.cluster.txt
-
Molecular subtypes file = READ-TP.transferedmergedcluster.txt
-
Number of patients = 69
-
Number of significantly mutated genes = 16
-
Number of Molecular subtypes = 7
-
Exclude genes that fewer than K tumors have mutations, K = 3
For binary or multi-class clinical features (nominal or ordinal), two-tailed Fisher's exact tests (Fisher 1922) were used to estimate the P values using the 'fisher.test' function in R
For multi-class clinical features (nominal or ordinal), Chi-square tests (Greenwood and Nikulin 1996) were used to estimate the P values using the 'chisq.test' function in R
For multiple hypothesis correction, Q value is the False Discovery Rate (FDR) analogue of the P value (Benjamini and Hochberg 1995), defined as the minimum FDR at which the test may be called significant. We used the 'Benjamini and Hochberg' method of 'p.adjust' function in R to convert P values into Q values.
This is an experimental feature. The full results of the analysis summarized in this report can be downloaded from the TCGA Data Coordination Center.