(primary solid tumor cohort)
This pipeline uses various statistical tests to identify mRNAs whose expression levels correlated to selected clinical features.
Testing the association between 18025 genes and 13 clinical features across 289 samples, statistically thresholded by Q value < 0.05, 13 clinical features related to at least one genes.
-
64 genes correlated to 'AGE'.
-
C12ORF52|84934 , DDX28|55794 , DDIT4L|115265 , ZNF518B|85460 , EPN3|55040 , ...
-
38 genes correlated to 'GENDER'.
-
DDX3Y|8653 , RPS4Y1|6192 , ZFY|7544 , UTY|7404 , USP9Y|8287 , ...
-
5588 genes correlated to 'HISTOLOGICAL.TYPE'.
-
FN1|2335 , KCNN4|3783 , FAM176A|84141 , GABRB2|2561 , LDLR|3949 , ...
-
35 genes correlated to 'RADIATIONS.RADIATION.REGIMENINDICATION'.
-
FLJ37543|285668 , C14ORF180|400258 , TAS2R43|259289 , A2ML1|144568 , HPR|3250 , ...
-
14 genes correlated to 'RADIATIONEXPOSURE'.
-
CRNN|49860 , C13ORF30|144809 , FAM138F|641702 , P2RX2|22953 , RPRML|388394 , ...
-
23 genes correlated to 'DISTANT.METASTASIS'.
-
ARRB1|408 , RTN4RL1|146760 , GJA5|2702 , APOL3|80833 , CYP21A2|1589 , ...
-
120 genes correlated to 'EXTRATHYROIDAL.EXTENSION'.
-
PLRG1|5356 , FOXJ1|2302 , CYP26A1|1592 , TSPYL5|85453 , VEGFA|7422 , ...
-
638 genes correlated to 'LYMPH.NODE.METASTASIS'.
-
KCNN4|3783 , CREB5|9586 , TACSTD2|4070 , CLCNKA|1187 , FN1|2335 , ...
-
3 genes correlated to 'COMPLETENESS.OF.RESECTION'.
-
CATSPER2P1|440278 , MUC13|56667 , TRIM72|493829
-
539 genes correlated to 'NUMBER.OF.LYMPH.NODES'.
-
PCDP1|200373 , FAM60A|58516 , SPATS2L|26010 , DIO2|1734 , TMEM117|84216 , ...
-
133 genes correlated to 'NEOPLASM.DISEASESTAGE'.
-
CYP26A1|1592 , SEMA3G|56920 , GOT2|2806 , KIAA1383|54627 , AIFM1|9131 , ...
-
2 genes correlated to 'MULTIFOCALITY'.
-
INMT|11185 , ETS1|2113
-
14 genes correlated to 'TUMOR.SIZE'.
-
LRRC55|219527 , ABCA6|23460 , CLDN2|9075 , LSM12|124801 , PTGS1|5742 , ...
Complete statistical result table is provided in Supplement Table 1
Table 1. Get Full Table This table shows the clinical features, statistical methods used, and the number of genes that are significantly associated with each clinical feature at Q value < 0.05.
| Clinical feature | Statistical test | Significant genes | Associated with | Associated with | ||
|---|---|---|---|---|---|---|
| AGE | Spearman correlation test | N=64 | older | N=33 | younger | N=31 |
| GENDER | t test | N=38 | male | N=15 | female | N=23 |
| HISTOLOGICAL TYPE | ANOVA test | N=5588 | ||||
| RADIATIONS RADIATION REGIMENINDICATION | t test | N=35 | yes | N=19 | no | N=16 |
| RADIATIONEXPOSURE | t test | N=14 | yes | N=2 | no | N=12 |
| DISTANT METASTASIS | ANOVA test | N=23 | ||||
| EXTRATHYROIDAL EXTENSION | ANOVA test | N=120 | ||||
| LYMPH NODE METASTASIS | ANOVA test | N=638 | ||||
| COMPLETENESS OF RESECTION | ANOVA test | N=3 | ||||
| NUMBER OF LYMPH NODES | Spearman correlation test | N=539 | higher number.of.lymph.nodes | N=250 | lower number.of.lymph.nodes | N=289 |
| NEOPLASM DISEASESTAGE | ANOVA test | N=133 | ||||
| MULTIFOCALITY | t test | N=2 | unifocal | N=0 | multifocal | N=2 |
| TUMOR SIZE | Spearman correlation test | N=14 | higher tumor.size | N=2 | lower tumor.size | N=12 |
Table S1. Basic characteristics of clinical feature: 'AGE'
| AGE | Mean (SD) | 46.65 (15) |
| Significant markers | N = 64 | |
| pos. correlated | 33 | |
| neg. correlated | 31 |
Table S2. Get Full Table List of top 10 genes significantly correlated to 'AGE' by Spearman correlation test
| SpearmanCorr | corrP | Q | |
|---|---|---|---|
| C12ORF52|84934 | 0.3622 | 2.194e-10 | 3.95e-06 |
| DDX28|55794 | 0.3562 | 4.51e-10 | 8.13e-06 |
| DDIT4L|115265 | 0.3346 | 5.456e-09 | 9.83e-05 |
| ZNF518B|85460 | -0.3309 | 8.238e-09 | 0.000148 |
| EPN3|55040 | 0.3277 | 1.169e-08 | 0.000211 |
| IL20RA|53832 | 0.3247 | 1.695e-08 | 0.000305 |
| ASB13|79754 | 0.314 | 4.931e-08 | 0.000889 |
| TUBGCP5|114791 | 0.3112 | 6.601e-08 | 0.00119 |
| RAB3A|5864 | 0.3059 | 1.127e-07 | 0.00203 |
| GPI|2821 | 0.303 | 1.498e-07 | 0.0027 |
Figure S1. Get High-res Image As an example, this figure shows the association of C12ORF52|84934 to 'AGE'. P value = 2.19e-10 with Spearman correlation analysis. The straight line presents the best linear regression.
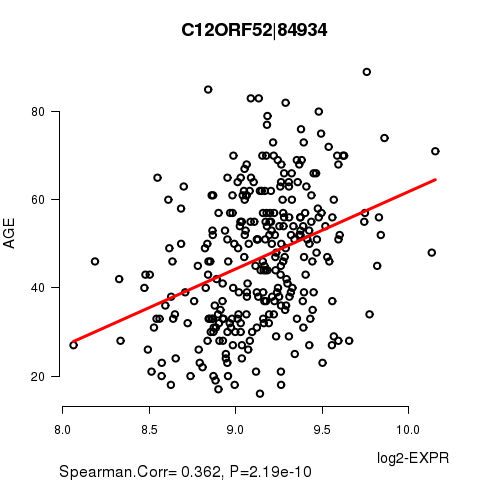
Table S3. Basic characteristics of clinical feature: 'GENDER'
| GENDER | Labels | N |
| FEMALE | 216 | |
| MALE | 73 | |
| Significant markers | N = 38 | |
| Higher in MALE | 15 | |
| Higher in FEMALE | 23 |
Table S4. Get Full Table List of top 10 genes differentially expressed by 'GENDER'
| T(pos if higher in 'MALE') | ttestP | Q | AUC | |
|---|---|---|---|---|
| DDX3Y|8653 | 86.65 | 1.047e-130 | 1.89e-126 | 1 |
| RPS4Y1|6192 | 72.09 | 3.735e-129 | 6.73e-125 | 1 |
| ZFY|7544 | 80.03 | 1.312e-128 | 2.36e-124 | 1 |
| UTY|7404 | 81.48 | 2.648e-105 | 4.77e-101 | 1 |
| USP9Y|8287 | 74.82 | 1.229e-99 | 2.21e-95 | 1 |
| NLGN4Y|22829 | 54.67 | 1.607e-97 | 2.9e-93 | 1 |
| PRKY|5616 | 34.39 | 1.143e-91 | 2.06e-87 | 0.9985 |
| KDM5D|8284 | 77.32 | 1.641e-90 | 2.96e-86 | 1 |
| CYORF15A|246126 | 62.49 | 4.944e-61 | 8.91e-57 | 1 |
| XIST|7503 | -38.75 | 1.619e-54 | 2.92e-50 | 0.9992 |
Figure S2. Get High-res Image As an example, this figure shows the association of DDX3Y|8653 to 'GENDER'. P value = 1.05e-130 with T-test analysis.
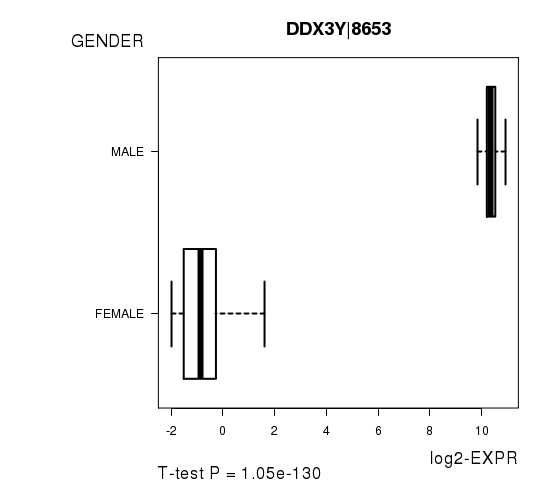
Table S5. Basic characteristics of clinical feature: 'HISTOLOGICAL.TYPE'
| HISTOLOGICAL.TYPE | Labels | N |
| OTHER | 18 | |
| THYROID PAPILLARY CARCINOMA - CLASSICAL/USUAL | 169 | |
| THYROID PAPILLARY CARCINOMA - FOLLICULAR (>= 99% FOLLICULAR PATTERNED) | 73 | |
| THYROID PAPILLARY CARCINOMA - TALL CELL (>= 50% TALL CELL FEATURES) | 29 | |
| Significant markers | N = 5588 |
Table S6. Get Full Table List of top 10 genes differentially expressed by 'HISTOLOGICAL.TYPE'
| ANOVA_P | Q | |
|---|---|---|
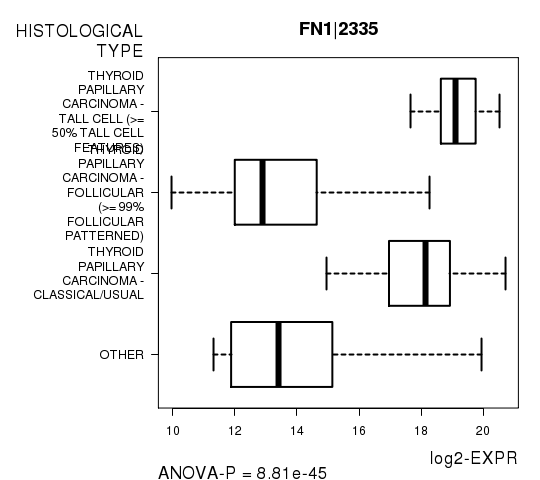
| FN1|2335 | 8.806e-45 | 1.59e-40 |
| KCNN4|3783 | 3.793e-42 | 6.84e-38 |
| FAM176A|84141 | 3.78e-41 | 6.81e-37 |
| GABRB2|2561 | 2.18e-39 | 3.93e-35 |
| LDLR|3949 | 2.345e-39 | 4.23e-35 |
| SYT12|91683 | 4.302e-39 | 7.75e-35 |
| PTPRE|5791 | 2.093e-38 | 3.77e-34 |
| SFTPB|6439 | 3.396e-38 | 6.12e-34 |
| CREB5|9586 | 8.93e-38 | 1.61e-33 |
| FLJ42709|441094 | 1.603e-37 | 2.89e-33 |
Figure S3. Get High-res Image As an example, this figure shows the association of FN1|2335 to 'HISTOLOGICAL.TYPE'. P value = 8.81e-45 with ANOVA analysis.
35 genes related to 'RADIATIONS.RADIATION.REGIMENINDICATION'.
Table S7. Basic characteristics of clinical feature: 'RADIATIONS.RADIATION.REGIMENINDICATION'
| RADIATIONS.RADIATION.REGIMENINDICATION | Labels | N |
| NO | 12 | |
| YES | 277 | |
| Significant markers | N = 35 | |
| Higher in YES | 19 | |
| Higher in NO | 16 |
Table S8. Get Full Table List of top 10 genes differentially expressed by 'RADIATIONS.RADIATION.REGIMENINDICATION'
| T(pos if higher in 'YES') | ttestP | Q | AUC | |
|---|---|---|---|---|
| FLJ37543|285668 | 12.79 | 9.988e-15 | 1.79e-10 | 0.8746 |
| C14ORF180|400258 | 10.81 | 2.442e-14 | 4.38e-10 | 0.8603 |
| TAS2R43|259289 | 8.52 | 1.842e-10 | 3.31e-06 | 0.7764 |
| A2ML1|144568 | 9.45 | 4.812e-10 | 8.64e-06 | 0.8071 |
| HPR|3250 | 8.79 | 2.191e-09 | 3.93e-05 | 0.9126 |
| HCFC1|3054 | -10.85 | 3.456e-09 | 6.2e-05 | 0.9116 |
| LOC440173|440173 | 7.93 | 1.251e-08 | 0.000224 | 0.8759 |
| ARHGEF18|23370 | -7.98 | 5.333e-08 | 0.000957 | 0.8069 |
| TMEM218|219854 | 8.7 | 1.015e-07 | 0.00182 | 0.8565 |
| C5ORF60|285679 | 6.89 | 1.06e-07 | 0.0019 | 0.778 |
Figure S4. Get High-res Image As an example, this figure shows the association of FLJ37543|285668 to 'RADIATIONS.RADIATION.REGIMENINDICATION'. P value = 9.99e-15 with T-test analysis.
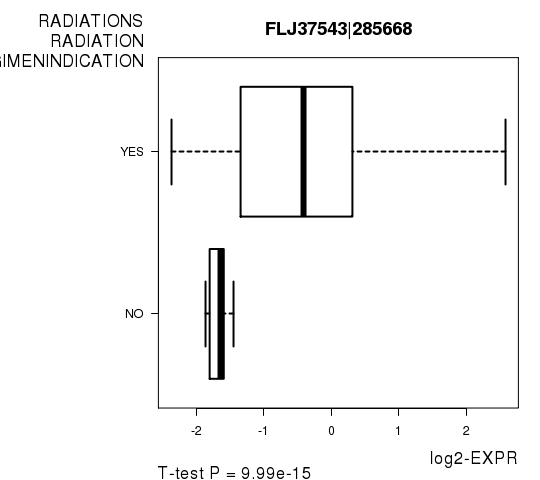
Table S9. Basic characteristics of clinical feature: 'RADIATIONEXPOSURE'
| RADIATIONEXPOSURE | Labels | N |
| NO | 241 | |
| YES | 12 | |
| Significant markers | N = 14 | |
| Higher in YES | 2 | |
| Higher in NO | 12 |
Table S10. Get Full Table List of top 10 genes differentially expressed by 'RADIATIONEXPOSURE'
| T(pos if higher in 'YES') | ttestP | Q | AUC | |
|---|---|---|---|---|
| CRNN|49860 | -10.61 | 2.115e-17 | 3.8e-13 | 0.913 |
| C13ORF30|144809 | -9.35 | 7.017e-15 | 1.26e-10 | 0.8462 |
| FAM138F|641702 | -8.95 | 6.565e-14 | 1.18e-09 | 0.8222 |
| P2RX2|22953 | -8.37 | 1.984e-12 | 3.56e-08 | 0.8904 |
| RPRML|388394 | -7.52 | 8.537e-11 | 1.53e-06 | 0.8049 |
| SLCO1A2|6579 | -7.89 | 1.038e-10 | 1.87e-06 | 0.8109 |
| OR9A4|130075 | -7.76 | 2.856e-10 | 5.13e-06 | 0.8294 |
| CSNK1A1P|161635 | -7.07 | 9.747e-10 | 1.75e-05 | 0.8214 |
| SLC12A1|6557 | -8.27 | 4.863e-09 | 8.73e-05 | 0.8333 |
| CYORF15A|246126 | 5.84 | 9.261e-08 | 0.00166 | 0.6265 |
Figure S5. Get High-res Image As an example, this figure shows the association of CRNN|49860 to 'RADIATIONEXPOSURE'. P value = 2.12e-17 with T-test analysis.
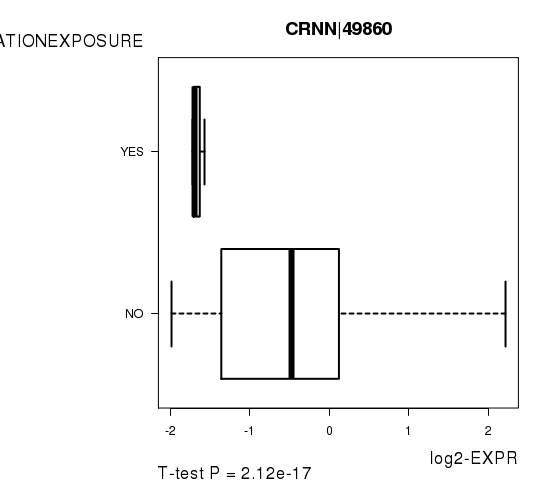
Table S11. Basic characteristics of clinical feature: 'DISTANT.METASTASIS'
| DISTANT.METASTASIS | Labels | N |
| M0 | 140 | |
| M1 | 4 | |
| MX | 144 | |
| Significant markers | N = 23 |
Table S12. Get Full Table List of top 10 genes differentially expressed by 'DISTANT.METASTASIS'
| ANOVA_P | Q | |
|---|---|---|
| ARRB1|408 | 2.201e-09 | 3.97e-05 |
| RTN4RL1|146760 | 1.013e-08 | 0.000183 |
| GJA5|2702 | 3.016e-08 | 0.000544 |
| APOL3|80833 | 4.137e-08 | 0.000746 |
| CYP21A2|1589 | 6.53e-08 | 0.00118 |
| PTPRR|5801 | 1.401e-07 | 0.00252 |
| DPEP2|64174 | 1.644e-07 | 0.00296 |
| GPATCH4|54865 | 1.862e-07 | 0.00336 |
| SEMA3G|56920 | 1.871e-07 | 0.00337 |
| KIAA1383|54627 | 2.402e-07 | 0.00433 |
Figure S6. Get High-res Image As an example, this figure shows the association of ARRB1|408 to 'DISTANT.METASTASIS'. P value = 2.2e-09 with ANOVA analysis.
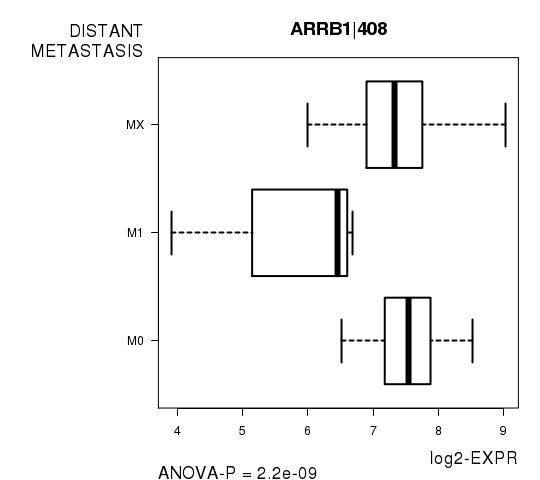
Table S13. Basic characteristics of clinical feature: 'EXTRATHYROIDAL.EXTENSION'
| EXTRATHYROIDAL.EXTENSION | Labels | N |
| MINIMAL (T3) | 67 | |
| MODERATE/ADVANCED (T4A) | 5 | |
| NONE | 203 | |
| Significant markers | N = 120 |
Table S14. Get Full Table List of top 10 genes differentially expressed by 'EXTRATHYROIDAL.EXTENSION'
| ANOVA_P | Q | |
|---|---|---|
| PLRG1|5356 | 1.542e-09 | 2.78e-05 |
| FOXJ1|2302 | 3.47e-09 | 6.25e-05 |
| CYP26A1|1592 | 3.724e-09 | 6.71e-05 |
| TSPYL5|85453 | 4.884e-09 | 8.8e-05 |
| VEGFA|7422 | 5.924e-09 | 0.000107 |
| FLJ42875|440556 | 8.633e-09 | 0.000156 |
| PRDM16|63976 | 9.442e-09 | 0.00017 |
| CETP|1071 | 1.197e-08 | 0.000216 |
| FZD9|8326 | 1.584e-08 | 0.000285 |
| BEGAIN|57596 | 2.065e-08 | 0.000372 |
Figure S7. Get High-res Image As an example, this figure shows the association of PLRG1|5356 to 'EXTRATHYROIDAL.EXTENSION'. P value = 1.54e-09 with ANOVA analysis.
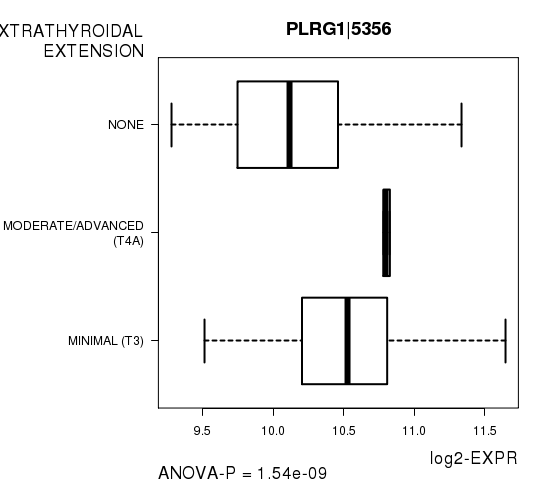
Table S15. Basic characteristics of clinical feature: 'LYMPH.NODE.METASTASIS'
| LYMPH.NODE.METASTASIS | Labels | N |
| N0 | 145 | |
| N1 | 16 | |
| N1A | 58 | |
| N1B | 42 | |
| NX | 28 | |
| Significant markers | N = 638 |
Table S16. Get Full Table List of top 10 genes differentially expressed by 'LYMPH.NODE.METASTASIS'
| ANOVA_P | Q | |
|---|---|---|
| KCNN4|3783 | 1.685e-12 | 3.04e-08 |
| CREB5|9586 | 2.64e-11 | 4.76e-07 |
| TACSTD2|4070 | 5.856e-11 | 1.06e-06 |
| CLCNKA|1187 | 6.52e-11 | 1.18e-06 |
| FN1|2335 | 1.694e-10 | 3.05e-06 |
| SYT12|91683 | 1.793e-10 | 3.23e-06 |
| ICAM1|3383 | 2.06e-10 | 3.71e-06 |
| CCDC109B|55013 | 2.658e-10 | 4.79e-06 |
| TMEM117|84216 | 2.907e-10 | 5.24e-06 |
| PROS1|5627 | 2.99e-10 | 5.39e-06 |
Figure S8. Get High-res Image As an example, this figure shows the association of KCNN4|3783 to 'LYMPH.NODE.METASTASIS'. P value = 1.68e-12 with ANOVA analysis.
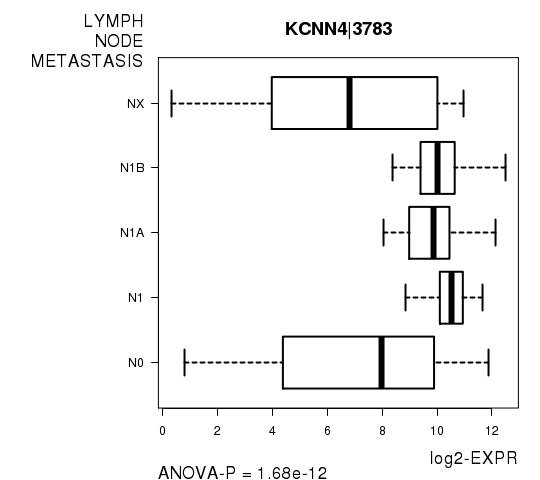
Table S17. Basic characteristics of clinical feature: 'COMPLETENESS.OF.RESECTION'
| COMPLETENESS.OF.RESECTION | Labels | N |
| R0 | 229 | |
| R1 | 18 | |
| R2 | 1 | |
| RX | 20 | |
| Significant markers | N = 3 |
Table S18. Get Full Table List of 3 genes differentially expressed by 'COMPLETENESS.OF.RESECTION'
| ANOVA_P | Q | |
|---|---|---|
| CATSPER2P1|440278 | 1.217e-14 | 2.19e-10 |
| MUC13|56667 | 8.566e-07 | 0.0154 |
| TRIM72|493829 | 9.543e-07 | 0.0172 |
Figure S9. Get High-res Image As an example, this figure shows the association of CATSPER2P1|440278 to 'COMPLETENESS.OF.RESECTION'. P value = 1.22e-14 with ANOVA analysis.
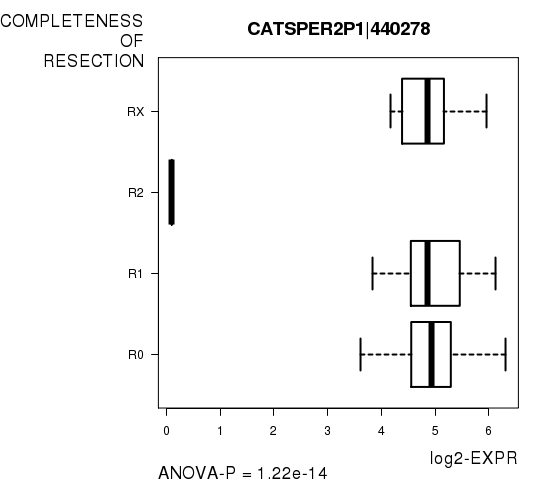
Table S19. Basic characteristics of clinical feature: 'NUMBER.OF.LYMPH.NODES'
| NUMBER.OF.LYMPH.NODES | Mean (SD) | 2.8 (5.2) |
| Significant markers | N = 539 | |
| pos. correlated | 250 | |
| neg. correlated | 289 |
Table S20. Get Full Table List of top 10 genes significantly correlated to 'NUMBER.OF.LYMPH.NODES' by Spearman correlation test
| SpearmanCorr | corrP | Q | |
|---|---|---|---|
| PCDP1|200373 | -0.4511 | 7.018e-13 | 1.26e-08 |
| FAM60A|58516 | 0.4503 | 7.797e-13 | 1.41e-08 |
| SPATS2L|26010 | 0.421 | 2.975e-11 | 5.36e-07 |
| DIO2|1734 | -0.4139 | 6.872e-11 | 1.24e-06 |
| TMEM117|84216 | 0.4121 | 8.403e-11 | 1.51e-06 |
| CBFB|865 | 0.4096 | 1.12e-10 | 2.02e-06 |
| EMP2|2013 | 0.4078 | 1.381e-10 | 2.49e-06 |
| SLC26A4|5172 | -0.4055 | 1.774e-10 | 3.2e-06 |
| SNX11|29916 | -0.4053 | 1.83e-10 | 3.3e-06 |
| CLCNKA|1187 | -0.4046 | 1.972e-10 | 3.55e-06 |
Figure S10. Get High-res Image As an example, this figure shows the association of PCDP1|200373 to 'NUMBER.OF.LYMPH.NODES'. P value = 7.02e-13 with Spearman correlation analysis. The straight line presents the best linear regression.
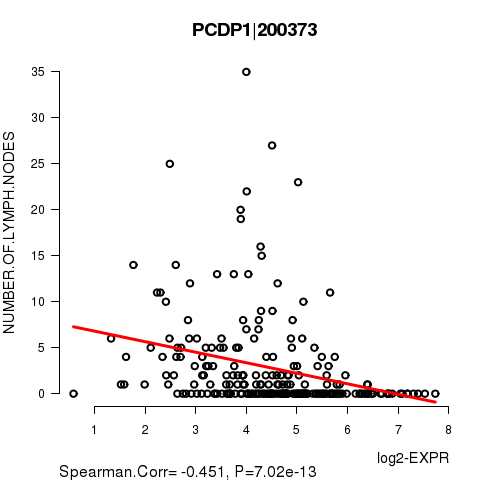
Table S21. Basic characteristics of clinical feature: 'NEOPLASM.DISEASESTAGE'
| NEOPLASM.DISEASESTAGE | Labels | N |
| STAGE I | 163 | |
| STAGE II | 34 | |
| STAGE III | 62 | |
| STAGE IVA | 26 | |
| STAGE IVC | 3 | |
| Significant markers | N = 133 |
Table S22. Get Full Table List of top 10 genes differentially expressed by 'NEOPLASM.DISEASESTAGE'
| ANOVA_P | Q | |
|---|---|---|
| CYP26A1|1592 | 5.349e-12 | 9.64e-08 |
| SEMA3G|56920 | 4.884e-10 | 8.8e-06 |
| GOT2|2806 | 1.018e-09 | 1.84e-05 |
| KIAA1383|54627 | 1.443e-09 | 2.6e-05 |
| AIFM1|9131 | 3.508e-09 | 6.32e-05 |
| ALDOA|226 | 5.267e-09 | 9.49e-05 |
| GJA5|2702 | 6.471e-09 | 0.000117 |
| CS|1431 | 1.012e-08 | 0.000182 |
| MKKS|8195 | 1.211e-08 | 0.000218 |
| C14ORF126|112487 | 2.166e-08 | 0.00039 |
Figure S11. Get High-res Image As an example, this figure shows the association of CYP26A1|1592 to 'NEOPLASM.DISEASESTAGE'. P value = 5.35e-12 with ANOVA analysis.
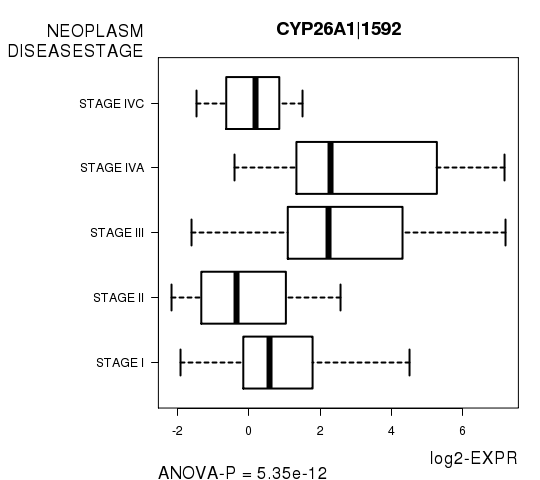
Table S23. Basic characteristics of clinical feature: 'MULTIFOCALITY'
| MULTIFOCALITY | Labels | N |
| MULTIFOCAL | 143 | |
| UNIFOCAL | 137 | |
| Significant markers | N = 2 | |
| Higher in UNIFOCAL | 0 | |
| Higher in MULTIFOCAL | 2 |
Table S24. Get Full Table List of 2 genes differentially expressed by 'MULTIFOCALITY'
| T(pos if higher in 'UNIFOCAL') | ttestP | Q | AUC | |
|---|---|---|---|---|
| INMT|11185 | -5.21 | 3.679e-07 | 0.00663 | 0.6661 |
| ETS1|2113 | -5.01 | 9.834e-07 | 0.0177 | 0.6585 |
Figure S12. Get High-res Image As an example, this figure shows the association of INMT|11185 to 'MULTIFOCALITY'. P value = 3.68e-07 with T-test analysis.
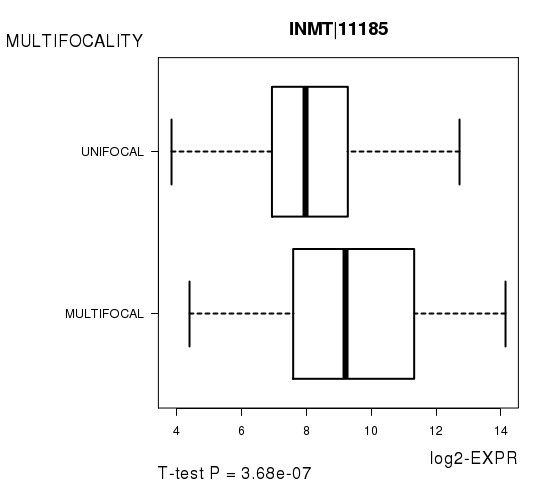
Table S25. Basic characteristics of clinical feature: 'TUMOR.SIZE'
| TUMOR.SIZE | Mean (SD) | 2.65 (1.5) |
| Significant markers | N = 14 | |
| pos. correlated | 2 | |
| neg. correlated | 12 |
Table S26. Get Full Table List of top 10 genes significantly correlated to 'TUMOR.SIZE' by Spearman correlation test
| SpearmanCorr | corrP | Q | |
|---|---|---|---|
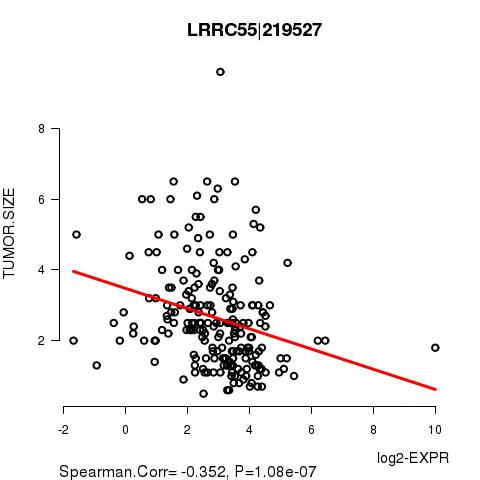
| LRRC55|219527 | -0.3519 | 1.084e-07 | 0.00195 |
| ABCA6|23460 | -0.3446 | 1.915e-07 | 0.00345 |
| CLDN2|9075 | -0.339 | 3.517e-07 | 0.00634 |
| LSM12|124801 | 0.3325 | 5.338e-07 | 0.00962 |
| PTGS1|5742 | -0.3284 | 7.525e-07 | 0.0136 |
| COL10A1|1300 | -0.3288 | 7.738e-07 | 0.0139 |
| PI16|221476 | -0.3296 | 9.175e-07 | 0.0165 |
| CD1E|913 | -0.3264 | 1.415e-06 | 0.0255 |
| AHCY|191 | 0.3205 | 1.42e-06 | 0.0256 |
| DPT|1805 | -0.3242 | 1.585e-06 | 0.0285 |
Figure S13. Get High-res Image As an example, this figure shows the association of LRRC55|219527 to 'TUMOR.SIZE'. P value = 1.08e-07 with Spearman correlation analysis. The straight line presents the best linear regression.
-
Expresson data file = THCA-TP.uncv2.mRNAseq_RSEM_normalized_log2.txt
-
Clinical data file = THCA-TP.clin.merged.picked.txt
-
Number of patients = 289
-
Number of genes = 18025
-
Number of clinical features = 13
For continuous numerical clinical features, Spearman's rank correlation coefficients (Spearman 1904) and two-tailed P values were estimated using 'cor.test' function in R
For two-class clinical features, two-tailed Student's t test with unequal variance (Lehmann and Romano 2005) was applied to compare the log2-expression levels between the two clinical classes using 't.test' function in R
For multi-class clinical features (ordinal or nominal), one-way analysis of variance (Howell 2002) was applied to compare the log2-expression levels between different clinical classes using 'anova' function in R
For multiple hypothesis correction, Q value is the False Discovery Rate (FDR) analogue of the P value (Benjamini and Hochberg 1995), defined as the minimum FDR at which the test may be called significant. We used the 'Benjamini and Hochberg' method of 'p.adjust' function in R to convert P values into Q values.
This is an experimental feature. The full results of the analysis summarized in this report can be downloaded from the TCGA Data Coordination Center.