This pipeline computes the correlation between significantly recurrent gene mutations and selected clinical features.
Testing the association between mutation status of 91 genes and 9 clinical features across 772 patients, 16 significant findings detected with Q value < 0.25.
-
PIK3R1 mutation correlated to 'LYMPH.NODE.METASTASIS'.
-
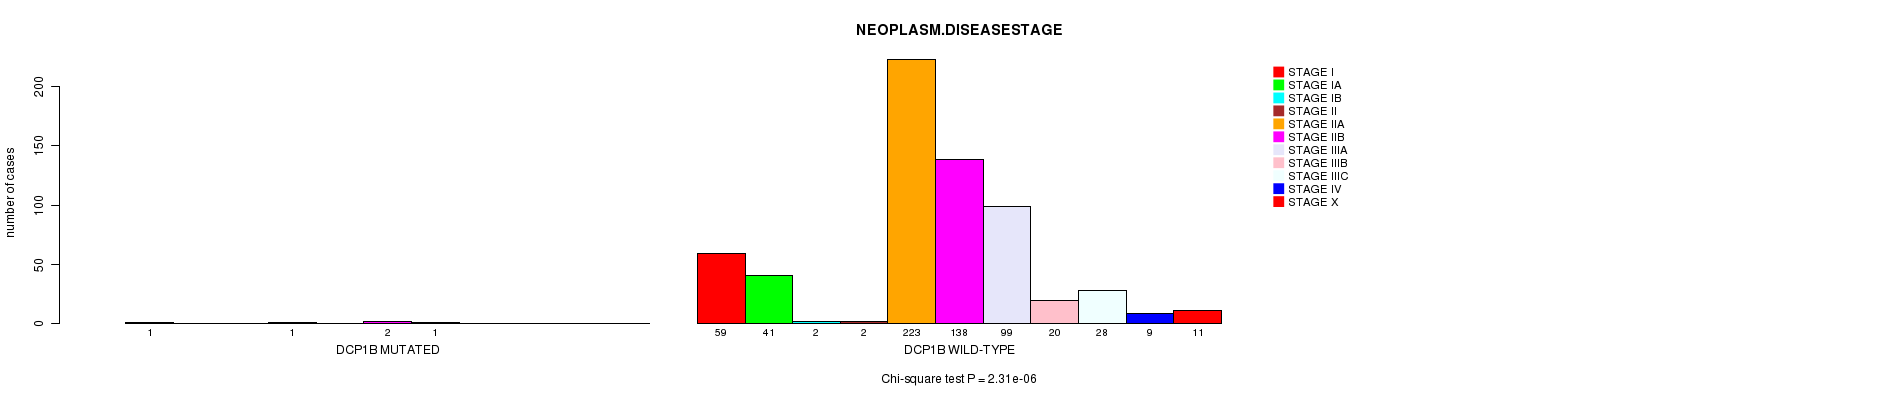
DCP1B mutation correlated to 'NEOPLASM.DISEASESTAGE'.
-
GATA3 mutation correlated to 'AGE'.
-
ZNF384 mutation correlated to 'NUMBER.OF.LYMPH.NODES'.
-
MAP3K1 mutation correlated to 'NUMBER.OF.LYMPH.NODES'.
-
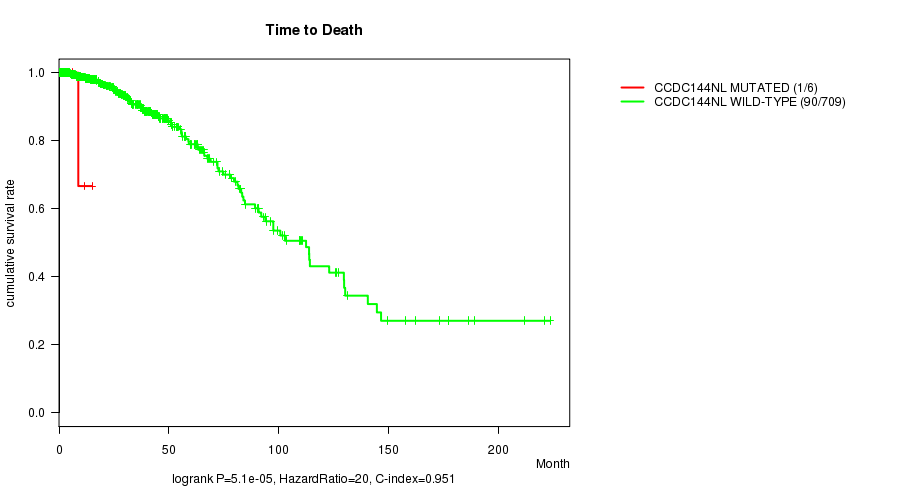
CCDC144NL mutation correlated to 'Time to Death'.
-
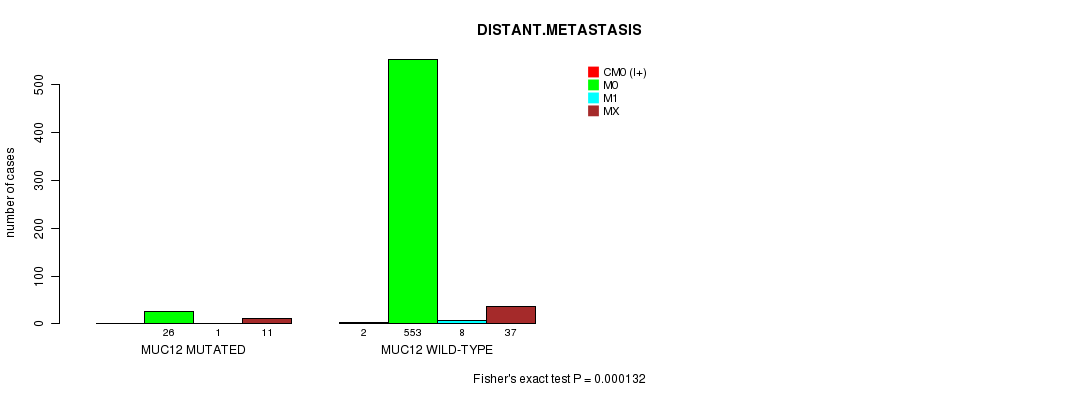
MUC12 mutation correlated to 'DISTANT.METASTASIS'.
-
CTU2 mutation correlated to 'NEOPLASM.DISEASESTAGE'.
-
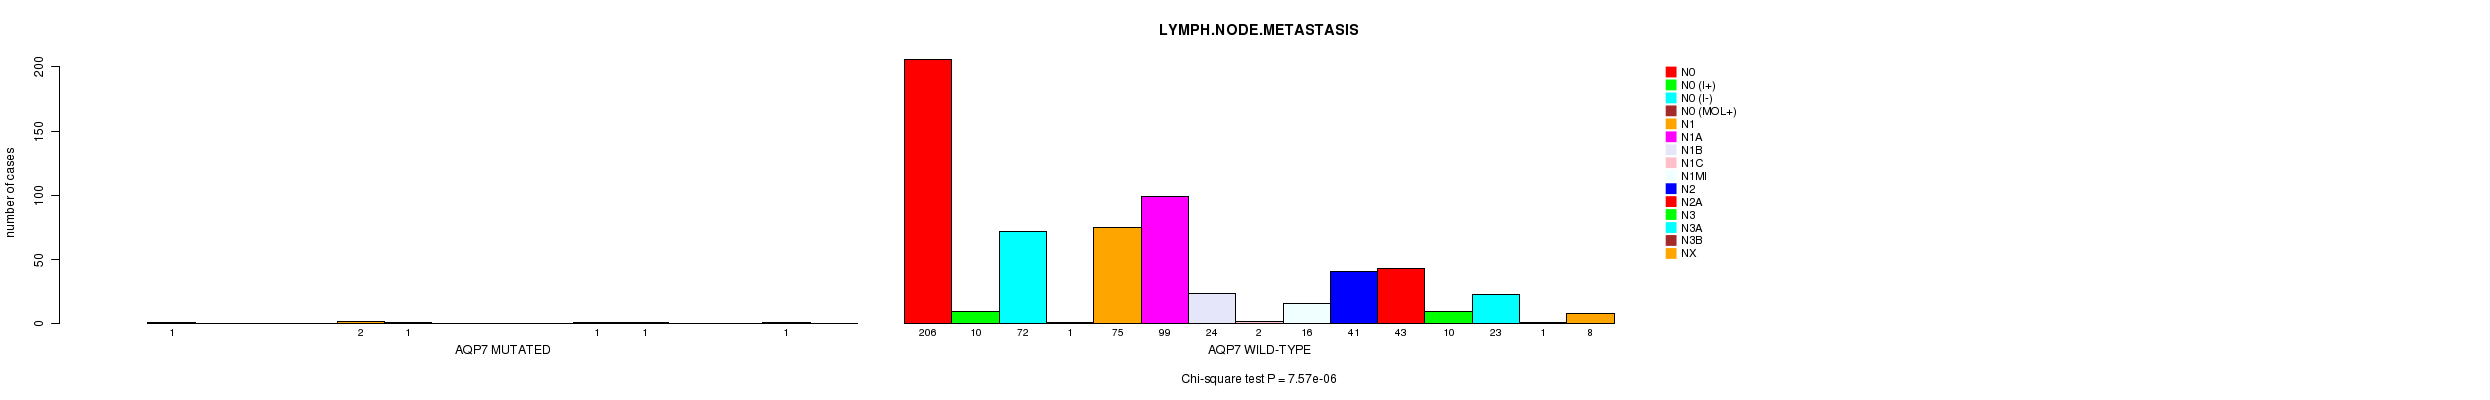
AQP7 mutation correlated to 'LYMPH.NODE.METASTASIS'.
-
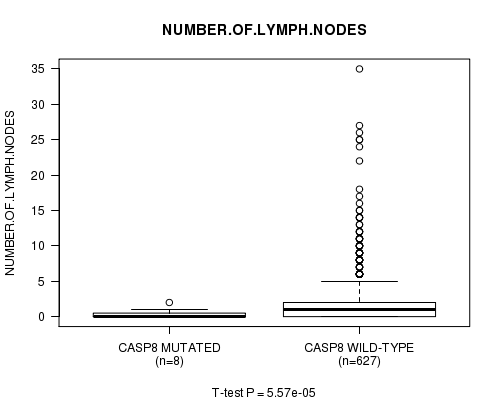
CASP8 mutation correlated to 'NUMBER.OF.LYMPH.NODES'.
-
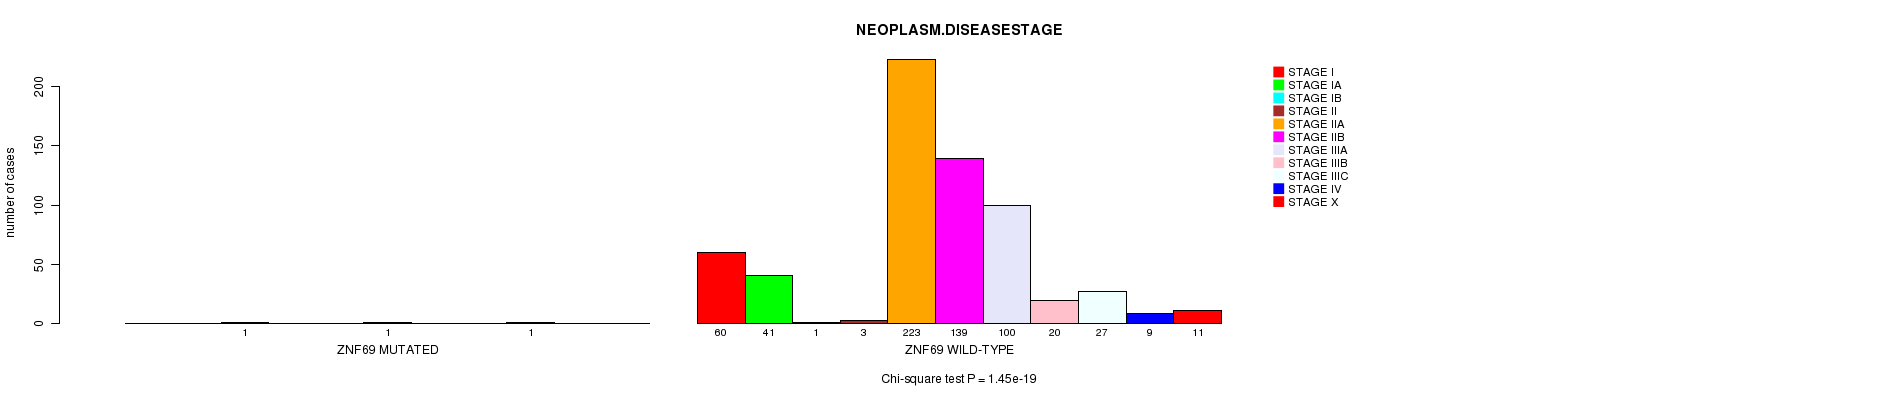
ZNF69 mutation correlated to 'NEOPLASM.DISEASESTAGE'.
-
HLA-DRB1 mutation correlated to 'LYMPH.NODE.METASTASIS'.
-
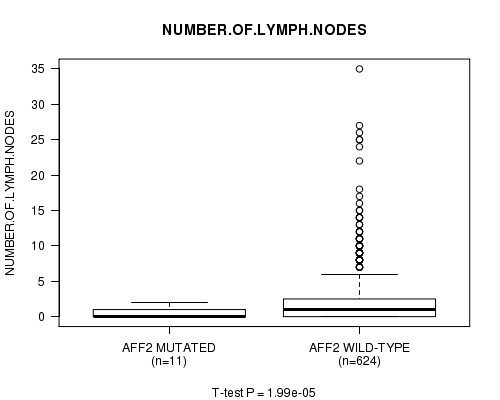
AFF2 mutation correlated to 'NUMBER.OF.LYMPH.NODES'.
-
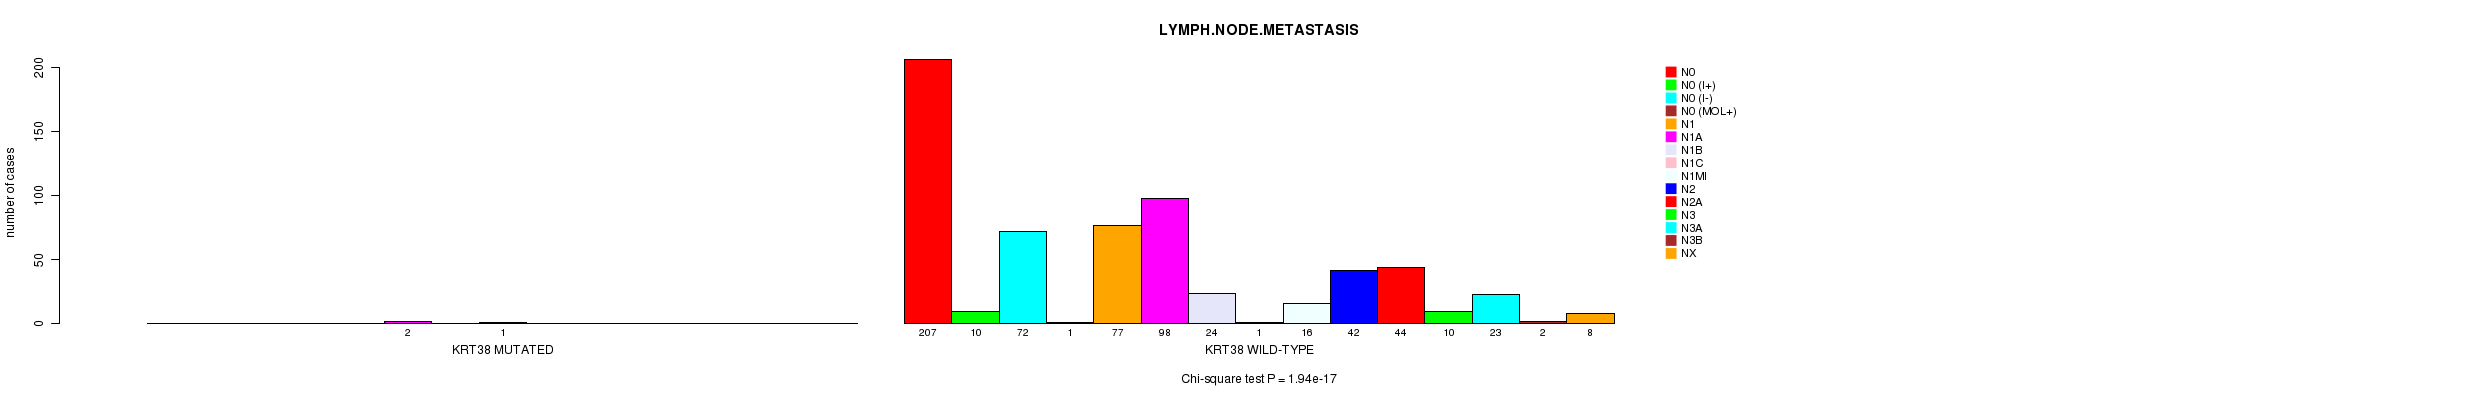
KRT38 mutation correlated to 'LYMPH.NODE.METASTASIS'.
-
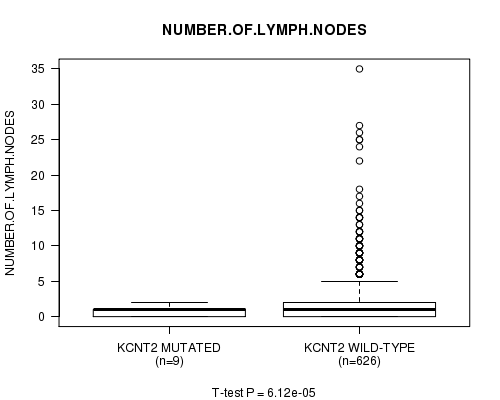
KCNT2 mutation correlated to 'NUMBER.OF.LYMPH.NODES'.
-
VSTM2B mutation correlated to 'NUMBER.OF.LYMPH.NODES'.
Table 1. Get Full Table Overview of the association between mutation status of 91 genes and 9 clinical features. Shown in the table are P values (Q values). Thresholded by Q value < 0.25, 16 significant findings detected.
|
Clinical Features |
Time to Death |
AGE | GENDER |
RADIATIONS RADIATION REGIMENINDICATION |
DISTANT METASTASIS |
LYMPH NODE METASTASIS |
NUMBER OF LYMPH NODES |
TUMOR STAGECODE |
NEOPLASM DISEASESTAGE |
||
| nMutated (%) | nWild-Type | logrank test | t-test | Fisher's exact test | Fisher's exact test | Fisher's exact test | Chi-square test | t-test | t-test | Chi-square test | |
| PIK3R1 | 21 (3%) | 751 |
0.173 (1.00) |
0.688 (1.00) |
1 (1.00) |
0.801 (1.00) |
1 (1.00) |
7.27e-06 (0.00517) |
0.0805 (1.00) |
0.223 (1.00) |
|
| DCP1B | 5 (1%) | 767 |
0.55 (1.00) |
0.025 (1.00) |
1 (1.00) |
0.335 (1.00) |
0.385 (1.00) |
0.176 (1.00) |
0.44 (1.00) |
2.31e-06 (0.00164) |
|
| GATA3 | 81 (10%) | 691 |
0.74 (1.00) |
0.000213 (0.149) |
0.59 (1.00) |
0.139 (1.00) |
0.0673 (1.00) |
0.41 (1.00) |
0.598 (1.00) |
0.635 (1.00) |
|
| ZNF384 | 14 (2%) | 758 |
0.408 (1.00) |
0.0126 (1.00) |
1 (1.00) |
1 (1.00) |
0.446 (1.00) |
0.969 (1.00) |
1.16e-05 (0.00824) |
0.318 (1.00) |
|
| MAP3K1 | 57 (7%) | 715 |
0.781 (1.00) |
0.00186 (1.00) |
1 (1.00) |
0.753 (1.00) |
0.411 (1.00) |
0.101 (1.00) |
7.24e-07 (0.000516) |
0.539 (1.00) |
|
| CCDC144NL | 8 (1%) | 764 |
5.1e-05 (0.0361) |
0.051 (1.00) |
1 (1.00) |
0.121 (1.00) |
1 (1.00) |
0.472 (1.00) |
0.296 (1.00) |
0.391 (1.00) |
|
| MUC12 | 44 (6%) | 728 |
0.00337 (1.00) |
0.375 (1.00) |
1 (1.00) |
1 (1.00) |
0.000132 (0.0926) |
0.053 (1.00) |
0.0562 (1.00) |
0.159 (1.00) |
|
| CTU2 | 5 (1%) | 767 |
0.556 (1.00) |
0.567 (1.00) |
1 (1.00) |
0.335 (1.00) |
1 (1.00) |
0.962 (1.00) |
0.058 (1.00) |
1.18e-08 (8.42e-06) |
|
| AQP7 | 8 (1%) | 764 |
0.0122 (1.00) |
0.662 (1.00) |
1 (1.00) |
0.215 (1.00) |
1 (1.00) |
7.57e-06 (0.00537) |
0.196 (1.00) |
0.435 (1.00) |
|
| CASP8 | 10 (1%) | 762 |
0.931 (1.00) |
0.58 (1.00) |
1 (1.00) |
0.467 (1.00) |
0.542 (1.00) |
0.883 (1.00) |
5.57e-05 (0.0393) |
0.877 (1.00) |
|
| ZNF69 | 5 (1%) | 767 |
0.156 (1.00) |
0.6 (1.00) |
1 (1.00) |
0.335 (1.00) |
1 (1.00) |
0.656 (1.00) |
0.56 (1.00) |
1.45e-19 (1.04e-16) |
|
| HLA-DRB1 | 8 (1%) | 764 |
0.568 (1.00) |
0.00708 (1.00) |
1 (1.00) |
0.687 (1.00) |
0.198 (1.00) |
3.34e-08 (2.38e-05) |
0.695 (1.00) |
0.496 (1.00) |
|
| AFF2 | 15 (2%) | 757 |
0.762 (1.00) |
0.0374 (1.00) |
1 (1.00) |
0.552 (1.00) |
1 (1.00) |
0.967 (1.00) |
1.99e-05 (0.0141) |
0.794 (1.00) |
|
| KRT38 | 4 (1%) | 768 |
0.5 (1.00) |
0.242 (1.00) |
1 (1.00) |
0.275 (1.00) |
1 (1.00) |
1.94e-17 (1.39e-14) |
0.0539 (1.00) |
0.876 (1.00) |
|
| KCNT2 | 11 (1%) | 761 |
0.787 (1.00) |
0.549 (1.00) |
1 (1.00) |
0.305 (1.00) |
0.0885 (1.00) |
0.885 (1.00) |
6.12e-05 (0.0432) |
0.00869 (1.00) |
|
| VSTM2B | 3 (0%) | 769 |
0.5 (1.00) |
0.338 (1.00) |
1 (1.00) |
1 (1.00) |
1.55e-36 (1.11e-33) |
||||
| DSPP | 26 (3%) | 746 |
0.868 (1.00) |
0.166 (1.00) |
1 (1.00) |
1 (1.00) |
1 (1.00) |
0.348 (1.00) |
0.375 (1.00) |
0.946 (1.00) |
|
| AKT1 | 19 (2%) | 753 |
0.196 (1.00) |
0.132 (1.00) |
1 (1.00) |
0.183 (1.00) |
0.75 (1.00) |
0.0969 (1.00) |
0.902 (1.00) |
0.286 (1.00) |
|
| AOAH | 19 (2%) | 753 |
0.283 (1.00) |
0.427 (1.00) |
1 (1.00) |
0.0353 (1.00) |
0.408 (1.00) |
0.945 (1.00) |
0.282 (1.00) |
0.187 (1.00) |
|
| MAP3K4 | 18 (2%) | 754 |
0.988 (1.00) |
0.544 (1.00) |
1 (1.00) |
0.585 (1.00) |
0.0089 (1.00) |
0.857 (1.00) |
0.912 (1.00) |
0.708 (1.00) |
|
| MEF2A | 14 (2%) | 758 |
0.788 (1.00) |
0.523 (1.00) |
1 (1.00) |
0.537 (1.00) |
0.699 (1.00) |
0.497 (1.00) |
0.0142 (1.00) |
0.321 (1.00) |
|
| NCOA3 | 29 (4%) | 743 |
0.464 (1.00) |
0.878 (1.00) |
1 (1.00) |
0.667 (1.00) |
0.27 (1.00) |
0.148 (1.00) |
0.177 (1.00) |
0.473 (1.00) |
|
| NCOR2 | 29 (4%) | 743 |
0.815 (1.00) |
0.706 (1.00) |
1 (1.00) |
1 (1.00) |
0.647 (1.00) |
0.89 (1.00) |
0.218 (1.00) |
0.902 (1.00) |
|
| NR1H2 | 18 (2%) | 754 |
0.556 (1.00) |
0.712 (1.00) |
1 (1.00) |
1 (1.00) |
0.00449 (1.00) |
0.605 (1.00) |
0.954 (1.00) |
0.0184 (1.00) |
|
| PIK3CA | 261 (34%) | 511 |
0.922 (1.00) |
0.0242 (1.00) |
1 (1.00) |
0.862 (1.00) |
0.362 (1.00) |
0.539 (1.00) |
0.339 (1.00) |
0.814 (1.00) |
|
| RBMX | 13 (2%) | 759 |
0.649 (1.00) |
0.875 (1.00) |
1 (1.00) |
0.337 (1.00) |
0.687 (1.00) |
0.886 (1.00) |
0.241 (1.00) |
0.946 (1.00) |
|
| TP53 | 257 (33%) | 515 |
0.454 (1.00) |
0.0372 (1.00) |
0.0575 (1.00) |
0.432 (1.00) |
0.194 (1.00) |
0.411 (1.00) |
0.414 (1.00) |
0.949 (1.00) |
|
| TPRX1 | 7 (1%) | 765 |
0.695 (1.00) |
0.123 (1.00) |
1 (1.00) |
1 (1.00) |
0.443 (1.00) |
0.634 (1.00) |
0.205 (1.00) |
0.769 (1.00) |
|
| RUNX1 | 25 (3%) | 747 |
0.449 (1.00) |
0.606 (1.00) |
1 (1.00) |
0.353 (1.00) |
1 (1.00) |
0.961 (1.00) |
0.532 (1.00) |
0.0785 (1.00) |
|
| PTEN | 29 (4%) | 743 |
0.889 (1.00) |
0.46 (1.00) |
1 (1.00) |
0.83 (1.00) |
0.293 (1.00) |
0.548 (1.00) |
0.221 (1.00) |
0.0193 (1.00) |
|
| TBX3 | 18 (2%) | 754 |
0.185 (1.00) |
0.0155 (1.00) |
1 (1.00) |
1 (1.00) |
0.478 (1.00) |
0.996 (1.00) |
0.472 (1.00) |
0.985 (1.00) |
|
| CBFB | 16 (2%) | 756 |
0.968 (1.00) |
0.727 (1.00) |
1 (1.00) |
1 (1.00) |
0.166 (1.00) |
0.273 (1.00) |
0.821 (1.00) |
0.792 (1.00) |
|
| MAP2K4 | 32 (4%) | 740 |
0.181 (1.00) |
0.384 (1.00) |
1 (1.00) |
0.685 (1.00) |
1 (1.00) |
0.353 (1.00) |
0.911 (1.00) |
0.975 (1.00) |
|
| CDH1 | 55 (7%) | 717 |
0.419 (1.00) |
0.0873 (1.00) |
1 (1.00) |
1 (1.00) |
0.798 (1.00) |
0.036 (1.00) |
0.129 (1.00) |
0.103 (1.00) |
|
| FOXA1 | 15 (2%) | 757 |
0.0778 (1.00) |
0.0025 (1.00) |
1 (1.00) |
0.377 (1.00) |
0.413 (1.00) |
0.876 (1.00) |
0.833 (1.00) |
0.0275 (1.00) |
|
| MLL3 | 56 (7%) | 716 |
0.524 (1.00) |
0.012 (1.00) |
1 (1.00) |
0.752 (1.00) |
0.492 (1.00) |
0.662 (1.00) |
0.918 (1.00) |
0.796 (1.00) |
|
| ATN1 | 17 (2%) | 755 |
0.293 (1.00) |
0.957 (1.00) |
1 (1.00) |
0.264 (1.00) |
0.166 (1.00) |
0.946 (1.00) |
0.609 (1.00) |
0.943 (1.00) |
|
| SF3B1 | 14 (2%) | 758 |
0.291 (1.00) |
0.738 (1.00) |
1 (1.00) |
0.369 (1.00) |
1 (1.00) |
0.87 (1.00) |
0.778 (1.00) |
0.737 (1.00) |
|
| KRTAP4-7 | 7 (1%) | 765 |
0.598 (1.00) |
0.484 (1.00) |
1 (1.00) |
1 (1.00) |
0.495 (1.00) |
0.534 (1.00) |
0.458 (1.00) |
0.0459 (1.00) |
|
| ZFP36L1 | 10 (1%) | 762 |
0.981 (1.00) |
0.0124 (1.00) |
1 (1.00) |
0.0719 (1.00) |
1 (1.00) |
0.972 (1.00) |
0.41 (1.00) |
0.786 (1.00) |
|
| NCOR1 | 31 (4%) | 741 |
0.878 (1.00) |
0.937 (1.00) |
1 (1.00) |
1 (1.00) |
0.184 (1.00) |
0.788 (1.00) |
0.462 (1.00) |
0.831 (1.00) |
|
| KRAS | 6 (1%) | 766 |
0.639 (1.00) |
0.0718 (1.00) |
1 (1.00) |
0.347 (1.00) |
1 (1.00) |
0.944 (1.00) |
0.308 (1.00) |
0.761 (1.00) |
|
| PHLDA1 | 9 (1%) | 763 |
0.789 (1.00) |
0.75 (1.00) |
1 (1.00) |
0.46 (1.00) |
1 (1.00) |
0.372 (1.00) |
0.000817 (0.573) |
0.0236 (1.00) |
|
| VEZF1 | 8 (1%) | 764 |
0.581 (1.00) |
0.0875 (1.00) |
1 (1.00) |
0.432 (1.00) |
0.542 (1.00) |
0.985 (1.00) |
0.0425 (1.00) |
0.804 (1.00) |
|
| ERBB2 | 12 (2%) | 760 |
0.139 (1.00) |
0.543 (1.00) |
0.118 (1.00) |
0.74 (1.00) |
1 (1.00) |
0.967 (1.00) |
0.522 (1.00) |
0.777 (1.00) |
|
| CTCF | 18 (2%) | 754 |
0.117 (1.00) |
0.933 (1.00) |
1 (1.00) |
1 (1.00) |
0.446 (1.00) |
0.92 (1.00) |
0.0498 (1.00) |
0.712 (1.00) |
|
| KRTAP9-9 | 6 (1%) | 766 |
0.596 (1.00) |
0.409 (1.00) |
1 (1.00) |
0.181 (1.00) |
0.443 (1.00) |
0.977 (1.00) |
0.293 (1.00) |
0.865 (1.00) |
|
| BCL6B | 8 (1%) | 764 |
0.607 (1.00) |
0.751 (1.00) |
1 (1.00) |
0.121 (1.00) |
0.0547 (1.00) |
0.809 (1.00) |
0.805 (1.00) |
0.935 (1.00) |
|
| RB1 | 14 (2%) | 758 |
0.881 (1.00) |
0.12 (1.00) |
0.137 (1.00) |
0.131 (1.00) |
0.687 (1.00) |
0.015 (1.00) |
0.459 (1.00) |
0.0169 (1.00) |
|
| HIST1H3B | 7 (1%) | 765 |
0.395 (1.00) |
0.286 (1.00) |
1 (1.00) |
0.382 (1.00) |
1 (1.00) |
0.366 (1.00) |
0.452 (1.00) |
0.364 (1.00) |
|
| MYB | 11 (1%) | 761 |
0.176 (1.00) |
0.181 (1.00) |
1 (1.00) |
0.487 (1.00) |
1 (1.00) |
0.992 (1.00) |
0.0364 (1.00) |
0.517 (1.00) |
|
| E2F4 | 4 (1%) | 768 |
0.367 (1.00) |
1 (1.00) |
0.577 (1.00) |
1 (1.00) |
0.959 (1.00) |
0.993 (1.00) |
|||
| MUC20 | 10 (1%) | 762 |
0.421 (1.00) |
0.17 (1.00) |
1 (1.00) |
0.723 (1.00) |
0.585 (1.00) |
0.495 (1.00) |
0.533 (1.00) |
0.892 (1.00) |
|
| AKD1 | 19 (2%) | 753 |
0.808 (1.00) |
0.471 (1.00) |
1 (1.00) |
0.794 (1.00) |
0.408 (1.00) |
0.395 (1.00) |
0.437 (1.00) |
0.67 (1.00) |
|
| CDKN1B | 7 (1%) | 765 |
0.848 (1.00) |
0.944 (1.00) |
1 (1.00) |
1 (1.00) |
0.0535 (1.00) |
0.0128 (1.00) |
0.0478 (1.00) |
0.0311 (1.00) |
|
| KRTAP4-5 | 4 (1%) | 768 |
0.596 (1.00) |
0.194 (1.00) |
1 (1.00) |
0.275 (1.00) |
0.322 (1.00) |
0.954 (1.00) |
0.466 (1.00) |
0.873 (1.00) |
|
| RPGR | 14 (2%) | 758 |
0.869 (1.00) |
0.457 (1.00) |
1 (1.00) |
1 (1.00) |
0.212 (1.00) |
0.964 (1.00) |
0.856 (1.00) |
0.673 (1.00) |
|
| HLA-A | 4 (1%) | 768 |
0.211 (1.00) |
0.436 (1.00) |
1 (1.00) |
0.275 (1.00) |
1 (1.00) |
0.997 (1.00) |
0.585 (1.00) |
0.912 (1.00) |
|
| FGFR2 | 7 (1%) | 765 |
0.000457 (0.321) |
0.752 (1.00) |
1 (1.00) |
0.684 (1.00) |
0.163 (1.00) |
0.737 (1.00) |
0.0471 (1.00) |
0.618 (1.00) |
|
| TBL1XR1 | 9 (1%) | 763 |
0.565 (1.00) |
0.0224 (1.00) |
1 (1.00) |
0.702 (1.00) |
0.146 (1.00) |
0.278 (1.00) |
0.454 (1.00) |
0.283 (1.00) |
|
| PRRX1 | 6 (1%) | 766 |
0.487 (1.00) |
0.901 (1.00) |
1 (1.00) |
0.181 (1.00) |
1 (1.00) |
0.769 (1.00) |
0.722 (1.00) |
0.988 (1.00) |
|
| GNRH2 | 3 (0%) | 769 |
0.91 (1.00) |
0.179 (1.00) |
1 (1.00) |
0.573 (1.00) |
0.253 (1.00) |
0.233 (1.00) |
0.434 (1.00) |
0.999 (1.00) |
|
| DENND4B | 8 (1%) | 764 |
0.546 (1.00) |
0.738 (1.00) |
1 (1.00) |
1 (1.00) |
0.542 (1.00) |
0.996 (1.00) |
0.806 (1.00) |
0.902 (1.00) |
|
| CCDC66 | 9 (1%) | 763 |
0.695 (1.00) |
0.751 (1.00) |
1 (1.00) |
0.702 (1.00) |
0.585 (1.00) |
0.636 (1.00) |
0.772 (1.00) |
0.58 (1.00) |
|
| HNF1A | 9 (1%) | 763 |
0.538 (1.00) |
0.204 (1.00) |
1 (1.00) |
0.247 (1.00) |
0.0691 (1.00) |
0.978 (1.00) |
0.636 (1.00) |
0.959 (1.00) |
|
| RAI1 | 7 (1%) | 765 |
0.679 (1.00) |
0.919 (1.00) |
1 (1.00) |
0.382 (1.00) |
1 (1.00) |
0.709 (1.00) |
0.0482 (1.00) |
0.584 (1.00) |
|
| GPS2 | 6 (1%) | 766 |
0.22 (1.00) |
0.965 (1.00) |
1 (1.00) |
0.651 (1.00) |
0.638 (1.00) |
||||
| PCMTD1 | 3 (0%) | 769 |
0.524 (1.00) |
1 (1.00) |
0.573 (1.00) |
1 (1.00) |
0.996 (1.00) |
0.0156 (1.00) |
0.912 (1.00) |
||
| SLC25A5 | 3 (0%) | 769 |
0.522 (1.00) |
1 (1.00) |
0.573 (1.00) |
0.253 (1.00) |
0.91 (1.00) |
0.932 (1.00) |
0.999 (1.00) |
||
| STXBP2 | 9 (1%) | 763 |
0.251 (1.00) |
0.0463 (1.00) |
1 (1.00) |
0.702 (1.00) |
1 (1.00) |
0.996 (1.00) |
0.935 (1.00) |
0.72 (1.00) |
|
| FAM21A | 7 (1%) | 765 |
0.785 (1.00) |
0.424 (1.00) |
1 (1.00) |
0.2 (1.00) |
1 (1.00) |
0.971 (1.00) |
0.165 (1.00) |
0.939 (1.00) |
|
| ZNF587 | 9 (1%) | 763 |
0.0994 (1.00) |
0.229 (1.00) |
1 (1.00) |
1 (1.00) |
0.234 (1.00) |
0.987 (1.00) |
0.774 (1.00) |
0.731 (1.00) |
|
| POLR2J3 | 3 (0%) | 769 |
0.889 (1.00) |
0.356 (1.00) |
1 (1.00) |
0.573 (1.00) |
1 (1.00) |
0.999 (1.00) |
0.148 (1.00) |
0.983 (1.00) |
|
| AXL | 6 (1%) | 766 |
0.438 (1.00) |
0.733 (1.00) |
1 (1.00) |
0.347 (1.00) |
0.443 (1.00) |
0.621 (1.00) |
0.447 (1.00) |
0.564 (1.00) |
|
| MUC21 | 6 (1%) | 766 |
0.413 (1.00) |
0.462 (1.00) |
1 (1.00) |
1 (1.00) |
1 (1.00) |
0.999 (1.00) |
0.00268 (1.00) |
0.429 (1.00) |
|
| MED23 | 13 (2%) | 759 |
0.426 (1.00) |
0.0131 (1.00) |
1 (1.00) |
0.109 (1.00) |
1 (1.00) |
0.835 (1.00) |
0.168 (1.00) |
0.188 (1.00) |
|
| HS6ST1 | 5 (1%) | 767 |
0.688 (1.00) |
0.685 (1.00) |
1 (1.00) |
1 (1.00) |
1 (1.00) |
0.989 (1.00) |
0.0133 (1.00) |
0.98 (1.00) |
|
| RALY | 6 (1%) | 766 |
0.728 (1.00) |
0.523 (1.00) |
1 (1.00) |
1 (1.00) |
0.163 (1.00) |
0.902 (1.00) |
0.437 (1.00) |
0.734 (1.00) |
|
| UBC | 8 (1%) | 764 |
0.216 (1.00) |
0.672 (1.00) |
1 (1.00) |
1 (1.00) |
1 (1.00) |
0.927 (1.00) |
0.844 (1.00) |
0.98 (1.00) |
|
| TLR4 | 11 (1%) | 761 |
0.41 (1.00) |
0.457 (1.00) |
1 (1.00) |
1 (1.00) |
0.585 (1.00) |
0.651 (1.00) |
0.656 (1.00) |
0.926 (1.00) |
|
| ODF1 | 5 (1%) | 767 |
0.722 (1.00) |
0.569 (1.00) |
1 (1.00) |
0.608 (1.00) |
0.0808 (1.00) |
0.731 (1.00) |
0.966 (1.00) |
0.549 (1.00) |
|
| PABPC3 | 8 (1%) | 764 |
0.302 (1.00) |
0.94 (1.00) |
0.0803 (1.00) |
1 (1.00) |
1 (1.00) |
0.993 (1.00) |
0.164 (1.00) |
0.809 (1.00) |
|
| NEK5 | 9 (1%) | 763 |
0.899 (1.00) |
0.123 (1.00) |
1 (1.00) |
0.46 (1.00) |
1 (1.00) |
0.14 (1.00) |
0.832 (1.00) |
0.0973 (1.00) |
|
| ASPHD1 | 3 (0%) | 769 |
0.0442 (1.00) |
0.782 (1.00) |
1 (1.00) |
0.573 (1.00) |
1 (1.00) |
0.827 (1.00) |
0.727 (1.00) |
0.946 (1.00) |
|
| FAM47B | 7 (1%) | 765 |
0.434 (1.00) |
0.729 (1.00) |
1 (1.00) |
0.382 (1.00) |
0.385 (1.00) |
0.3 (1.00) |
0.418 (1.00) |
0.591 (1.00) |
|
| PCDH19 | 14 (2%) | 758 |
0.517 (1.00) |
0.876 (1.00) |
1 (1.00) |
1 (1.00) |
0.153 (1.00) |
0.819 (1.00) |
0.482 (1.00) |
0.334 (1.00) |
|
| ZIC3 | 4 (1%) | 768 |
0.625 (1.00) |
0.869 (1.00) |
1 (1.00) |
0.577 (1.00) |
1 (1.00) |
0.546 (1.00) |
0.766 (1.00) |
0.999 (1.00) |
|
| FAM21C | 6 (1%) | 766 |
0.768 (1.00) |
0.684 (1.00) |
1 (1.00) |
0.181 (1.00) |
0.385 (1.00) |
0.953 (1.00) |
0.058 (1.00) |
0.931 (1.00) |
|
| SELPLG | 7 (1%) | 765 |
0.662 (1.00) |
0.266 (1.00) |
1 (1.00) |
0.382 (1.00) |
0.198 (1.00) |
0.448 (1.00) |
0.000817 (0.573) |
0.761 (1.00) |
|
| SLC30A10 | 5 (1%) | 767 |
0.449 (1.00) |
0.281 (1.00) |
1 (1.00) |
0.335 (1.00) |
1 (1.00) |
0.229 (1.00) |
0.421 (1.00) |
0.959 (1.00) |
|
| RGS7 | 8 (1%) | 764 |
0.365 (1.00) |
1 (1.00) |
1 (1.00) |
0.215 (1.00) |
1 (1.00) |
0.839 (1.00) |
0.594 (1.00) |
0.837 (1.00) |
P value = 7.27e-06 (Chi-square test), Q value = 0.0052
Table S1. Gene #2: 'PIK3R1 MUTATION STATUS' versus Clinical Feature #6: 'LYMPH.NODE.METASTASIS'
| nPatients | N0 | N0 (I+) | N0 (I-) | N0 (MOL+) | N1 | N1A | N1B | N1C | N1MI | N2 | N2A | N3 | N3A | N3B | NX |
|---|---|---|---|---|---|---|---|---|---|---|---|---|---|---|---|
| ALL | 207 | 10 | 72 | 1 | 77 | 100 | 24 | 2 | 16 | 42 | 44 | 10 | 23 | 2 | 8 |
| PIK3R1 MUTATED | 5 | 0 | 1 | 1 | 3 | 1 | 0 | 0 | 1 | 1 | 1 | 0 | 0 | 0 | 0 |
| PIK3R1 WILD-TYPE | 202 | 10 | 71 | 0 | 74 | 99 | 24 | 2 | 15 | 41 | 43 | 10 | 23 | 2 | 8 |
Figure S1. Get High-res Image Gene #2: 'PIK3R1 MUTATION STATUS' versus Clinical Feature #6: 'LYMPH.NODE.METASTASIS'

P value = 2.31e-06 (Chi-square test), Q value = 0.0016
Table S2. Gene #5: 'DCP1B MUTATION STATUS' versus Clinical Feature #9: 'NEOPLASM.DISEASESTAGE'
| nPatients | STAGE I | STAGE IA | STAGE IB | STAGE II | STAGE IIA | STAGE IIB | STAGE IIIA | STAGE IIIB | STAGE IIIC | STAGE IV | STAGE X |
|---|---|---|---|---|---|---|---|---|---|---|---|
| ALL | 60 | 41 | 2 | 3 | 223 | 140 | 100 | 20 | 28 | 9 | 11 |
| DCP1B MUTATED | 1 | 0 | 0 | 1 | 0 | 2 | 1 | 0 | 0 | 0 | 0 |
| DCP1B WILD-TYPE | 59 | 41 | 2 | 2 | 223 | 138 | 99 | 20 | 28 | 9 | 11 |
Figure S2. Get High-res Image Gene #5: 'DCP1B MUTATION STATUS' versus Clinical Feature #9: 'NEOPLASM.DISEASESTAGE'
P value = 0.000213 (t-test), Q value = 0.15
Table S3. Gene #6: 'GATA3 MUTATION STATUS' versus Clinical Feature #2: 'AGE'
| nPatients | Mean (Std.Dev) | |
|---|---|---|
| ALL | 772 | 58.0 (13.1) |
| GATA3 MUTATED | 81 | 52.8 (13.0) |
| GATA3 WILD-TYPE | 691 | 58.6 (13.0) |
Figure S3. Get High-res Image Gene #6: 'GATA3 MUTATION STATUS' versus Clinical Feature #2: 'AGE'

P value = 1.16e-05 (t-test), Q value = 0.0082
Table S4. Gene #16: 'ZNF384 MUTATION STATUS' versus Clinical Feature #7: 'NUMBER.OF.LYMPH.NODES'
| nPatients | Mean (Std.Dev) | |
|---|---|---|
| ALL | 635 | 2.1 (4.0) |
| ZNF384 MUTATED | 14 | 0.6 (0.9) |
| ZNF384 WILD-TYPE | 621 | 2.2 (4.1) |
Figure S4. Get High-res Image Gene #16: 'ZNF384 MUTATION STATUS' versus Clinical Feature #7: 'NUMBER.OF.LYMPH.NODES'

P value = 7.24e-07 (t-test), Q value = 0.00052
Table S5. Gene #23: 'MAP3K1 MUTATION STATUS' versus Clinical Feature #7: 'NUMBER.OF.LYMPH.NODES'
| nPatients | Mean (Std.Dev) | |
|---|---|---|
| ALL | 635 | 2.1 (4.0) |
| MAP3K1 MUTATED | 45 | 0.9 (1.3) |
| MAP3K1 WILD-TYPE | 590 | 2.2 (4.1) |
Figure S5. Get High-res Image Gene #23: 'MAP3K1 MUTATION STATUS' versus Clinical Feature #7: 'NUMBER.OF.LYMPH.NODES'

P value = 5.1e-05 (logrank test), Q value = 0.036
Table S6. Gene #28: 'CCDC144NL MUTATION STATUS' versus Clinical Feature #1: 'Time to Death'
| nPatients | nDeath | Duration Range (Median), Month | |
|---|---|---|---|
| ALL | 715 | 91 | 0.0 - 223.4 (18.4) |
| CCDC144NL MUTATED | 6 | 1 | 1.6 - 15.0 (7.5) |
| CCDC144NL WILD-TYPE | 709 | 90 | 0.0 - 223.4 (18.9) |
Figure S6. Get High-res Image Gene #28: 'CCDC144NL MUTATION STATUS' versus Clinical Feature #1: 'Time to Death'
P value = 0.000132 (Fisher's exact test), Q value = 0.093
Table S7. Gene #29: 'MUC12 MUTATION STATUS' versus Clinical Feature #5: 'DISTANT.METASTASIS'
| nPatients | CM0 (I+) | M0 | M1 | MX |
|---|---|---|---|---|
| ALL | 2 | 579 | 9 | 48 |
| MUC12 MUTATED | 0 | 26 | 1 | 11 |
| MUC12 WILD-TYPE | 2 | 553 | 8 | 37 |
Figure S7. Get High-res Image Gene #29: 'MUC12 MUTATION STATUS' versus Clinical Feature #5: 'DISTANT.METASTASIS'
P value = 1.18e-08 (Chi-square test), Q value = 8.4e-06
Table S8. Gene #40: 'CTU2 MUTATION STATUS' versus Clinical Feature #9: 'NEOPLASM.DISEASESTAGE'
| nPatients | STAGE I | STAGE IA | STAGE IB | STAGE II | STAGE IIA | STAGE IIB | STAGE IIIA | STAGE IIIB | STAGE IIIC | STAGE IV | STAGE X |
|---|---|---|---|---|---|---|---|---|---|---|---|
| ALL | 60 | 41 | 2 | 3 | 223 | 140 | 100 | 20 | 28 | 9 | 11 |
| CTU2 MUTATED | 0 | 2 | 0 | 1 | 1 | 0 | 0 | 1 | 0 | 0 | 0 |
| CTU2 WILD-TYPE | 60 | 39 | 2 | 2 | 222 | 140 | 100 | 19 | 28 | 9 | 11 |
Figure S8. Get High-res Image Gene #40: 'CTU2 MUTATION STATUS' versus Clinical Feature #9: 'NEOPLASM.DISEASESTAGE'

P value = 7.57e-06 (Chi-square test), Q value = 0.0054
Table S9. Gene #43: 'AQP7 MUTATION STATUS' versus Clinical Feature #6: 'LYMPH.NODE.METASTASIS'
| nPatients | N0 | N0 (I+) | N0 (I-) | N0 (MOL+) | N1 | N1A | N1B | N1C | N1MI | N2 | N2A | N3 | N3A | N3B | NX |
|---|---|---|---|---|---|---|---|---|---|---|---|---|---|---|---|
| ALL | 207 | 10 | 72 | 1 | 77 | 100 | 24 | 2 | 16 | 42 | 44 | 10 | 23 | 2 | 8 |
| AQP7 MUTATED | 1 | 0 | 0 | 0 | 2 | 1 | 0 | 0 | 0 | 1 | 1 | 0 | 0 | 1 | 0 |
| AQP7 WILD-TYPE | 206 | 10 | 72 | 1 | 75 | 99 | 24 | 2 | 16 | 41 | 43 | 10 | 23 | 1 | 8 |
Figure S9. Get High-res Image Gene #43: 'AQP7 MUTATION STATUS' versus Clinical Feature #6: 'LYMPH.NODE.METASTASIS'
P value = 5.57e-05 (t-test), Q value = 0.039
Table S10. Gene #51: 'CASP8 MUTATION STATUS' versus Clinical Feature #7: 'NUMBER.OF.LYMPH.NODES'
| nPatients | Mean (Std.Dev) | |
|---|---|---|
| ALL | 635 | 2.1 (4.0) |
| CASP8 MUTATED | 8 | 0.4 (0.7) |
| CASP8 WILD-TYPE | 627 | 2.2 (4.0) |
Figure S10. Get High-res Image Gene #51: 'CASP8 MUTATION STATUS' versus Clinical Feature #7: 'NUMBER.OF.LYMPH.NODES'
P value = 1.45e-19 (Chi-square test), Q value = 1e-16
Table S11. Gene #56: 'ZNF69 MUTATION STATUS' versus Clinical Feature #9: 'NEOPLASM.DISEASESTAGE'
| nPatients | STAGE I | STAGE IA | STAGE IB | STAGE II | STAGE IIA | STAGE IIB | STAGE IIIA | STAGE IIIB | STAGE IIIC | STAGE IV | STAGE X |
|---|---|---|---|---|---|---|---|---|---|---|---|
| ALL | 60 | 41 | 2 | 3 | 223 | 140 | 100 | 20 | 28 | 9 | 11 |
| ZNF69 MUTATED | 0 | 0 | 1 | 0 | 0 | 1 | 0 | 0 | 1 | 0 | 0 |
| ZNF69 WILD-TYPE | 60 | 41 | 1 | 3 | 223 | 139 | 100 | 20 | 27 | 9 | 11 |
Figure S11. Get High-res Image Gene #56: 'ZNF69 MUTATION STATUS' versus Clinical Feature #9: 'NEOPLASM.DISEASESTAGE'
P value = 3.34e-08 (Chi-square test), Q value = 2.4e-05
Table S12. Gene #58: 'HLA-DRB1 MUTATION STATUS' versus Clinical Feature #6: 'LYMPH.NODE.METASTASIS'
| nPatients | N0 | N0 (I+) | N0 (I-) | N0 (MOL+) | N1 | N1A | N1B | N1C | N1MI | N2 | N2A | N3 | N3A | N3B | NX |
|---|---|---|---|---|---|---|---|---|---|---|---|---|---|---|---|
| ALL | 207 | 10 | 72 | 1 | 77 | 100 | 24 | 2 | 16 | 42 | 44 | 10 | 23 | 2 | 8 |
| HLA-DRB1 MUTATED | 1 | 0 | 0 | 0 | 0 | 3 | 2 | 0 | 0 | 0 | 0 | 0 | 0 | 1 | 0 |
| HLA-DRB1 WILD-TYPE | 206 | 10 | 72 | 1 | 77 | 97 | 22 | 2 | 16 | 42 | 44 | 10 | 23 | 1 | 8 |
Figure S12. Get High-res Image Gene #58: 'HLA-DRB1 MUTATION STATUS' versus Clinical Feature #6: 'LYMPH.NODE.METASTASIS'

P value = 1.99e-05 (t-test), Q value = 0.014
Table S13. Gene #61: 'AFF2 MUTATION STATUS' versus Clinical Feature #7: 'NUMBER.OF.LYMPH.NODES'
| nPatients | Mean (Std.Dev) | |
|---|---|---|
| ALL | 635 | 2.1 (4.0) |
| AFF2 MUTATED | 11 | 0.5 (0.8) |
| AFF2 WILD-TYPE | 624 | 2.2 (4.0) |
Figure S13. Get High-res Image Gene #61: 'AFF2 MUTATION STATUS' versus Clinical Feature #7: 'NUMBER.OF.LYMPH.NODES'
P value = 1.94e-17 (Chi-square test), Q value = 1.4e-14
Table S14. Gene #74: 'KRT38 MUTATION STATUS' versus Clinical Feature #6: 'LYMPH.NODE.METASTASIS'
| nPatients | N0 | N0 (I+) | N0 (I-) | N0 (MOL+) | N1 | N1A | N1B | N1C | N1MI | N2 | N2A | N3 | N3A | N3B | NX |
|---|---|---|---|---|---|---|---|---|---|---|---|---|---|---|---|
| ALL | 207 | 10 | 72 | 1 | 77 | 100 | 24 | 2 | 16 | 42 | 44 | 10 | 23 | 2 | 8 |
| KRT38 MUTATED | 0 | 0 | 0 | 0 | 0 | 2 | 0 | 1 | 0 | 0 | 0 | 0 | 0 | 0 | 0 |
| KRT38 WILD-TYPE | 207 | 10 | 72 | 1 | 77 | 98 | 24 | 1 | 16 | 42 | 44 | 10 | 23 | 2 | 8 |
Figure S14. Get High-res Image Gene #74: 'KRT38 MUTATION STATUS' versus Clinical Feature #6: 'LYMPH.NODE.METASTASIS'
P value = 6.12e-05 (t-test), Q value = 0.043
Table S15. Gene #81: 'KCNT2 MUTATION STATUS' versus Clinical Feature #7: 'NUMBER.OF.LYMPH.NODES'
| nPatients | Mean (Std.Dev) | |
|---|---|---|
| ALL | 635 | 2.1 (4.0) |
| KCNT2 MUTATED | 9 | 0.7 (0.7) |
| KCNT2 WILD-TYPE | 626 | 2.2 (4.0) |
Figure S15. Get High-res Image Gene #81: 'KCNT2 MUTATION STATUS' versus Clinical Feature #7: 'NUMBER.OF.LYMPH.NODES'
P value = 1.55e-36 (t-test), Q value = 1.1e-33
Table S16. Gene #88: 'VSTM2B MUTATION STATUS' versus Clinical Feature #7: 'NUMBER.OF.LYMPH.NODES'
| nPatients | Mean (Std.Dev) | |
|---|---|---|
| ALL | 635 | 2.1 (4.0) |
| VSTM2B MUTATED | 3 | 0.0 (0.0) |
| VSTM2B WILD-TYPE | 632 | 2.2 (4.0) |
Figure S16. Get High-res Image Gene #88: 'VSTM2B MUTATION STATUS' versus Clinical Feature #7: 'NUMBER.OF.LYMPH.NODES'

-
Mutation data file = BRCA-TP.mutsig.cluster.txt
-
Clinical data file = BRCA-TP.clin.merged.picked.txt
-
Number of patients = 772
-
Number of significantly mutated genes = 91
-
Number of selected clinical features = 9
-
Exclude genes that fewer than K tumors have mutations, K = 3
For survival clinical features, the Kaplan-Meier survival curves of tumors with and without gene mutations were plotted and the statistical significance P values were estimated by logrank test (Bland and Altman 2004) using the 'survdiff' function in R
For continuous numerical clinical features, two-tailed Student's t test with unequal variance (Lehmann and Romano 2005) was applied to compare the clinical values between tumors with and without gene mutations using 't.test' function in R
For binary or multi-class clinical features (nominal or ordinal), two-tailed Fisher's exact tests (Fisher 1922) were used to estimate the P values using the 'fisher.test' function in R
For multi-class clinical features (nominal or ordinal), Chi-square tests (Greenwood and Nikulin 1996) were used to estimate the P values using the 'chisq.test' function in R
For multiple hypothesis correction, Q value is the False Discovery Rate (FDR) analogue of the P value (Benjamini and Hochberg 1995), defined as the minimum FDR at which the test may be called significant. We used the 'Benjamini and Hochberg' method of 'p.adjust' function in R to convert P values into Q values.
This is an experimental feature. The full results of the analysis summarized in this report can be downloaded from the TCGA Data Coordination Center.