This pipeline computes the correlation between significantly recurrent gene mutations and molecular subtypes.
Testing the association between mutation status of 28 genes and 10 molecular subtypes across 293 patients, 10 significant findings detected with P value < 0.05 and Q value < 0.25.
-
PBRM1 mutation correlated to 'CN_CNMF', 'METHLYATION_CNMF', 'MRNASEQ_CNMF', and 'MIRSEQ_CHIERARCHICAL'.
-
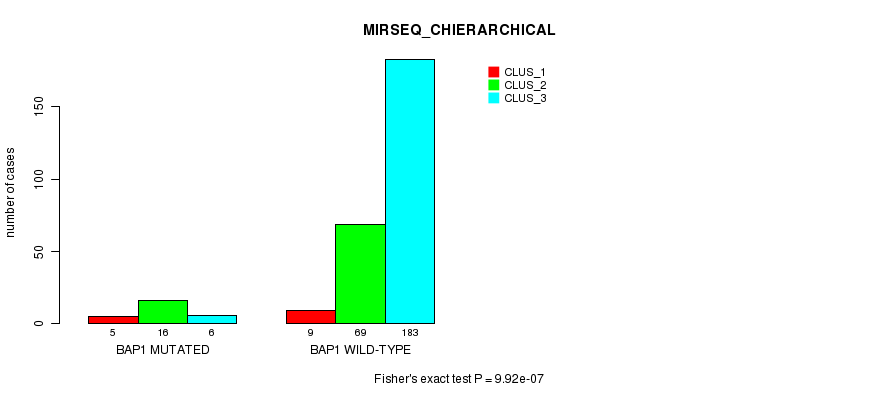
BAP1 mutation correlated to 'MRNASEQ_CHIERARCHICAL', 'MIRSEQ_CNMF', and 'MIRSEQ_CHIERARCHICAL'.
-
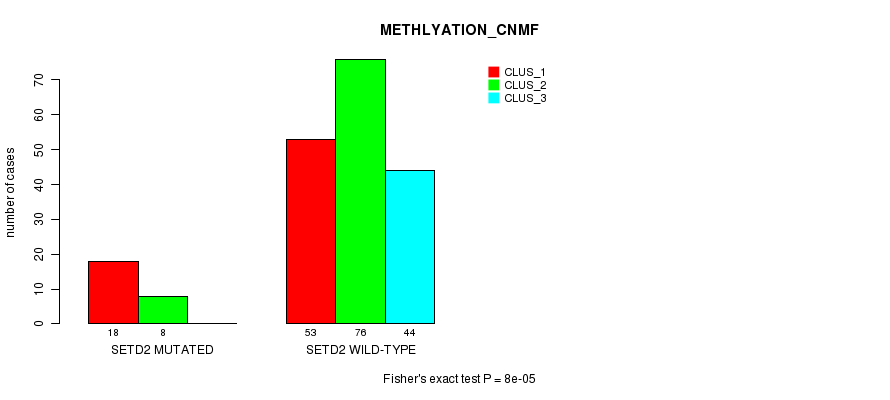
SETD2 mutation correlated to 'METHLYATION_CNMF'.
-
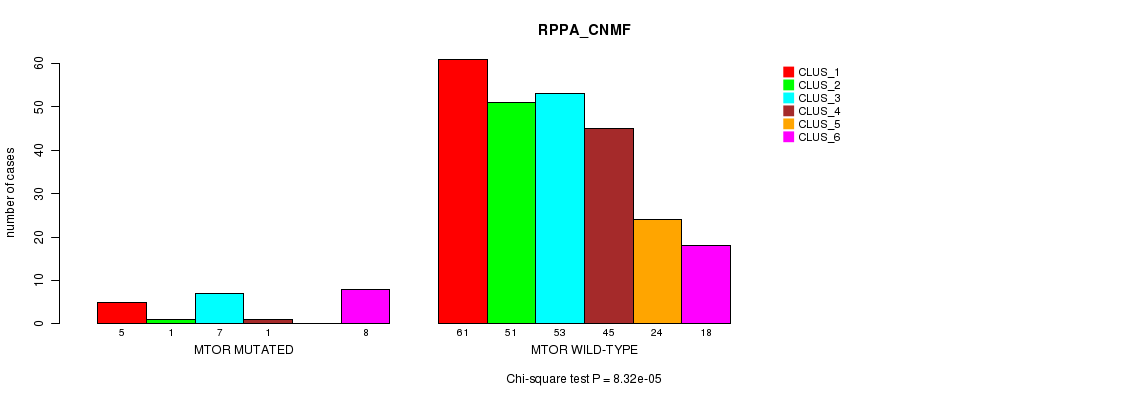
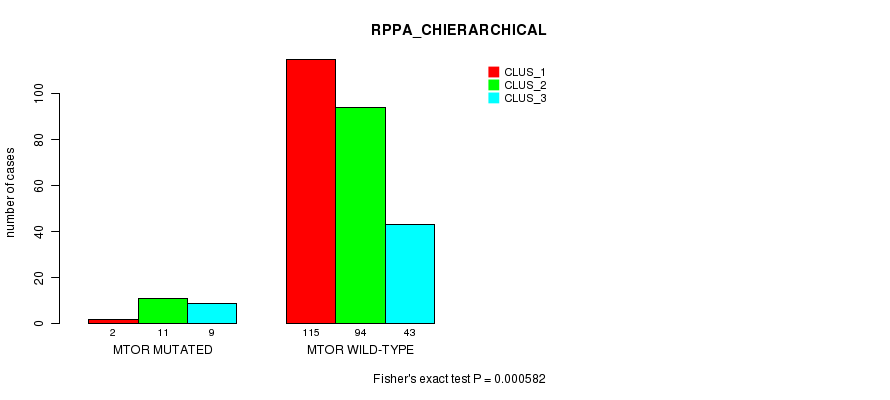
MTOR mutation correlated to 'RPPA_CNMF' and 'RPPA_CHIERARCHICAL'.
Table 1. Get Full Table Overview of the association between mutation status of 28 genes and 10 molecular subtypes. Shown in the table are P values (Q values). Thresholded by P value < 0.05 and Q value < 0.25, 10 significant findings detected.
|
Clinical Features |
MRNA CNMF |
MRNA CHIERARCHICAL |
CN CNMF |
METHLYATION CNMF |
RPPA CNMF |
RPPA CHIERARCHICAL |
MRNASEQ CNMF |
MRNASEQ CHIERARCHICAL |
MIRSEQ CNMF |
MIRSEQ CHIERARCHICAL |
||
| nMutated (%) | nWild-Type | Fisher's exact test | Fisher's exact test | Fisher's exact test | Fisher's exact test | Chi-square test | Fisher's exact test | Fisher's exact test | Fisher's exact test | Fisher's exact test | Fisher's exact test | |
| PBRM1 | 107 (37%) | 186 |
0.0211 (1.00) |
0.0735 (1.00) |
0.000201 (0.0448) |
0.000645 (0.143) |
0.00738 (1.00) |
0.799 (1.00) |
0.000649 (0.143) |
0.0822 (1.00) |
0.0456 (1.00) |
0.000141 (0.0318) |
| BAP1 | 27 (9%) | 266 |
0.0212 (1.00) |
0.0111 (1.00) |
0.0883 (1.00) |
0.00376 (0.82) |
0.0259 (1.00) |
0.774 (1.00) |
0.00145 (0.317) |
3.76e-08 (8.61e-06) |
0.000192 (0.043) |
9.92e-07 (0.000226) |
| MTOR | 24 (8%) | 269 |
0.631 (1.00) |
0.043 (1.00) |
8.32e-05 (0.0188) |
0.000582 (0.129) |
0.707 (1.00) |
0.323 (1.00) |
0.358 (1.00) |
0.544 (1.00) |
||
| SETD2 | 34 (12%) | 259 |
0.747 (1.00) |
1 (1.00) |
0.0992 (1.00) |
8e-05 (0.0182) |
0.249 (1.00) |
0.21 (1.00) |
0.338 (1.00) |
0.655 (1.00) |
0.0978 (1.00) |
0.465 (1.00) |
| VHL | 138 (47%) | 155 |
0.0307 (1.00) |
0.0514 (1.00) |
0.582 (1.00) |
0.397 (1.00) |
0.885 (1.00) |
0.307 (1.00) |
0.00744 (1.00) |
0.0654 (1.00) |
0.311 (1.00) |
0.156 (1.00) |
| SV2C | 3 (1%) | 290 |
0.169 (1.00) |
0.0102 (1.00) |
0.54 (1.00) |
0.79 (1.00) |
0.236 (1.00) |
0.0191 (1.00) |
||||
| KDM5C | 18 (6%) | 275 |
0.351 (1.00) |
0.261 (1.00) |
0.71 (1.00) |
0.0388 (1.00) |
0.105 (1.00) |
0.671 (1.00) |
0.0516 (1.00) |
0.684 (1.00) |
||
| TP53 | 6 (2%) | 287 |
0.875 (1.00) |
0.535 (1.00) |
0.506 (1.00) |
0.427 (1.00) |
0.481 (1.00) |
0.245 (1.00) |
0.868 (1.00) |
0.0787 (1.00) |
||
| PTEN | 9 (3%) | 284 |
0.163 (1.00) |
0.665 (1.00) |
1 (1.00) |
0.317 (1.00) |
0.0869 (1.00) |
0.606 (1.00) |
0.00835 (1.00) |
0.0437 (1.00) |
0.412 (1.00) |
0.661 (1.00) |
| EBPL | 6 (2%) | 287 |
0.769 (1.00) |
0.797 (1.00) |
0.477 (1.00) |
0.414 (1.00) |
0.318 (1.00) |
0.174 (1.00) |
0.2 (1.00) |
0.313 (1.00) |
||
| PIK3CA | 10 (3%) | 283 |
0.319 (1.00) |
0.205 (1.00) |
0.445 (1.00) |
1 (1.00) |
0.914 (1.00) |
0.586 (1.00) |
0.84 (1.00) |
0.404 (1.00) |
||
| TSPAN19 | 4 (1%) | 289 |
0.473 (1.00) |
0.06 (1.00) |
0.248 (1.00) |
0.391 (1.00) |
0.454 (1.00) |
0.274 (1.00) |
0.0583 (1.00) |
|||
| NBPF10 | 19 (6%) | 274 |
0.537 (1.00) |
0.602 (1.00) |
0.594 (1.00) |
0.872 (1.00) |
0.0897 (1.00) |
0.45 (1.00) |
0.35 (1.00) |
0.0484 (1.00) |
0.647 (1.00) |
0.921 (1.00) |
| TOR1A | 3 (1%) | 290 |
0.464 (1.00) |
0.828 (1.00) |
0.225 (1.00) |
0.563 (1.00) |
1 (1.00) |
0.8 (1.00) |
1 (1.00) |
|||
| MUC4 | 41 (14%) | 252 |
0.786 (1.00) |
0.892 (1.00) |
0.0839 (1.00) |
0.044 (1.00) |
0.0467 (1.00) |
0.543 (1.00) |
0.0476 (1.00) |
0.114 (1.00) |
0.0889 (1.00) |
0.0622 (1.00) |
| UQCRFS1 | 3 (1%) | 290 |
0.253 (1.00) |
0.293 (1.00) |
0.341 (1.00) |
0.322 (1.00) |
0.617 (1.00) |
|||||
| WDR52 | 9 (3%) | 284 |
0.283 (1.00) |
0.482 (1.00) |
0.576 (1.00) |
1 (1.00) |
0.448 (1.00) |
0.506 (1.00) |
0.623 (1.00) |
0.233 (1.00) |
||
| BAGE2 | 4 (1%) | 289 |
0.816 (1.00) |
0.117 (1.00) |
0.635 (1.00) |
0.0749 (1.00) |
0.171 (1.00) |
0.0914 (1.00) |
0.0473 (1.00) |
0.00644 (1.00) |
||
| CNTNAP4 | 9 (3%) | 284 |
0.758 (1.00) |
0.369 (1.00) |
0.0932 (1.00) |
0.513 (1.00) |
0.815 (1.00) |
0.625 (1.00) |
0.908 (1.00) |
1 (1.00) |
||
| CR1 | 10 (3%) | 283 |
1 (1.00) |
0.279 (1.00) |
0.178 (1.00) |
0.497 (1.00) |
0.0978 (1.00) |
0.483 (1.00) |
0.602 (1.00) |
0.574 (1.00) |
||
| STAG2 | 9 (3%) | 284 |
0.0789 (1.00) |
0.0119 (1.00) |
0.468 (1.00) |
0.412 (1.00) |
0.355 (1.00) |
0.13 (1.00) |
0.0785 (1.00) |
0.0676 (1.00) |
||
| MSN | 4 (1%) | 289 |
0.581 (1.00) |
0.444 (1.00) |
0.794 (1.00) |
0.533 (1.00) |
0.284 (1.00) |
0.17 (1.00) |
0.352 (1.00) |
0.665 (1.00) |
||
| ABCB1 | 8 (3%) | 285 |
0.333 (1.00) |
0.608 (1.00) |
0.0733 (1.00) |
0.0793 (1.00) |
0.265 (1.00) |
0.161 (1.00) |
0.268 (1.00) |
0.0892 (1.00) |
||
| ADCY8 | 5 (2%) | 288 |
0.527 (1.00) |
0.106 (1.00) |
0.953 (1.00) |
1 (1.00) |
0.848 (1.00) |
1 (1.00) |
0.621 (1.00) |
0.358 (1.00) |
||
| NPNT | 6 (2%) | 287 |
0.667 (1.00) |
0.502 (1.00) |
0.18 (1.00) |
1 (1.00) |
0.333 (1.00) |
0.382 (1.00) |
0.581 (1.00) |
0.756 (1.00) |
||
| OR5H1 | 3 (1%) | 290 |
1 (1.00) |
0.258 (1.00) |
0.0476 (1.00) |
0.768 (1.00) |
0.721 (1.00) |
0.602 (1.00) |
0.101 (1.00) |
|||
| SPAM1 | 5 (2%) | 288 |
0.386 (1.00) |
0.44 (1.00) |
0.277 (1.00) |
0.116 (1.00) |
0.11 (1.00) |
0.196 (1.00) |
0.478 (1.00) |
|||
| TPTE2 | 7 (2%) | 286 |
0.549 (1.00) |
0.63 (1.00) |
0.609 (1.00) |
0.694 (1.00) |
0.876 (1.00) |
0.873 (1.00) |
0.157 (1.00) |
0.608 (1.00) |
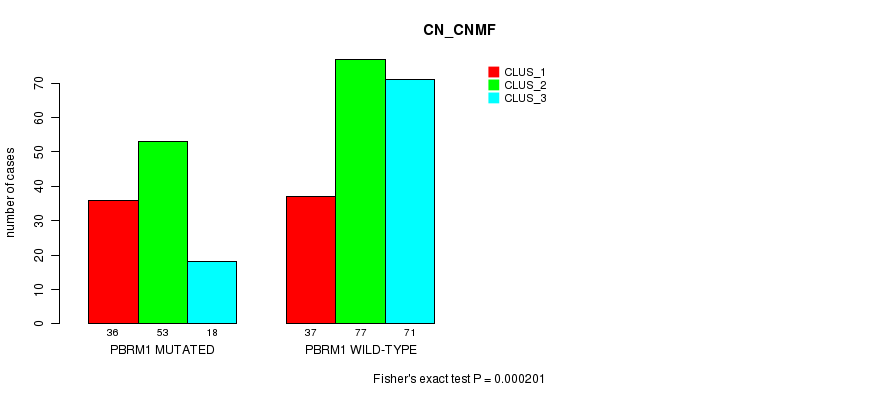
P value = 0.000201 (Fisher's exact test), Q value = 0.045
Table S1. Gene #3: 'PBRM1 MUTATION STATUS' versus Clinical Feature #3: 'CN_CNMF'
| nPatients | CLUS_1 | CLUS_2 | CLUS_3 |
|---|---|---|---|
| ALL | 73 | 130 | 89 |
| PBRM1 MUTATED | 36 | 53 | 18 |
| PBRM1 WILD-TYPE | 37 | 77 | 71 |
Figure S1. Get High-res Image Gene #3: 'PBRM1 MUTATION STATUS' versus Clinical Feature #3: 'CN_CNMF'
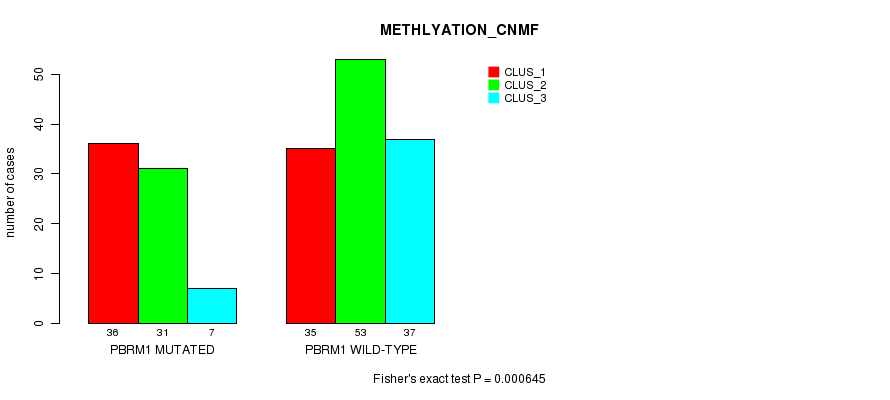
P value = 0.000645 (Fisher's exact test), Q value = 0.14
Table S2. Gene #3: 'PBRM1 MUTATION STATUS' versus Clinical Feature #4: 'METHLYATION_CNMF'
| nPatients | CLUS_1 | CLUS_2 | CLUS_3 |
|---|---|---|---|
| ALL | 71 | 84 | 44 |
| PBRM1 MUTATED | 36 | 31 | 7 |
| PBRM1 WILD-TYPE | 35 | 53 | 37 |
Figure S2. Get High-res Image Gene #3: 'PBRM1 MUTATION STATUS' versus Clinical Feature #4: 'METHLYATION_CNMF'
P value = 0.000649 (Fisher's exact test), Q value = 0.14
Table S3. Gene #3: 'PBRM1 MUTATION STATUS' versus Clinical Feature #7: 'MRNASEQ_CNMF'
| nPatients | CLUS_1 | CLUS_2 | CLUS_3 |
|---|---|---|---|
| ALL | 124 | 110 | 46 |
| PBRM1 MUTATED | 58 | 34 | 8 |
| PBRM1 WILD-TYPE | 66 | 76 | 38 |
Figure S3. Get High-res Image Gene #3: 'PBRM1 MUTATION STATUS' versus Clinical Feature #7: 'MRNASEQ_CNMF'

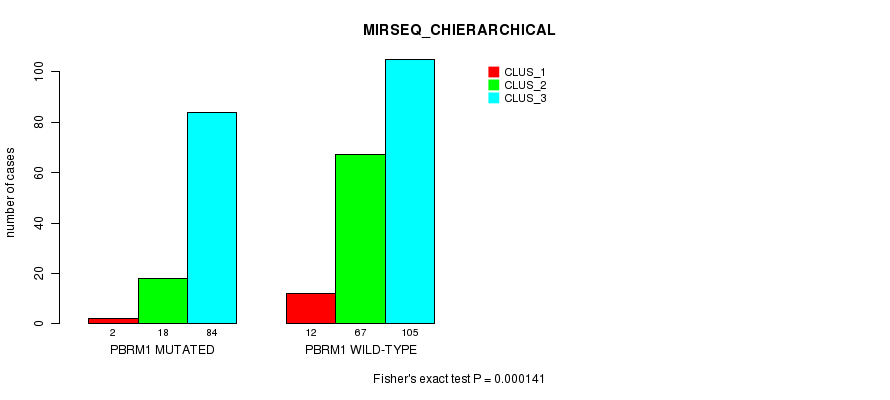
P value = 0.000141 (Fisher's exact test), Q value = 0.032
Table S4. Gene #3: 'PBRM1 MUTATION STATUS' versus Clinical Feature #10: 'MIRSEQ_CHIERARCHICAL'
| nPatients | CLUS_1 | CLUS_2 | CLUS_3 |
|---|---|---|---|
| ALL | 14 | 85 | 189 |
| PBRM1 MUTATED | 2 | 18 | 84 |
| PBRM1 WILD-TYPE | 12 | 67 | 105 |
Figure S4. Get High-res Image Gene #3: 'PBRM1 MUTATION STATUS' versus Clinical Feature #10: 'MIRSEQ_CHIERARCHICAL'
P value = 3.76e-08 (Fisher's exact test), Q value = 8.6e-06
Table S5. Gene #4: 'BAP1 MUTATION STATUS' versus Clinical Feature #8: 'MRNASEQ_CHIERARCHICAL'
| nPatients | CLUS_1 | CLUS_2 | CLUS_3 |
|---|---|---|---|
| ALL | 31 | 132 | 117 |
| BAP1 MUTATED | 1 | 1 | 25 |
| BAP1 WILD-TYPE | 30 | 131 | 92 |
Figure S5. Get High-res Image Gene #4: 'BAP1 MUTATION STATUS' versus Clinical Feature #8: 'MRNASEQ_CHIERARCHICAL'

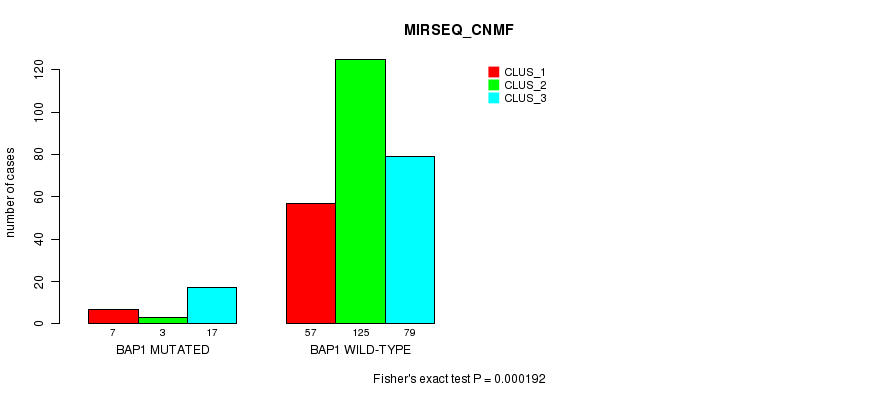
P value = 0.000192 (Fisher's exact test), Q value = 0.043
Table S6. Gene #4: 'BAP1 MUTATION STATUS' versus Clinical Feature #9: 'MIRSEQ_CNMF'
| nPatients | CLUS_1 | CLUS_2 | CLUS_3 |
|---|---|---|---|
| ALL | 64 | 128 | 96 |
| BAP1 MUTATED | 7 | 3 | 17 |
| BAP1 WILD-TYPE | 57 | 125 | 79 |
Figure S6. Get High-res Image Gene #4: 'BAP1 MUTATION STATUS' versus Clinical Feature #9: 'MIRSEQ_CNMF'
P value = 9.92e-07 (Fisher's exact test), Q value = 0.00023
Table S7. Gene #4: 'BAP1 MUTATION STATUS' versus Clinical Feature #10: 'MIRSEQ_CHIERARCHICAL'
| nPatients | CLUS_1 | CLUS_2 | CLUS_3 |
|---|---|---|---|
| ALL | 14 | 85 | 189 |
| BAP1 MUTATED | 5 | 16 | 6 |
| BAP1 WILD-TYPE | 9 | 69 | 183 |
Figure S7. Get High-res Image Gene #4: 'BAP1 MUTATION STATUS' versus Clinical Feature #10: 'MIRSEQ_CHIERARCHICAL'
P value = 8e-05 (Fisher's exact test), Q value = 0.018
Table S8. Gene #5: 'SETD2 MUTATION STATUS' versus Clinical Feature #4: 'METHLYATION_CNMF'
| nPatients | CLUS_1 | CLUS_2 | CLUS_3 |
|---|---|---|---|
| ALL | 71 | 84 | 44 |
| SETD2 MUTATED | 18 | 8 | 0 |
| SETD2 WILD-TYPE | 53 | 76 | 44 |
Figure S8. Get High-res Image Gene #5: 'SETD2 MUTATION STATUS' versus Clinical Feature #4: 'METHLYATION_CNMF'
P value = 8.32e-05 (Chi-square test), Q value = 0.019
Table S9. Gene #7: 'MTOR MUTATION STATUS' versus Clinical Feature #5: 'RPPA_CNMF'
| nPatients | CLUS_1 | CLUS_2 | CLUS_3 | CLUS_4 | CLUS_5 | CLUS_6 |
|---|---|---|---|---|---|---|
| ALL | 66 | 52 | 60 | 46 | 24 | 26 |
| MTOR MUTATED | 5 | 1 | 7 | 1 | 0 | 8 |
| MTOR WILD-TYPE | 61 | 51 | 53 | 45 | 24 | 18 |
Figure S9. Get High-res Image Gene #7: 'MTOR MUTATION STATUS' versus Clinical Feature #5: 'RPPA_CNMF'
P value = 0.000582 (Fisher's exact test), Q value = 0.13
Table S10. Gene #7: 'MTOR MUTATION STATUS' versus Clinical Feature #6: 'RPPA_CHIERARCHICAL'
| nPatients | CLUS_1 | CLUS_2 | CLUS_3 |
|---|---|---|---|
| ALL | 117 | 105 | 52 |
| MTOR MUTATED | 2 | 11 | 9 |
| MTOR WILD-TYPE | 115 | 94 | 43 |
Figure S10. Get High-res Image Gene #7: 'MTOR MUTATION STATUS' versus Clinical Feature #6: 'RPPA_CHIERARCHICAL'
-
Mutation data file = KIRC-TP.mutsig.cluster.txt
-
Molecular subtypes file = KIRC-TP.transferedmergedcluster.txt
-
Number of patients = 293
-
Number of significantly mutated genes = 28
-
Number of Molecular subtypes = 10
-
Exclude genes that fewer than K tumors have mutations, K = 3
For binary or multi-class clinical features (nominal or ordinal), two-tailed Fisher's exact tests (Fisher 1922) were used to estimate the P values using the 'fisher.test' function in R
For multi-class clinical features (nominal or ordinal), Chi-square tests (Greenwood and Nikulin 1996) were used to estimate the P values using the 'chisq.test' function in R
For multiple hypothesis correction, Q value is the False Discovery Rate (FDR) analogue of the P value (Benjamini and Hochberg 1995), defined as the minimum FDR at which the test may be called significant. We used the 'Benjamini and Hochberg' method of 'p.adjust' function in R to convert P values into Q values.
This is an experimental feature. The full results of the analysis summarized in this report can be downloaded from the TCGA Data Coordination Center.