This pipeline computes the correlation between significantly recurrent gene mutations and molecular subtypes.
Testing the association between mutation status of 21 genes and 8 molecular subtypes across 224 patients, 9 significant findings detected with P value < 0.05 and Q value < 0.25.
-
FBXW7 mutation correlated to 'CN_CNMF'.
-
BRAF mutation correlated to 'MRNA_CNMF', 'MRNA_CHIERARCHICAL', and 'CN_CNMF'.
-
KRAS mutation correlated to 'MRNA_CNMF' and 'MRNA_CHIERARCHICAL'.
-
TP53 mutation correlated to 'MRNA_CHIERARCHICAL' and 'CN_CNMF'.
-
PIK3CA mutation correlated to 'CN_CNMF'.
Table 1. Get Full Table Overview of the association between mutation status of 21 genes and 8 molecular subtypes. Shown in the table are P values (Q values). Thresholded by P value < 0.05 and Q value < 0.25, 9 significant findings detected.
|
Clinical Features |
MRNA CNMF |
MRNA CHIERARCHICAL |
CN CNMF |
METHLYATION CNMF |
RPPA CNMF |
RPPA CHIERARCHICAL |
MIRSEQ CNMF |
MIRSEQ CHIERARCHICAL |
||
| nMutated (%) | nWild-Type | Fisher's exact test | Fisher's exact test | Fisher's exact test | Fisher's exact test | Fisher's exact test | Fisher's exact test | Fisher's exact test | Fisher's exact test | |
| BRAF | 22 (10%) | 202 |
9.13e-07 (0.000131) |
2.31e-08 (3.35e-06) |
4.17e-05 (0.00592) |
0.215 (1.00) |
0.304 (1.00) |
0.6 (1.00) |
1 (1.00) |
|
| KRAS | 96 (43%) | 128 |
7.45e-05 (0.0105) |
4.05e-05 (0.00579) |
0.485 (1.00) |
0.257 (1.00) |
0.634 (1.00) |
1 (1.00) |
0.0688 (1.00) |
0.735 (1.00) |
| TP53 | 120 (54%) | 104 |
0.00202 (0.276) |
0.000482 (0.0668) |
7.28e-11 (1.06e-08) |
0.453 (1.00) |
0.782 (1.00) |
0.0252 (1.00) |
0.134 (1.00) |
|
| FBXW7 | 38 (17%) | 186 |
0.0592 (1.00) |
0.0437 (1.00) |
0.000122 (0.0171) |
0.00881 (1.00) |
0.0362 (1.00) |
0.356 (1.00) |
0.118 (1.00) |
|
| PIK3CA | 33 (15%) | 191 |
0.205 (1.00) |
0.57 (1.00) |
0.00048 (0.0668) |
0.0876 (1.00) |
0.129 (1.00) |
0.0853 (1.00) |
1 (1.00) |
|
| APC | 160 (71%) | 64 |
0.0076 (1.00) |
0.0267 (1.00) |
0.221 (1.00) |
0.653 (1.00) |
0.452 (1.00) |
0.689 (1.00) |
0.464 (1.00) |
|
| NRAS | 20 (9%) | 204 |
0.0465 (1.00) |
0.125 (1.00) |
0.274 (1.00) |
0.247 (1.00) |
0.474 (1.00) |
1 (1.00) |
1 (1.00) |
|
| SMAD4 | 26 (12%) | 198 |
0.0308 (1.00) |
0.288 (1.00) |
0.0355 (1.00) |
0.521 (1.00) |
0.339 (1.00) |
1 (1.00) |
0.846 (1.00) |
|
| FAM123B | 25 (11%) | 199 |
0.0723 (1.00) |
0.0918 (1.00) |
0.00539 (0.728) |
0.536 (1.00) |
0.588 (1.00) |
1 (1.00) |
0.459 (1.00) |
|
| SMAD2 | 15 (7%) | 209 |
0.133 (1.00) |
0.518 (1.00) |
0.0393 (1.00) |
0.533 (1.00) |
0.133 (1.00) |
1 (1.00) |
0.711 (1.00) |
|
| TCF7L2 | 18 (8%) | 206 |
1 (1.00) |
0.413 (1.00) |
0.417 (1.00) |
0.737 (1.00) |
0.896 (1.00) |
1 (1.00) |
0.23 (1.00) |
|
| ACVR2A | 9 (4%) | 215 |
0.00717 (0.961) |
0.184 (1.00) |
0.0325 (1.00) |
0.429 (1.00) |
0.469 (1.00) |
1 (1.00) |
0.545 (1.00) |
|
| SOX9 | 10 (4%) | 214 |
0.129 (1.00) |
0.123 (1.00) |
0.00451 (0.613) |
0.204 (1.00) |
0.694 (1.00) |
1 (1.00) |
0.584 (1.00) |
|
| ELF3 | 6 (3%) | 218 |
0.363 (1.00) |
0.811 (1.00) |
0.0514 (1.00) |
0.612 (1.00) |
0.436 (1.00) |
1 (1.00) |
0.406 (1.00) |
|
| CRTC1 | 6 (3%) | 218 |
0.123 (1.00) |
0.165 (1.00) |
0.837 (1.00) |
0.209 (1.00) |
0.482 (1.00) |
1 (1.00) |
0.406 (1.00) |
|
| TNFRSF10C | 6 (3%) | 218 |
0.317 (1.00) |
0.287 (1.00) |
0.675 (1.00) |
0.853 (1.00) |
0.378 (1.00) |
1 (1.00) |
1 (1.00) |
|
| KRTAP5-5 | 4 (2%) | 220 |
0.327 (1.00) |
0.482 (1.00) |
0.48 (1.00) |
0.388 (1.00) |
1 (1.00) |
1 (1.00) |
1 (1.00) |
|
| KIAA1804 | 15 (7%) | 209 |
0.267 (1.00) |
0.397 (1.00) |
0.0659 (1.00) |
0.758 (1.00) |
0.474 (1.00) |
1 (1.00) |
0.736 (1.00) |
|
| ACOT4 | 3 (1%) | 221 |
0.255 (1.00) |
0.49 (1.00) |
0.829 (1.00) |
1 (1.00) |
1 (1.00) |
|||
| PTEN | 7 (3%) | 217 |
0.0276 (1.00) |
0.337 (1.00) |
0.0429 (1.00) |
0.612 (1.00) |
0.436 (1.00) |
0.244 (1.00) |
0.0575 (1.00) |
|
| MYO1B | 13 (6%) | 211 |
0.00862 (1.00) |
0.00879 (1.00) |
0.00752 (1.00) |
0.013 (1.00) |
0.469 (1.00) |
1 (1.00) |
0.653 (1.00) |
P value = 0.000122 (Fisher's exact test), Q value = 0.017
Table S1. Gene #2: 'FBXW7 MUTATION STATUS' versus Clinical Feature #3: 'CN_CNMF'
| nPatients | CLUS_1 | CLUS_2 | CLUS_3 | CLUS_4 |
|---|---|---|---|---|
| ALL | 86 | 83 | 36 | 16 |
| FBXW7 MUTATED | 4 | 24 | 8 | 2 |
| FBXW7 WILD-TYPE | 82 | 59 | 28 | 14 |
Figure S1. Get High-res Image Gene #2: 'FBXW7 MUTATION STATUS' versus Clinical Feature #3: 'CN_CNMF'
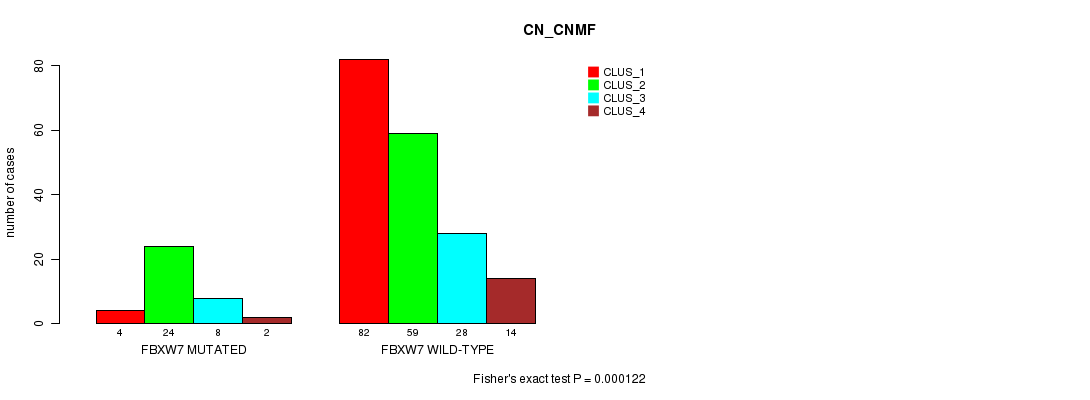
P value = 9.13e-07 (Fisher's exact test), Q value = 0.00013
Table S2. Gene #4: 'BRAF MUTATION STATUS' versus Clinical Feature #1: 'MRNA_CNMF'
| nPatients | CLUS_1 | CLUS_2 | CLUS_3 | CLUS_4 |
|---|---|---|---|---|
| ALL | 42 | 57 | 67 | 39 |
| BRAF MUTATED | 13 | 1 | 1 | 5 |
| BRAF WILD-TYPE | 29 | 56 | 66 | 34 |
Figure S2. Get High-res Image Gene #4: 'BRAF MUTATION STATUS' versus Clinical Feature #1: 'MRNA_CNMF'
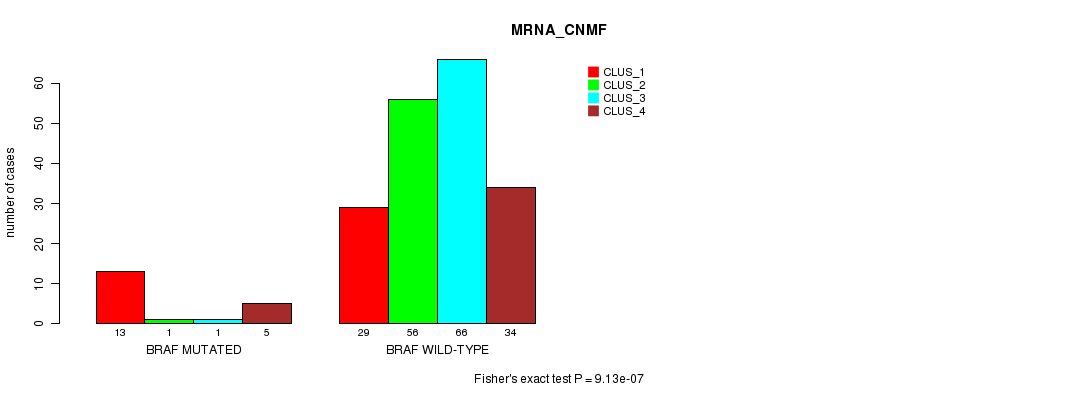
P value = 2.31e-08 (Fisher's exact test), Q value = 3.3e-06
Table S3. Gene #4: 'BRAF MUTATION STATUS' versus Clinical Feature #2: 'MRNA_CHIERARCHICAL'
| nPatients | CLUS_1 | CLUS_2 | CLUS_3 | CLUS_4 |
|---|---|---|---|---|
| ALL | 40 | 48 | 61 | 56 |
| BRAF MUTATED | 1 | 0 | 18 | 1 |
| BRAF WILD-TYPE | 39 | 48 | 43 | 55 |
Figure S3. Get High-res Image Gene #4: 'BRAF MUTATION STATUS' versus Clinical Feature #2: 'MRNA_CHIERARCHICAL'
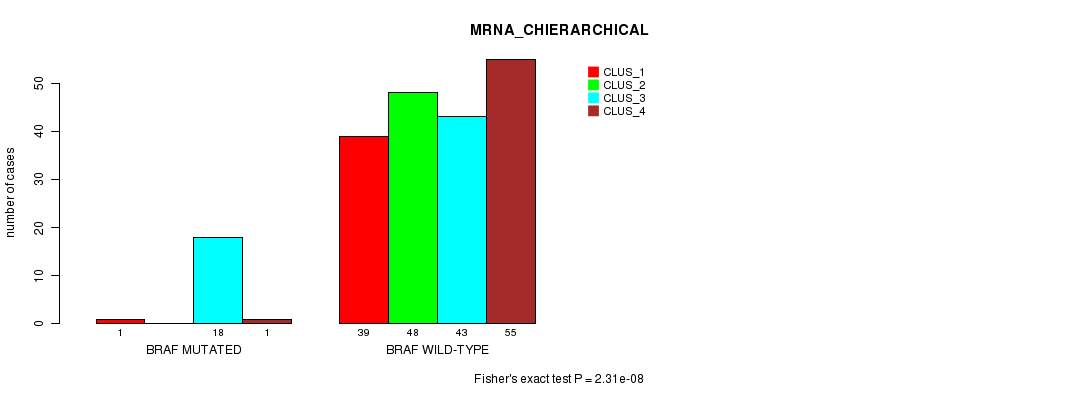
P value = 4.17e-05 (Fisher's exact test), Q value = 0.0059
Table S4. Gene #4: 'BRAF MUTATION STATUS' versus Clinical Feature #3: 'CN_CNMF'
| nPatients | CLUS_1 | CLUS_2 | CLUS_3 | CLUS_4 |
|---|---|---|---|---|
| ALL | 86 | 83 | 36 | 16 |
| BRAF MUTATED | 1 | 18 | 3 | 0 |
| BRAF WILD-TYPE | 85 | 65 | 33 | 16 |
Figure S4. Get High-res Image Gene #4: 'BRAF MUTATION STATUS' versus Clinical Feature #3: 'CN_CNMF'
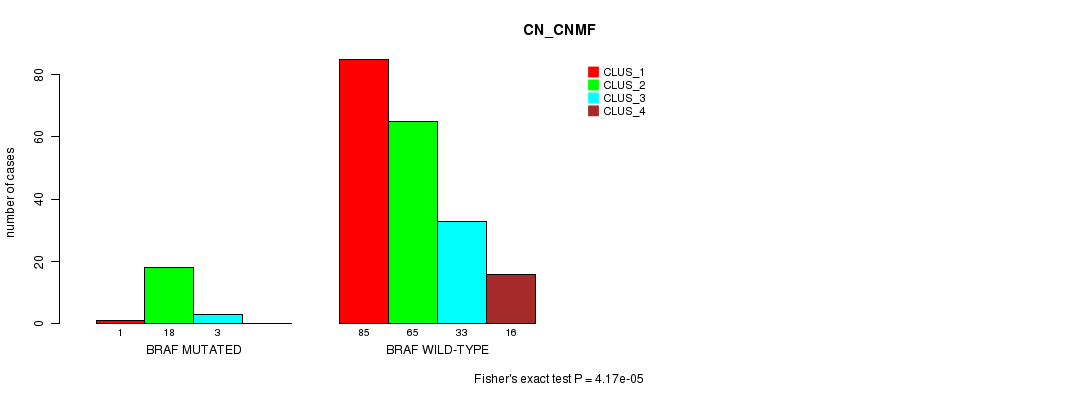
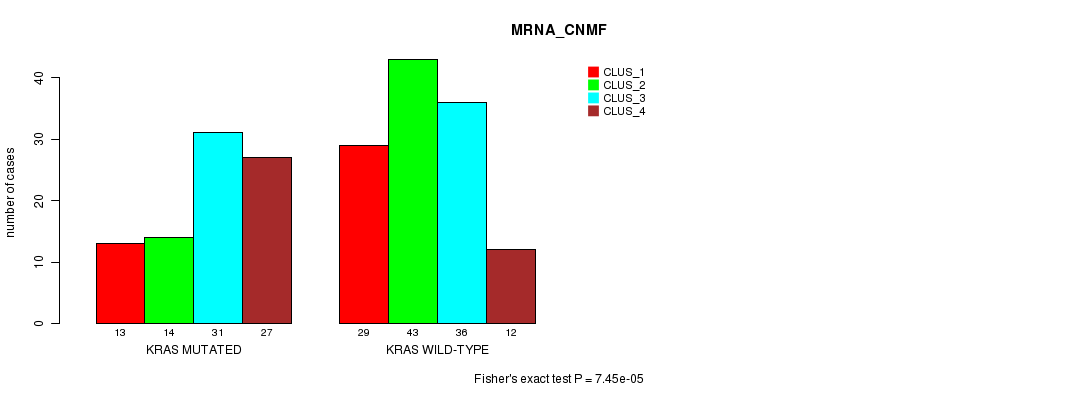
P value = 7.45e-05 (Fisher's exact test), Q value = 0.01
Table S5. Gene #5: 'KRAS MUTATION STATUS' versus Clinical Feature #1: 'MRNA_CNMF'
| nPatients | CLUS_1 | CLUS_2 | CLUS_3 | CLUS_4 |
|---|---|---|---|---|
| ALL | 42 | 57 | 67 | 39 |
| KRAS MUTATED | 13 | 14 | 31 | 27 |
| KRAS WILD-TYPE | 29 | 43 | 36 | 12 |
Figure S5. Get High-res Image Gene #5: 'KRAS MUTATION STATUS' versus Clinical Feature #1: 'MRNA_CNMF'
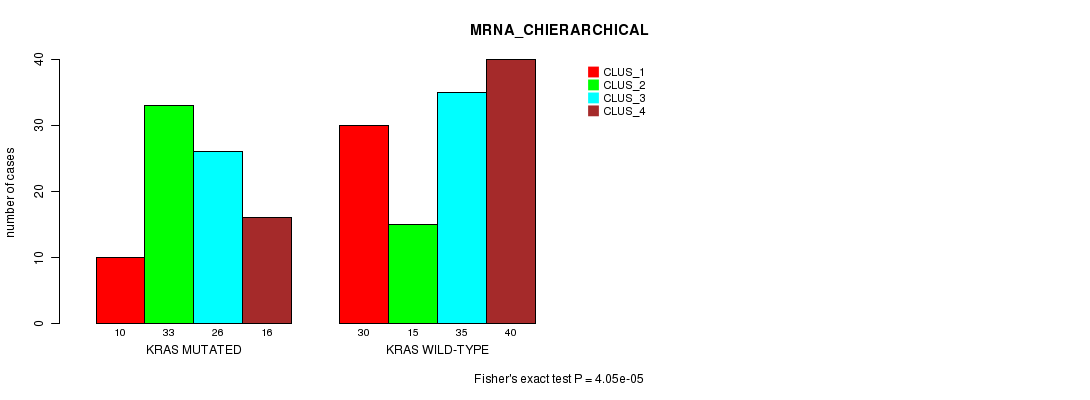
P value = 4.05e-05 (Fisher's exact test), Q value = 0.0058
Table S6. Gene #5: 'KRAS MUTATION STATUS' versus Clinical Feature #2: 'MRNA_CHIERARCHICAL'
| nPatients | CLUS_1 | CLUS_2 | CLUS_3 | CLUS_4 |
|---|---|---|---|---|
| ALL | 40 | 48 | 61 | 56 |
| KRAS MUTATED | 10 | 33 | 26 | 16 |
| KRAS WILD-TYPE | 30 | 15 | 35 | 40 |
Figure S6. Get High-res Image Gene #5: 'KRAS MUTATION STATUS' versus Clinical Feature #2: 'MRNA_CHIERARCHICAL'
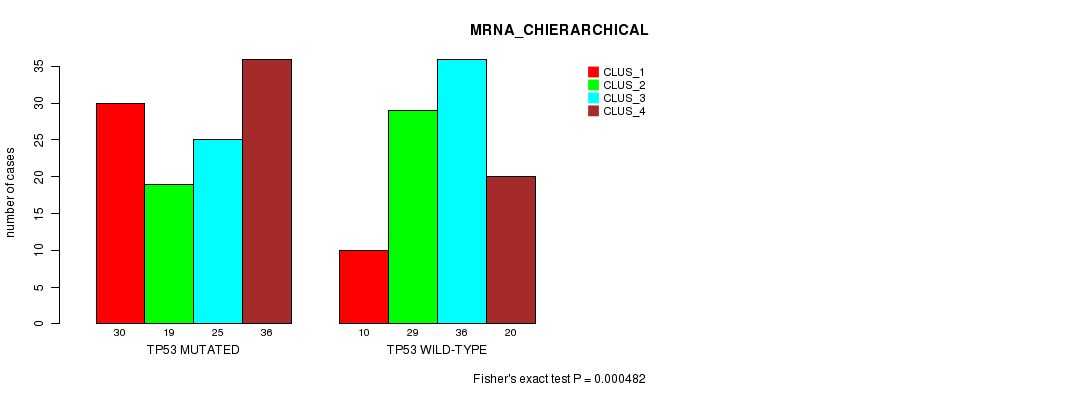
P value = 0.000482 (Fisher's exact test), Q value = 0.067
Table S7. Gene #6: 'TP53 MUTATION STATUS' versus Clinical Feature #2: 'MRNA_CHIERARCHICAL'
| nPatients | CLUS_1 | CLUS_2 | CLUS_3 | CLUS_4 |
|---|---|---|---|---|
| ALL | 40 | 48 | 61 | 56 |
| TP53 MUTATED | 30 | 19 | 25 | 36 |
| TP53 WILD-TYPE | 10 | 29 | 36 | 20 |
Figure S7. Get High-res Image Gene #6: 'TP53 MUTATION STATUS' versus Clinical Feature #2: 'MRNA_CHIERARCHICAL'
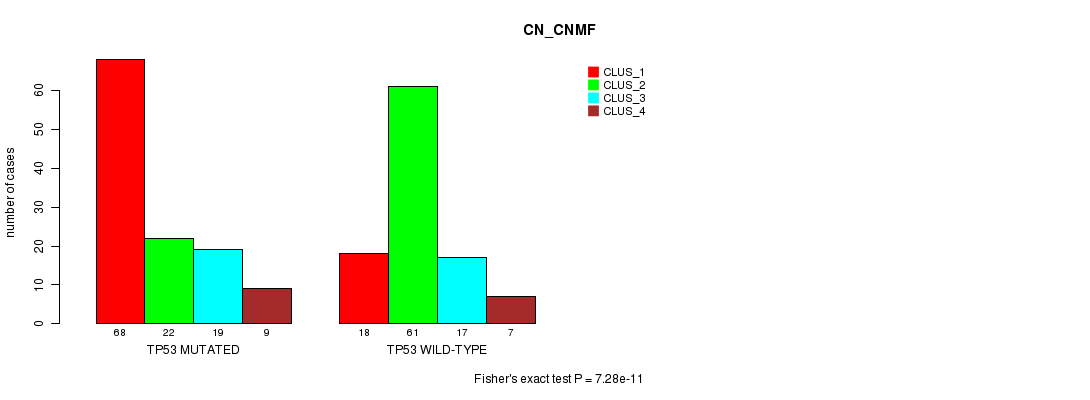
P value = 7.28e-11 (Fisher's exact test), Q value = 1.1e-08
Table S8. Gene #6: 'TP53 MUTATION STATUS' versus Clinical Feature #3: 'CN_CNMF'
| nPatients | CLUS_1 | CLUS_2 | CLUS_3 | CLUS_4 |
|---|---|---|---|---|
| ALL | 86 | 83 | 36 | 16 |
| TP53 MUTATED | 68 | 22 | 19 | 9 |
| TP53 WILD-TYPE | 18 | 61 | 17 | 7 |
Figure S8. Get High-res Image Gene #6: 'TP53 MUTATION STATUS' versus Clinical Feature #3: 'CN_CNMF'
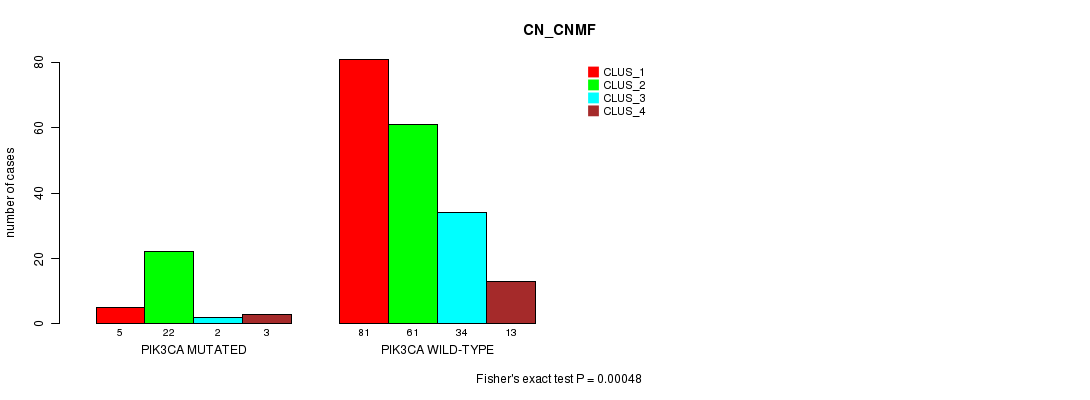
P value = 0.00048 (Fisher's exact test), Q value = 0.067
Table S9. Gene #9: 'PIK3CA MUTATION STATUS' versus Clinical Feature #3: 'CN_CNMF'
| nPatients | CLUS_1 | CLUS_2 | CLUS_3 | CLUS_4 |
|---|---|---|---|---|
| ALL | 86 | 83 | 36 | 16 |
| PIK3CA MUTATED | 5 | 22 | 2 | 3 |
| PIK3CA WILD-TYPE | 81 | 61 | 34 | 13 |
Figure S9. Get High-res Image Gene #9: 'PIK3CA MUTATION STATUS' versus Clinical Feature #3: 'CN_CNMF'
-
Mutation data file = COADREAD-TP.mutsig.cluster.txt
-
Molecular subtypes file = COADREAD-TP.transferedmergedcluster.txt
-
Number of patients = 224
-
Number of significantly mutated genes = 21
-
Number of Molecular subtypes = 8
-
Exclude genes that fewer than K tumors have mutations, K = 3
For binary or multi-class clinical features (nominal or ordinal), two-tailed Fisher's exact tests (Fisher 1922) were used to estimate the P values using the 'fisher.test' function in R
For multiple hypothesis correction, Q value is the False Discovery Rate (FDR) analogue of the P value (Benjamini and Hochberg 1995), defined as the minimum FDR at which the test may be called significant. We used the 'Benjamini and Hochberg' method of 'p.adjust' function in R to convert P values into Q values.
This is an experimental feature. The full results of the analysis summarized in this report can be downloaded from the TCGA Data Coordination Center.